Does Empirically Derived Classification of Individuals with Subjective Cognitive Complaints Predict Dementia?

 , , , and
Abstract
:1. Introduction
2. Materials and Methods
2.1. Participants
2.2. Measures
2.3. Statistical Analysis
3. Results
3.1. Groups Derived by Cluster Analysis
3.2. Cluster Groups and Prediction of Progression to Probable Dementia
4. Discussion
5. Conclusions
Supplementary Materials
Author Contributions
Funding
Conflicts of Interest
References
- Petersen, R.C.; Lopez, O.; Armstrong, M.J.; Getchius, T.S.; Ganguli, M.; Gloss, D.; Gronseth, G.S.; Marson, D.; Pringsheim, T.; Day, G.S.; et al. Practice guideline update summary: Mild cognitive impairment: Report of the Guideline Development, Dissemination, and Implementation Subcommittee of the American Academy of Neurology. Neurology 2018, 90, 126–135. [Google Scholar] [CrossRef] [PubMed]
- Jack, C.R.; Bennett, D.A.; Blennow, K.; Carrillo, M.C.; Dunn, B.; Haeberlein, S.B.; Holtzman, D.M.; Jagust, W.; Jessen, F.; Karlawish, J.; et al. NIA-AA Research Framework: Toward a biological definition of Alzheimer’s disease. Alzheimer’s Dement. 2018, 14, 535–562. [Google Scholar] [CrossRef] [PubMed]
- Albert, M.S.; DeKosky, S.T.; Dickson, D.; Dubois, B.; Feldman, H.H.; Fox, N.C.; Gamst, A.; Holtzman, D.M.; Jagust, W.J.; Petersen, R.C.; et al. The diagnosis of mild cognitive impairment due to Alzheimer’s disease: Recommendations from the National Institute on Aging-Alzheimer’s Association workgroups on diagnostic guidelines for Alzheimer’s disease. Alzheimer’s Dement. 2011, 7, 270–279. [Google Scholar] [CrossRef] [PubMed]
- Petersen, R.C. Mild cognitive impairment as a diagnostic entity. J. Intern. Med. 2004, 256, 183–194. [Google Scholar] [CrossRef]
- Winblad, B.; Palmer, K.; Kivipelto, M.; Jelic, V.; Fratiglioni, L.; Wahlund, L.O.; Nordberg, A.; Bäckman, L.; Albert, M.; Almkvist, O.; et al. Mild cognitive impairment—Beyond controversies, towards a consensus: Report of the International Working Group on Mild Cognitive Impairment. J. Intern. Med. 2004, 256, 240–246. [Google Scholar] [CrossRef]
- Campos-Magdaleno, M.; Facal, D.; Juncos-Rabadán, O.; Braña, T.; Pereiro, A.X. Cluster subtypes of the Spanish version of the California Verbal Learning Test in a sample of adults with subjective memory complaints. J. Clin. Exp. Neuropsychol. 2014, 36, 317–333. [Google Scholar] [CrossRef]
- Campos-Magdaleno, M.; Facal, D.; Juncos-Rabadán, O.; Picón, E.; Pereiro, A.X. Comparison between an empirically derived and a standard classification of amnestic Mild Cognitive Impairment from a sample of adults with subjective cognitive complaints. J. Aging Health. 2016, 28, 1105–1115. [Google Scholar] [CrossRef]
- Clark, L.R.; Delano-Wood, L.; Libon, D.J.; McDonald, C.R.; Nation, D.A.; Bangen, K.J.; Jak, A.J.; Au, R.; Salmon, D.P.; Bondi, M.W. Are empirically-derived subtypes of mild cognitive impairment consistent with conventional subtypes? J. Int. Neuropsychol. Soc. 2013, 19, 635–645. [Google Scholar] [CrossRef]
- Damian, M.; Hausner, L.; Jekel, K.; Richter, M.; Froelich, L.; Almkvist, O.; Boada, M.; Bullock, R.; De Deyn, P.P.; Frisoni, G.B.; et al. Single-domain amnestic mild cognitive impairment identified by cluster analysis predicts Alzheimer’s disease in the European prospective DESCRIPA study. Dement. Geriatr. Cogn. Dis. 2013, 36, 1–9. [Google Scholar] [CrossRef]
- Edmonds, E.C.; Delano-Wood, L.; Clark, L.R.; Jak, A.J.; Nation, D.A.; McDonald, C.R.; Libon, D.J.; Au, R.; Galasko, D.; Salmon, D.P.; et al. Susceptibility of the conventional criteria for mild cognitive impairment to false-positive diagnostic errors. Alzheimer’s Dement. 2015, 11, 415–424. [Google Scholar] [CrossRef]
- Halfelt, J.J.; Wuu, J.; Sollinger, A.B. An exploration of subgroups of mild cognitive impairment based on cognitive, neuropsychiatric and functional features: Analyses of data from the National Alzheimer’s Coordinating Center. Am. J. Geriatr. Psychiatr. 2011, 19, 940–950. [Google Scholar] [CrossRef] [PubMed]
- Hanfelt, J.J.; Peng, L.; Goldstein, F.C.; Lah, J.J. Latent classes of mild cognitive impairment are associated with clinical outcomes and neuropathology: Analysis of data from the National Alzheimer’s Coordinating Center. Neurobiol. Dis. 2018, 117, 62–71. [Google Scholar] [CrossRef] [PubMed]
- Libon, D.J.; Xie, S.X.; Eppig, J.; Wicas, G.; Lamar, M.; Lippa, C.; Bettcher, B.M.; Price, C.C.; Giovannetti, T.; Swenson, R.; et al. The heterogeneity of mild cognitive impairment: A neuropsychological analysis. J. Int. Neuropsychol. Soc. 2010, 16, 84–93. [Google Scholar] [CrossRef] [PubMed]
- Facal, D.; Guàrdia-Olmos, J.; Juncos-Rabadán, O. Diagnostic transitions in mild cognitive impairment by use of simple Markov models. Int. J. Geriatr. Psychiatry. 2015, 30, 669–676. [Google Scholar] [CrossRef] [PubMed]
- Michaud, T.L.; Su, D.; Siahpush, M.; Murman, D.L. The risk of incident mild cognitive impairment and progression to dementia considering mild cognitive impairment subtypes. Dement. Geriatr. Cogn. Dis. Extra 2017, 7, 15–29. [Google Scholar] [CrossRef] [PubMed]
- Juncos-Rabadán, O.; Pereiro, A.X.; Facal, D.; Rodriguez, N.; Lojo, C.; Caamaño, J.A.; Sueiro, J.; Boveda, J.; Eiroa, P. Prevalence and correlates of cognitive impairment in adults with subjective memory complaints in primary care centres. Dement. Geriatr. Cogn. Disord. 2012, 33, 226–232. [Google Scholar] [CrossRef]
- Charlson, M.E.; Pompei, P.; Ales, K.L.; MacKenzie, R. A new method of classifying prognostic in longitudinal studies: Development and validation. J. Chronic Dis. 1987, 40, 373–383. [Google Scholar] [CrossRef]
- Lawton, M.P.; Brody, E.M. Assessment of older people: Self-maintaining and instrumental activities of daily living. Gerontologist 1969, 3, 179–186. [Google Scholar] [CrossRef]
- Benedet, M.J.; Seisdedos, N. Evaluación Clínica de las Quejas de Memoria en la Vida Cotidiana; TEA Ediciones: Madrid, Spain, 1996. [Google Scholar]
- Folstein, M.F.; Folstein, S.E.; McHugh, P.R. Mini-mental state. A practical method for grading the cognitive state of patients for the clinician. J. Psychiatr. Res. 1975, 12, 189–198. [Google Scholar] [CrossRef]
- Lobo, A.; Saza, P.; Marcos, G.; Díaz, J.L.; de la Cámara, C.; Ventura, T.; Morales Asín, F.; Pascual, L.F.; Montañés, J.A.; Aznar, S.; et al. Revalidación y normalización del mini-examen cognoscitivo (primera versión en castellano del mini-mental status examination) en la población general geriátrica. Med. Clin. 1999, 112, 767–774. [Google Scholar]
- López-Pousa, S. Camdex-R: Prueba de Exploración Cambridge Revisada para la Valoración de los Trastornos Mentales en la Vejez. Adaptación Española; TEA Ediciones: Madrid, Spain, 2003. [Google Scholar]
- Roth, M.; Huppert, F.A.; Mountjoy, C.Q.; Tym, E. The Cambridge Examination for Mental Disorder of the Elderly—Revised. Br. J. Psychiatry 1988, 149, 698–709. [Google Scholar] [CrossRef] [PubMed]
- Pereiro, A.X.; Ramos-Lema, S.; Juncos-Rabadán, O.; Facal, D.; Lojo-Seoane, C. Normative scores of the Cambridge Cognitive Examination-Revised in healthy Spanish population. Psicothema 2015, 27, 32–39. [Google Scholar] [PubMed]
- Gallagher, D.; Mhaolain, A.N.; Coen, R.; Walsh, C.; Kilroy, D.; Belinski, K.; Bruce, I.; Coakley, D.; Walsh, J.B.; Cunningham, C.; et al. Detecting prodromal Alzheimer’s disease in mild cognitive impairment: Utility of the CAMCOG and other neuropsychological predictors. Int. J. Geriatr. Psychiatry 2010, 25, 1280–1287. [Google Scholar] [CrossRef] [PubMed]
- Dunn, L.M.; Dunn, L.M. Peabody Picture Vocabulary Test-Revised; American Guidance Service: Circle Pines, MN, USA, 1981. [Google Scholar]
- Pereda, S. Test de Vocabulario en Imágenes, Peabody; MEPSA: Madrid, Spain, 1989. [Google Scholar]
- Delis, D.C.; Kramer, J.H.; Kaplan, E.; Ober, B. California Verbal Learning Test; Psychological Corporation: San Antonio, TX, USA, 1987. [Google Scholar]
- Benedet, M.J.; Alejandre, M.A. Test de Aprendizaje Verbal España-Complutense (TAVEC); TEA: Madrid, Spain, 1998. [Google Scholar]
- CANTAB® Cognitive Assessment Software. Available online: https://www.cambridgecognition.com (accessed on 24 September 2019).
- Case, R.; Kurland, M.D.; Goldberg, J. Operational efficiency and the growth of short-term memory span. J. Exp. Child. Psychol. 1982, 33, 386–404. [Google Scholar] [CrossRef]
- Daneman, M.; Carpenter, P. Individualdifferences in working memory and reading. J. Verbal Learn. Verbal Behav. 1980, 19, 450–466. [Google Scholar] [CrossRef]
- Hair, J.F.; Black, W.C. Cluster analysis. In Reading and Understanding More Multivariate Statistics; Grimm, L.G., Yarnold, P.R., Eds.; American Psychological Association: Washington, DC, USA, 2002; pp. 147–205. [Google Scholar]
- Aretouli, E.; Brandt, J. Everyday functioning in mild cognitive impairment and its relationship with executive cognition. Int. J. Geriatr. Psychiatry 2009, 25, 224–233. [Google Scholar] [CrossRef] [Green Version]
- Gagnon, L.G.; Belleville, S. Working memory in mild cognitive impairment and Alzheimer’s disease: Contribution of forgetting and predictive value of complex span tasks. Neuropsychology 2011, 25, 226–236. [Google Scholar] [CrossRef]
- Mooi, E.; Sarstedt, M. A Concise Guide to Market Research; Springer: Berlin, Germany, 2011. [Google Scholar]
- Everitt, B.S. Cluster Analysis; John Wiley: New York, NY, USA, 1993. [Google Scholar]
- Ferligoj, A. Cluster Analysis; University of Ljubljana: Ljubljana, Slovenia, 1989. [Google Scholar]
- Milligan, G.W.; Hirtle, S.C. Clustering and classification methods. In Handbook of Psychology: Research Methods in Psychology; Schinka, J., Velicer, W., Eds.; Wiley: New York, NY, USA, 2003; Volume 2, pp. 154–196. [Google Scholar]
- Van der Kooij, A.J.; Meulman, J.J. MURALS: Multiple regression and optimal scaling using alternating least squares. In Softstat ’97: Advances in statistical software 6: The 9th Conference on the Scientific Use of Statistical Software, 3–6 March 1997, Heidelberg, Germany; Lucius & Lucius: Stuttgart-Ost, Germany, 1997; pp. 99–106. [Google Scholar]
- Haberman, S.J. The analysis of residuals in cross-classified tables. Biometrics 1973, 29, 205–220. [Google Scholar] [CrossRef]
- Toothacker, L.E. Multiple comparisons procedures. In Quantitative Applications in the Social Sciences Series #89; Sage Publications: Thousand Oaks, CA, USA, 1989. [Google Scholar]
- Molinuevo, J.L.; Rabin, L.A.; Amariglio, R.; Buckley, R.; Dubois, B.; Ellis, K.A.; Ewers, M.; Hampel, H.; Klöppel, S.; Rami, L.; et al. Implementation of subjective cognitive decline criteria in research studies. Alzheimer’s Dement. 2017, 13, 296–311. [Google Scholar] [CrossRef]
- Jessen, F.; Amariglio, R.E.; Van Boxtel, M.; Breteler, M.; Ceccaldi, M.; Chételat, G.; Dubois, B.; Dufouil, C.; Ellis, K.A.; Van Der Flier, W.M.; et al. A conceptual framework for research on subjective cognitive decline in preclinical Alzheimer’s disease. Alzheimer’s Dement. 2014, 10, 844–852. [Google Scholar] [CrossRef] [PubMed]
- Sperling, R.A.; Aisen, P.S.; Beckett, L.A.; Bennett, D.A.; Craft, S.; Fagan, A.M.; Iwatsubo, T.; Jack, C.R., Jr.; Kaye, J.; Montine, T.J.; et al. Toward defining the preclinical stages of Alzheimer’s disease: Recommendations from the National Institute on Aging-Alzheimer’s Association workgroups on diagnostic guidelines for Alzheimer’s disease. Alzheimer’s Dement. 2014, 7, 280–292. [Google Scholar] [CrossRef] [PubMed]
- Rabin, L.A.; Smart, C.M.; Crane, P.K.; Amariglio, R.E.; Berman, L.M.; Boada, M.; Buckley, R.F.; Chételat, G.; Dubois, B.; Ellis, K.A.; et al. Subjective cognitive decline in older adults: An overview of self-report measures used across 19 international research studies. J. Alzheimer’s Dis. 2015, 48, S63–S86. [Google Scholar] [CrossRef] [PubMed]
- Ismail, Z.; Smith, E.E.; Geda, Y.; Sultzer, D.; Brodaty, H.; Smith, G.; Agüera-Ortiz, L.; Sweet, R.; Miller, D.; Lyketsos, C.G.; et al. Neuropsychiatric symptoms as early manifestations of emergent dementia: Provisional diagnostic criteria for mild behavioral impairment. Alzheimer’s Dement. 2016, 12, 195–202. [Google Scholar] [CrossRef] [PubMed]
- Mallo, S.C.; Ismail, Z.; Pereiro, A.X.; Facal, D.; Lojo-Seoane, C.; Campos-Magdaleno, M.; Juncos-Rabadán, O. Assessing mild behavioral impairment with the Mild Behavioral Impairment-Checklist in people with mild cognitive impairment. J. Alzheimer’s Dis. 2018, 66, 83–95. [Google Scholar] [CrossRef] [PubMed]
- Summers, M.J.; Saunders, N.L. Neuropsychological measures predict decline to Alzheimer’s dementia from mild cognitive impairment. Neuropsychology 2012, 26, 498–508. [Google Scholar] [CrossRef]
- Brambati, S.M.; Belleville, S.; Kergoat, M.J.; Chayer, C.; Gauthier, S.; Joubert, S. Single- and multiple-domain amnestic mild cognitive impairment: Two sides of the same coin? Dement. Geriatr. Cogn. Disord. 2009, 28, 541–549. [Google Scholar] [CrossRef]


| mda-MCI (Group 1) n = 33 | mdna-MCI (Group 2) n = 24 | sda-MCI (Group 3) n = 65 | HC (Group 4) n = 70 | Test a | Effect Size b | Distinct Groups c | |
|---|---|---|---|---|---|---|---|
| Demographic variables | |||||||
| Age | 70.88 (7.94) | 65.95 (8.94) | 68.83 (9.25) | 67.13 (8.92) | F = 1.96 | 0.030 | |
| Gender (n = F/M) | 25/8 | 21/3 | 31/34 | 46/24 | χ2 = 15.34 ** | 0.283 | 2 +female 3 +male |
| Years of Education | 9.67 (3.97) | 7.00 (3.24) | 9.54 (4.21) | 10.37 (5.25) | H = 6.76 | 0.035 | |
| Comorbidity (Charlson Index) | 1.21 (1.24) | 1.50 (1.31) | 0.85 (0.91) | 0.83 (0.93) | H = 6.93 | 0.036 | |
| Tests for MCI diagnosis | |||||||
| Lawton and Brody | 6.68 (1.81) | 6.00 (1.62) | 6.95 (1.68) | 7.14 (1.22) | F = 2.16 | 0.053 | |
| SMCQ (Informant) | 17.40 (4.67) | 18.48 (4.98) | 16.75 (4.49) | 13.46 (3.91) | F = 9.35 ** | 0.158 | 1, 2, 3 > 4 |
| SMCQ (Patient) | 19.36 (4.53) | 20.96 (3.62) | 19.11 (4.75) | 13.09 (1.76) | H = 96.25 ** | 0.504 | 1, 2, 3 > 4 |
| MMSE | 22.97 (1.91) | 24.04 (2.05) | 27.12 (1.77) | 28.36 (1.34) | H = 107.66 ** | 0.564 | 1, 2 < 3 < 4 |
| CAMCOG-R (Total) | 70.92 (10.47) | 73.75 (6.15) | 82.57 (9.01) | 87.45 (9.02) | H = 67.62 ** | 0.352 | 1, 2 < 3 < 4 |
| CAMCOG-R (Orientation) | 8.21 (1.39) | 9.21 (0.72) | 9.37 (0.74) | 9.73 (0.48) | H = 45.20 ** | 0.237 | 1 < 2, 3 < 4 |
| CAMCOG-R (Attention/Calculation) | 5.12 (2.19) | 4.25 (1.82) | 7.35 (1.63) | 7.59 (1.50) | F = 34.81 ** | 0.357 | 1, 2 < 3, 4 |
| CAMCOG-R (Praxis-visuospatial) | 9.55 (2.22) | 9.58 (1.72) | 10.80 (1.36) | 11.04 (1.15) | H = 23.89 ** | 0.125 | 1, 2 < 3, 4 |
| CAMCOG-R (Executive function) | 13.22 (3.93) | 13.83 (3.34) | 15.92 (4.28) | 18.52 (4.71) | F = 16.03 ** | 0.193 | 1, 2 < 3 < 4 |
| Verbal Fluency (Animals) | 11.35 (3.73) | 13.12 (3.36) | 14.77 (4.77) | 18.05 (5.63) | H = 46.00 ** | 0.239 | 1 < 2, 3 < 4 |
| Peabody (Vocabulary) | 52.47 (17.88) | 45.62 (12.98) | 58.25 (17.71) | 64.73 (17.94) | F = 8.72 ** | 0.121 | 1, 2 < 3, 4 |
| CVLT (Short Delay Free Recall) | 3.27 (2.14) | 8.96 (2.14) | 4.00 (2.01) | 10.04 (3.09) | H = 126.67 ** | 0.663 | 1, 3 < 2, 4 |
| Tests for cluster analysis | |||||||
| CAMCOG-R (Language) | 22.94 (2.25) | 22.92 (1.91) | 24.91 (2.40) | 25.67 (2.66) | F = 13.93 ** | 0.182 | 1, 2 < 3, 4 |
| CVLT (Long Delay Free Recall) | 4.12 (3.30) | 9.42 (2.87) | 5.35 (2.92) | 10.74 (3.12) | F = 53.35 ** | 0.460 | 1, 3 < 2, 4 |
| CANTAB (Pattern Recognition Memory) | 67.17 (10.46) | 78.12 (11.21) | 76.79 (12.28) | 83.33 (12.23) | F = 14.12 ** | 0.184 | 1 < 3, 2, 4 |
| Counting Span (Working Memory) | 1.67 (1.14) | 2.00 (1.10) | 2.08 (1.30) | 2.61 (1.22) | F = 5.21 ** | 0.077 | 1 < 4 |
| CANTAB (RTI, Five-choice Reaction Time) | 500.15 (126.99) | 407.19 (64.16) | 427.75 (100.60) | 399.14 (94.65) | H = 20.09 ** | 0.105 | 1> 2, 3,4 |
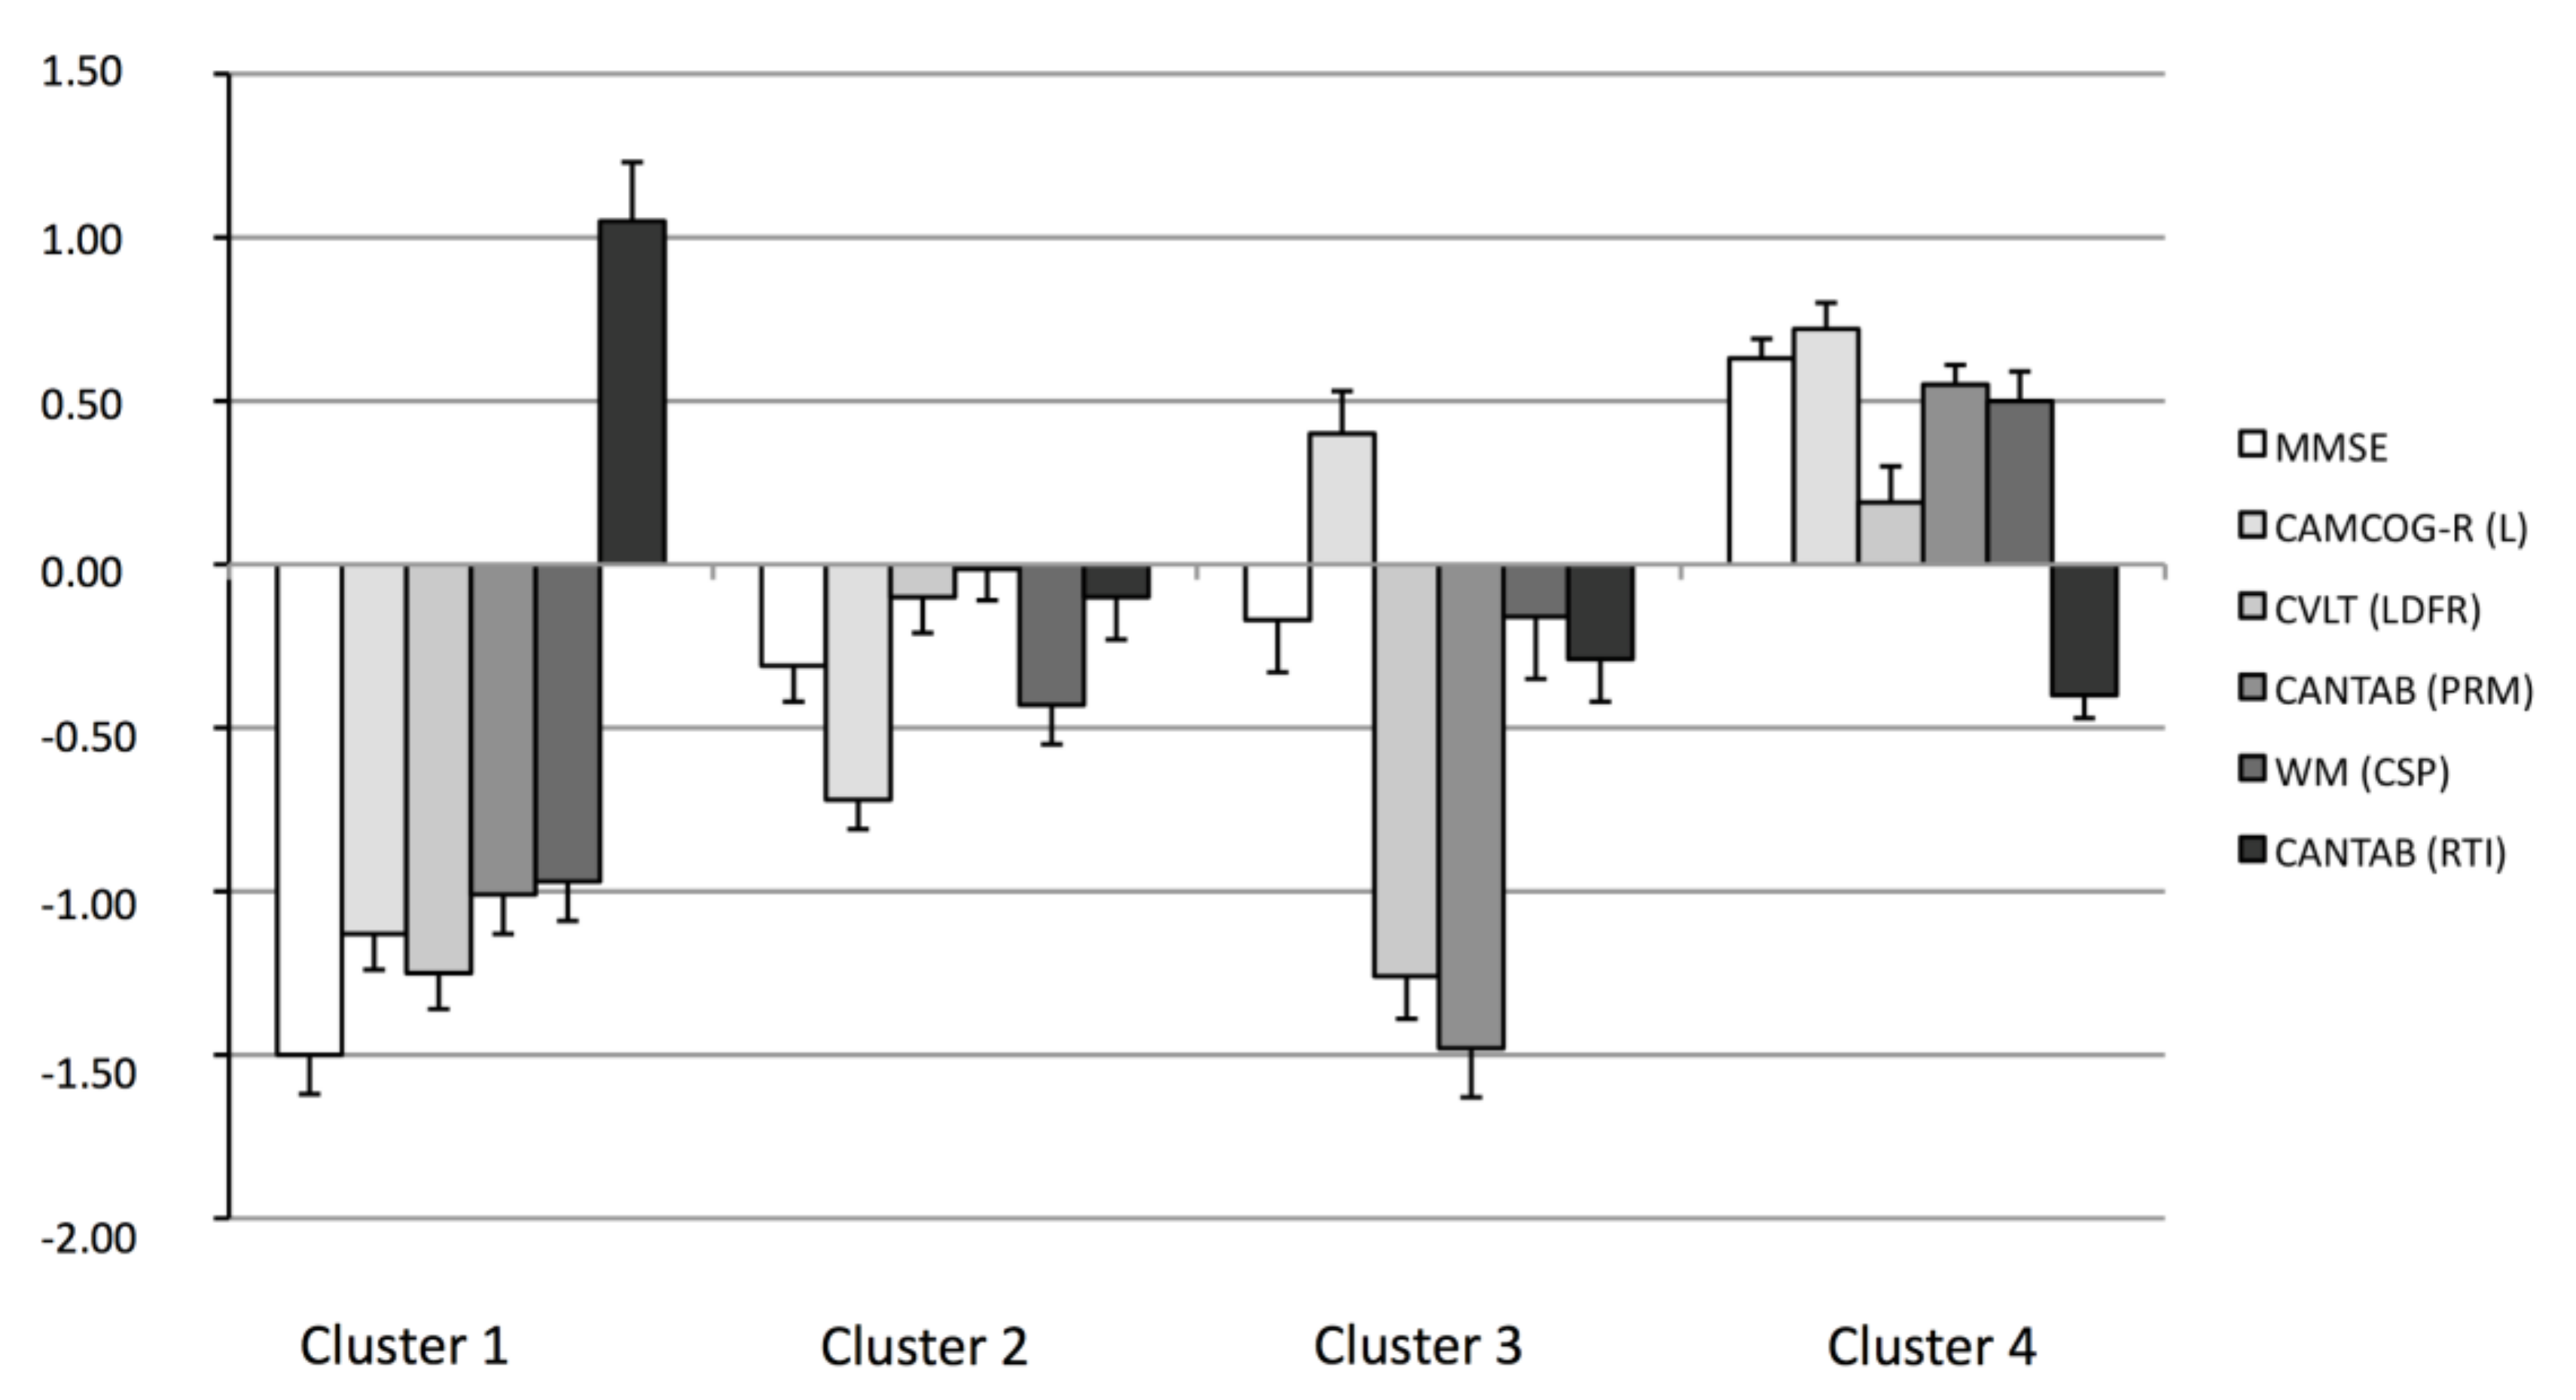
| Variables | Cluster 1 n = 47 | Cluster 2 n = 54 | Cluster 3 n = 27 | Cluster 4 n = 64 | Test a | Effect Size b | Distinct Groups c |
|---|---|---|---|---|---|---|---|
| MMSE | −1.50 (0.86) | −0.31 (0.79) | −0.17 (0.84) | 0.63 (0.50) | H = 106.58 ** | 0.558 | 1 < 2, 3 < 4 |
| CAMCOG−R(Language) | −1.13 (0.80) | −0.72 (0.64) | 0.40 (0.66) | 0.72 (0.67) | F = 82.40 ** | 0.568 | 1 < 2 < 3, 4 |
| CVLT (Long Delay Free Recall) | −1.26 (0.80) | −0.10 (0.80) | −1.26 (0.67) | 0.19 (0.86) | F = 41.61 ** | 0.399 | 1, 3 < 2, 4 |
| CANTAB (Pattern Recognition Memory) | −1.01 (0.85) | −0.01 (0.75) | −1.48 (0.76) | 0.55 (0.52) | H = 104.78 ** | 0.549 | 1, 3 < 2 < 4 |
| Working Memory (Counting Span) | −0.97 (0.87) | −0.43 (0.90) | −0.16 (0.99) | 0.50 (0.73 | H = 68.09 ** | 0.356 | 1 < 2, 3 < 4 |
| CANTAB (RTI, Five-choice Reaction Time) | 0.88 (1.07) | −0.18 (0.70) | −0.41 (0.62) | −0.24 (0.64) | H = 46.91 ** | 0.245 | 1 > 2, 3, 4 |
| Cluster 1 n = 47 | Cluster 2 n = 54 | Cluster 3 n = 27 | Cluster 4 n = 64 | Test a | Effect Size b | Distinct Groups c | |
|---|---|---|---|---|---|---|---|
| Age | 73.60 (7.12) | 66.41 (8.26) | 70.52 (9.87) | 64.78 (8.34) | F = 11.87 ** | 0.159 | 1, 3 > 2, 4 |
| Gender (n = F/M) | 31/16 | 36/18 | 14/13 | 42/22 | χ2 = 2.05 | ||
| Years of Education | 8.17 (3.86) | 7.46 (2.64) | 10.63 (4.58) | 11.85 (5.17) | H = 31.01 ** | 0.162 | 1, 2 < 3, 4 |
| Comorbidity (Charlson Index) | 0.97 (1.05) | 1.01 (1.05) | 1.22 (1.33) | 0.85 (0.92) | F = 0.77 | ||
| Lawton & Brody | 6.89 (1.69) | 6.74 (1.50) | 7.05 (1.61) | 6.85 (1.50) | F = 0.16 | ||
| Subjective Cognitive Complaints (Informant) | 17.92 (4.68) | 17.02 (4.67) | 17.05 (4.58) | 13.38 (3.81) | F = 10.04 ** | 0.168 | 1, 2, 3 > 4 |
| Subjective Cognitive Complaints (Patient) | 18.46 (4.54) | 18.46 (5.88) | 17.89 (4.22) | 14.87 (3.47) | H = 24.70 ** | 0.129 | 1, 2, 3 > 4 |
| CAMCOG-R (Total) | 71.34 (8.24) | 78.35 (5.95) | 83.59 (6.73) | 91.72 (6.35) | F = 87.50 ** | 0.583 | 1 < 2 < 3 < 4 |
| CAMCOG-R (Orientation) | 8.57 (1.21) | 9.31 (.75) | 9.33 (1.00) | 9.75 (.50) | H = 42.57 ** | 0.223 | 1 < 2, 3, 4 |
| CAMCOG-R (Attention/Calculation) | 5.28 (2.14) | 6.04 (2.19) | 7.26 (1.72) | 7.97 (1.20) | H = 50.05 ** | 0.262 | 1, 2 < 3, 4 |
| CAMCOG-R (Praxis-visuospatial) | 9.15 (2.03) | 10.48 (1.27) | 10.81 (1.18) | 11.43 (.94) | H = 51.92 ** | 0.272 | 1 < 2 < 4; 1 < 3 |
| CAMCOG-R (Executive function) | 12.36 (3.44) | 14.67 (3.26) | 16.70 (3.95) | 20.30 (3.64) | F = 50.66 ** | 0.447 | 1 < 2 < 3 < 4 |
| Verbal Fluency (Animals) | 10.47 (2.93) | 13.91 (3.26) | 15.56 (5.31) | 19.83 (4.74) | H = 92.04 ** | 0.482 | 1 < 2, 3 < 4 |
| Peabody (Vocabulary) | 46.07 (17.60) | 50.30 (13.31) | 62.44 (15.24) | 70.54 (14.74) | H = 62.98 ** | 0.330 | 1, 2 < 3, 4 |
| CVLT (Short Delay Free Recall) | 3.62 (2,47) | 7.65 (3.10) | 4.22 (2.75) | 9.20 (3.76) | H = 71.93 ** | 0.377 | 1, 3 < 2, 4 |
| CANTAB(PAL errors adjusted-6 shapes) | 29.26 (15.40) | 13.49 (8.71) | 21.96 (15.73) | 9.62 (7.53) | H = 51.19 ** | 0.268 | 1 > 3 > 2, 4 |
| Empirical Criteria Groups (Clusters) | Total Standard Criteria | % Correct a | ||||||
|---|---|---|---|---|---|---|---|---|
| 1 | 2 | 3 | 4 | |||||
| Standard criteria groups | Multiple-domain amnestic MCI (mda-MCI) | Allocat | 25 | 3 | 5 | 0 | 33 | 75.76 |
| Progres. | 9+ | 0 | 1 | 0 | 10+ | 90.00 | ||
| Multiple-domain non-amnestic MCI (mdna-MCI) | Allocat. | 6 | 16 | 1 | 1 | 24 | 66.67 | |
| Progres. | 1 | 2+ | 0 | 0 | 3 | 66.67 | ||
| Single-domain amnestic MCI (sda-MCI) | Allocat. | 13 | 16 | 16 | 20 | 65 | 24.62 | |
| Progres. | 5 | 0 | 3 | 2 | 10 | 30.00 | ||
| Healthy control (HC) | Allocat. | 3 | 19 | 5 | 43 | 70 | 61.43 | |
| Progres. | 0 | 0 | 0 | 1+ | 1− | 100.00 | ||
| Total cluster criteria | Allocat. | 47 | 54 | 27 | 64 | 192 | ||
| Progres. | 15 + | 2− | 4 | 3− | 24 | |||
| % Correct a | 53.19 | 29.63 | 59.26 | 67.19 | 52.08 | |||
| 60.00 | 100.00 | 75.00 | 33.33 | 62.50 | ||||
| Predictor | β | F(3,185) | r (Partial Correlation) | p (Pratt´s Relative Importance) |
|---|---|---|---|---|
| Standard criteria groups | 0.17 | 6.75 ** | 0.16 | 0.34 |
| Empirical criteria groups (clusters) | 0.27 | 9.46 ** | 0.25 | 0.66 |
© 2019 by the authors. Licensee MDPI, Basel, Switzerland. This article is an open access article distributed under the terms and conditions of the Creative Commons Attribution (CC BY) license (http://creativecommons.org/licenses/by/4.0/).
Share and Cite
Picón, E.; Juncos-Rabadán, O.; Lojo-Seoane, C.; Campos-Magdaleno, M.; Mallo, S.C.; Nieto-Vietes, A.; Pereiro, A.X.; Facal, D. Does Empirically Derived Classification of Individuals with Subjective Cognitive Complaints Predict Dementia? Brain Sci. 2019, 9, 314. https://0-doi-org.brum.beds.ac.uk/10.3390/brainsci9110314
Picón E, Juncos-Rabadán O, Lojo-Seoane C, Campos-Magdaleno M, Mallo SC, Nieto-Vietes A, Pereiro AX, Facal D. Does Empirically Derived Classification of Individuals with Subjective Cognitive Complaints Predict Dementia? Brain Sciences. 2019; 9(11):314. https://0-doi-org.brum.beds.ac.uk/10.3390/brainsci9110314
Chicago/Turabian StylePicón, Eduardo, Onésimo Juncos-Rabadán, Cristina Lojo-Seoane, María Campos-Magdaleno, Sabela C. Mallo, Ana Nieto-Vietes, Arturo X. Pereiro, and David Facal. 2019. "Does Empirically Derived Classification of Individuals with Subjective Cognitive Complaints Predict Dementia?" Brain Sciences 9, no. 11: 314. https://0-doi-org.brum.beds.ac.uk/10.3390/brainsci9110314