Influence of Reinforcing Steel Corrosion on Life Cycle Reliability Assessment of Existing R.C. Buildings


Department of Civil and Industrial Engineering-Structural Division, University of Pisa, 56122 Pisa, Italy
*
Authors to whom correspondence should be addressed.
Buildings 2020, 10(6), 99; https://0-doi-org.brum.beds.ac.uk/10.3390/buildings10060099
Submission received: 13 April 2020
/
Revised: 21 May 2020
/
Accepted: 26 May 2020
/
Published: 28 May 2020
(This article belongs to the Special Issue Life Cycle Prediction and Maintenance of Buildings)
Abstract
:Time-dependent reliability assessment is a crucial aspect of the decision process for rehabilitation of existing reinforced concrete structures. Since the assessment strongly depends on degradation of materials with time, the paper focuses on the influence of corrosion in reinforcing steel on time-reliability curves of relevant reinforced concrete (r.c.) structures, built in Italy in the 1960s, belonging to different building categories. To realistically represent the probability distribution functions (pdfs) of the relevant properties of reinforcing steel and concrete commonly adopted in the 1960s, stochastic models for steel yielding and concrete compressive strength have been derived, by means of a suitable cluster analysis, from secondary databases of test results gathered at that time in Italy on concrete and steel rebar specimens. This cluster analysis, based on Gaussian mixture models, provides a powerful tool to “objectively” extract material classes and associated probability density functions from databases of experimental test results. In the study, different degradation conditions and several reinforcing steel and concrete classes are considered, also aiming to scrutinize their influence on the time-dependent reliability curves. Finally, to stress the significance of the study, the time-dependent reliability curves so obtained are critically examined and discussed also in comparison with the target reliability levels currently adopted in the Eurocodes.
1. Introduction
Life cycle management is a topical research subject of modern structural engineering [1,2,3]. At present, many research studies are focused on the development of practical methods for the time-dependent reliability assessment of existing structures and infrastructures [4].
Despite the fact that reinforced concrete structures are generally associated with high durability [5], during their service life they are subjected to several deterioration processes, which are responsible for the decay of structural performance and safety over time. The most relevant causes of ageing effects in r.c. structures are, inter alia, steel corrosion and concrete carbonatation.
In the reliability assessment of existing structures, a key issue is the appropriate estimate of the mechanical properties of materials and the evaluation of their relevant statistical parameters [6]. In principle, that issue can be tackled by carrying out a suitable experimental campaign devoted to assessing the statistics of these mechanical properties, but the number of the tests is often limited by practical reasons, associated on the one hand with the difficult accessibility of some relevant points or elements to be investigated and on the other hand with the need to preserve the structural or architectural integrity of the construction. For these reasons, the most common and effective approach to the problem is based on an a priori characterization of materials, drawn from historical data obtained by documents, literature and in-situ or laboratory tests referring to coeval constructions, which is subsequently consolidated and updated by limited in-situ non-destructive or semi-destructive tests, if any.
In reinforced concrete of existing structures, the most relevant mechanical parameters are the compressive strength of the concrete and the yielding stress of the steel reinforcement.
Concrete compressive strength is generally estimated by means of non-destructive tests, such as sclerometric in-situ tests, ultrasonic tests, Sonreb combined tests or semi-destructive tests, such as extraction of cores [7] or pull-out tests. Test procedures are standardized in international standards (e.g., EN13791 [8], EN12504 series [9,10,11,12], ACI214-4.R10 [13]), which are often further specified and supplemented at national level through ad-hoc guidelines, such as the recent “Italian guidelines for the evaluation of in-situ concrete properties” [14].
As already remarked in general terms, since the safeguard of the static performances and integrity of the construction as well as its finishes and installed plants is a primary need, also in existing reinforced concrete structures the number of in-situ destructive or semi-destructive tests is limited. Although in the most favorable cases test results allow the mean values of the relevant mechanical parameters and the material’s degree of homogeneity throughout the structure to be assessed, they are usually not sufficient to derive accurate statistics of the mechanical parameters needed for the reliability assessments themselves.
Difficulties in performing in-situ investigations are even more evident for steel rebars. Despite the fact that experimental evaluation of the yield and ultimate strength of reinforcing bars requires a sufficient number of samples, as suggested, e.g., in [15], the in-situ extraction of rebars from existing reinforced concrete structures is frequently unwise, since the repair is often not easy, for example, due to poor weldability of steel grades used in the past for the reinforcement. For these reasons, the main sources of information are commonly the original design documentation, if available, or the structural codes in force at the time of construction.
To overcome the lack of information about the mechanical properties of buildings’ structural materials in terms of pdfs and relevant statistical parameters, suitable methods for the analysis of secondary material properties databases are needed. Concerning this aspect, a very sound and efficient methodology to identify homogenous material classes in databases of raw test results commonly stored in testing laboratory’s archives has been previously proposed in [6,16]. Starting from standard acceptance test results obtained at the time of the construction, this methodology, based on a Gaussian mixture model, briefly described in Section 3, allows identification, in an “objective” way, of the relevant clusters of data, as well as their statistical properties.
By introducing appropriate degradation models, the outcomes of the above mentioned analyses can be further implemented to assess the time-dependent reliability of existing structures.
The present work focuses on time-dependent reliability of reinforced concrete structures built in Italy during the 1960s, also aiming to check how the concrete and reinforcing steel classifications influence the results. The time interval considered in the study is particularly significant since it is associated with the most intensive construction activity in Italy in the framework of post-war reconstruction; in fact, a relevant part of the built Italian environment dates back to it.
To illustrate the practical application of the method, some relevant time-dependent reliability curves are discussed, referring to three relevant case studies consisting of r.c. reference buildings belonging to three different categories: residential, commercial and storage buildings. The study aims to assess how corrosion effects in reinforcing steel influence the structural reliability over time, depending on the degradation conditions as well as on the reinforcing steel and concrete classes.
To realistically represent the actual pdfs of the relevant material properties, the stochastic models for steel and concrete classes are those derived from the cluster analyses of the historical test data of the Laboratory of the Department of Civil and Industrial Engineering of the University of Pisa illustrated in the already mentioned references [6,16].
Finally, to further underline the significance of the study, time-reliability curves are compared with the target reliability levels currently given over time by the Eurocodes [17].
2. Time-Dependent Reliability Analysis
A methodology to estimate time-dependent reliability of aging structures, taking into account the non-stationarity of loads and the degradation of structural resistance, has been proposed and previously applied in [18] and [19]. Truly, that methodology can also be applied to assess the influence on structural reliability of non-stationarity of climatic actions due to climate change effects; in fact, it only requires the knowledge of suitable factors of change, expressing the variations over time of the relevant parameters of the extreme values distribution of the investigated action [20,21,22].
According to [23], the degradation of structural resistance over time can be represented by a suitable deterministic degradation function, . Saying that is the resistance at time and is the initial resistance of the structure, , it is:
Let be the cumulative distribution function (CDF) of the load intensity; the time dependent reliability can be thus expressed by
where is the mean occurrence rate of the action, and is the probability that the load intensity exceeds the resistance.
Assuming an extreme value type I (EVI) distribution for the leading action, the time-dependent structural reliability trivially results
where
and and are the location and the scale parameters of the distribution.
The variation of the EVI parameters as a function of the time is described in [18,19] by means of factors of change derived from the analysis of climate projections and weather generated series, also considering the uncertainty in the prediction [21]. That method is much more general and can be applied, for example, for imposed loads as well.
Recalling that the probability of failure is the complement to one reliability,
the reliability index can be easily derived, as function of the time , from Equation (5).
The reliability index so obtained can be compared with the target reliability level given in structural codes for a specific reference or observation period; for example, in EN1990 [17] it is usually assumed for an observation period of 50 years, that means , or equivalently, for structural designs mainly governed by variable actions, in one year, roughly corresponding, for the same structure, to for an observation period of one year.
With the above mentioned methods, the variation over time of the structural reliability can be assessed not only for new structures, designed according to modern codes, such as Eurocodes [17,24] and ACI specifications [25], but also for the assessment of existing structures, provided that adequate information about material properties and degradation effects is available.
3. Use of Gaussian Mixture Models in Cluster Analysis of Test Results on Building Materials
As already said, the reliability assessment of existing structures requires suitable information about statistical distribution of relevant properties of building materials, also taking into account their degradation over time.
In reliability-based assessment of existing structures, the statistical distributions of relevant mechanical properties are often selected based on literature data [26], introducing further uncertainties in the evaluations. To reduce these uncertainties, an “a priori” assessment of statistical information about the material’s properties could be very helpful, also in view of possible application of Bayesian updating techniques. This “a priori” estimate should rely on historical investigations, taking into account codes and standards, scientific and historical documentations, or even architectural canons, in force at the construction time.
Anyway, the most suitable approaches are irrefutably based on experimental test results.
As anticipated, starting from experimental results, the assessment of mean values of relevant mechanical properties is not particularly demanding; on the contrary, a sound evaluation of their standard deviation, or more generally of their inherent uncertainty, requires the availability of many in-situ test results. However, owing to the fact that the number of samples is generally too limited to derive that information, it is often necessary to rely on databases of standard laboratory or in-situ test results obtained for similar coeval structures.
The elaboration of raw data stored in testing laboratory archives is not trivial. The major difficulty frequently originates from the uncertain association of the tested sample to the corresponding material class; in fact, the declared material classes are often untrustworthy or wrong, also for the presence of downgraded material. For that reason, the database results in a mixture of different individual populations, each one typifying a material class, which should be duly identified.
A general and user independent methodology allowing the identification of material classes and the evaluation of the statistical parameters of their relevant mechanical properties is discussed in [6]. The method, which is based on a Gaussian mixture model (GMM) [27], allows the identification of different clusters, representing homogenous statistical populations, in secondary databases of experimental tests data derived, for example, from standard acceptance tests.
3.1. Mixture Models
Mixture models (MMs) approach the statistical modeling of heterogeneity in a cluster analysis on a mathematical basis.
MMs are able to analyze quite complex distributions, composed of several homogenous populations belonging to the same distribution family, allowing different individual components to be identified. In fact, such kinds of complex distributions cannot be described by single probability density functions, which are unable to provide a satisfactory model for local variations in the observed data. On the contrary, assuming the distribution composed by one single homogenous population could lead to erroneous statistical information.
Due to their flexibility, mixture models are applied for the statistical modeling of a wide variety of random phenomena.
When all the distributions of the mixture belong to the normal family, the mixture model is said to be a Gaussian mixture model (GMM) [27]. As discussed in [6] and [16], they have been successfully adopted to identify material resistance classes in a whole database of test results, even if the origin of individual data is unknown.
The above mentioned procedure, briefly described in the following, has been applied to identify the relevant statistical properties of concrete and reinforcing steel classes used in Italy during the 1960s, as illustrated in Section 4.
3.2. Cluster Analysis
To identify individual clusters and their relevant statistical properties, the following method, based on the already cited Gaussian mixture model, can be adopted:
- a database of tests results, carried out on standardized specimens adequately representing the examined building materials, should be collected. Data can be gathered from pertinent laboratory or in-situ test results available in the archives of laboratories for testing building materials. To be adequately significant, tested specimens should be consistent with the investigated structural material in terms of raw materials, workmanship and age; therefore, they should refer to coeval structures as the considered structure and be located within the same geographical region;
- a cluster analysis is then carried out based on Gaussian mixture models, with the objective to identify different individual homogenous populations included in the whole database, as well as their probability density functions (pdfs). As said before, the mixture model (MM) is a probabilistic model suitable to identify a subpopulation within an overall population by means of its pdf. In a MM with k components, the density of the random variable can be written in the form [28].where is the pdf of the i-th component of the mixture, and its mixing proportion, or weight:
The mixture model (MM), which could be interpreted as a method of classification by unsupervised learning [28], provides results that can be directly used for the reliability assessment of existing buildings. In performing the analysis, it must be considered that preliminary manipulations of the collected data, like a priori assignment of some test results to a given class, on the basis of recorded information available in the test report or on the basis of engineering judgments, are not necessary and should be avoided, since this practice can lead to misleading results.
4. Concrete and Reinforcing Steel Properties of Typical R.C. Structures Built in Italy in the 1960s
In order to identify building material classes and the associated pdfs to be used in the time dependent reliability analysis discussed in Section 5, the above mentioned methodology has been applied to databases of material test results concerning concrete and reinforcing steel used in Italy during the 1960s. As said before, that historical period is extremely relevant, since a large part of the Italian built environment was erected at that time, in the framework of the so-called “economic boom” following the post-Second World War reconstruction.
4.1. Database of Material Acceptance Tests from the 1960s
The mechanical properties of the historical building materials were derived from the materials’ acceptance tests carried out in the 1960s in the Laboratory of the Department of Civil and Industrial Engineering of the University of Pisa. The laboratory has been active, as an official laboratory, since 1939 [29], being one of the oldest Italian facilities operating in this field. During the 1960s, samples of reinforcing bars came from all over Italy, from construction sites concerning not only buildings, but also bridges and other civil and industrial engineering works.
The collected databases, derived from official test reports, consist of about 6000 tensile tests on steel rebars used in the years 1961, 1963, 1965 and 1967 [16] and on 18,222 compressive tests of cubic specimens for the years 1961, 1963, 1965, 1967 and 1969 [6].
The cluster analysis of the aforementioned databases allowed homogenous classes and associated probability distribution functions for the fundamental mechanical parameters to be identified. In the following sections, relevant results concerning the concrete compressive strength and the yielding strength of rebars are summarized.
4.2. Concrete Material Classes
The material acceptance tests performed on concrete cubic specimens have been already analyzed in [6], therefore in the following, only some key results relevant for this work are recalled.
Considering typical production of concrete in Italy during the 1960s [30], as well as code requirements for material acceptance in force at that time [29], preliminary information was collected about concrete strength variation [31]. The study highlighted that no standardized concrete classes existed at that time and that frequently concrete was produced directly at the building site, adopting mix designs mainly based on the producer’s past experience.
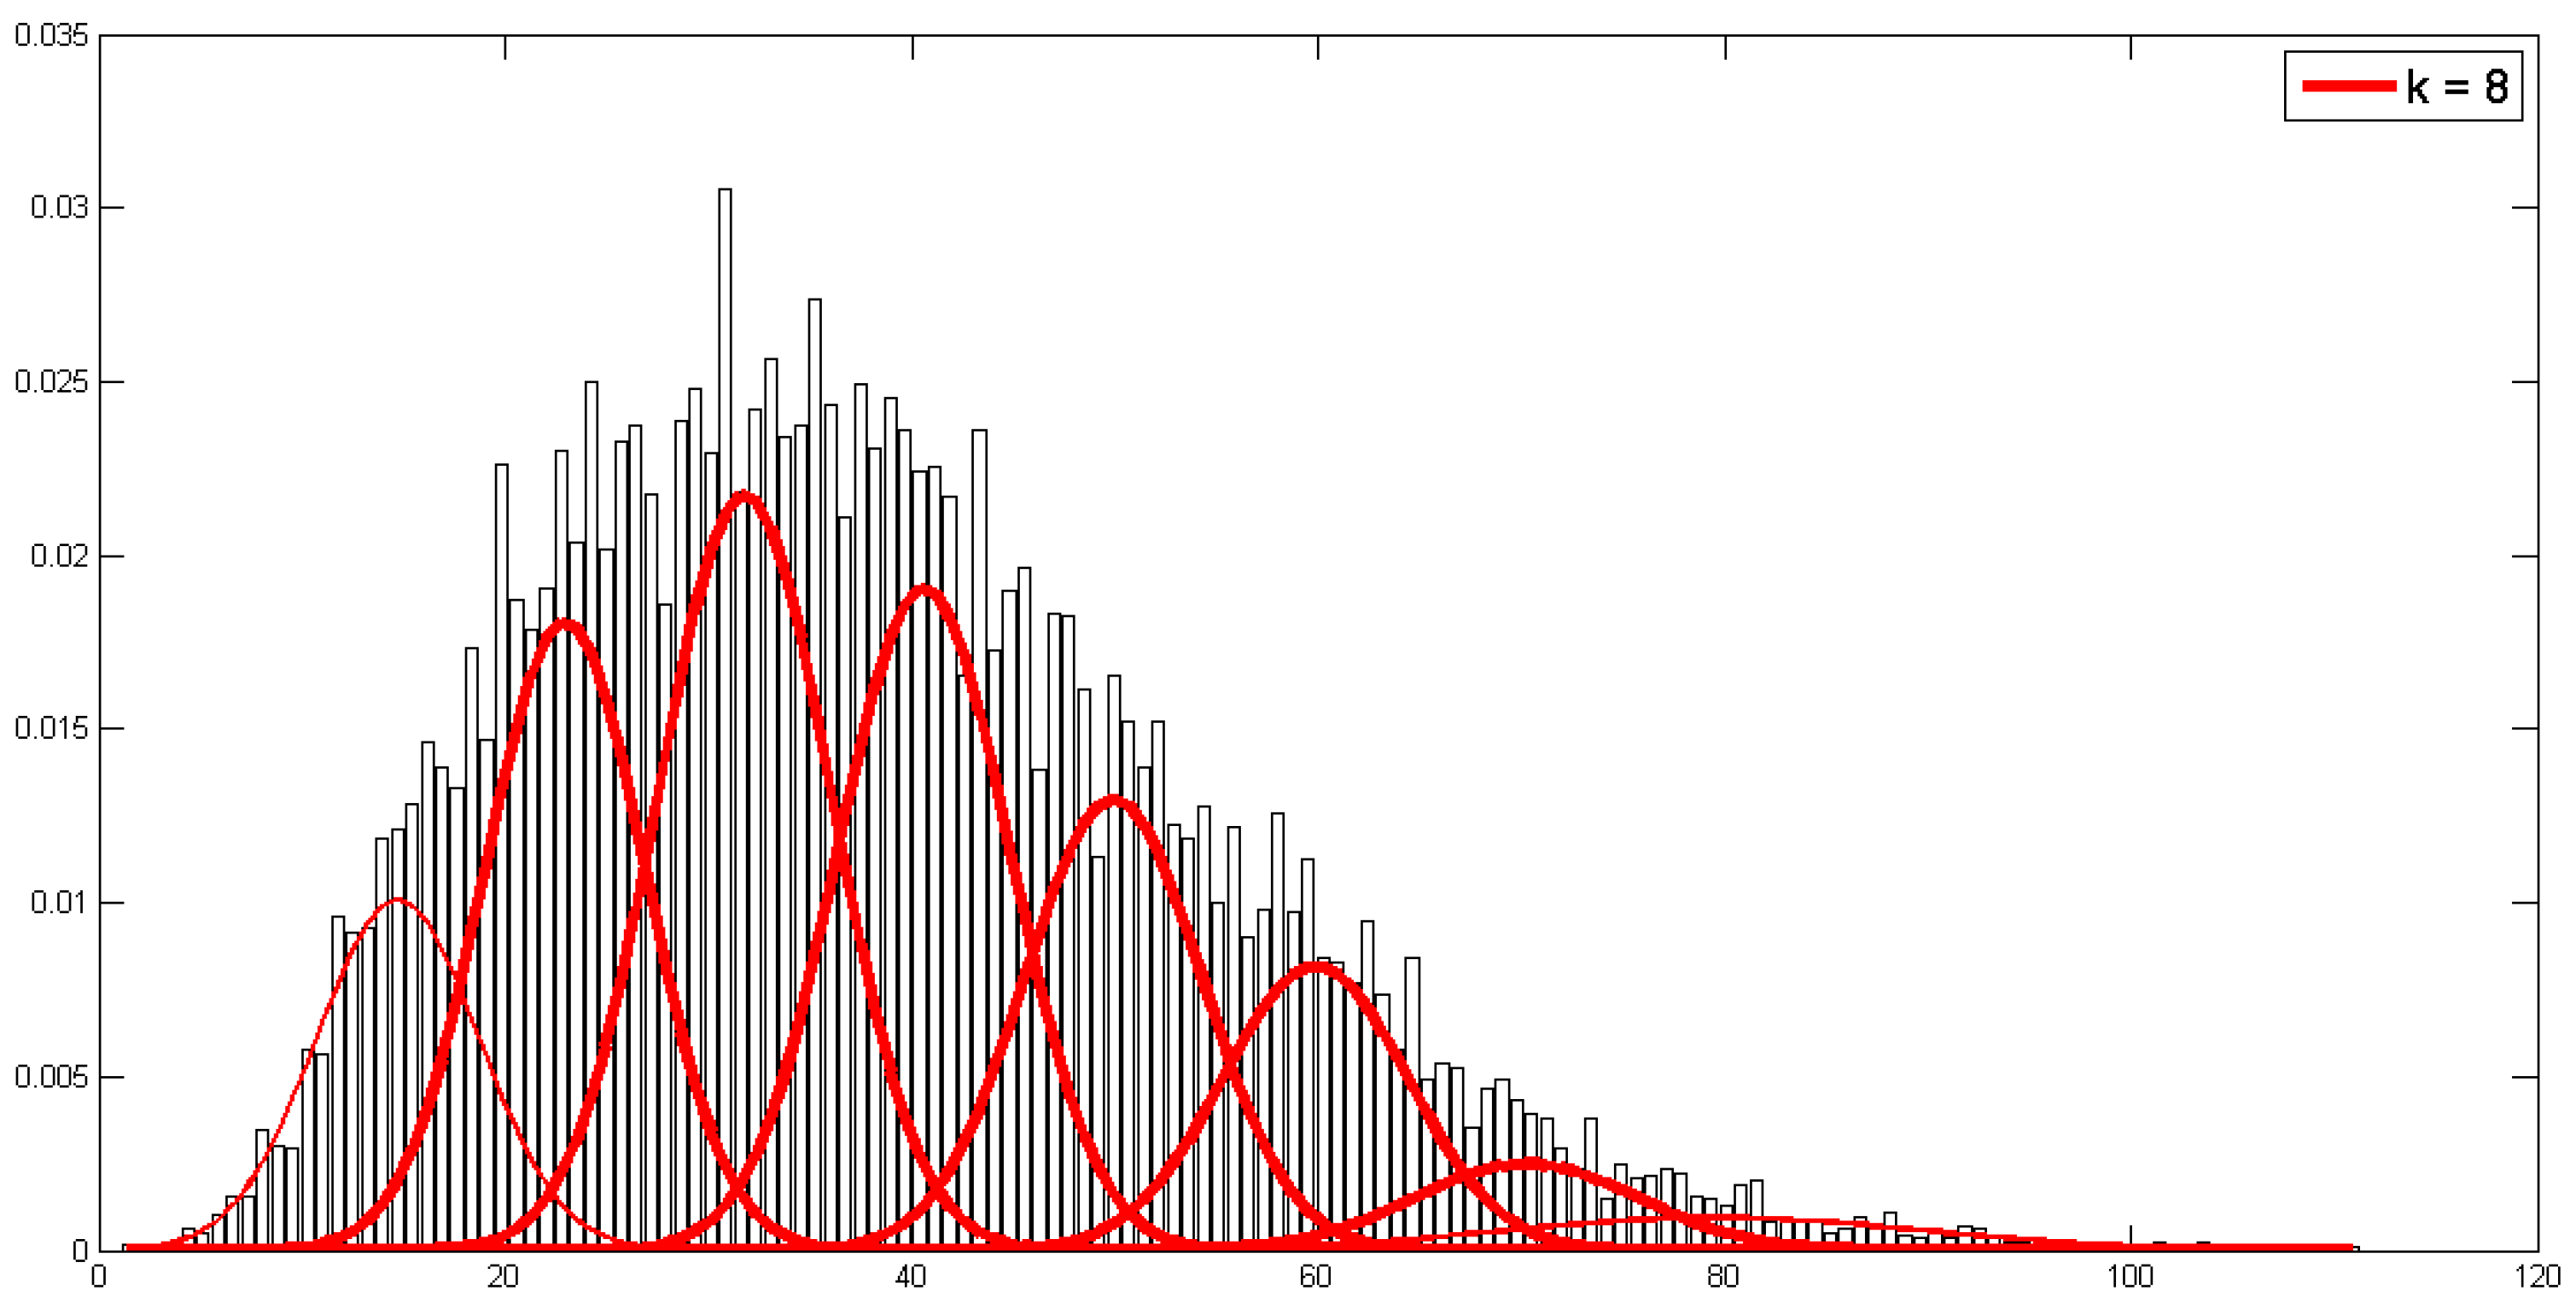
The cluster analysis performed on the collected database leaded to a Gaussian mixture model made of eight components. Indeed, different number of components, , were considered (). The value was chosen being associated to lower values of the Bayesian information criterion (BIC). It must be underlined that, except the extreme classes, which are not particularly significant, relevant information on most common classes are quite independent on the number of components.
The identified concrete classes are shown in Figure 1, and their relevant statistical parameters are given in Table 1, together with the probability associated to each component. Obviously, the significance of class 1 is very limited for practical applications, due to the very low concrete resistance values and the associated high .
4.3. Reinforcing Steel Classes in Italy during 1960s
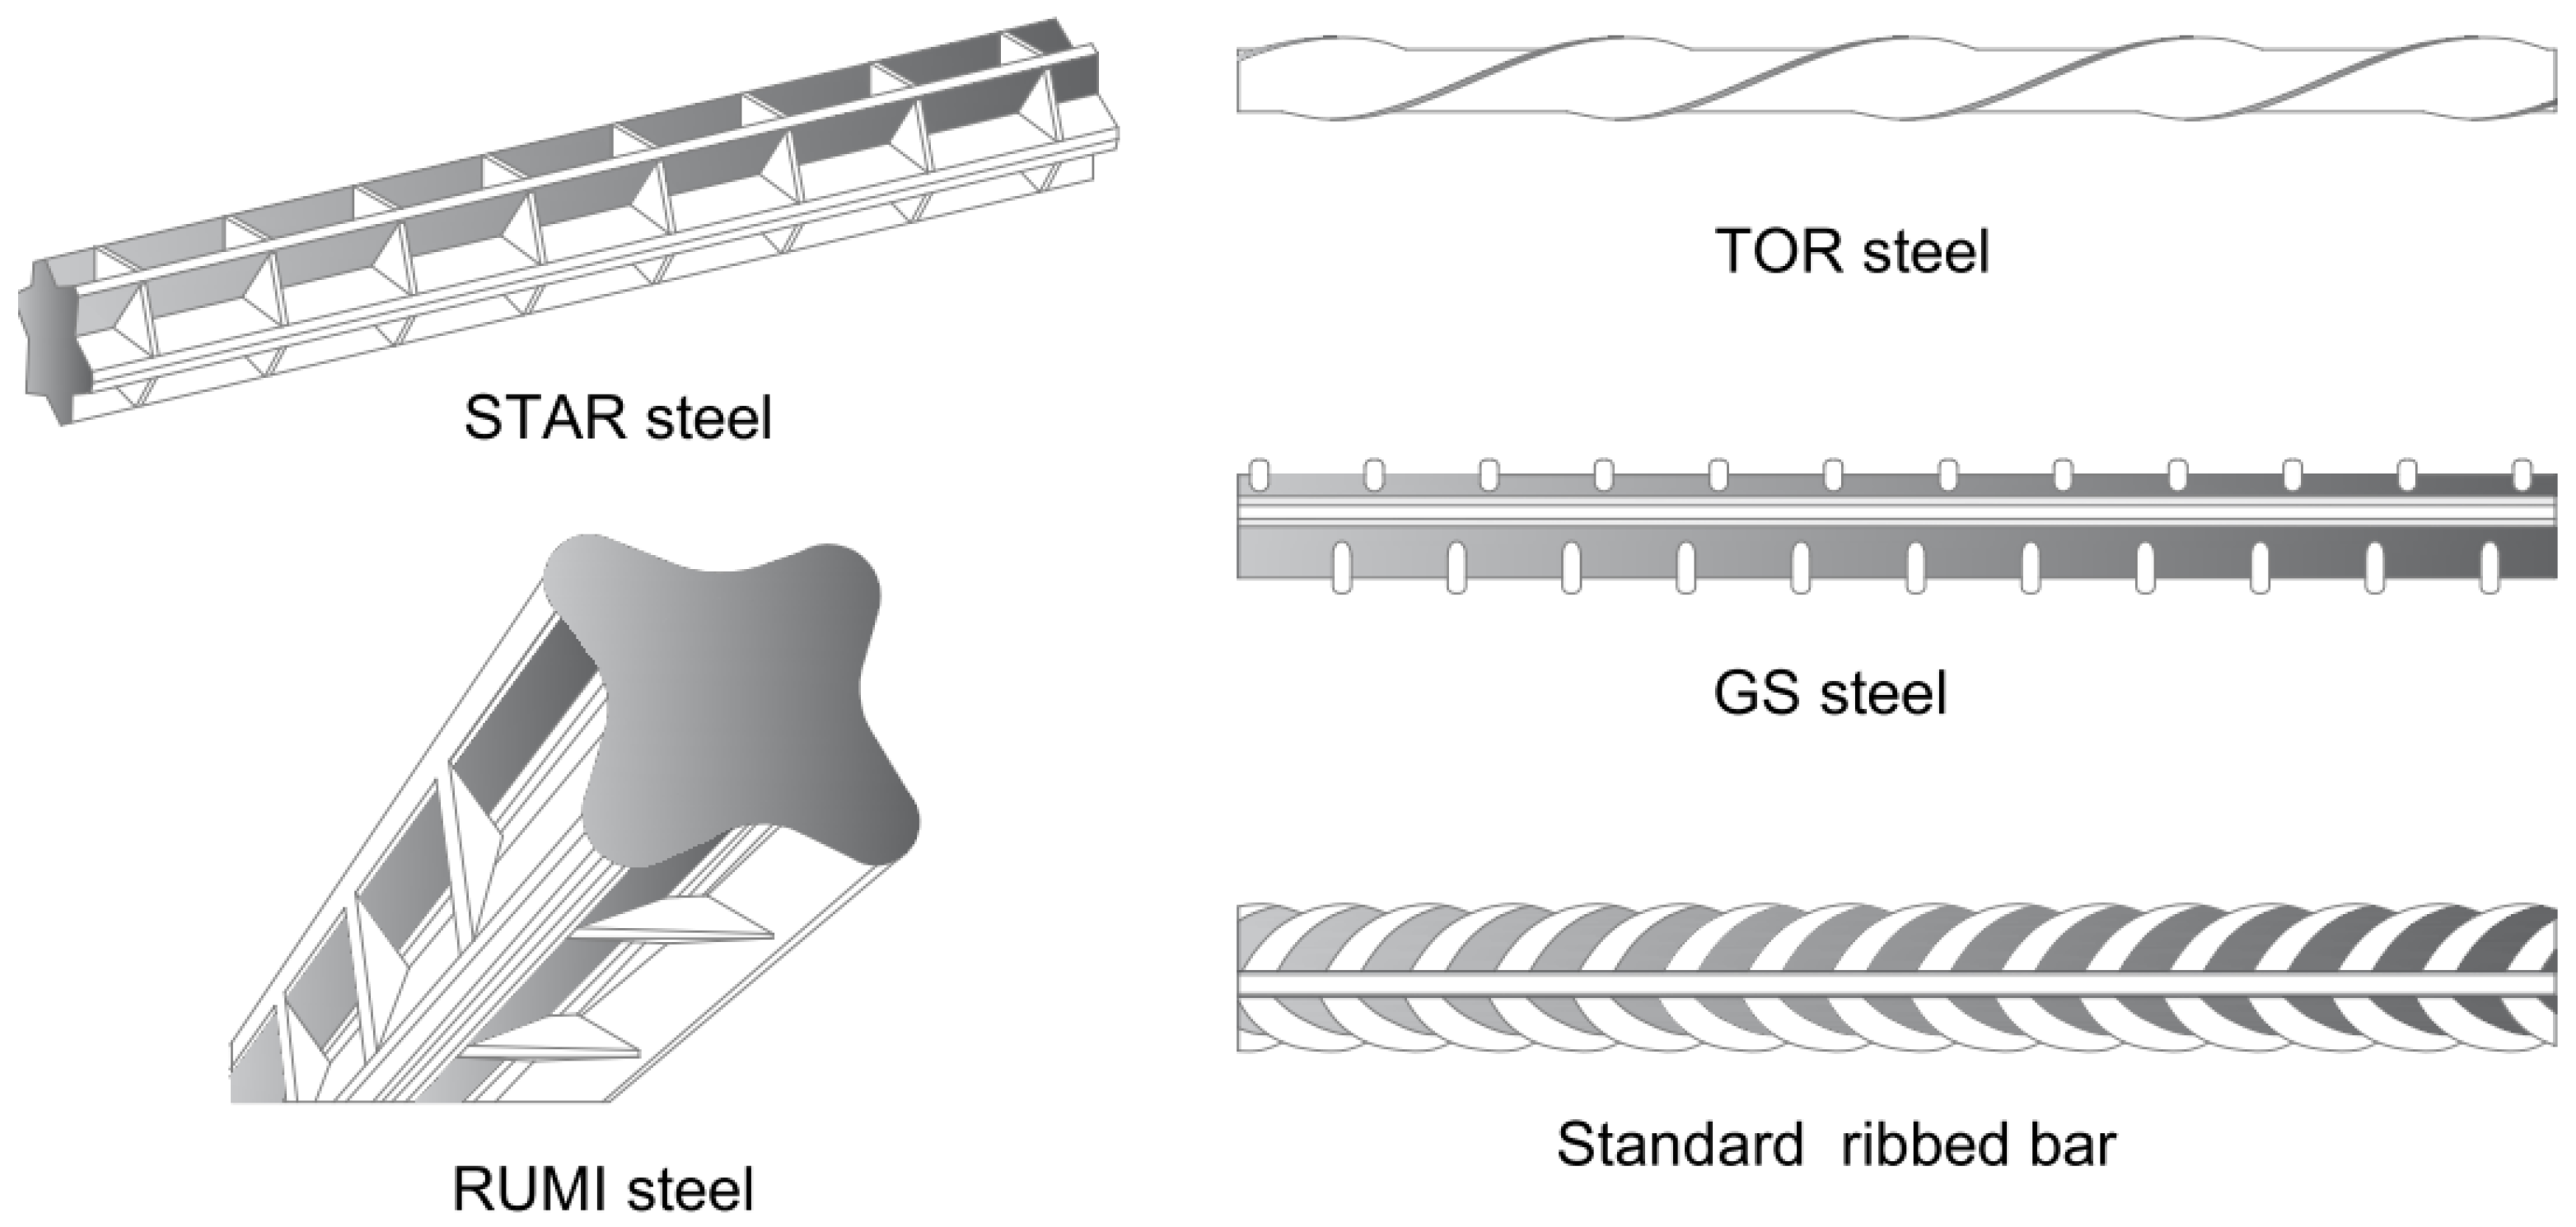
During 1960s, different types of steel rebars were commonly used in Italy. Indeed, further to the common plain rebars, the use of ribbed rebars, to improve steel-to-concrete bond performance, increased over the years and different shapes were proposed before a complete standardization.
An illustration of the main different typologies of ribbed bars used at that time is summarized in Figure 2.
In the collected database, 84% of the samples are plain bars, 13% are ribbed bars, while only 3% are not labelled as plain or ribbed. The analysis of the evolving percentages of samples during the years confirms that the time period under examination represents a transition phase; in fact, while in the years 1961, 1963, 1965 the percentage of plain rebars was almost 88% of the tested rebars, from 1967 on it decreased to 66%, due to the increasing use of ribbed bars.
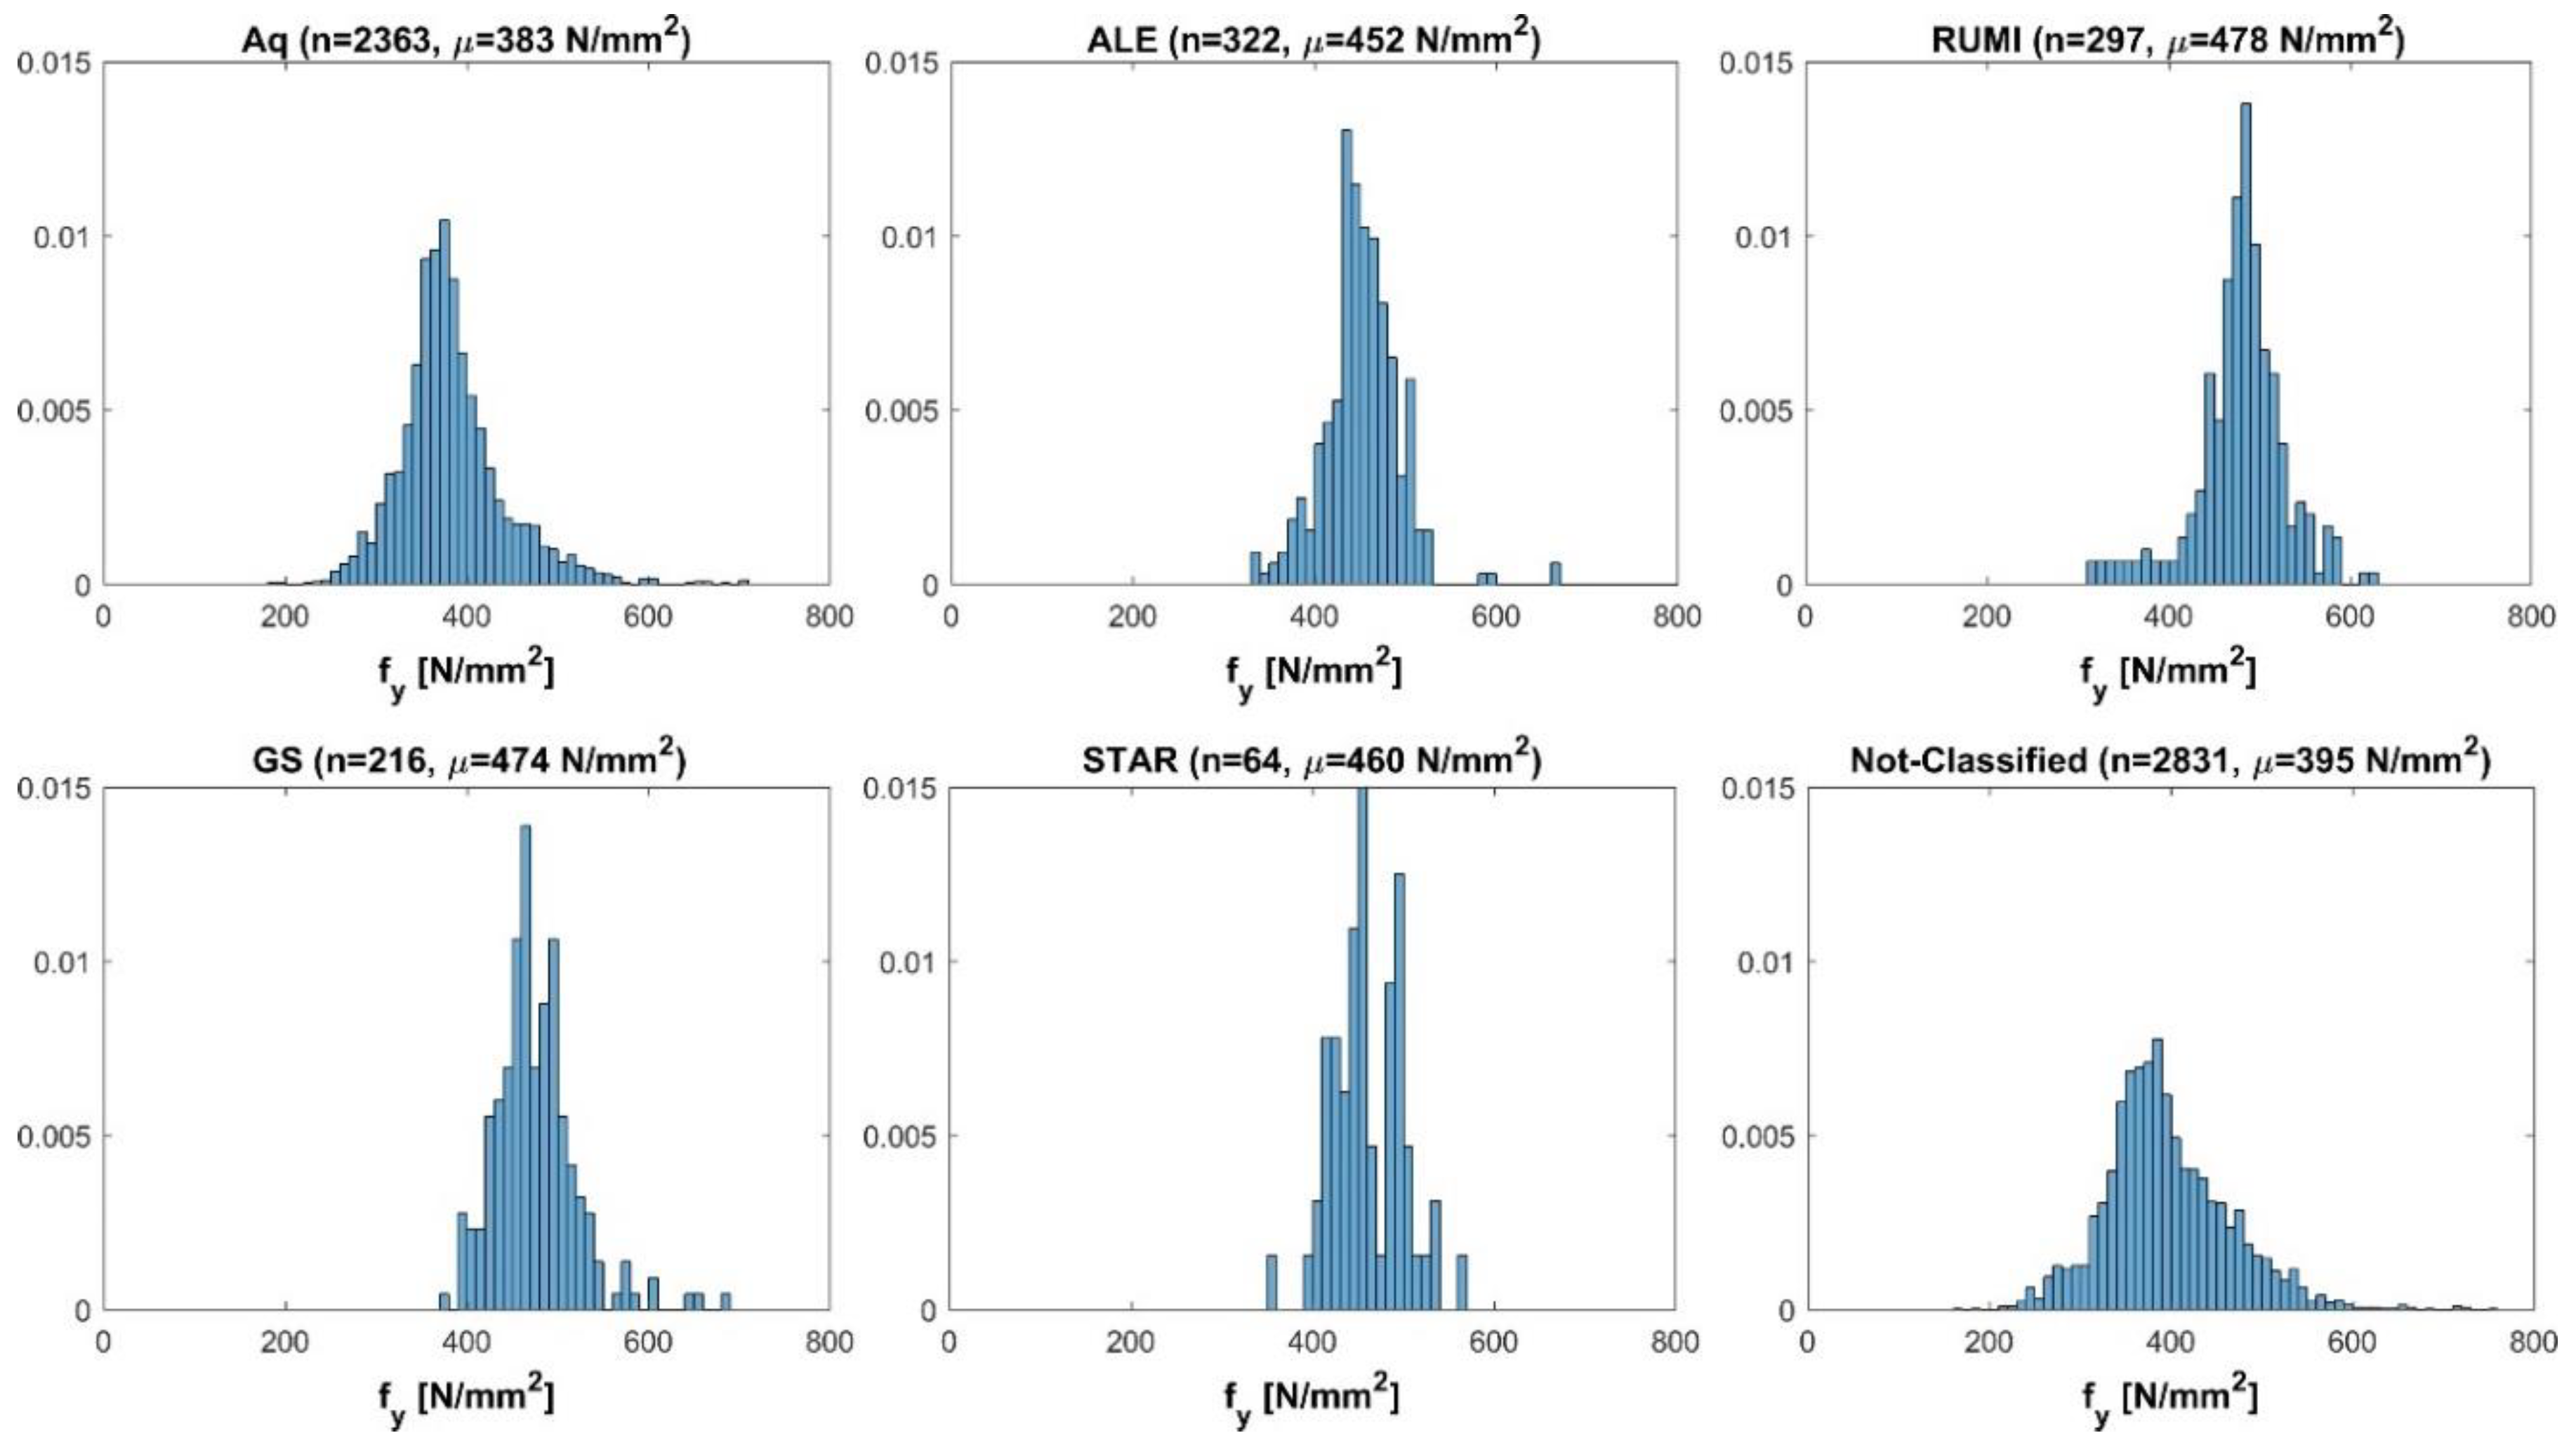
In the collected database, the main categories of rebars are Aq-steel plain rebars (Aq42, Aq50 and Aq60), high elastic limit steel (known in Italy as ALE), GS steel, RUMI, TOR and STAR rebars. However, a relevant percentage of unclassified steel samples is also registered.
In Figure 3, histograms of yielding strength for the main steel categories, Aq, ALE, RUMI, GS, STAR and “unclassified common steel”, are shown.
In each of these macro-categories, subcategories have been recorded, in turn: Aq 42, Aq45, Aq 42/50, Aq 50, Aq 50/60, hard 60/70, ALE, ALE 4400, ARES, RUMI, RUMI LU, RUMI 400, RUMI LU3 or RUMI LU3 4000, RUMI4400, RUMI LU3/4400, RUMI LU3/5000, GS, GS3600, GS4400, GS 4400 ALE, GS4500, GS5000, STAR, STAR4400, STAR4500, STAR5000, TNT 60, RUMI TNT, FERRO BOX 4400, TOR, Thor Aq52/60, special steel.
With the aim of a preliminary classification, three main steel categories have been considered:
- Aq-category, including plain rebars only, incorporating all the Aq subcategories;
- Ribbed bars, including all the steel classes for ribbed rebars (RUMI, GS, STAR and “ribbed not classified” steel).
- Not classified steel, including all plain rebars not specifically labelled.
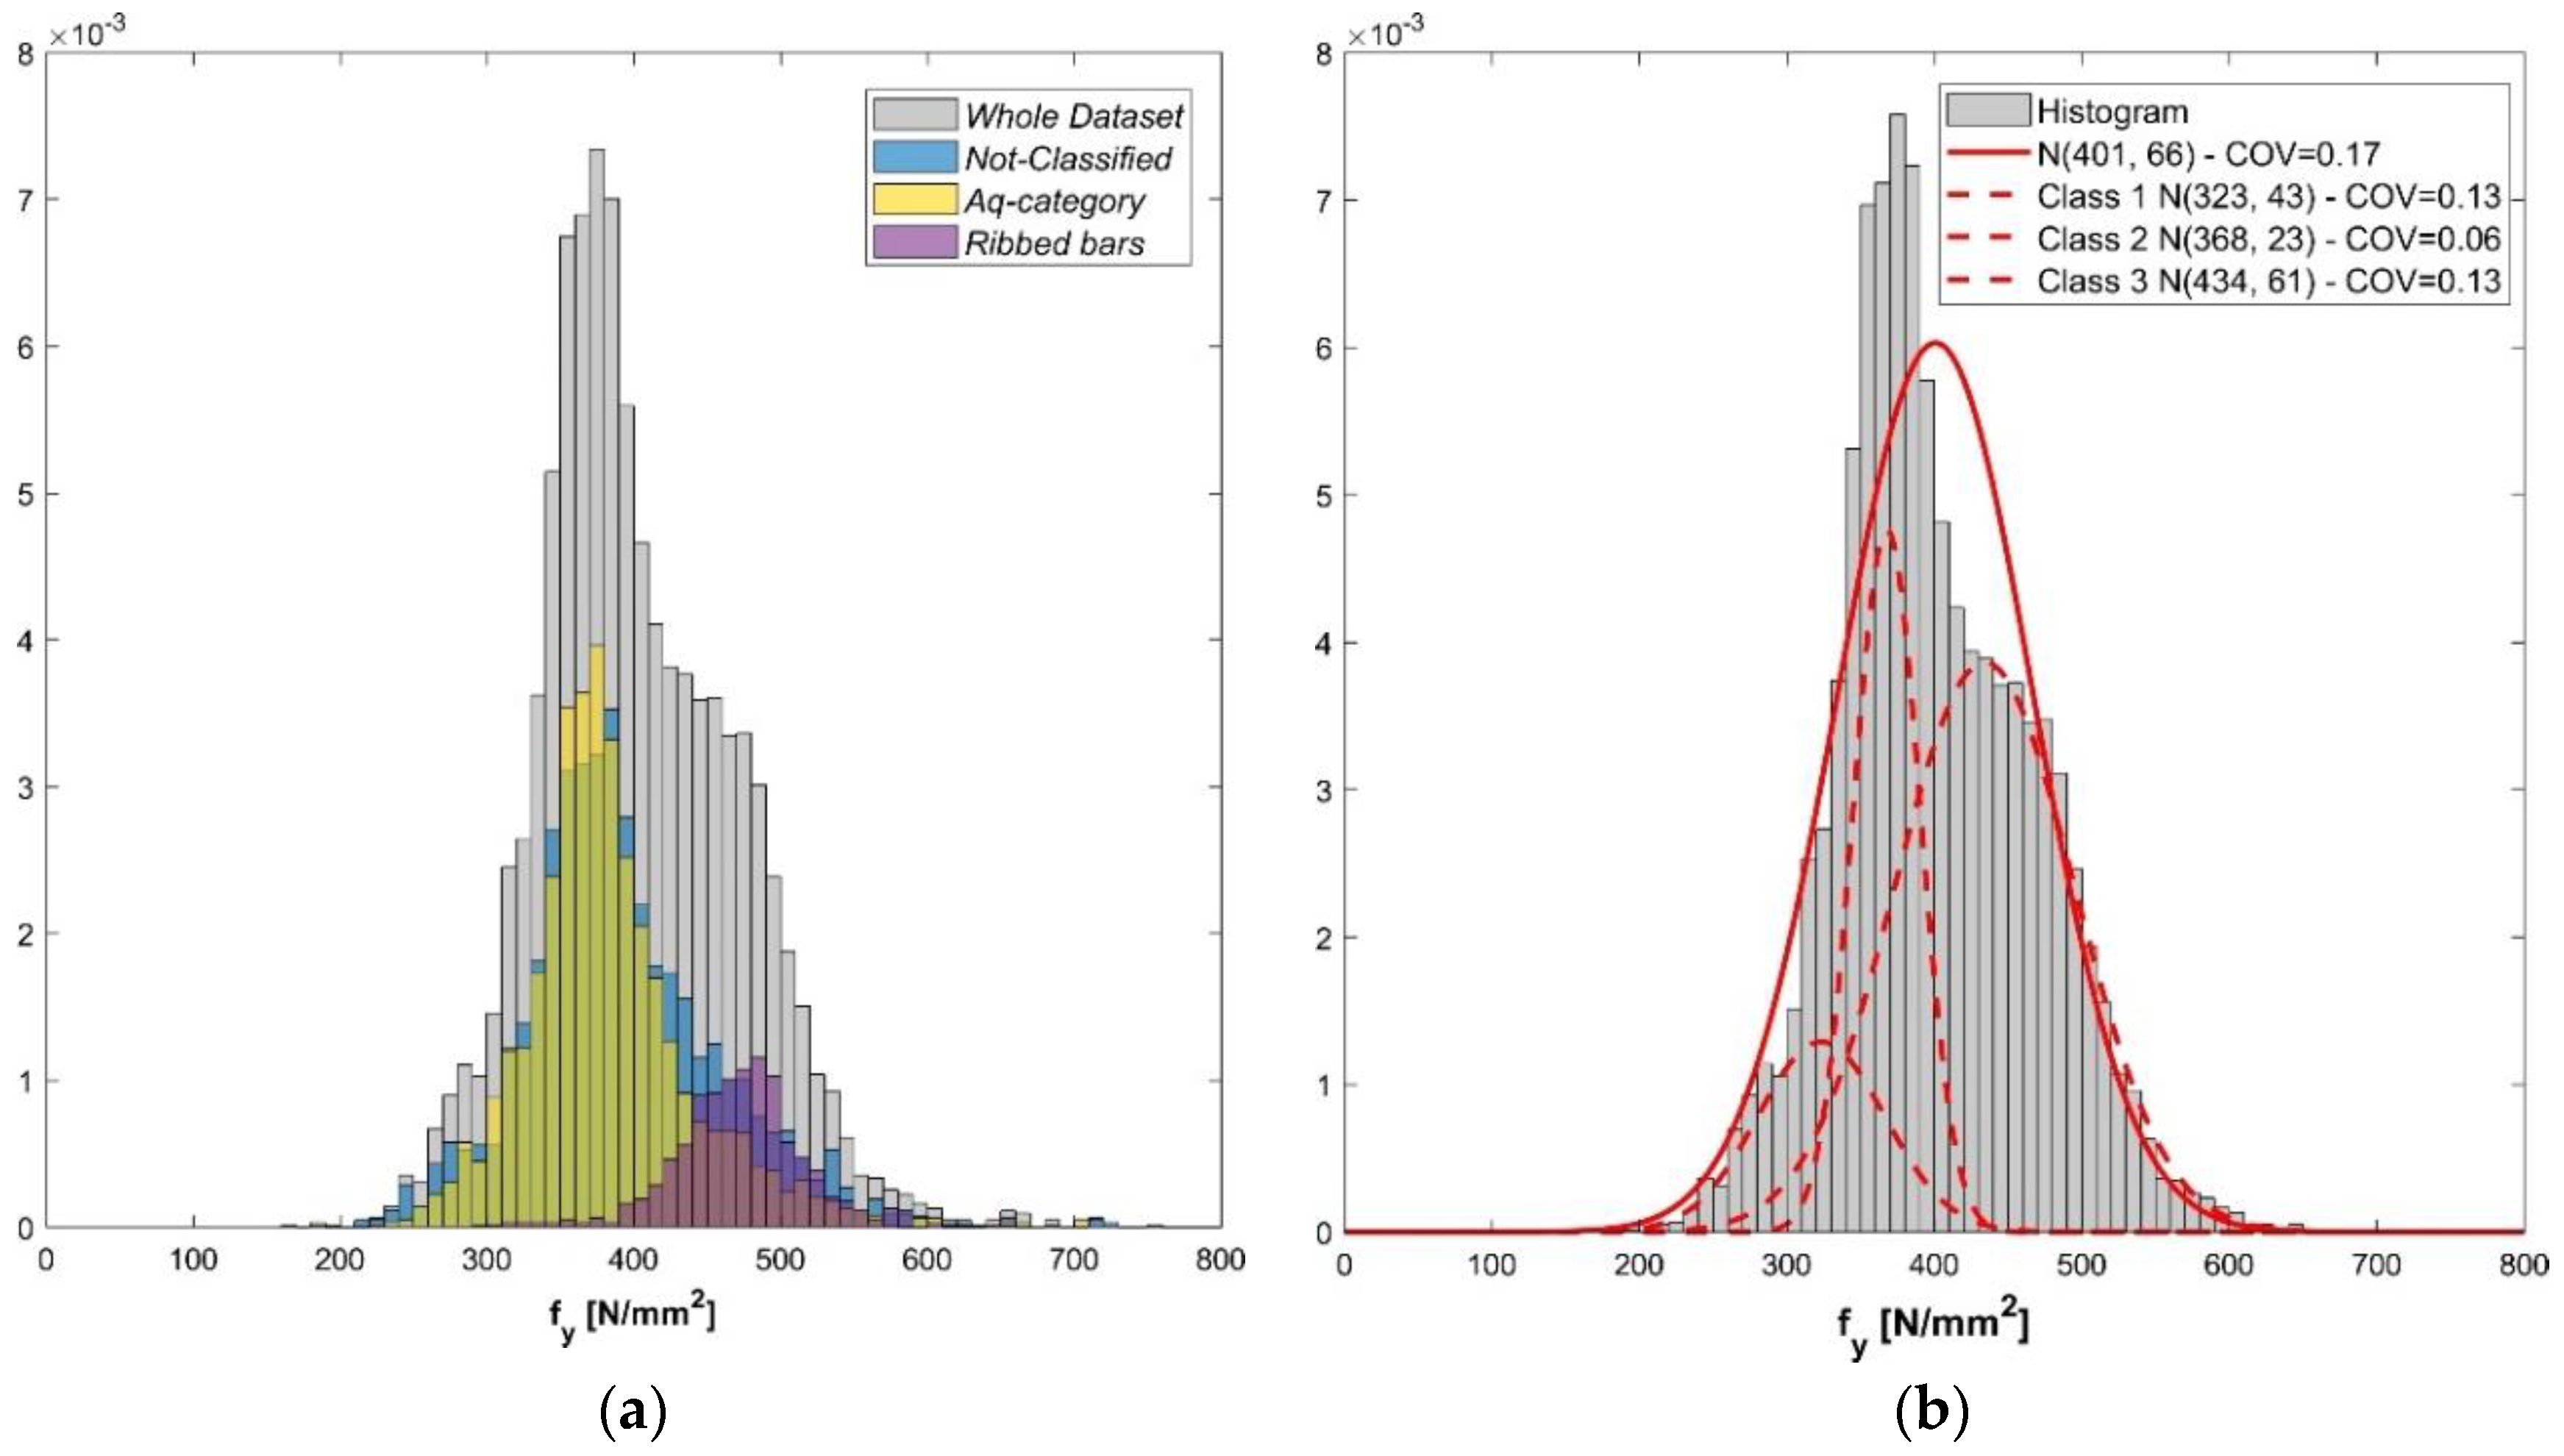
In Figure 4a the bar charts of yielding strength for the three main steel categories are shown. The Aq-category and Not classified steel show similar distributions with the mean value of the yield strength and and and , respectively. It is worth noting that the Italian regulation in force in those years (Ministerial Memorandum 1957 [32]) recommended the use of the macro-category “Aq” plain rebars, with subclasses (Aq42, Aq50, Aq60) corresponding to the steel typologies identified by the previous regulation (R.D. 1939 [29]), i.e., mild, medium, and high strength steel. Ribbed bars were introduced in Italy by the same Memorandum [32]; therefore they represent only a marginal part of the database, characterized by an average value of the yield strength and by .
As it is evident in Figure 4, the two main sub-populations “Not classified steel” (in blue) and “Aq-category” (in yellow) are overlapped, complicating the identification of sub-classes. Moreover, although the steel category for ribbed rebars (in magenta) is clearly identified as a subpopulation in the descending part of the frequency bar chart, corresponding to the higher strength values, it partly overlaps the higher values registered for plain bars. As a consequence, a robust methodology is needed to identify homogenous sub-populations, like the one discussed above for concrete.
Analyzing once again the whole dataset by means of the cluster analysis based on Gaussian mixture models (GMM), it is thus possible to identify three sub-classes of steel rebars. It is important to stress that the advantage of the proposed method is its “blindness”, since it does not require any preliminary assumptions about the classes.
The results of the analysis for yielding strength are illustrated in Figure 4b, where the pdfs associated to the three classes (dashed red lines) are compared with the pdf related to the whole dataset (solid red line). The relevant statistical parameters, i.e., the mean value of yield strength, , and coefficient of variation (), are given in Table 2 together with the probability associated to each individual component.
As already noted for concrete, it is crystal clear that cluster analysis leads to a better evaluation of the statistical parameters for steel rebars rather than the analysis of the whole dataset. Indeed, the proper identification of sub-classes allows the estimate of the coefficient of variation associated with each class to be significantly improved: the , which is 6% for the intermediate class and 13% for the upper and lower class, is sensibly smaller than the one resulting from the analysis of the whole dataset (). However, the coefficients of variation of the lower and upper classes are sensibly higher than the values usually suggested in the literature [26] for reliability analyses of existing structures, generally varying between 6% and 8%.
For the higher steel class, to which the ribbed bars belong, the increased scattering of data could be ascribed to the different production processes of various ribbed bar typologies adopted at that time. On the contrary, in the lower steel class, a positive bias can be appreciated with respect to the expected nominal resistances as codified in the structural standards in force at the time. This could be justified by the inclusion in the lower resistance steel classes of downgraded high strength steel rebars, not complying with requirements for upper steel classes.
5. Reliability Assessment of Existing R.C. Buildings under Different Degradation Conditions
Starting from the stochastic models for concrete and steel rebars derived in the previous section, this study focuses on the reliability of existing reinforced concrete buildings built in Italy during the 1960s and designed according the already mentioned R.D. 1939 [29].
At that time, the “allowable” or “permissible stress method” was the reference method for structural design [33]. As known, the method is based on a global safety factor affecting material strengths. The assessment consists of checking that the maximum calculated stresses, induced by the applied loads, , are lower than the allowable stress, , obtained by dividing the material’s resistance (e.g., yield stress in the rebars or compressive strength in concrete) by the pertinent global safety factor:
In [29], a permissible stress, , equal to was recommended for mild steel and equal to for medium and high strength steel rebars. For concrete, the allowable stress was generally derived by dividing the cubic resistance after 28 days, , by a safety factor equal to three, except for the “high strength” concrete, as defined at that time, characterized by , for which a higher stress value was allowed, according to the following equation:
It must be underlined that the use of medium and high strength steel rebars was allowed only in association with the above defined “high strength” concrete.
Assuming the use of a “high strength” concrete (, ) and the two categories “mild steel” () and “medium” or “high strength” steel rebars (), the design of a simply supported r.c. slab subjected to both permanent and variable load is first carried out and then the time-dependent reliability is evaluated.
In the spirit of [19], in the design exercises an allowable stress , like for mild steel, is adopted when reinforcing steel class 1 is considered for reliability analysis, while an allowable stress , like for medium and high strength steel, is adopted when reinforcing steel classes 2 and 3 are taken into account.
The permanent loads (self-weight of the slab and remaining permanent loads, such as finishes etc.) acting on the simply supported slab with a span is assumed to be equal to , while for variable loads, depending on the building’s category, values in line with the common design assumptions adopted at the time are considered. These values are, obviously, not significantly different from those adopted in the modern standards for imposed loads on structures.
Making reference to previous engineering experience, the total height of the slab is set to for an effective height [34].
From the statistical point of view, the permanent load and the variable load are modelled as in Table 3, in line with the models recommended by the Joint Committee on Structural Safety (JCSS) [35]. The pdfs derived in the previous section are adopted for concrete and steel classes for initial structural resistance.
For the reliability calculation the following limit state function, as given in [34], is adopted.
The degraded resistance is obtained by multiplying the initial resistance for a suitable degradation function , according to Equation (1).
For time-dependent reliability assessment of aging structures, structural deterioration is often modeled using equations of the form [23,36,37,38]
where and are the parameters governing the deterioration process, which can be determined from an analysis of experimental data, is a zero-mean stochastic process, which takes into account the randomness of the observed data, and denotes the random time required to initiate the deterioration.
In Equation (11), the exponent can be assumed , if the damage process is strictly diffusion controlled, or , if the process is strictly rate controlled, such as in case of the corrosion of the reinforcement.
Obviously, relations such as Equation (11) are essentially empirical and depend on environmental conditions, and it is very difficult to generalize them to cover situations where no experimental data are available.
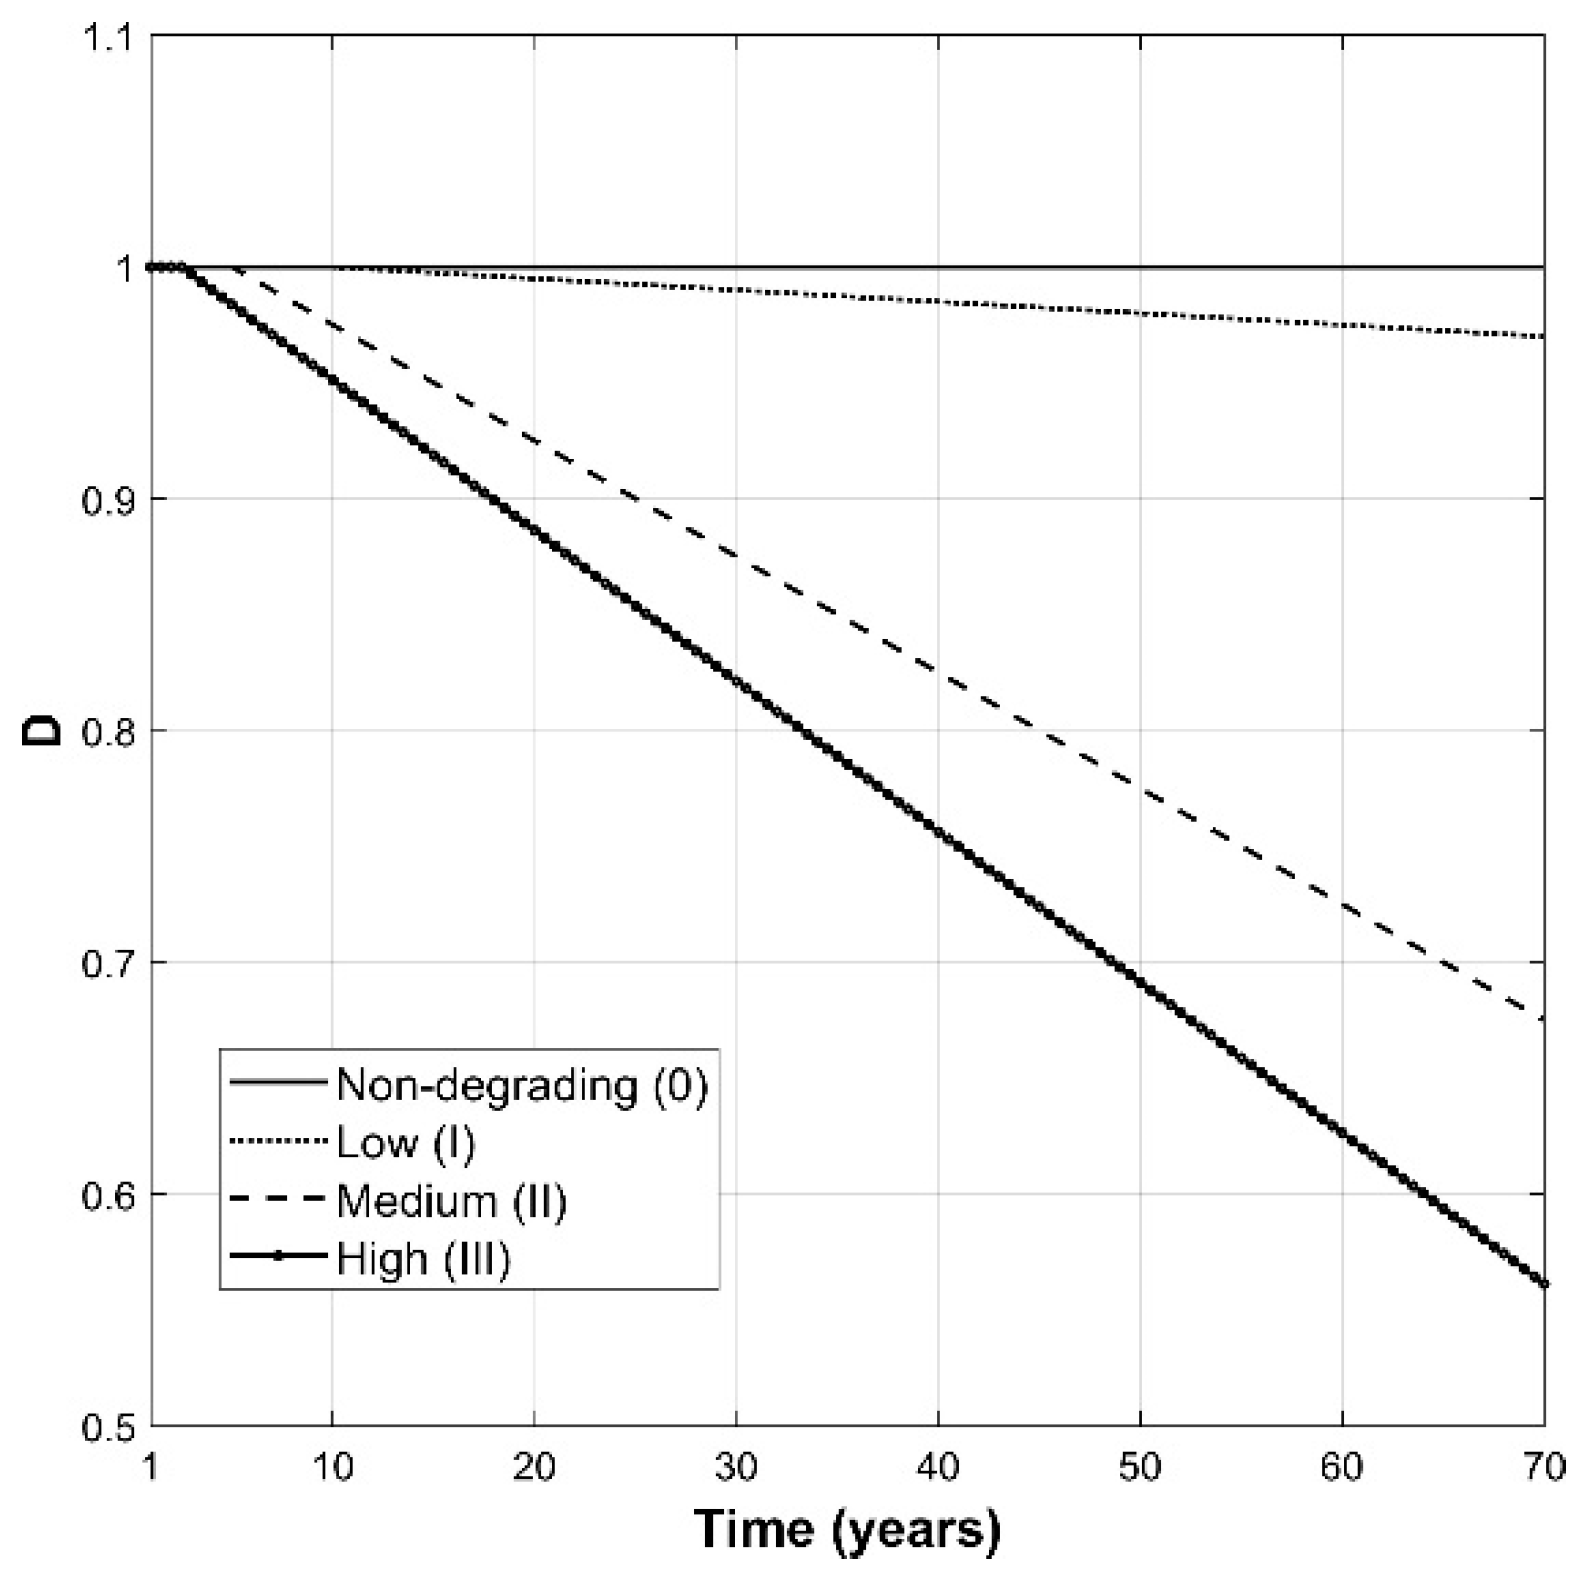
In the following reliability analysis, a sensitivity study is carried out taking into account four degradation conditions, associated with zero, low, medium and high rate of the corrosion, respectively [36].
In the present study, it has been assumed that degradation affects mainly the steel reinforcement. The adopted parameters for the steel degradation conditions, which are based on the parametric studies of reinforced concrete beams subjected to corrosion attack carried out in [39], are summarized in Table 4.
The time-degradation curves, representing the four investigated degradation conditions given in Table 4, are illustrated in Figure 5. It must be underlined that in 70 years the three degrading conditions, I, II and III, lead to a reduction of the steel section of about 3%, 33% and 44%, respectively.
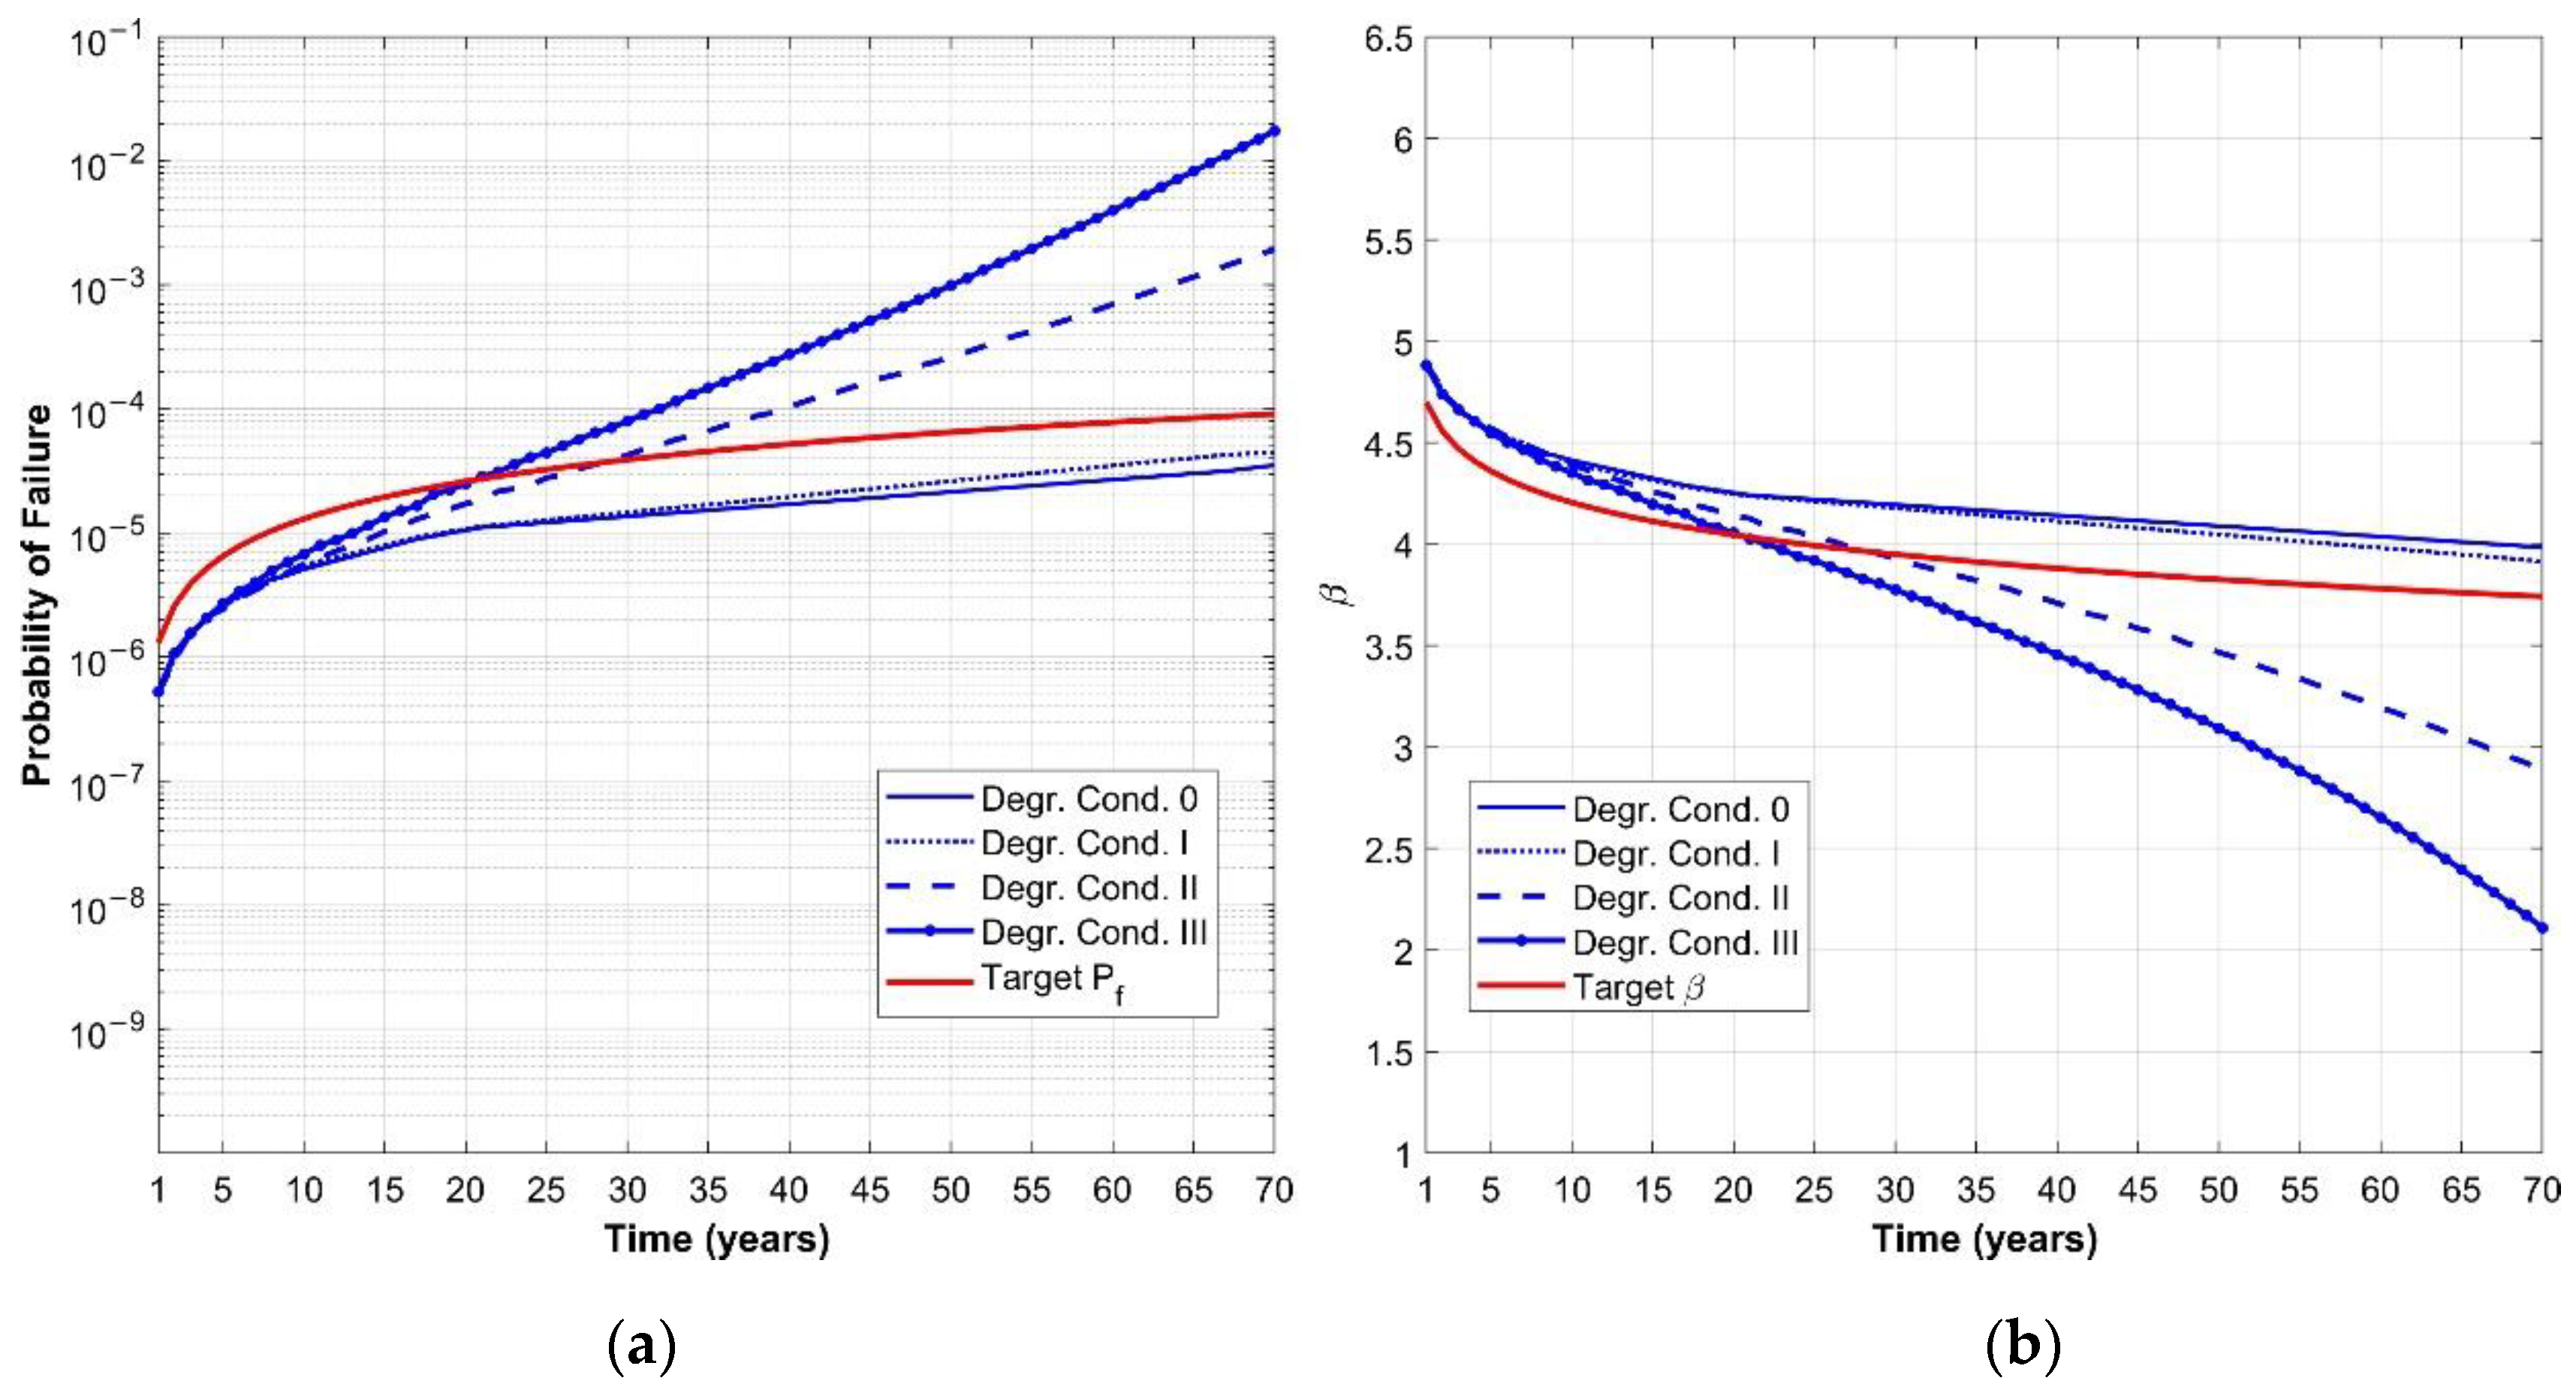
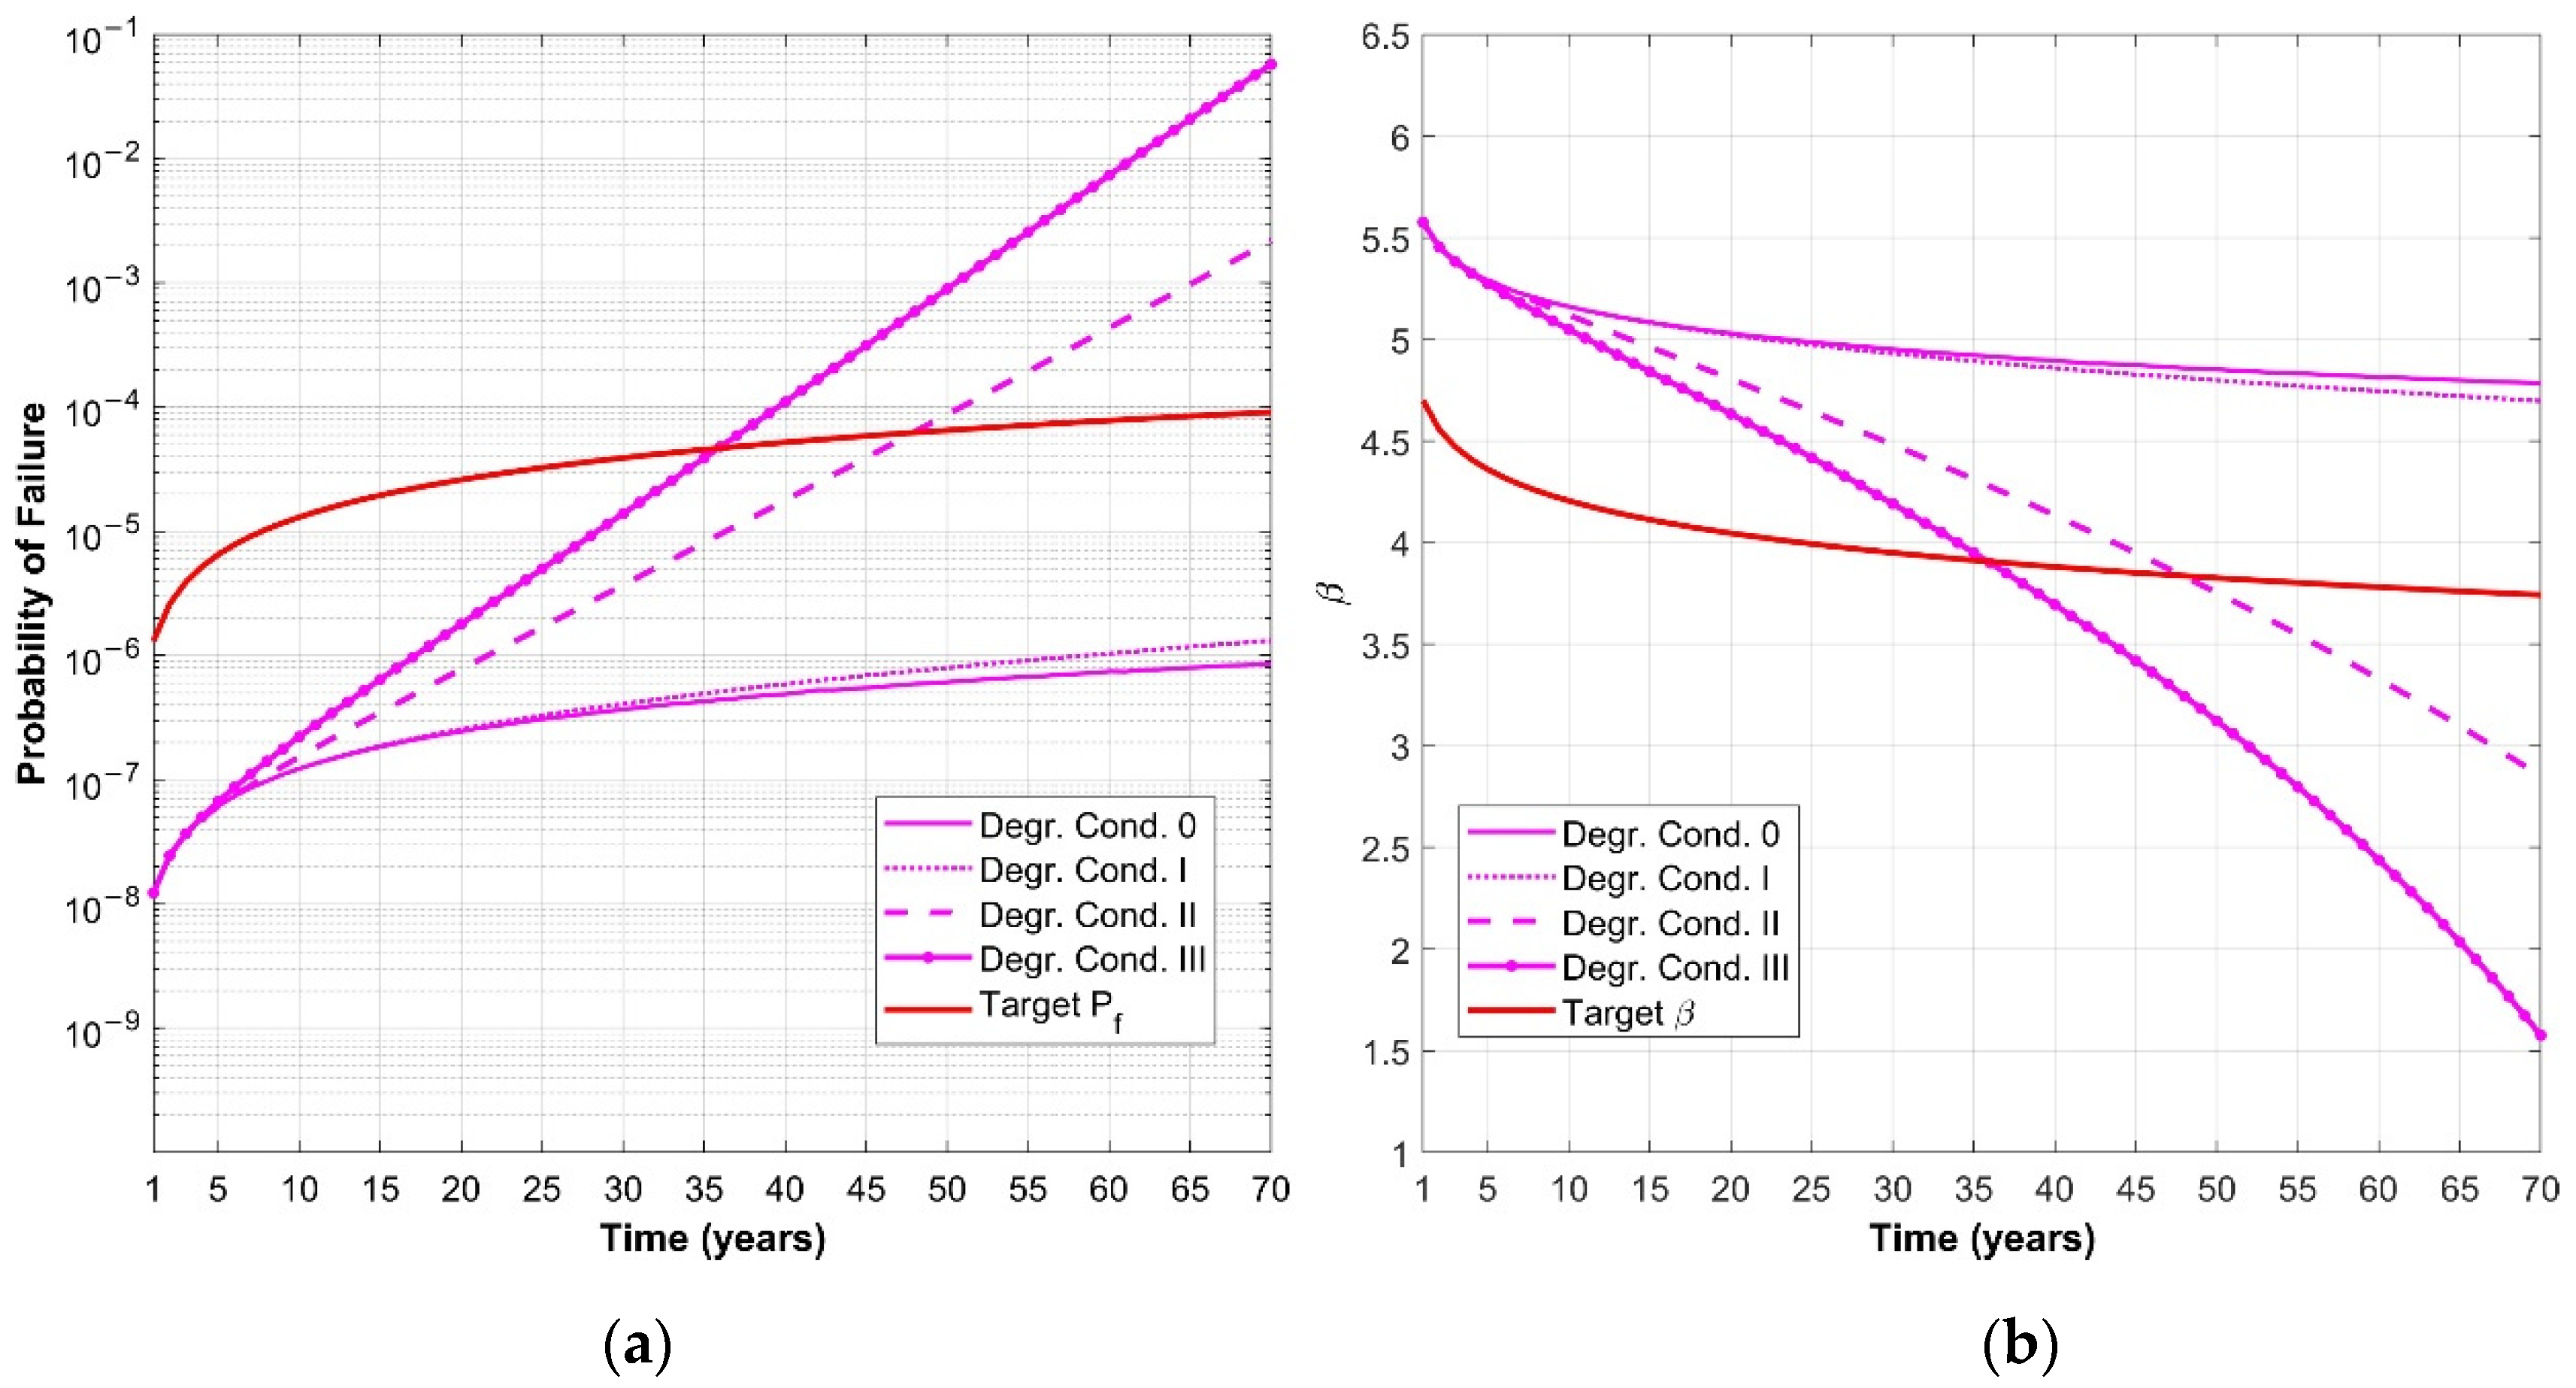
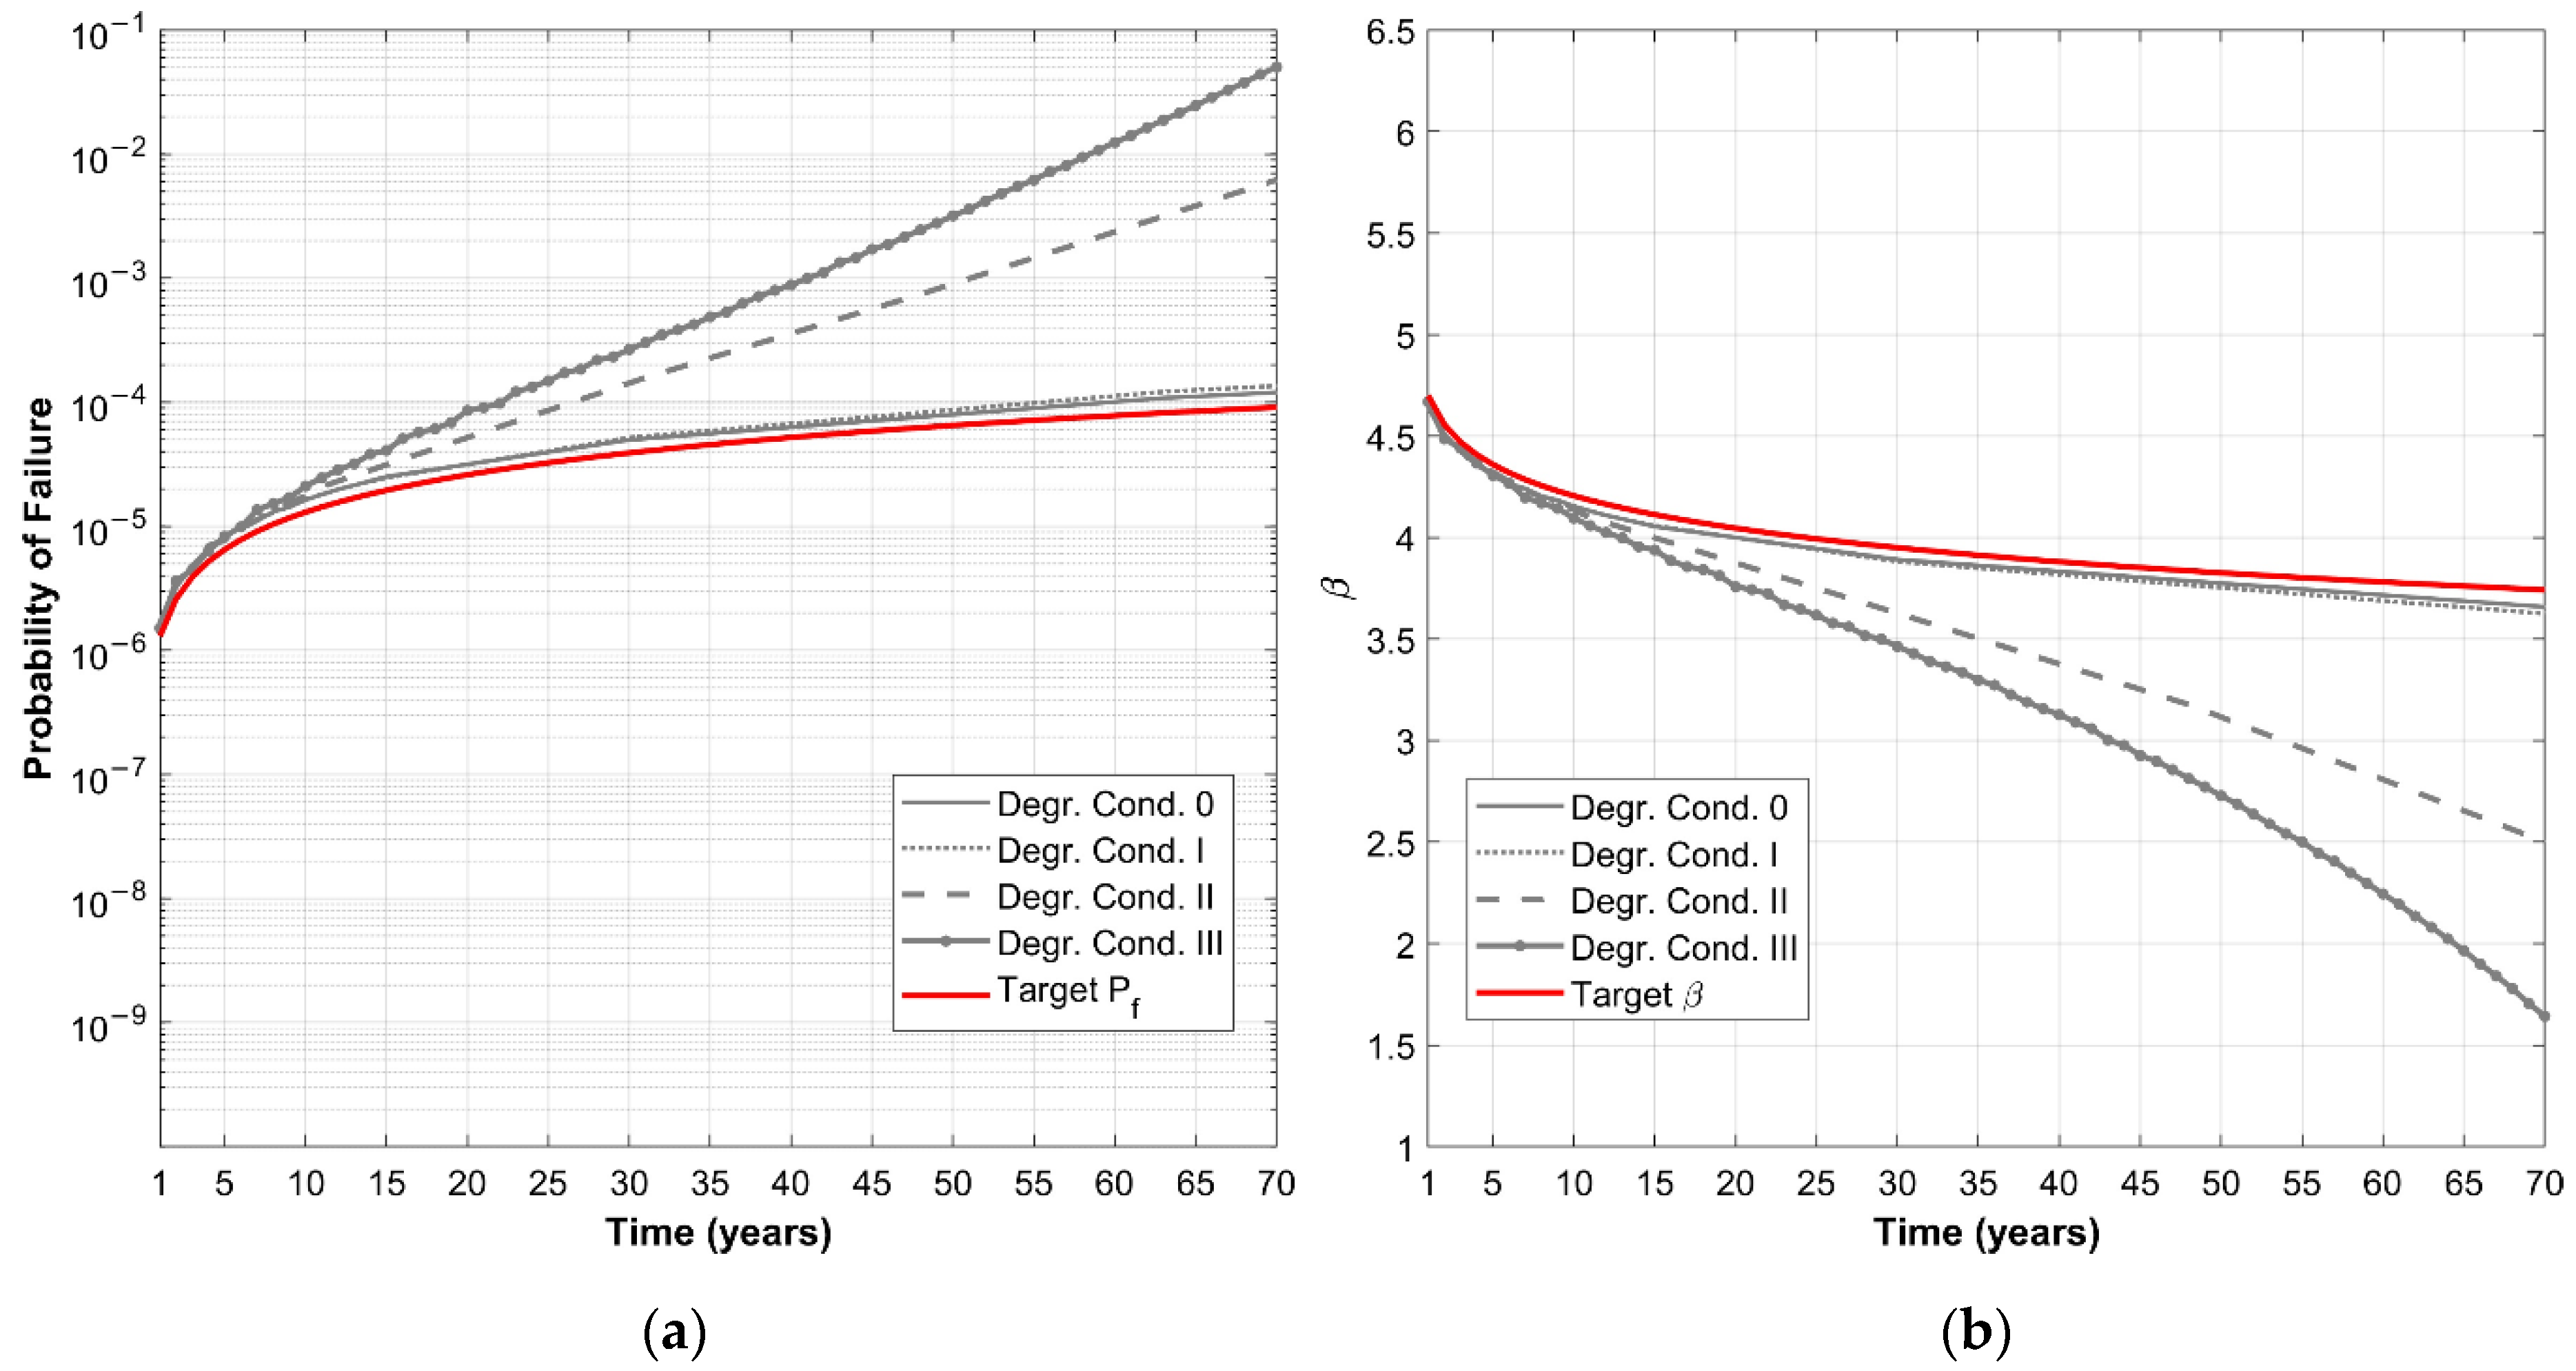
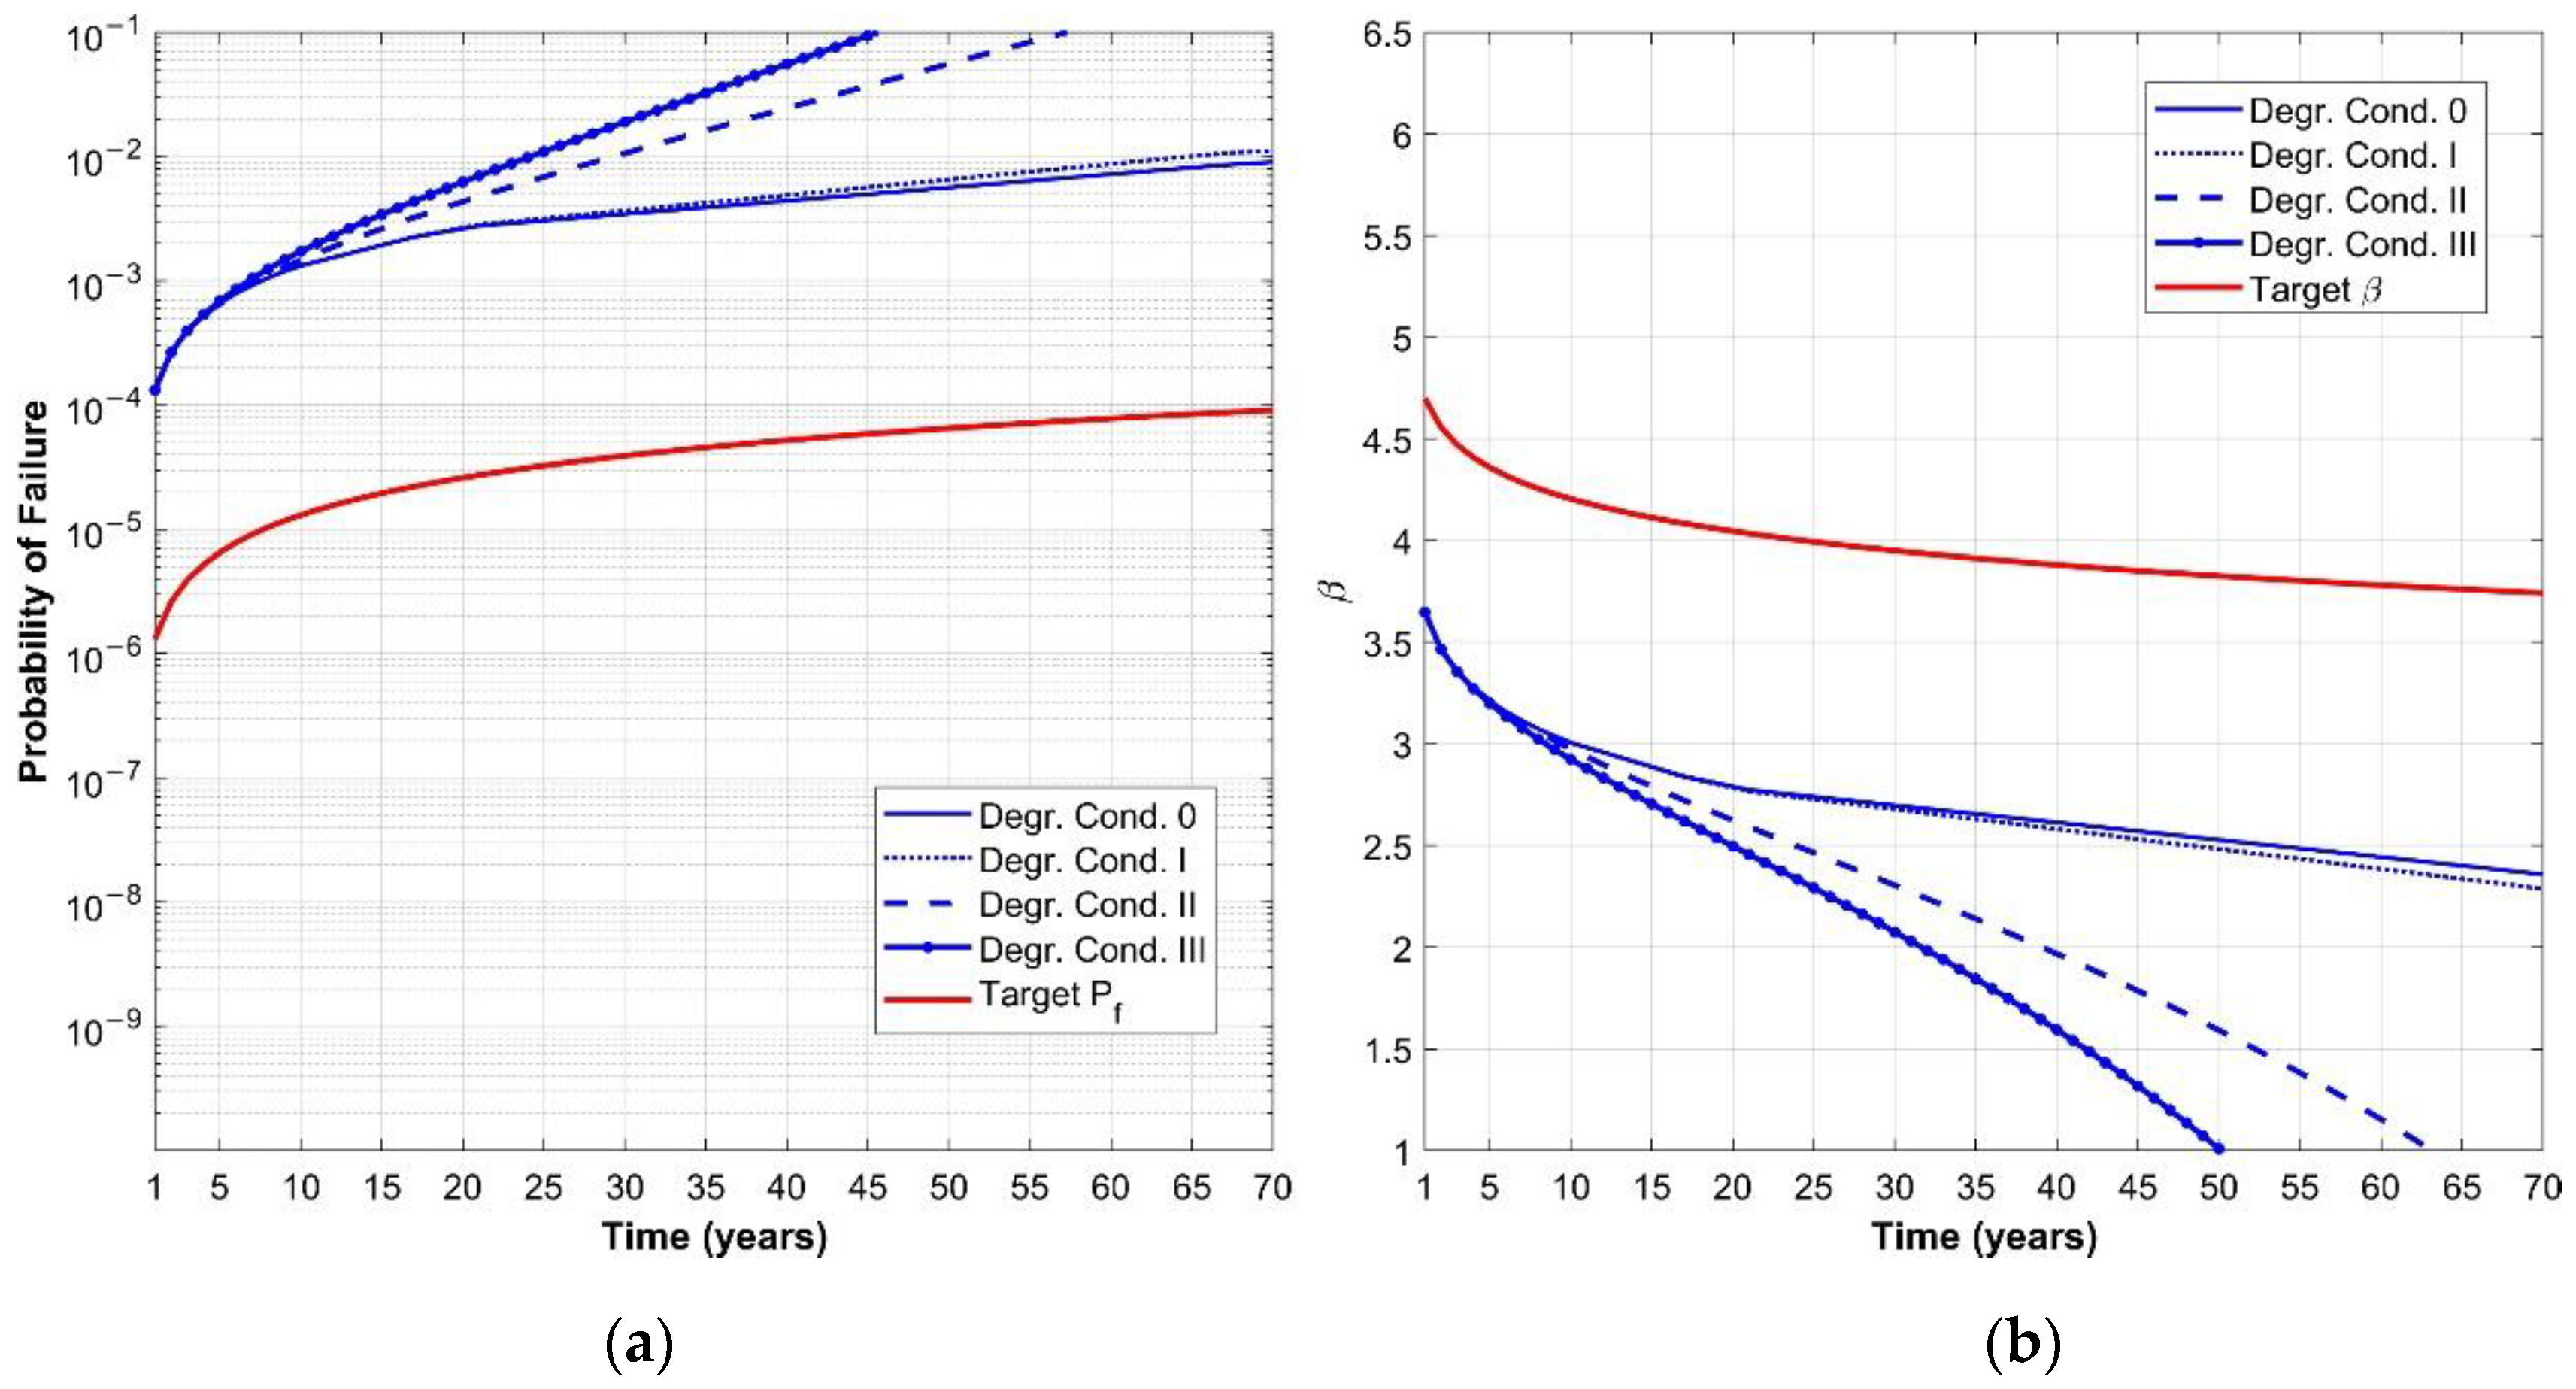
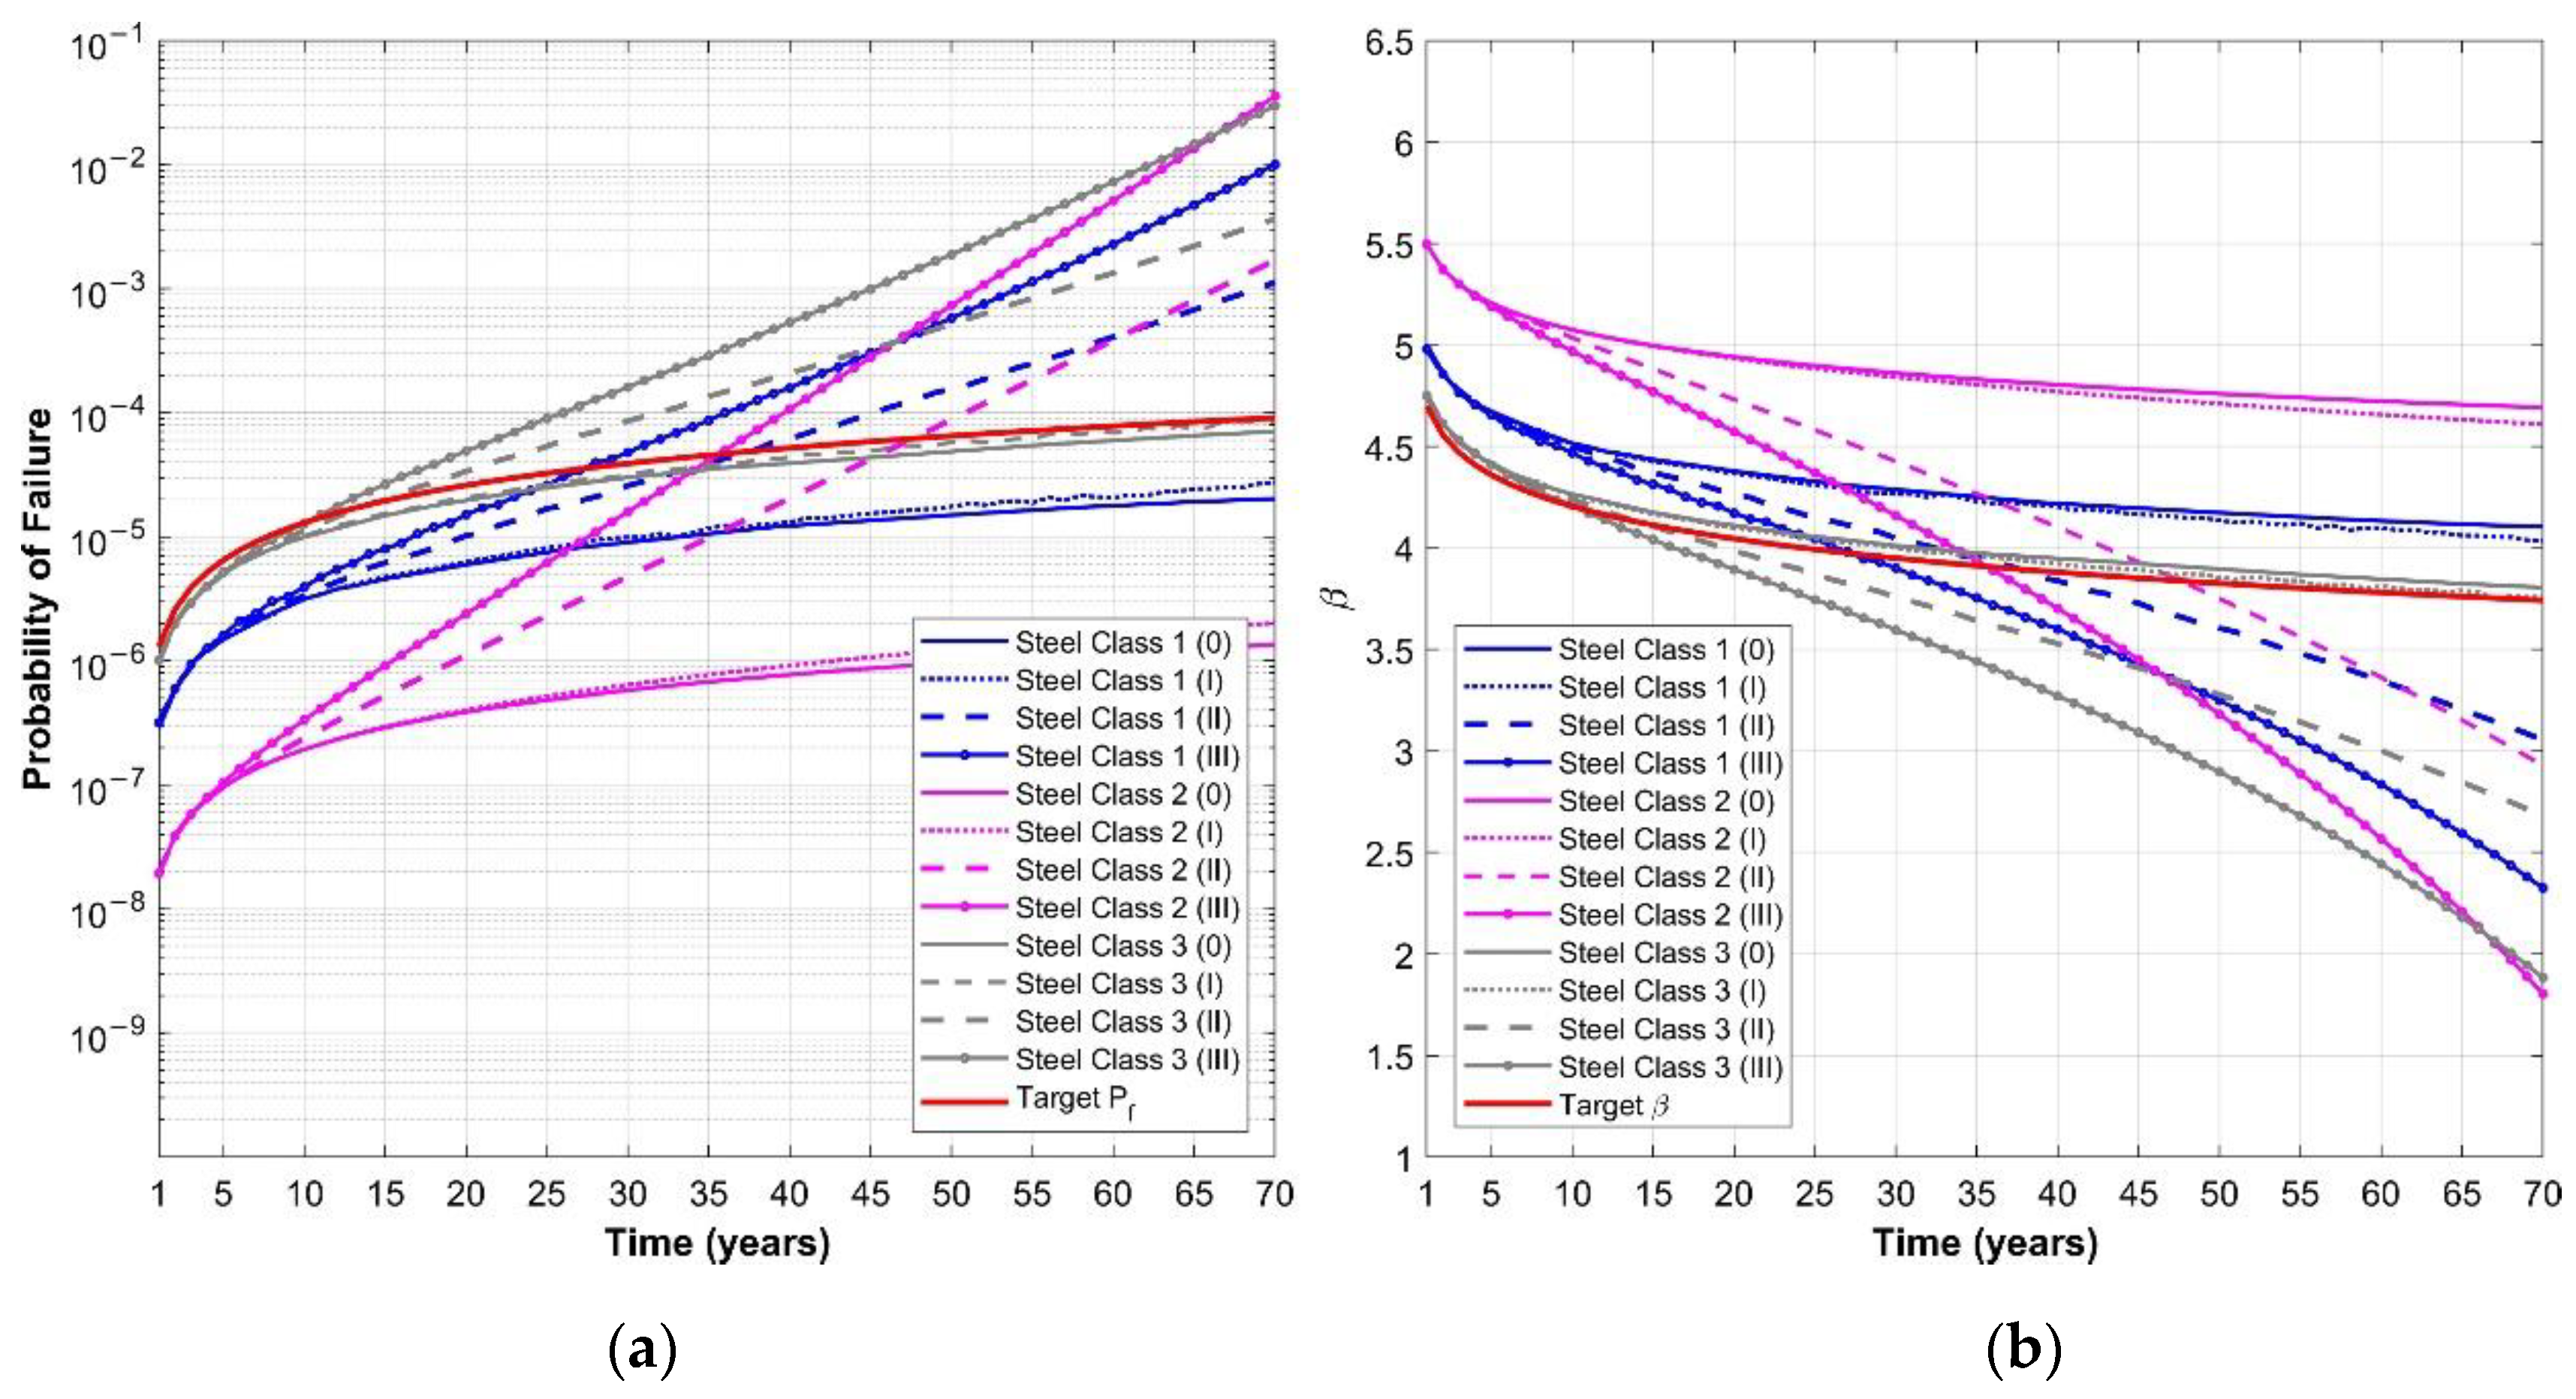
The results of the time-dependent reliability analysis are illustrated, for each of the investigated deterioration conditions, in Figure 6, Figure 7 and Figure 8 for typical residential buildings. More precisely, Figure 6 refers to steel class 1, Figure 7 to steel class 2 and in Figure 8 to steel class 3.
In the assessment the three different steel classes previously derived are taken into account, while for concrete, strength class 3 (, ) is adopted. In particular, the variations of the probability of failure, , and of the reliability index, , over time are shown.
For the sake of a direct comparison with target reliability values intended to represent modern design approaches for new structures, the curves are compared with the variation of target reliability levels over time as defined in the Eurocodes, represented in the diagrams by red curves [17], but it is obvious that for existing structures some limited reduction in the reliability index is often accepted. As previously remarked, the plotted time variation of the reference probability of failure (as well as the reference target reliability index) refers to structures whose design is governed by the effects of the time-variant components in the limit state equation.
Inspecting the diagrams in Figure 6, Figure 7 and Figure 8, it clearly appears that when the reinforcing steel is subjected to degradation condition I, the rate of resistance loss is so small that the failure probability is comparable to that obtained for non-degrading steel.
From the examination, it can be seen that:
- Under degradation conditions 0 and I:
- -
- if the rebars belong to reinforcing steel class 1, the structural reliability satisfies the minimum modern requirements;
- -
- if the rebars belong to reinforcing steel class 3, the structural reliability is in accordance with the required minimum target levels;
- -
- while if the rebars are reinforcing steel class 2, even higher reliability than that in the Eurocodes for new structures can be achieved.
- Under degradation conditions II and III, confirming similar observations for some r.c. bridge girders [36], the failure probability increases significantly, reaching unacceptable values, in particular approaching the end of the service life, thus stressing the importance of maintenance interventions.
Another interesting observation regards the performance of reinforcing steel class 3 compared to reinforcing steel class 2. Notwithstanding the higher mean strength value for class 3, the reliability analysis indicates that a lower reliability index (i.e., higher failure probability) is expected to be found with respect to structures where reinforcing steel class 2 is used, and this is motivated by the higher coefficient of variation (13% instead of 6%). Moreover, as the relevant literature generally reports for steel rebars, the reliability indexes thus evaluated are unsafe sided also for steel class 1, characterized by .
These results confirm the relevance of the proposed methodology: the reliability assessment of existing structures, based on limited in-situ test results, may result in the adoption of high mean strength values, which can lead, when associated with small values of deduced from the literature, to an unjustified overestimation of the reliability index of the investigated structure.
The remarks are particularly relevant for the correct implementation of modern codes and standards for the assessment of existing structures. Regarding the assessment, these codes (e.g., EN1998-3 [40]) generally deserve great attention and importance should be given to the mean values of the materials’ relevant properties, measured by means of in-situ tests on the structure being investigated. This approach is clearly justified in the design phase by the need to assess the actual properties of structural materials and not to pre-judge them only on the basis of available documentation or the practice at the time of the construction, also considering that, on the other hand, as discussed previously, the possibility of carrying out an extensive testing campaign to get an adequate representation of the statistical parameters of the properties of the materials is frequently precluded.
It must be stressed again that the use of these estimations of the mean value of the relevant properties is mainly devoted to back-calculating, applying suitable reduction factors, the design values to be adopted in the assessments. To clarify the remark, an additional case has been analyzed for the residential building considered here, hypothesizing that steel class 1 is used.
Assuming that the mean value previously determined for the reinforcing steel class 1 represents the actual properties of the reinforcing steel of the structure, is the mean value of yielding strength derived from five or six tests on samples directly extracted from the structure.
According to the already mentioned EN1998-3 [40], these results lead to an allowable stress , much higher than the allowable stress permitted at the time of construction, which was . This assumption, generally acceptable when the of the yield stress complies with reference values (i.e., ), can produce unsafe results, when higher characterizes the actual distribution. Indeed, if adopting , the verification would have led to an unjustified overestimation of the element’s reliability. Consequently, for that element it would be possible evidently unsafe-sided increases of permanent and variable loads for refurbishment purposes or change in use. The increase of the total load () resulting from the increase from to of the allowable stress of the reinforcement is about 40%. Considering that increased load, the time-dependent reliability curves for a r.c. element with reinforcing steel class 1, previously illustrated in Figure 6, become those reported in Figure 9.
Inspecting Figure 9 it clearly appears that the element’s reliability is much lower than expected following the possible indications of modern assessment standards.
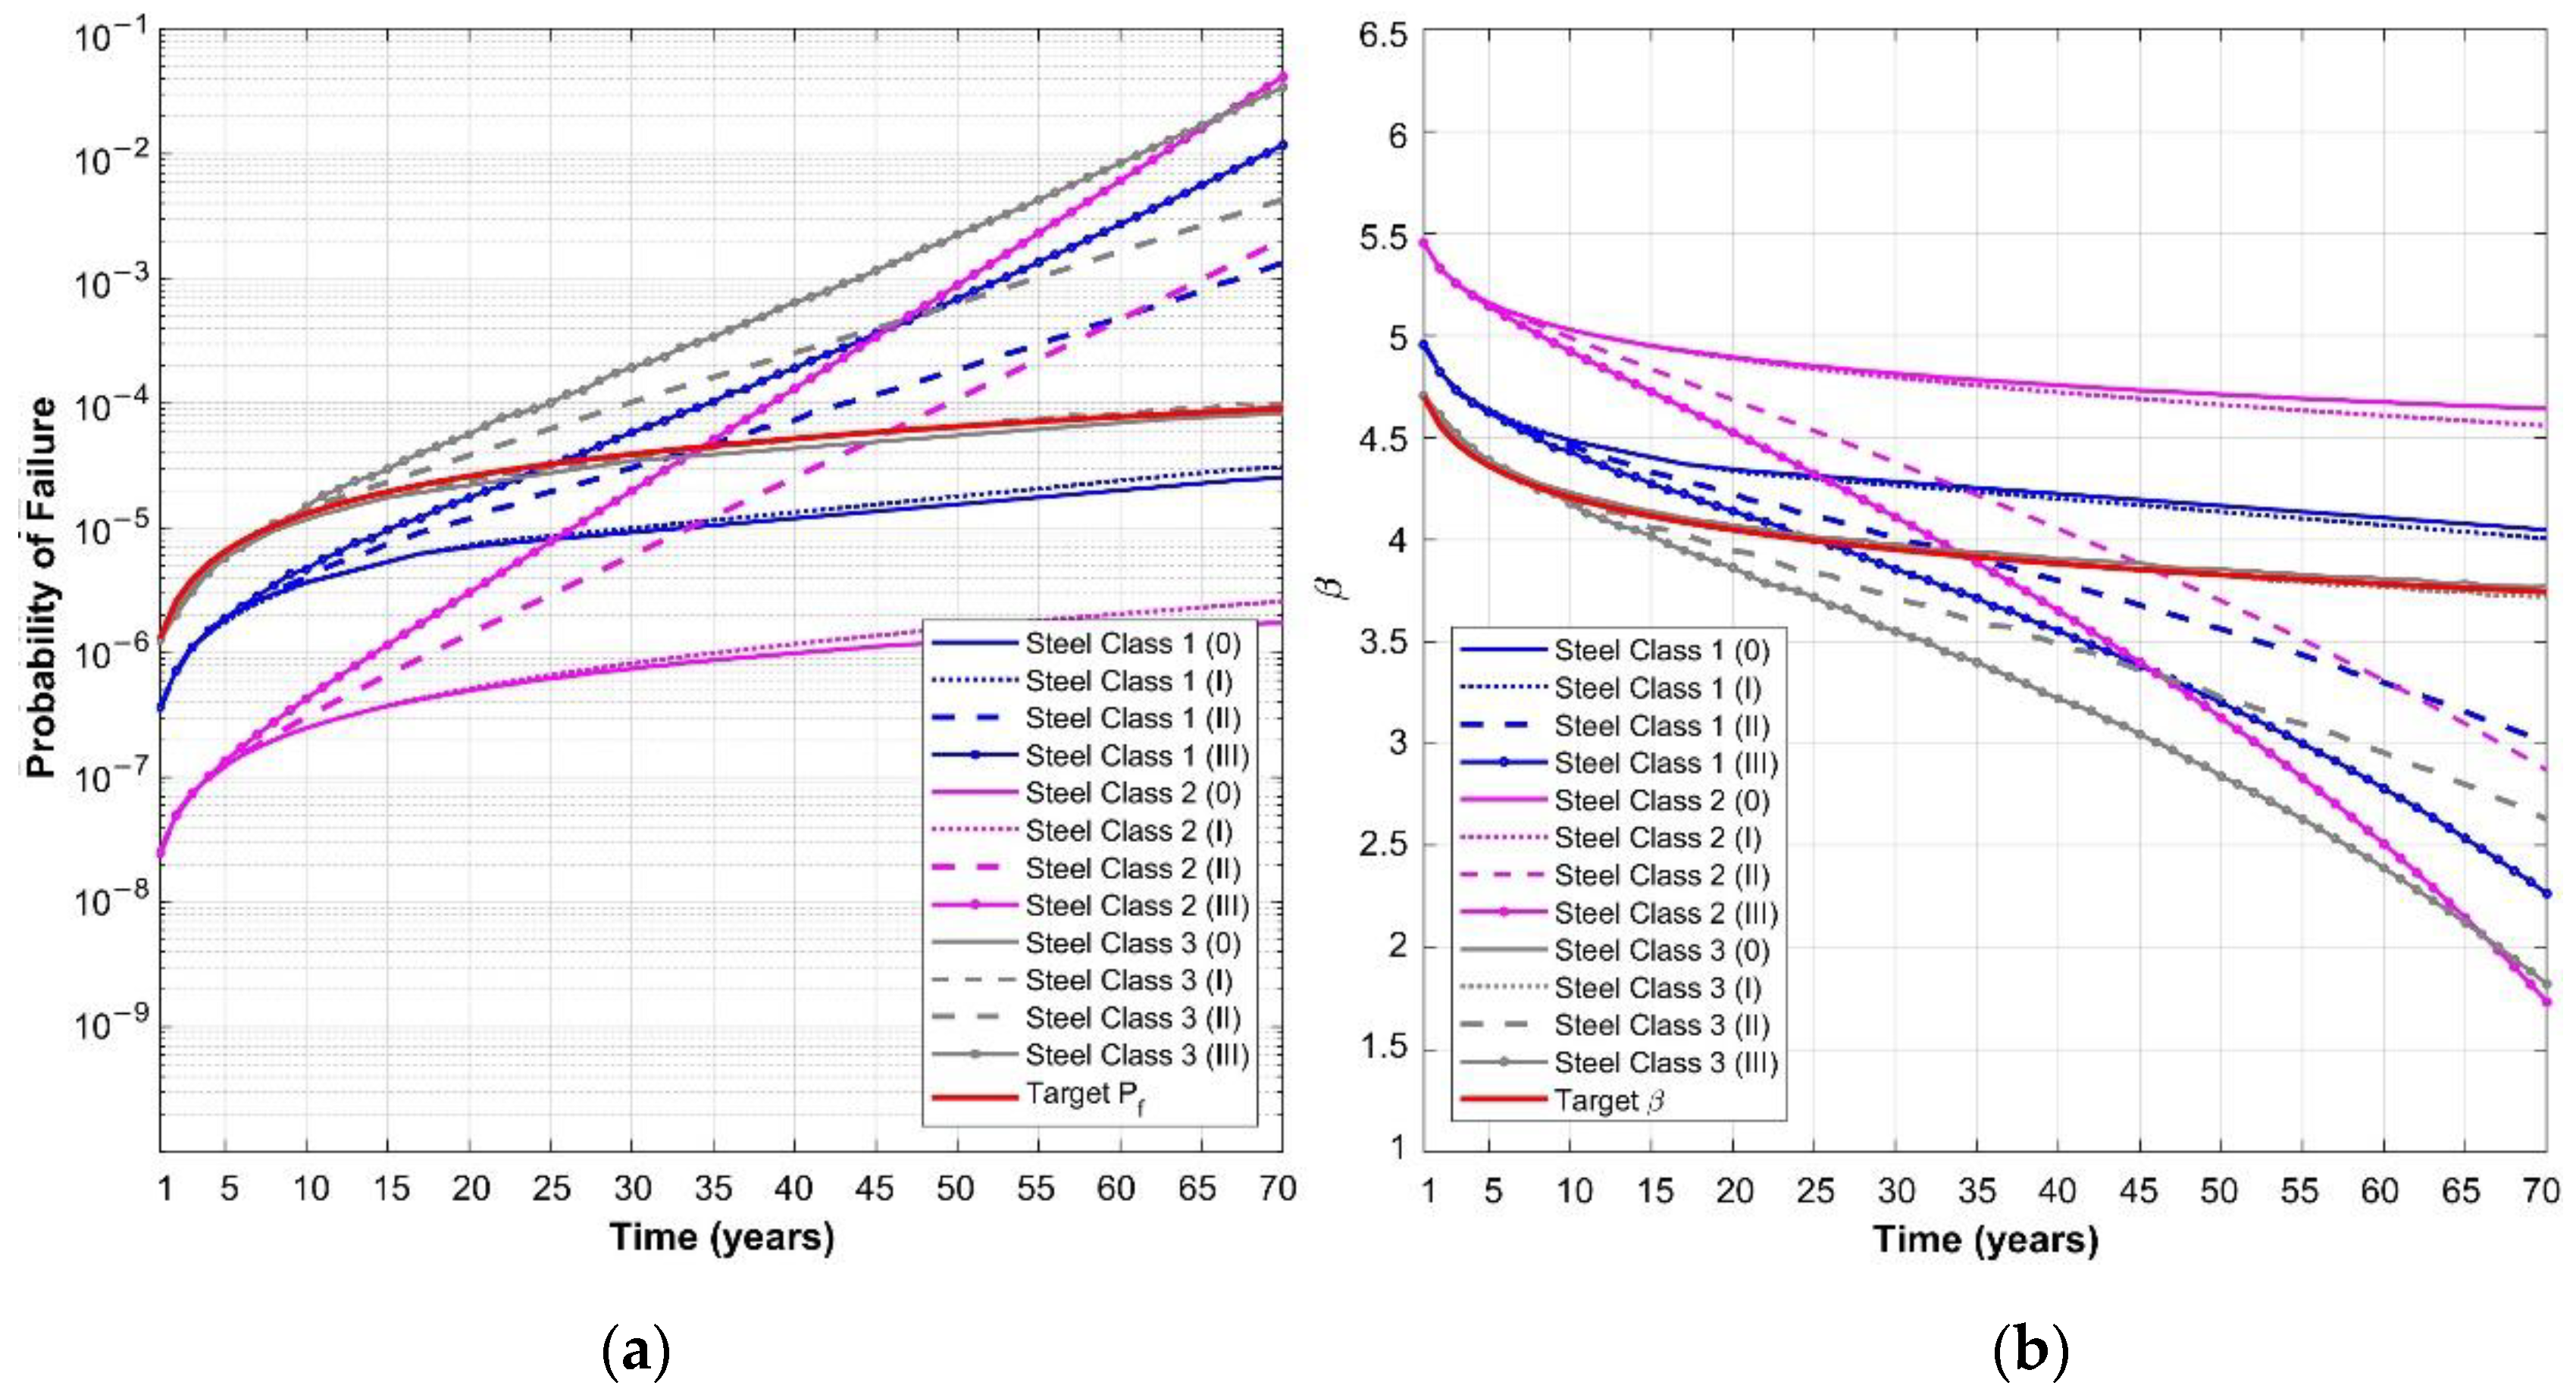
Time-dependent reliability curves, summarized for residential buildings in Figure 6, Figure 7 and Figure 8, have been derived for shopping and storage buildings too as illustrated in Figure 10 and Figure 11 respectively.
In the figures the four different degradation conditions are considered for each one of the three reinforcing steel classes derived from the cluster analyses. The diagrams confirm that also for these building’s categories, the influence of degradation conditions on different reinforcing steel classes produces similar effects as for the residential buildings.
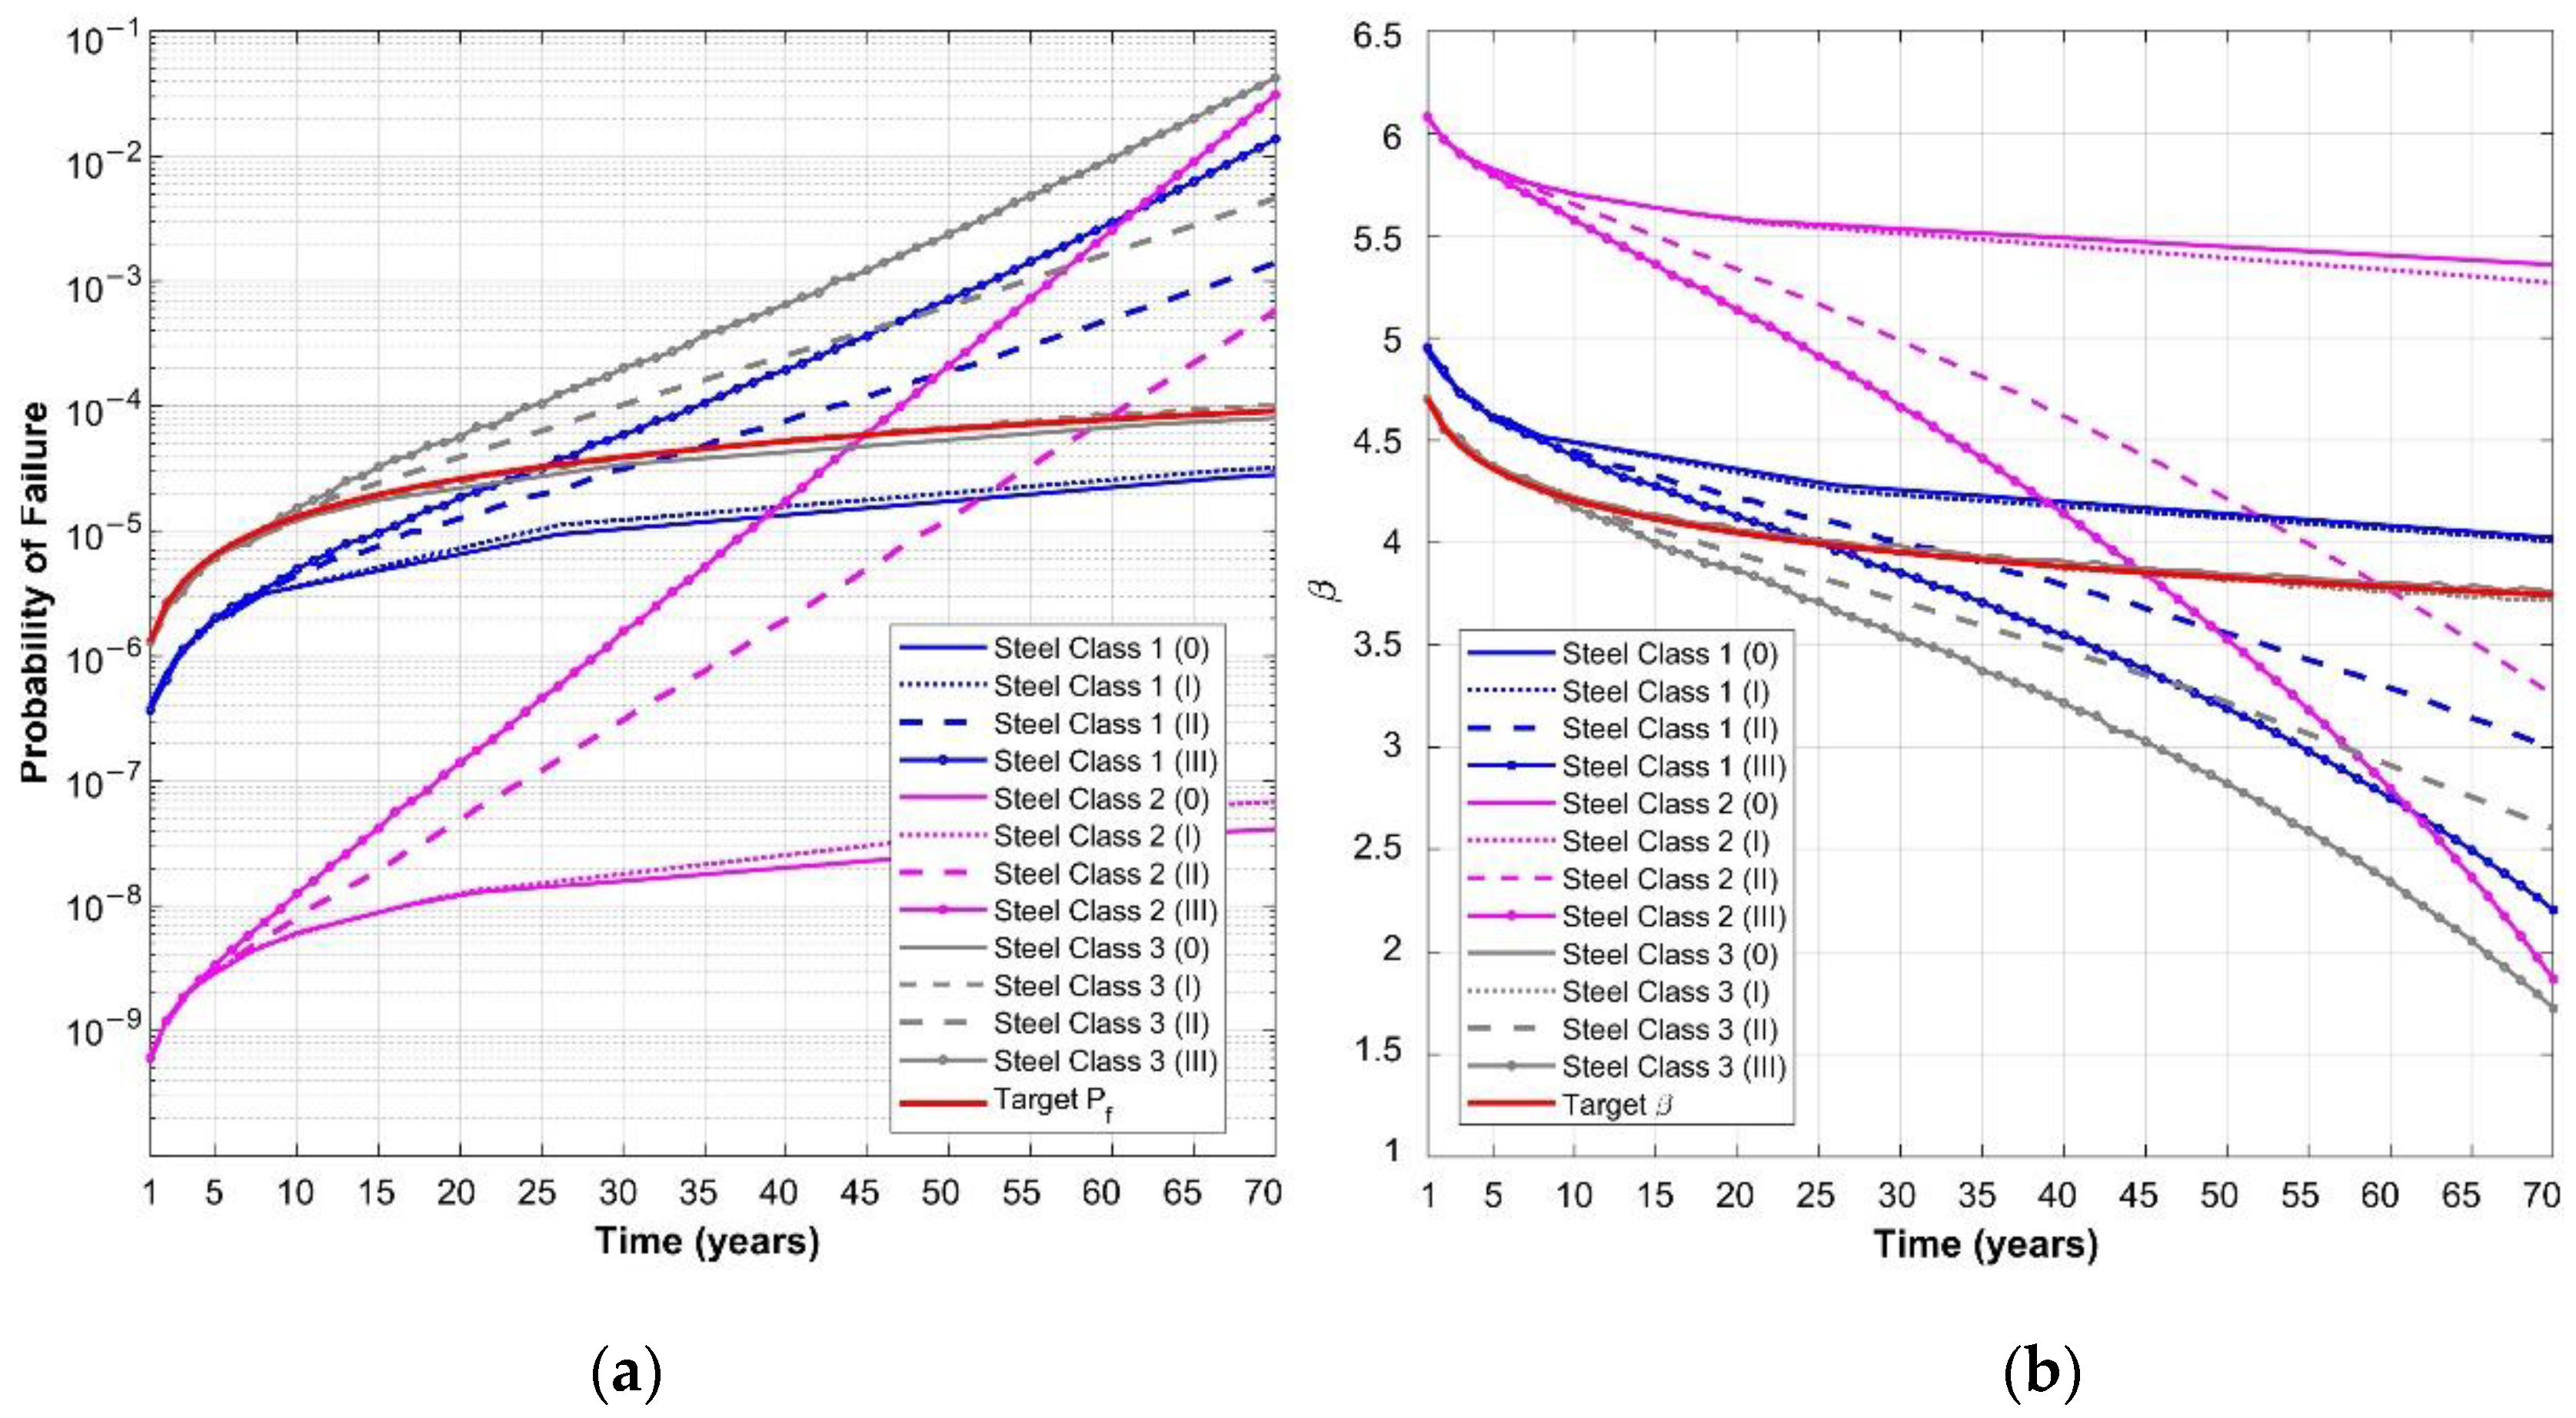
In order to evaluate the influence of different concrete classes on the time-dependent reliability, the analyses over time can be easily extended also to r.c. structures characterized by higher or lower quality concrete class than that assumed above (concrete class 3).
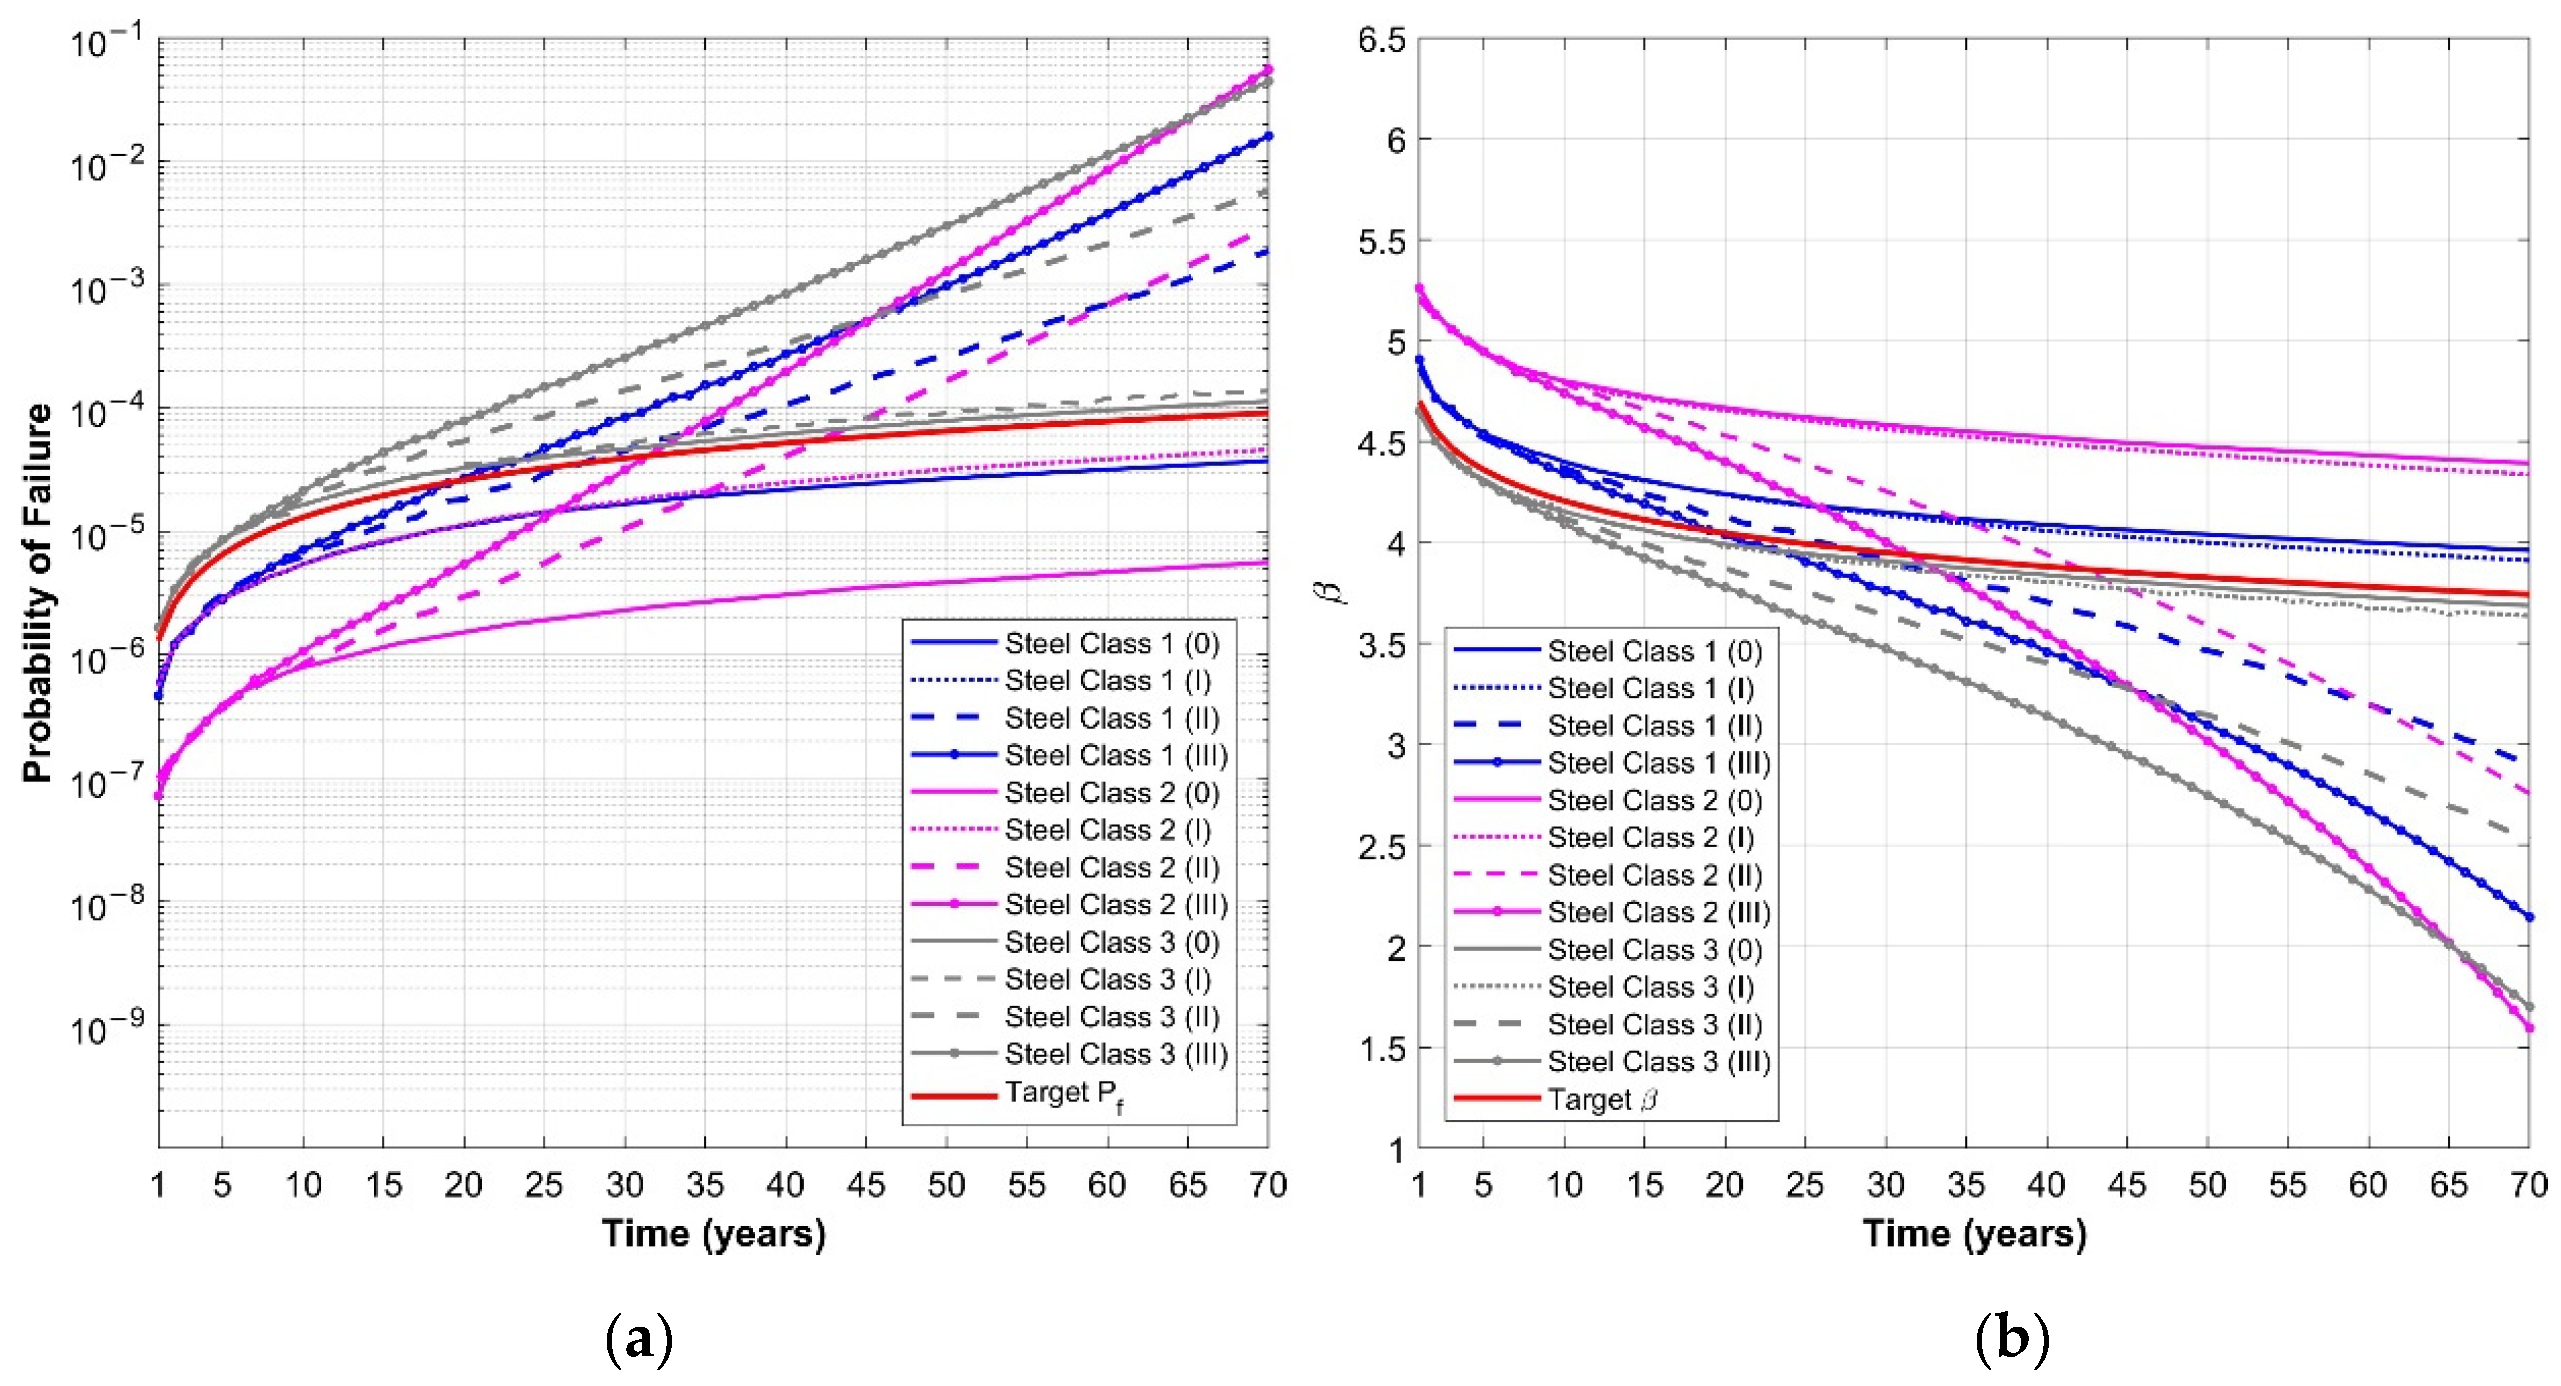
The study is concentrated on shopping buildings, for which concrete class 2 (, , ) and concrete class 4 (, , ) are also considered in the analysis.
The time-dependent reliability curves obtained for the various steel degradation conditions and reinforcing steel classes are reported in Figure 12 for concrete class 2 and in Figure 13 for concrete class 4, to be compared with those illustrated in Figure 10 for concrete class 3.
The comparison shows that, as expected, the reliability increases as the decreases, i.e., moving from concrete class 2 to concrete class 4. On the contrary, the differences in reliability depend only on the degradation condition, being nearly constant over time for a given degradation condition.
6. Conclusions
Life cycle assessment is a fundamental tool to support decisions on retrofitting interventions on existing structures and for their prioritization.
Since reliability assessment is highly influenced by the statistical parameters of material properties, a specific preliminary study is needed, covering both historical data and in-situ test results. In real cases, the possibility to carry out enough tests is generally very limited and they are unlikely to obtain an adequate statistical description of the mechanical parameters.
In this study, a methodology for the time-dependent reliability analyses of existing structures is presented, also referring to relevant cases studies.
The implementation of the method relies also on a special procedure to evaluate material properties and their statistical parameters, based on cluster analysis. The cluster analysis, based on a Gaussian mixture model, is generally applicable, and it allows individual components belonging to a mixed population to be identified. This methodology is particularly adequate when databases of raw test results need to be analyzed. In fact, it allows homogenous material classes and the probability density functions associated to their mechanical properties to be identified and does not require any a priori assignment of relevant clusters, resulting in it being independent from engineering judgment or any other influence related to the user’s skill.
The method has been applied to thousands of historical test results, dating back to the 1960s, concerning concrete compressive strength and yield stress of steel rebars, allowing resistance classes for both materials to be identified and a sound estimation of the related statistical parameters to be obtained. Thanks to the great number of analyzed test results, the outcomes of the proposed methodology are particularly relevant for the estimation of the of mechanical properties in the reliability assessment of r.c. structures coeval with the samples in the database. Results presented in this work are particularly relevant taking into account that a large part of the built environment in Italy and, more generally, in Europe dates back to the decade 1960–1970. In fact, according to the Italian National Institute of Statistics [41], around 30% of Italian r.c. buildings were built in the period 1950–1970 (19% in the decade 1960–1970).
To illustrate the application of the methodology, time-dependent reliability analyses for significant case studies, consisting of r.c. elements part of residential, shopping and storage buildings, have been carried out, focusing on the effects of corrosion in steel rebars, under different environmental conditions, resulting in no degradation to high degradation effects.
Time-dependent reliability trends have been compared with the reliability targets in the Eurocodes, showing quite satisfactory results under no or low-degradation conditions, with an exception made for steel class 3, which despite being associated to the highest mean yielding stress among the examined classes shows a higher ; these results confirm the importance of a proper evaluation of statistical parameters for the variables in the limit state function. Results for medium and high corrosion rates show that the reliability becomes quite soon too low, even accepting a reduction of the target reliability values for existing structures.
Concerning the influence of the concrete class, the study confirms that, as expected, the reliability increases as the decreases, i.e., moving from concrete class 2 to concrete class 4, while differences in reliability depend only on the degradation condition, being nearly constant over time for a given condition.
Further studies are being developed, based on the promising achievements in this work.
Author Contributions
Conceptualization, P.C., P.F. and F.L.; methodology, P.C., P.F. and F.L.; software, P.C., P.F. and F.L.; validation, P.C., P.F. and F.L.; writing—original draft preparation, P.C., P.F. and F.L.; writing—review and editing, P.C., P.F. and F.L.; resources, P.C. All authors have read and agreed to the published version of the manuscript.
Funding
This research received no external funding.
Conflicts of Interest
The authors declare no conflicts of interest.
References
- Strauss, A.; Hoffmann, S.; Wendner, R.; Bergmeister, K. Structural assessment and reliability analysis for existing engineering structures, applications for real structures. Struct. Infrastruct. Eng. 2009, 5, 277–286. [Google Scholar] [CrossRef]
- Bastidas-Arteaga, E. Reliability of Reinforced Concrete Structures Subjected to Corrosion-Fatigue and Climate Change. Int. J. Concr. Struct. Mater. 2018, 12, 10. [Google Scholar] [CrossRef] [Green Version]
- Frangopol, D.M.; Soliman, M. Life-cycle of structural systems: Recent achievements and future directions. Struct. Infrastruct. Eng. 2015, 12, 1–20. [Google Scholar] [CrossRef]
- Frangopol, D.M. Life-cycle performance, management, and optimization of structural safety under uncertainty: Accomplishments and challenges. Struct. Infrastruct. Eng. 2011, 7, 389–413. [Google Scholar] [CrossRef]
- Yanweerasak, T.; Pansuk, W.; Akiyama, M.; Frangopol, D.M. Life-cycle reliability assessment of reinforced concrete bridges under multiple hazards. Struct. Infrastruct. Eng. 2018, 14, 1011–1024. [Google Scholar] [CrossRef]
- Croce, P.; Marsili, F.; Klawonn, F.; Formichi, P.; Landi, F. Evaluation of statistical parameters of concrete strength from secondary experimental test data. Constr. Build. Mater. 2018, 163, 343–359. [Google Scholar] [CrossRef]
- Beconcini, M.L. Laboratorio Delta: Indagini sui Materiali Sulle Strutture e Sul Sottosuolo; Pacini Fazi: Lucca, Italy, 2018. (In Italian) [Google Scholar]
- EN13791 Assessment of In-Situ Compressive Strength in Structures and Precast Concrete Components; CEN: Brussels, Belgium, 2019.
- EN12504-1, Testing Concrete in Structures. Cored Specimens. Taking, Examining and Testing in Compression; CEN: Brussels, Belgium, 2019.
- EN12504-2, Testing Concrete in Structures. Non-Destructive Testing. Determination of Rebound Number; CEN: Brussels, Belgium, 2012.
- EN12502-3, Testing Concrete in Structures. Determination of Pull-Out Force; CEN: Brussels, Belgium, 2005.
- EN12502-3, Testing Concrete. Determination of Ultrasonic Pulse Velocity; CEN: Brussels, Belgium, 2005.
- ACI214.4 R10: Guide for Obtaining Cores and Interpreting Compressive Strength Results; American Concrete Institute: Farmington Hills, MI, USA, 2016.
- Italian Public Works Council. Guidelines for the Evaluation of In-Situ Concrete Properties; Ministry of Infrastructures: Rome, Italy, 2017. (In Italian)
- Italian Public Works Council. Memorandum for Application of Italian Building Code, N. 7; Italian Official Journal, Istituto Poligrafico e Zecca dello Stato: Rome, Italy, 2019. (In Italian) [Google Scholar]
- Croce, P.; Formichi, P.; Landi, F.; Marsili, F.; Puccini, B.; Zotti, V. Statistical Parameters of Steel Rebars of Reinforced Concrete Existing Structures. In Proceedings of the ESREL2020-PSAM15, Venice, Italy, 21–26 June 2020. (accepted for publication). [Google Scholar]
- EN 1990—Eurocode—Basis of Structural Design; CEN: Brussels, Belgium, 2002.
- Croce, P.; Formichi, P.; Landi, F. Climate Change: Impacts on Climatic Actions and Structural Reliability. Appl. Sci. 2019, 9, 5416. [Google Scholar] [CrossRef] [Green Version]
- Croce, P.; Formichi, P.; Landi, F. Probabilistic methodology for the assessment of the impact of climate change on structural safety. In Proceedings of the ESREL2020-PSAM15, Venice, Italy, 21–26 June 2020. (accepted for publication). [Google Scholar]
- Croce, P.; Formichi, P.; Landi, F. Structural safety and design under climate change. In IABSE Congress New York: The Evolving Metropolis; IABSE: Zurich, Switzerland, 2019; ISBN 978-385748165-9. [Google Scholar]
- Croce, P.; Formichi, P.; Landi, F.; Marsili, F. Evaluating the effect of climate change on thermal actions on structures. In Life-Cycle Analysis and Assessment in Civil Engineering: Towards an Integrated; Vision, R., Caspeele, L., Taerwe, D., Frangopol, M., Eds.; Taylor & Francis Group: Oxfordshire, UK, 2019; pp. 1751–1758. ISBN 978-1-138-62633-1. [Google Scholar]
- Croce, P.; Formichi, P.; Landi, F.; Mercogliano, P.; Bucchignani, E.; Dosio, A.; Dimova, S. The snow load in Europe and the climate change. Clim. Risk Manag. 2018, 20, 138–154. [Google Scholar] [CrossRef]
- Li, Q.; Wang, C.; Ellingwood, B.R. Time-dependent reliability of aging structures in the presence of non-stationary loads and degradation. Struct. Saf. 2015, 52, 132–141. [Google Scholar] [CrossRef]
- EN1993-1-1—Eurocode 3: Design of Steel Structures—Part 1-1: General Rules and Rules for Buildings; CEN: Brussels, Belgium, 2005.
- ACI Standard 318-89 Building Code Requirements for Reinforced Concrete; ACI: Detroit, MI, USA, 1989.
- JCSS Probabilistic Model Code, Joint Committee on Structural Safety. 2002. Available online: https://www.jcss-lc.org/jcss-probabilistic-model-code/ (accessed on 26 May 2020).
- MacLachlan, G.; Peel, D. Finite Mixture Models; John Wiley and Sons: New York, NY, USA, 2000. [Google Scholar]
- Press, W.H.; Tevkolsky, S.A.; Vetterling, W.T.; Flannery, B.P. Numerical Recipes, the Art of Scientific Computing, 3rd ed.; Cambridge University Press: New York, NY, USA, 2007. [Google Scholar]
- Royal Decree 16/11/1939 nr. 2229, Code for the Execution of Concrete and Reinforced Concrete Structures; Italian Official Journal, Istituto Poligrafico e Zecca dello Stato: Rome, Italy, 1939. (In Italian)
- Santarella, Reinforced Concrete, Design and Behavior; Hoepli: Milano, Italy, 1969. (In Italian)
- Neville, L. Book Reviews Ethics in clinical practice: An interprofessional approach Edited by Georgina Hawley. Pearson Education Limited Price: £19.99 Pp 410 ISBN: 0132018276. Br. J. Heal. Assist. 2008, 2, 289. [Google Scholar] [CrossRef]
- Ministry of Public Works. Memorandum 23/05/1957, nr. 1472, Steel Rebars for Reinforced Concrete Structures; Italian Official Journal, Istituto Poligrafico e Zecca dello Stato: Rome, Italy, 1957. (In Italian)
- Ellingwood, B.R. Probability-based codified design: Past accomplishments and future challenges. Struct. Saf. 1994, 13, 159–176. [Google Scholar] [CrossRef]
- Leonardo Da Vinci Pilot Project CZ/02/B/F/PP-134007. Implementation of Eurocodes: Handbook 2—Reliability Background. Guide to the Basis of Structural Reliability and Risk Engineering Related to Eurocodes, Supplemented by Practical Examples. 2005. Available online: https://eurocodes.jrc.ec.europa.eu/showpublication.php?id=63 (accessed on 26 May 2020).
- Vrouwenvelder, T. The JCSS probabilistic model code. Struct. Saf. 1997, 19, 245–251. [Google Scholar] [CrossRef]
- Enright, M.P.; Frangopol, D.M. Service-Life Prediction of Deteriorating Concrete Bridges. J. Struct. Eng. 1998, 124, 309–317. [Google Scholar] [CrossRef]
- Melchers, R.E. Probabilistic Models for Corrosion in Structural Reliability Assessment—Part 2: Models Based on Mechanics. J. Offshore Mech. Arct. Eng. 2003, 125, 272–280. [Google Scholar] [CrossRef]
- Ellingwood, B.R. Risk-informed condition assessment of civil infrastructure: State of practice and research issues. Struct. Infrastruct. Eng. 2005, 1, 7–18. [Google Scholar] [CrossRef]
- Enright, M.P.; Frangopol, D.M. Probabilistic analysis of resistance degradation of reinforced concrete bridge beams under corrosion. Eng. Struct. 1998, 20, 960–971. [Google Scholar] [CrossRef]
- EN1998-3—Eurocode 8: Design of Structures for Earthquake Resistance—Part 3: Assessment and Retrofitting of Buildings; CEN: Brussels, Belgium, 2005.
- Italian National Institute of Statistics (ISTAT). Population Housing Census. 2011. Available online: http://dati-censimentopopolazione.istat.it/Index.aspx?DataSetCode=DICA_EDIFICIRES# (accessed on 26 May 2020).
Figure 1.
Results of the cluster analysis for concrete compressive strength fc, identification of eight different sub-classes.
Figure 1.
Results of the cluster analysis for concrete compressive strength fc, identification of eight different sub-classes.

Figure 2.
Steel ribbed bar typologies commonly used in Italy during the 1960s.

Figure 3.
Histogram of yielding strength of main steel rebars used in Italy in 1960s: Aq, high elastic limit steel (known in Italy as ALE), RUMI, GS, STAR and not classified.
Figure 3.
Histogram of yielding strength of main steel rebars used in Italy in 1960s: Aq, high elastic limit steel (known in Italy as ALE), RUMI, GS, STAR and not classified.

Figure 4.
(a) Bar charts of yielding strength of steel rebars for the whole dataset and the sub-divisions of “Not classified steel”, “Aq-category” and “Ribbed bars”; (b) results of the cluster analysis for yielding strength fy and identification of three different sub-classes.
Figure 4.
(a) Bar charts of yielding strength of steel rebars for the whole dataset and the sub-divisions of “Not classified steel”, “Aq-category” and “Ribbed bars”; (b) results of the cluster analysis for yielding strength fy and identification of three different sub-classes.

Figure 5.
Investigated degradation conditions for steel reinforcement.

Figure 6.
Time-dependent probability of failure (a) and reliability index (b) for residential buildings—reinforcing steel class 1 and concrete class 3 for different steel degradation conditions.
Figure 6.
Time-dependent probability of failure (a) and reliability index (b) for residential buildings—reinforcing steel class 1 and concrete class 3 for different steel degradation conditions.

Figure 7.
Time-dependent probability of failure (a) and reliability index (b) for residential buildings—reinforcing steel class 2 and concrete class 3 for different steel degradation conditions.
Figure 7.
Time-dependent probability of failure (a) and reliability index (b) for residential buildings—reinforcing steel class 2 and concrete class 3 for different steel degradation conditions.

Figure 8.
Time-dependent probability of failure (a) and reliability index (b) for residential buildings—reinforcing steel class 3 and concrete class 3 for different steel degradation conditions.
Figure 8.
Time-dependent probability of failure (a) and reliability index (b) for residential buildings—reinforcing steel class 3 and concrete class 3 for different steel degradation conditions.

Figure 9.
Time-dependent probability of failure (a) and reliability index (b) for residential buildings—reinforcing steel class 1 and concrete class 3, designed considering increased design loads.
Figure 9.
Time-dependent probability of failure (a) and reliability index (b) for residential buildings—reinforcing steel class 1 and concrete class 3, designed considering increased design loads.

Figure 10.
Time-dependent probability of failure (a) and reliability index (b) for shopping buildings (concrete class 3).
Figure 10.
Time-dependent probability of failure (a) and reliability index (b) for shopping buildings (concrete class 3).

Figure 11.
Time-dependent probability of failure (a) and reliability index (b) for storage building (concrete class 3).
Figure 11.
Time-dependent probability of failure (a) and reliability index (b) for storage building (concrete class 3).

Figure 12.
Time-dependent probability of failure (a) and reliability index (b) for shopping buildings (concrete class 2).
Figure 12.
Time-dependent probability of failure (a) and reliability index (b) for shopping buildings (concrete class 2).

Figure 13.
Time-dependent probability of failure (a) and reliability index (b) for shopping buildings (concrete class 4).
Figure 13.
Time-dependent probability of failure (a) and reliability index (b) for shopping buildings (concrete class 4).


Table 1.
Concrete compressive strength—statistical parameters and COV of the Gaussian Mixture Model (GMM) and probability of each component.
Table 1.
Concrete compressive strength—statistical parameters and COV of the Gaussian Mixture Model (GMM) and probability of each component.
| Material Class | (N/mm2) | Component Probability (%) | |
|---|---|---|---|
| 1 | 14.7 | 27 | 10 |
| 2 | 22.9 | 17 | 18 |
| 3 | 31.8 | 13 | 23 |
| 4 | 40.6 | 10 | 20 |
| 5 | 49.9 | 9 | 14 |
| 6 | 59.9 | 8 | 10 |
| 7 | 70.2 | 8 | 3 |
| 8 | 79.5 | 13 | 2 |
Table 2.
Steel yielding strength fy—statistical parameters and of the GMM and probability of each identified component.
Table 2.
Steel yielding strength fy—statistical parameters and of the GMM and probability of each identified component.
| Material Class | (N/mm2) | Component Probability (%) | |
|---|---|---|---|
| 1 | 323 | 13 | 14 |
| 2 | 368 | 6 | 27 |
| 3 | 434 | 13 | 59 |
Table 3.
Statistical description of structural resistance and loads.
| Variable | ||||
|---|---|---|---|---|
| Initial Resistance | Material Classes defined in Section 4 | Normal | ||
| Permanent Load | ( kN/m2) | 0.10 | Normal | |
| Variable Load | Residential ( kN/m2) | 1.42 | EVI | |
| Shopping ( kN/m2) | 0.35 | EVI | ||
| Storage ( kN/m2) | 0.15 | EVI | ||
Table 4.
Typical parameters governing different steel degradation rates (Equation (10)).
| Degradation Condition | Degradation Rate | T1 (years) | a | b |
|---|---|---|---|---|
| 0 | Non-degrading | --- | --- | --- |
| I | Low | 10 | 0.0005 | 1 |
| II | Medium | 5 | 0.005 | 1 |
| III | High | 2.5 | 0.0065 | 1 |
© 2020 by the authors. Licensee MDPI, Basel, Switzerland. This article is an open access article distributed under the terms and conditions of the Creative Commons Attribution (CC BY) license (http://creativecommons.org/licenses/by/4.0/).
Share and Cite
MDPI and ACS Style
Croce, P.; Formichi, P.; Landi, F. Influence of Reinforcing Steel Corrosion on Life Cycle Reliability Assessment of Existing R.C. Buildings. Buildings 2020, 10, 99. https://0-doi-org.brum.beds.ac.uk/10.3390/buildings10060099
AMA Style
Croce P, Formichi P, Landi F. Influence of Reinforcing Steel Corrosion on Life Cycle Reliability Assessment of Existing R.C. Buildings. Buildings. 2020; 10(6):99. https://0-doi-org.brum.beds.ac.uk/10.3390/buildings10060099
Chicago/Turabian StyleCroce, Pietro, Paolo Formichi, and Filippo Landi. 2020. "Influence of Reinforcing Steel Corrosion on Life Cycle Reliability Assessment of Existing R.C. Buildings" Buildings 10, no. 6: 99. https://0-doi-org.brum.beds.ac.uk/10.3390/buildings10060099
Note that from the first issue of 2016, this journal uses article numbers instead of page numbers. See further details here.