Article

Flexural Behavior of Reinforced Concrete Slabs Reinforced with Innovative Hybrid Reinforcement of Geogrids and Steel Bars

by
Ramy Nasr Abdelmonem Mohamed
1,*,
A.M. El Sebai
1 and
Ahmed Shaban Abdel-Hay Gabr
2
1
Civil Engineering Department, Faculty of Engineering, Al-Azhar University, Nasr City 11751, Cairo, Egypt
2
Civil Engineering Department, Faculty of Engineering, Beni-Suef University, Beni-Suef 62511, Egypt
*
Author to whom correspondence should be addressed.
Submission received: 19 August 2020 / Revised: 5 September 2020 / Accepted: 8 September 2020 / Published: 10 September 2020
(This article belongs to the Section Building Materials, and Repair & Renovation)

Abstract

:
This paper aims to innovate a hybrid reinforcement system for concrete slabs, consisting of geogrids and steel bars, by conducting an experimental comparative study between using different types, tensile strengths, and layers of geogrids as additional reinforcement to steel bars in comparison to conventional steel-reinforced concrete control slab. These concrete slabs were tested under a four-point loading system until they failed due to bending. As an addition, strain gauges were attached to the concrete slabs bottom reinforcement (geogrids and steel bars) to provide a close examination of geogrids and steel bars as a hybrid reinforcement system. Results show that the innovated hybrid reinforcement system of uniaxial geogrids and steel bars more preferred as concrete slabs reinforcement as it provided more benefits values (including, but not limited to, initial-peak load, steel-yield load, post-peak load, displacement ductility index, and energy absorption capacity) and more efficient utilization (including, but not limited to, higher benefits to cost values and better flexural performance) than the case of using conventional reinforcement of steel bars and the cases of using triaxial geogrids as additional reinforcement to the steel bars; however, triaxial geogrids provide lower deflection values and higher first-crack load values.

1. Introduction

Geogrids are one of the polymeric materials classified under geosynthetics materials and are mainly made from polymers, such as polyester, polyethylene, and polypropylene [1]. Compared to the soil, geogrids are strong in tension. This characteristic enables them to transfer the tension force to a larger area of soil. Geosynthetics are used as a stabilization and reinforcement element in special infrastructure and civil works [2]. Recently, the use of geogrids as reinforcing material is expanding towards the pavement system, especially in the following fields: Reinforcing elements for asphalt layers, stabilizing the unbound layers [3], as an interlayer system in overlay applications [4], as shrinkage reinforcement in Portland cement concrete pavements [5], and as an interlayer system to reduce reflective cracking in concrete overlays [6,7] or asphalt overlays of jointed concrete pavements [8,9]. The use of geogrids as reinforcement material for the Portland cement concrete constitute a new dimension for using geogrids in structural engineering. Little researches have been performed on geogrids used as reinforcement material in Portland cement concrete thin members and overlays [10]. Meanwhile, few types of research have been performed on geogrids used, either for the strengthening of concrete beams and slabs [1,11], as reinforcement materials for concrete slabs [12,13], or as reinforcement materials for concrete beams [14,15]. Geogrids are categorized into uniaxial geogrids, biaxial geogrids, and triaxial geogrids. Uniaxial geogrids are used in grade separation applications, such as steep slopes. In contrast, biaxial geogrids are used in roadway implementations, and triaxial geogrids are used in road construction where the soil under the road is sandy or loose [16]. Uniaxial geogrids are formed by extending a regularly punched polymer sheet in the longitudinal direction, and in this manner, the longitudinal direction retains a higher tensile strength than the transverse direction. Biaxial geogrids are formed by extending a consistently punched polymer sheet in longitudinal and transverse directions simultaneously, and in this manner, the tensile strength is equivalent in both directions. Triaxial geogrids are fabricated from a punched polypropylene sheet arranged in numerous, symmetrical bearings to shape its triangular openings, bringing about high radial stiffness all through the full 360 degrees. The objective of this investigation is to analyze the flexural behavior of steel-reinforced concrete slabs when hybrid reinforced with varying grades and layers of geogrids. In order to quantify the gained benefits from the application of geogrids as concrete slab reinforcement, a comparative study of flexural test results between concrete control slab and understudy concrete slabs were studied and analyzed. This paper represents a discussion of the test results and reports significant findings.

Highlights of the Paper

  • The innovation of geogrids and steel bars as hybrid reinforcement system.
  • A new term of “Geogrids’ proof-strain” was defined.
  • Value engineering study of geogrids and steel bars as hybrid reinforcement.
  • “Uniaxial geogrids pre-stressed concrete” concept was suggested for future studies. Which is expected to reduce the plastic deformation, enhance the mechanical properties, and increase the benefits to cost ratios.
  • This hybrid reinforcement system could decrease the influence of corrosion due to environmental actions, as part of the system is not subjected to corrosion (geogrids). Accordingly, will contributing to reducing its degree of damage, its effect on the structural behavior, and the associated cost and time with repair, moreover, it provides higher benefits to cost ratios compared to the conventional reinforcement of steel bars.

2. Literature Review

Ali Sabah Ahmed Alamli et al. 2017; they studied the punching shear behavior of two-way concrete slabs reinforced with biaxial and different reinforcement ratio of steel bars. The experimental program was consisting of testing fifteen concrete slabs divided into three groups to study the parameters of the concrete compressive strength, the presence of biaxial geogrid mesh, and the reinforcement ratio of steel bars. These concrete slabs were tested under a central static vertical load [17]. Yahya Safaa Ali et al. 2018; studied the punching shear behavior of nine two-way slabs reinforced with steel bars and geogrid pieces of different shapes and dimensions. These concrete slabs were tested under a central static vertical load [18]. Tharani K et al. 2019; studied the impact behavior of two-way reinforced concrete slab with biaxial geogrids as an additional reinforcement to steel bars. The experimental program was consisting of testing three concrete slabs to study the effect of the number of additional uniaxial geogrids’ layers. These concrete slabs were tested under drop weight impact loading, and the test results were compared with the results of a finite element analysis by ABAQUS software [19]. S. Ramakrishnan et al. 2018; illustrated the behavior of reinforced concrete beams with biaxial geogrids as an additional reinforcement to reinforcement steel bars. The experimental investigation was consisting of one concrete control beam, and five geogrids reinforced concrete beams with varying geogrids’ layers from one layer up to five layers subjected to four-point loading [20]. Xiaochao Tang et al. 2018; their study aimed to examine the flexural behavior of concrete beams reinforced with triaxial geogrids. Plain and geogrids reinforced concrete beams were prepared and tested under four-point loading. Strain gauges were attached to the triaxial geogrids to monitor the developed strain [21]. Xiaoyu Meng et al. 2019; their study aimed to examine the flexural behavior of pervious concrete beams reinforced with different numbers of geogrids’ layers placed at various positions. The concrete beams under this study were tested under four-point loading. The digital image correlation and the acoustic emission techniques were used to monitor the strain fields, the internal fracture characteristics, and the crack propagation [22]. R. Siva Chidambaram and Pankaj Agarwal 2015; their study investigates the feasibility of geogrids as additional shear reinforcement in reinforced steel fiber concrete beams. A total of twelve concrete beams were prepared and separated into three groups with different configurations based on the ratio of longitudinal reinforcement, transverse reinforcement, the strength of geogrids, and the volume of steel fiber. The flexural behavior of these concrete beams was examined under a three-point loading [23]. S. Sivakamasundari et al. 2016; the principal point of their investigation is to examine the flexural behavior of biaxial geogrids with steel fiber and without steel fibers to check the possibility of using the biaxial geogrids as shear reinforcement. In this study, two types of concrete beams with different configurations of transverse reinforcements were taken into consideration. These concrete beams were tested under three-point loading [24]. R. Siva Chidambaram and Pankaj Agarwal 2014; their study investigated the feasibility of geogrids as a confinement reinforcement in steel fiber cement concrete. In this research, concrete specimens were prepared and tested under axial compression, split tension, and flexural loading [25]. Aluri Anil Kumar and Y. Anand Babu 2017; through their study, a new reinforced system was introduced to be used in concrete columns. This new reinforcement configuration (named geogrids reinforced steel columns (GRSC)) is an alternative to the used reinforcement steel rebar cage in the traditional reinforced concrete column, for faster and easier construction [26]. Testing results and observations were shown; the geogrids reinforcement could be used as bending, shear, and confinement reinforcement in Portland cement concrete.

Main Conclusions of the Literature Review

Various studies of literature regarding the use of geogrids as concrete reinforcement and similar works were collected and reviewed. From the above literature review, we have observed the following results:
  • The use of geogrids as additional reinforcement to the steel bars in concrete slabs provided better results, as it provided a higher first crack load and higher ultimate load than the cases of using conventional reinforcement of steel bars or using uniaxial geogrids as main reinforcement; meanwhile, it led to an increase in the deflection values. The decrease of the reinforcement ratio of steel bars to 0.13% led to a decrease in the contribution and effectiveness of geogrids as concrete slab reinforcement. Accordingly, geogrids cannot be depended on as the main reinforcement for concrete slabs.
  • The impact resistance and impact energy capacity of concrete slabs increased by using geogrids as an additional reinforcement to steel bars with a positive correlation to the number of geogrids’ layers.
  • Geogrids as concrete beams reinforcement provide ductile post cracking behavior, high fracture energy, increase absorbed energy, high flexural strength, and large deformation values according to the tensile strength, number of layers, and the type of geogrids in descending order of uniaxial, biaxial, and triaxial geogrids.
  • The confining effect of geogrids plays a significant role in the properties of concrete.
  • Crack width is reduced as the tensile strength of geogrids is increased.
  • Both of the triaxial geogrids post-failure observations and the strain measurements suggest that there was no pullout or slippage between the triaxial geogrids and the concrete.
  • Geogrids should not be used in concrete structures or members that might be subjected to fire. On the other hand, geogrids include a lack of susceptibility to corrosion, higher ratios of strength to weight, and lower costs.
  • The circular-shaped geogrids reinforcement was effective in the control of crack opening.
  • The size of the coarse aggregate should be less than the aperture size of geogrids.

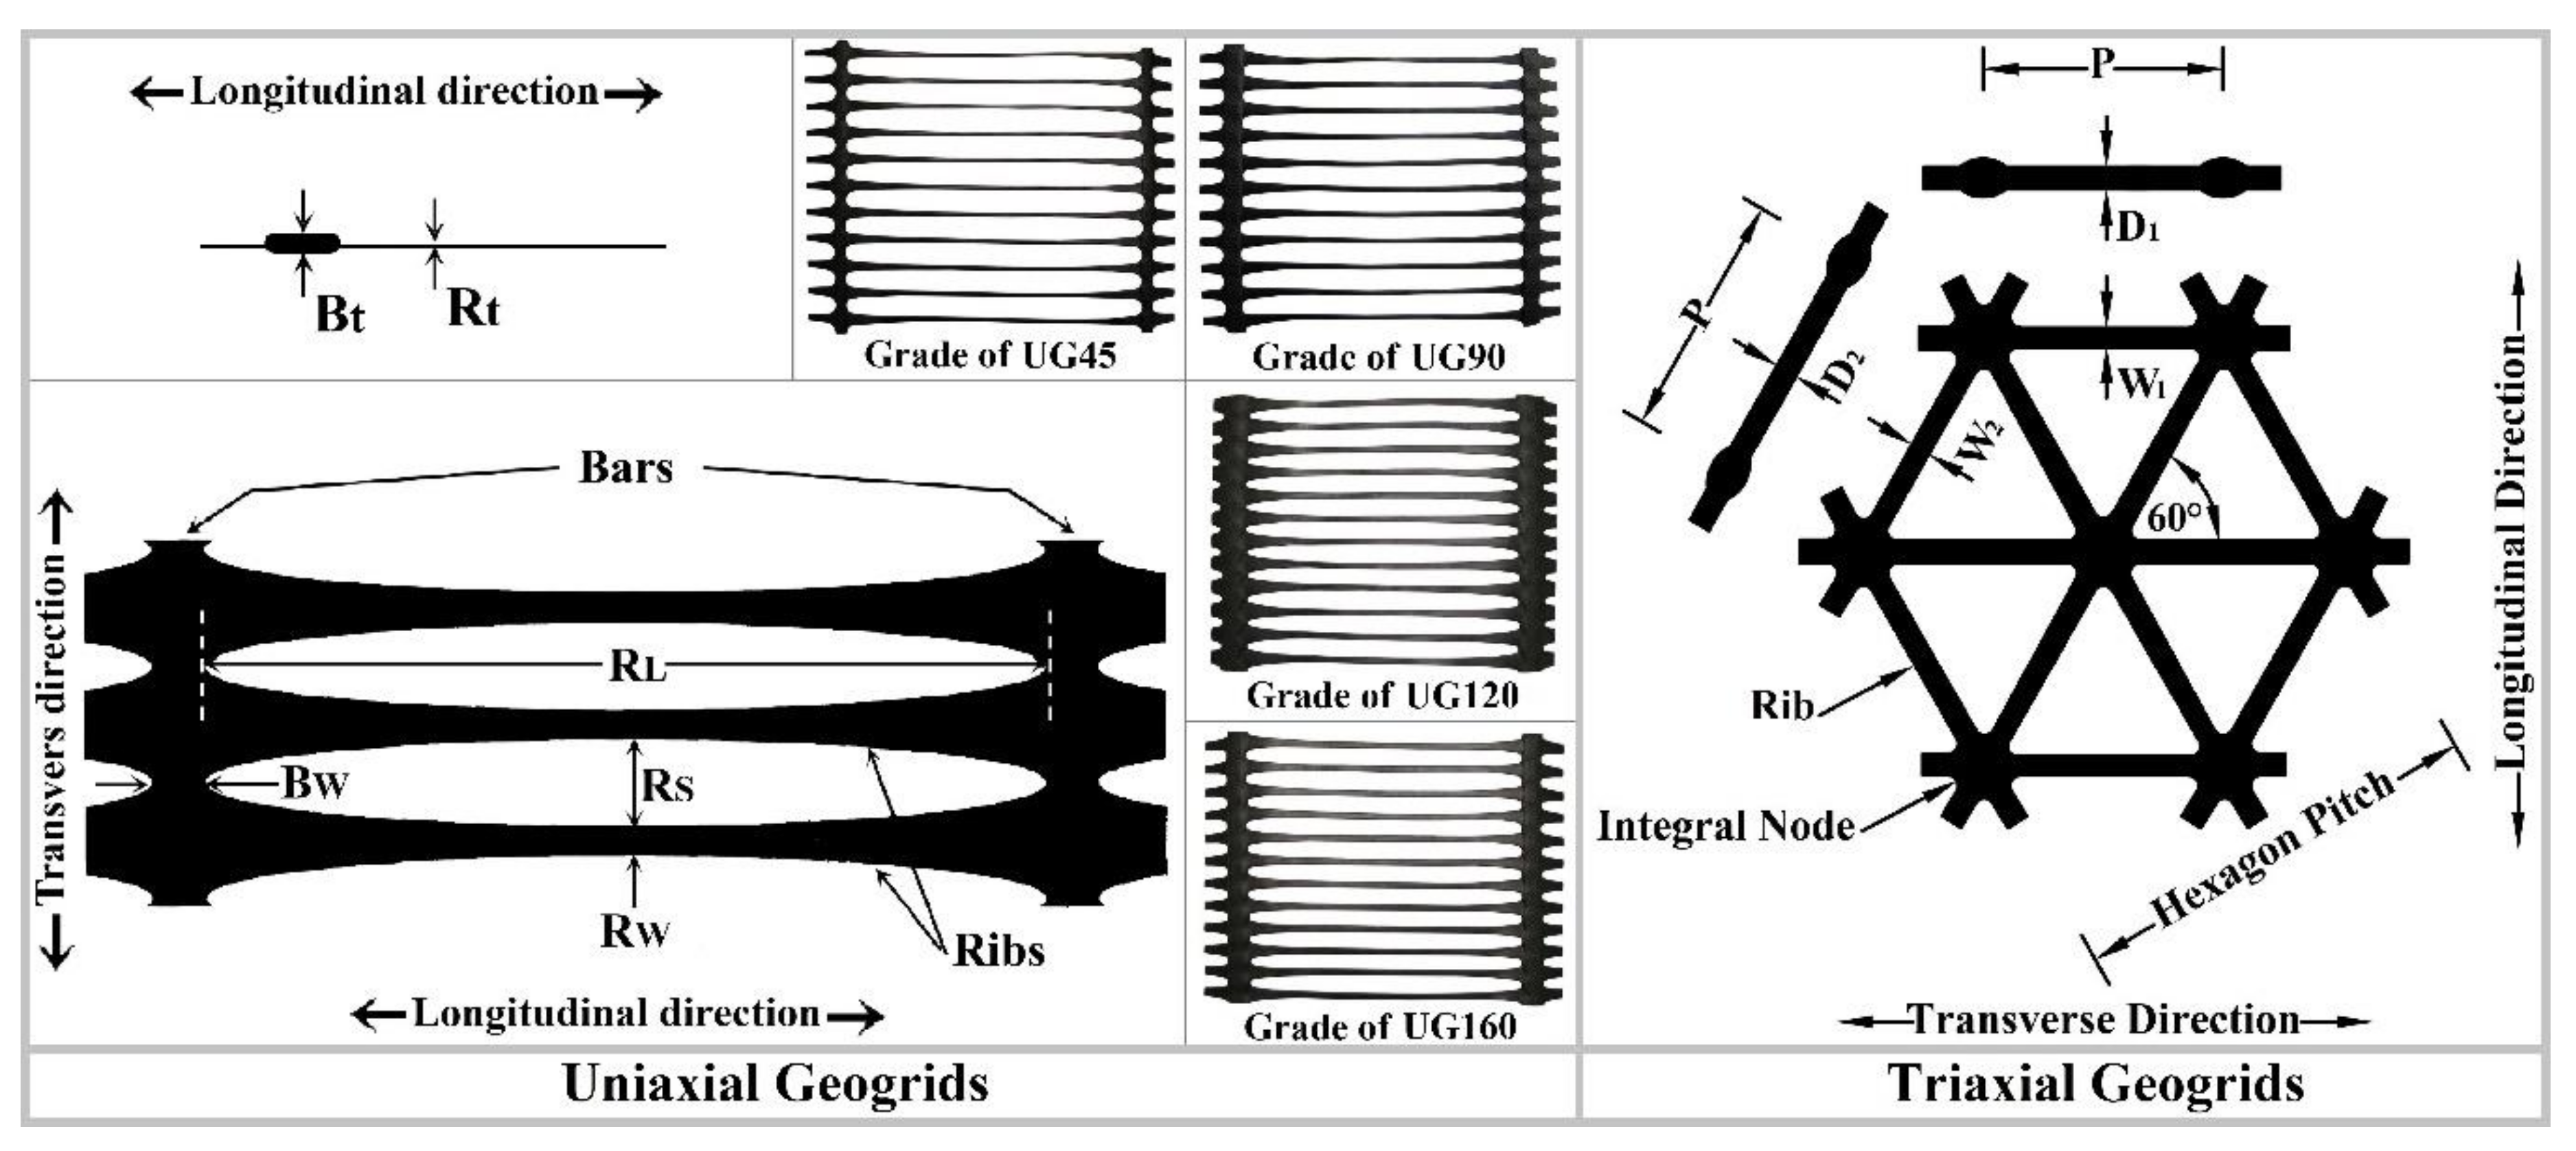
3. Specifications of the Used Materials

The concrete mix was prepared by using Portland cement with a grade of 42.5, natural sand as fine aggregate, and crushed limestone as coarse aggregate. Table 1 shows the mix design of the used concrete. The maximum nominal size of coarse aggregate is limited to 10 mm, which is smaller than the size of the apertures of the used geogrids to allow the coarse aggregate to pass and fill the spaces between the geogrids’ ribs, to avoid the honeycombing of concrete, and to provide better bonding between the concrete and geogrids. High range water reducing and super-plasticizer concrete admixture was used to improve the workability of concrete, while keeping the water-cement ratio as 0.5. The concrete mixture has a 28-days compressive strength of 40 N/mm2.
Because the slabs under this study are one-way slabs, the biaxial geogrids were excluded. The used concrete reinforcement materials in the research were reinforcement steel bars, uniaxial geogrids, and triaxial geogrids. The reinforcement steel bars’ properties as per experimental tests are shown in Table 2. The physical and mechanical properties of the used geogrids, as provided by the manufacturer and experimental tests, are shown in Figure 1, Table 3, and Table 4.

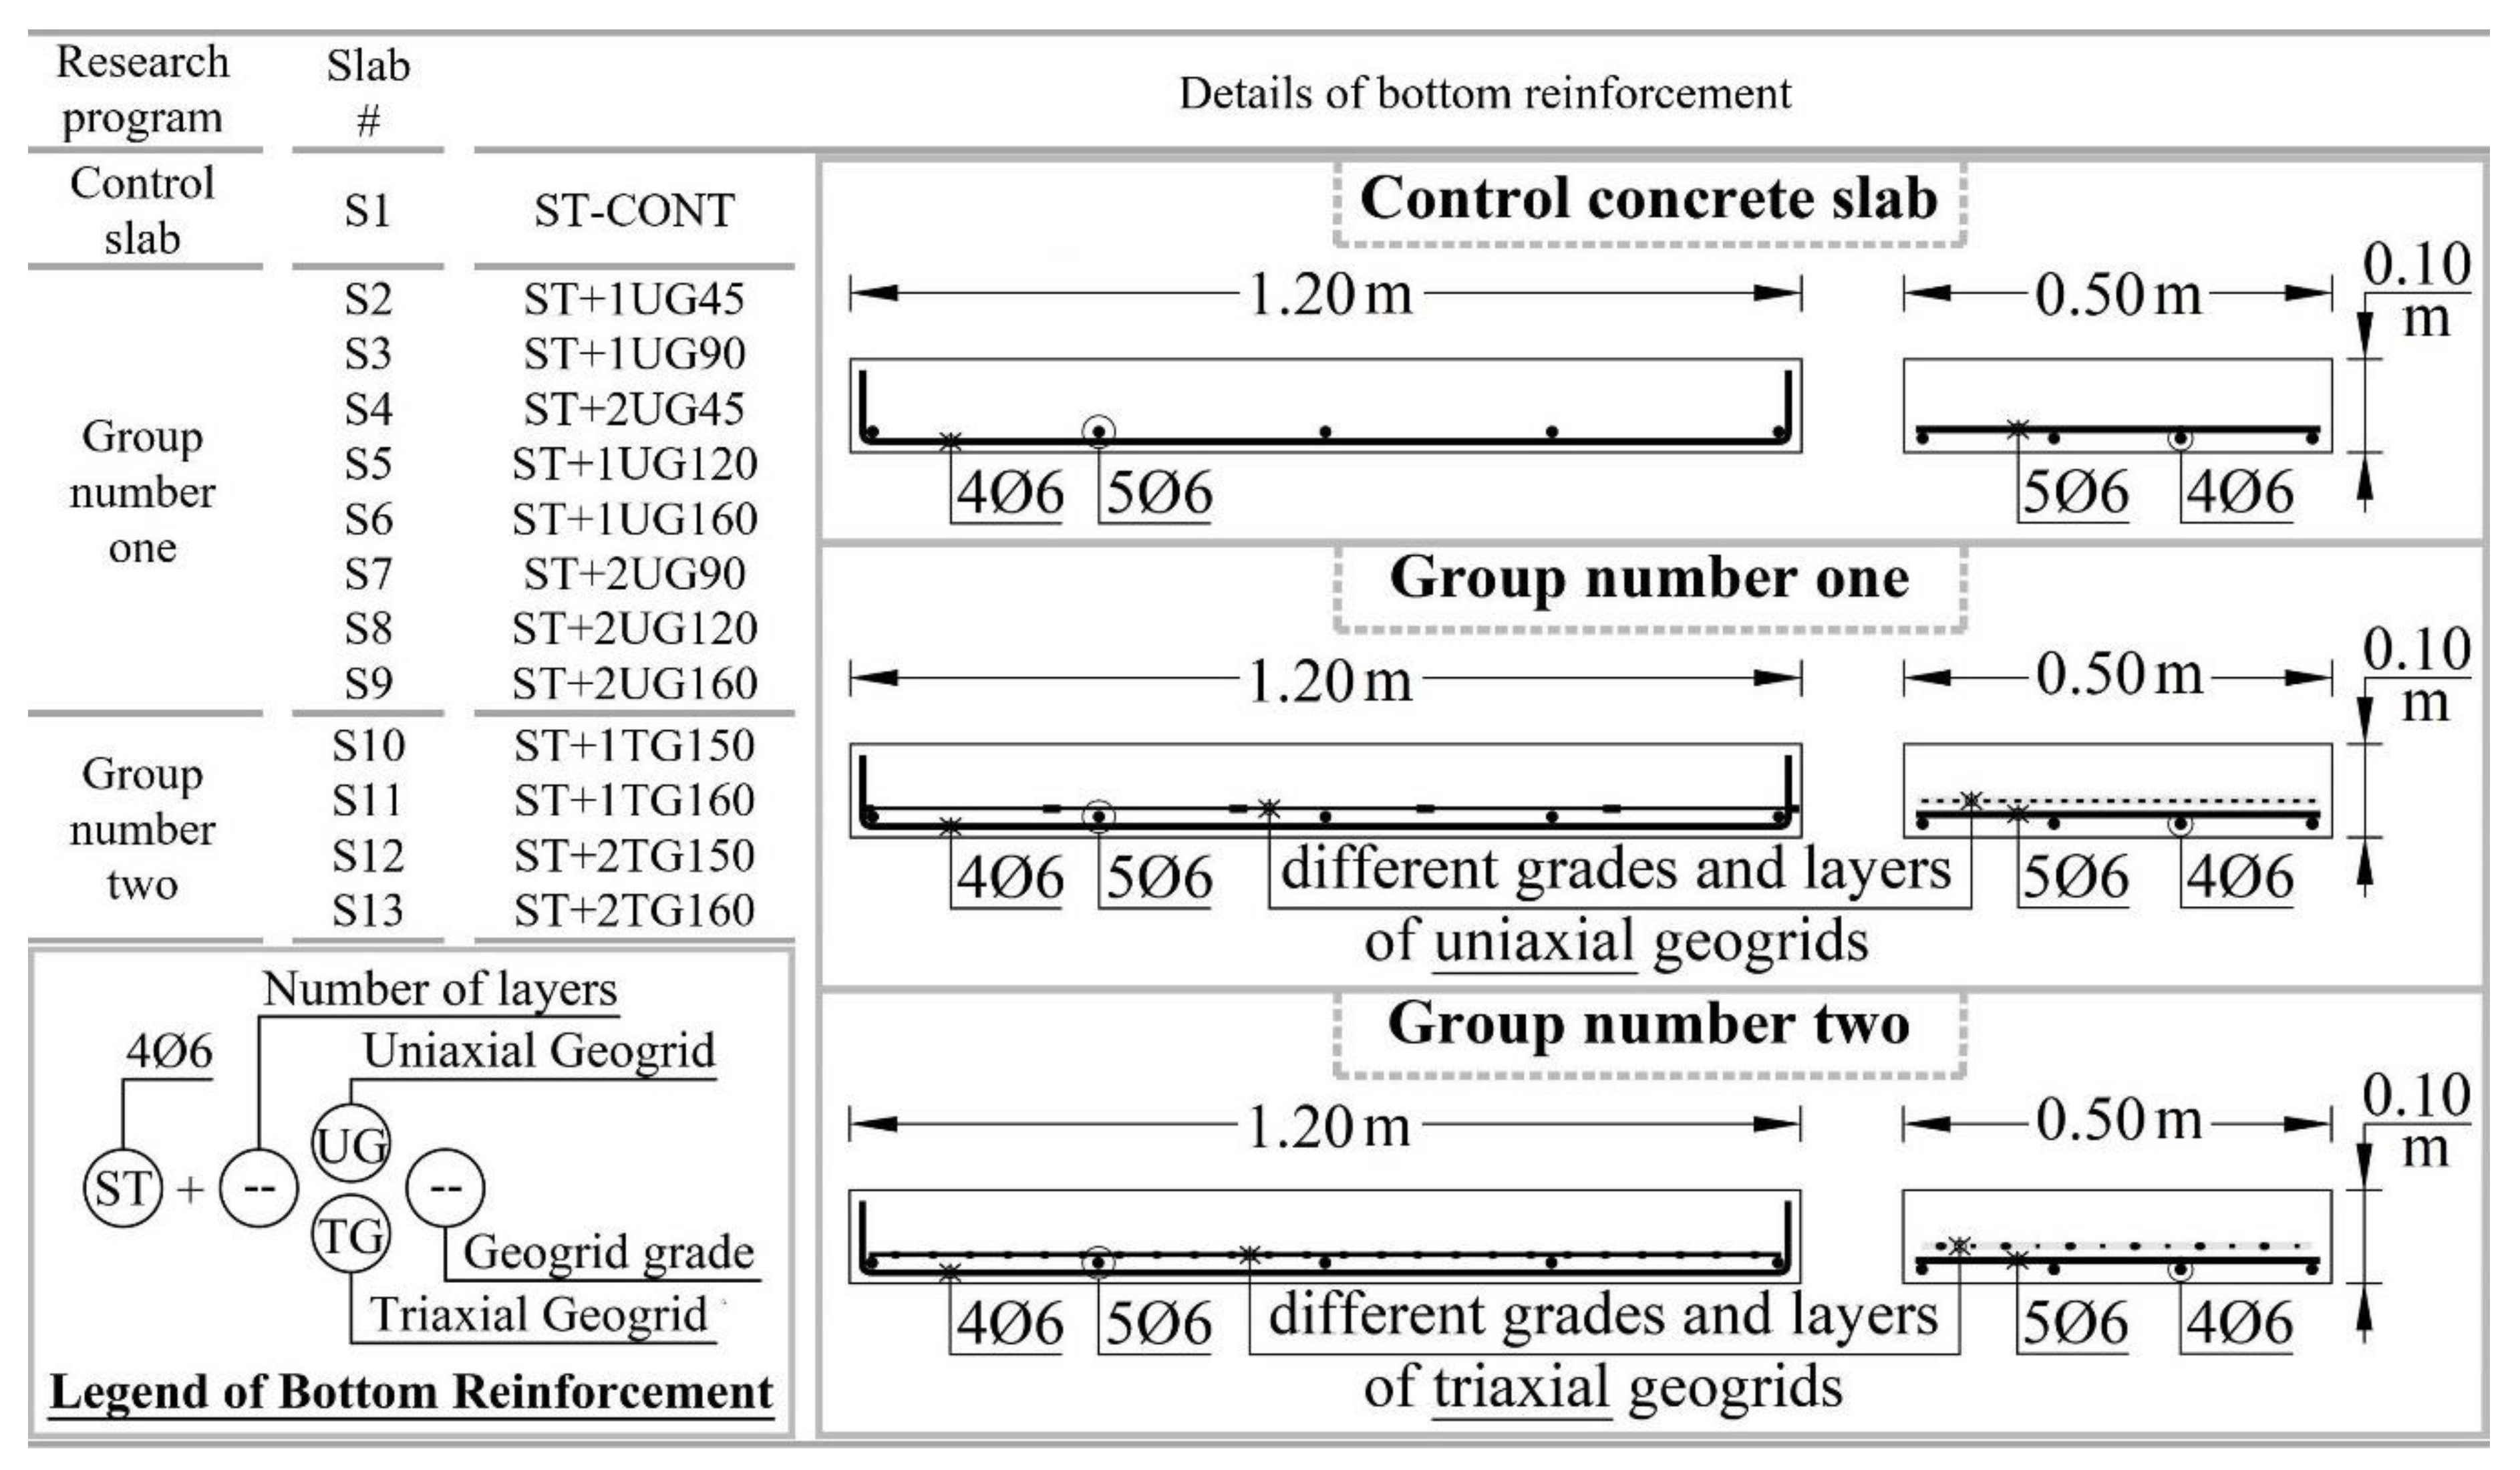
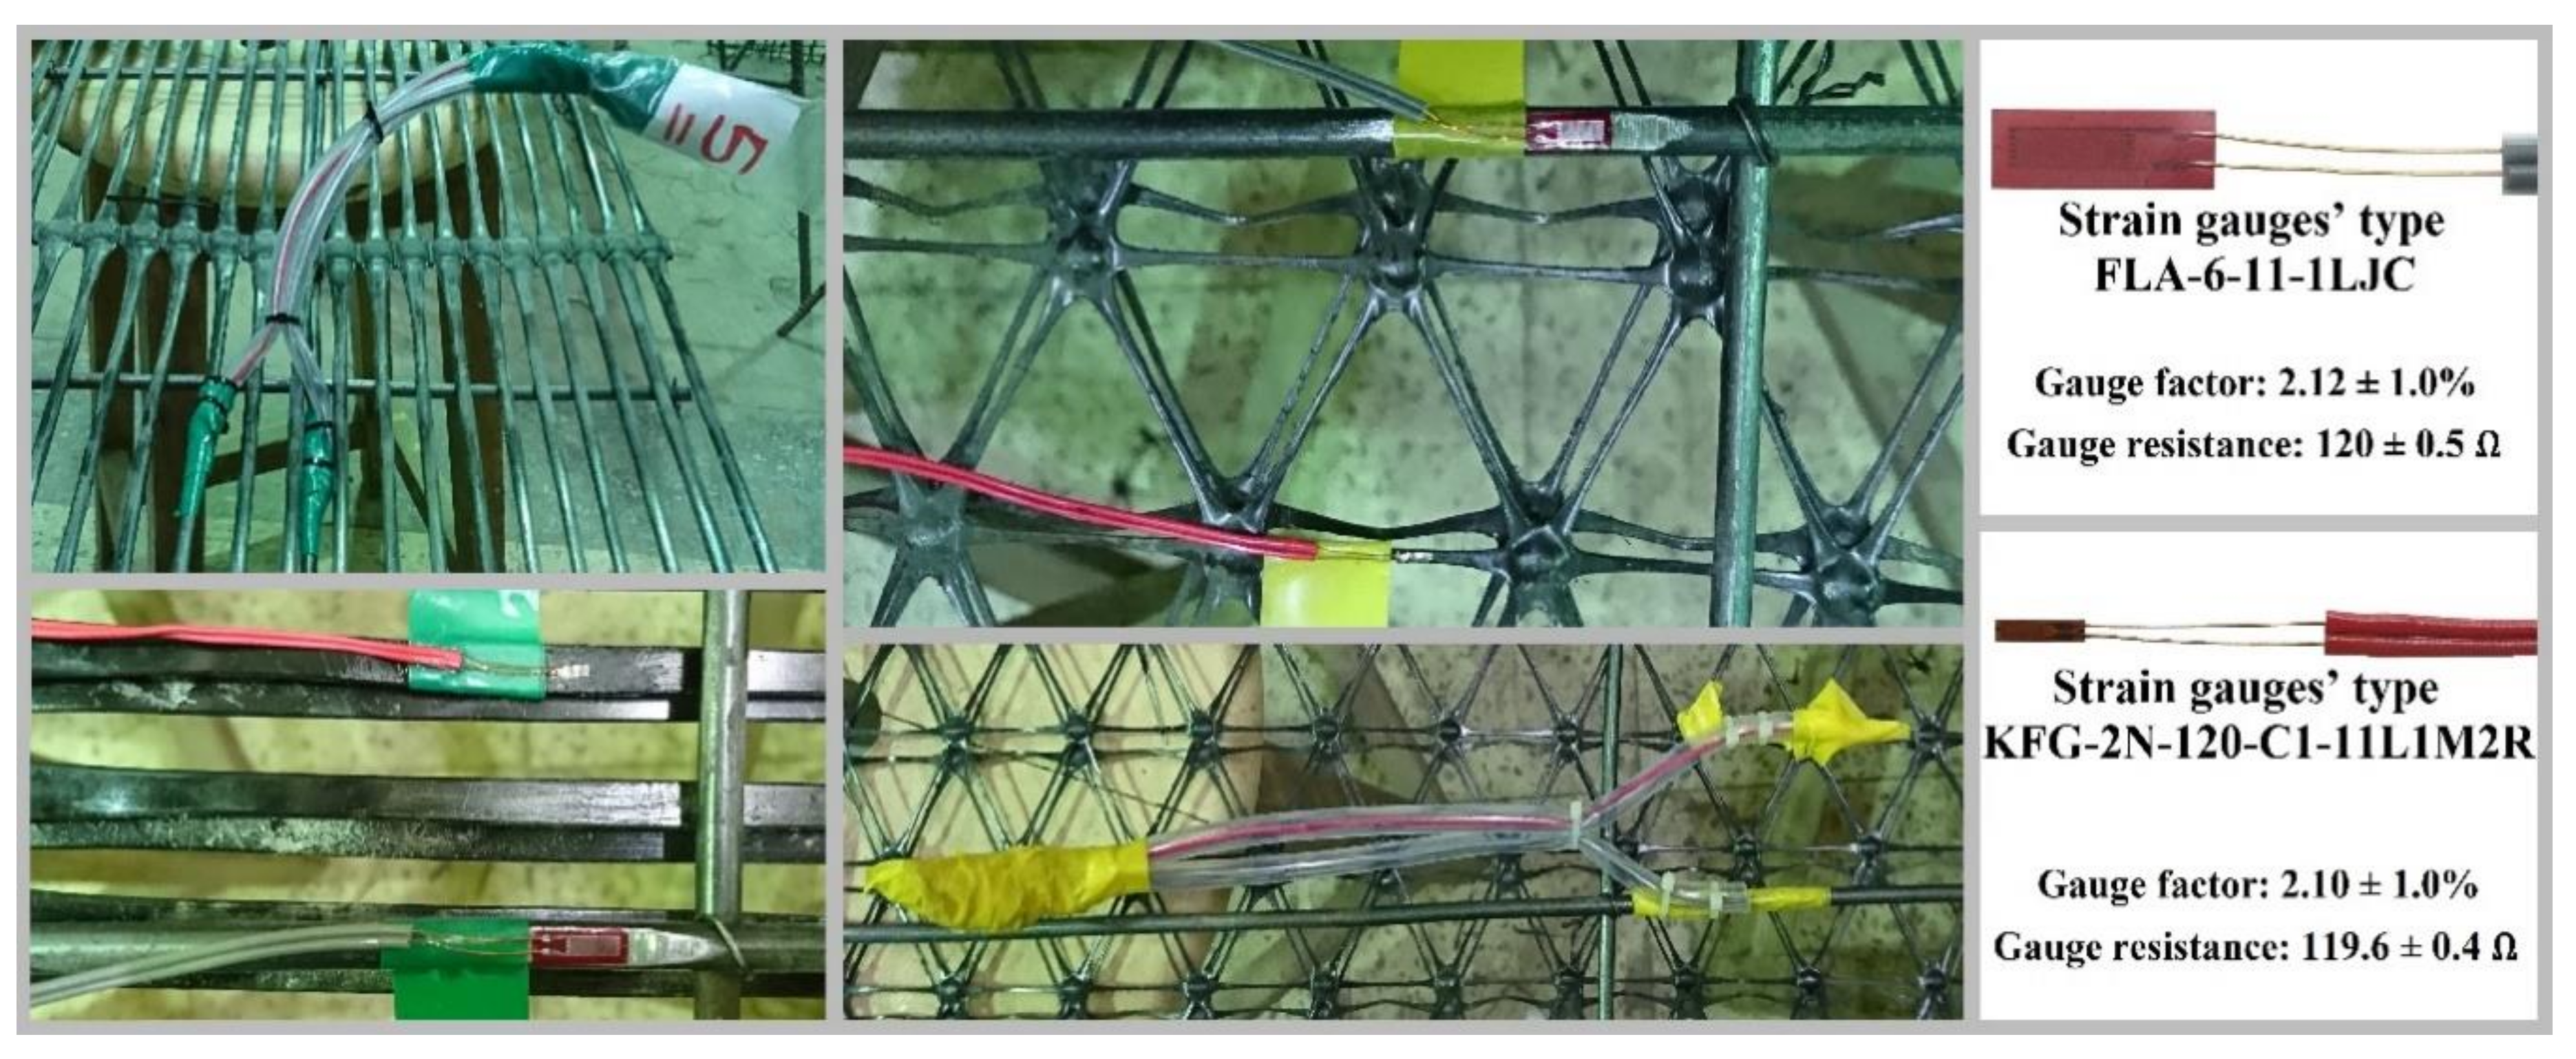
4. Experimental Program

The experimental program of this study included thirteen concrete slabs that had the same dimensions of 120 cm length, 50 cm width, and 10 cm depth. These concrete slabs were prepared, tested, and examined under a four-point loading system until they failed in flexure, and were divided into two groups and one concrete control slab based on the experimental program. All concrete slabs were reinforced by a main minimum bottom steel bars reinforcement of four 6 mm diameter plain steel bars in the longitudinal direction and five 6 mm diameter plain steel bars in the transverse direction in addition to different types, tensile strengths, and layers of geogrids based on the experimental program. Group number one consisted of eight concrete slabs, were reinforced by the main minimum bottom steel bars reinforcement in addition to different tensile strengths, and layers of uniaxial geogrids. Group two consisted of four concrete slabs were reinforced by the main minimum bottom steel bars reinforcement in addition to different tensile strengths, and layers of triaxial geogrids. While the concrete control slab was reinforced only by the main minimum bottom steel bars reinforcement. The concrete slabs reinforcement details per each group are illustrated in detail in Figure 2. It should be mentioned that, as the minimally reinforced concrete sections are brittle structures [28], the decision was made to use the minimum ratio of the bottom reinforcement steel bars in order to: Provide only one flexural crack cross the concrete slab section, and to depend more on the geogrids and deeply study its behavior as additional reinforcement to the steel bars.
It should be mentioned that, during the fixing of the uniaxial geogrids (UG), it was taken into consideration that the middle part of uniaxial geogrids’ ribs to be located in and matched with the concrete slabs mid-span to allocate the most sensitive tensile part of the uniaxial geogrids’ ribs at the area of the most applied tensile stress during the test; meanwhile, during the fixing of the triaxial geogrids (TG), it was taken into consideration that its transverse direction is to be parallel to the concrete slabs longitudinal directions to provide triaxial geogrids’ ribs in parallel to tensile force direction during the test. Two types of strain gauges were attached to the mid-span of the concrete slabs’ bottom reinforcement. Strain gauges’ type KFG-2N-120-C1-11L1M2R were attached on the bottom surface for the mid-span of geogrids’ ribs. Strain gauges’ type FLA-6-11-1LJC were attached on the bottom surface for the mid-span of reinforcement steel bars. In order to assure strong adhesion between strain gauges and concrete slabs bottom reinforcement, a special single-component adhesive for strain gauges was used, which allows adhesion to metal objects, as well as plastic objects with curing and hardening time under normal conditions from 20 to 60 sec. Because strain gauges are delicate and prone to moisture and mechanical damage, the strain gauges were isolated from heat and moisture by retardant PVC tape. In contrast, the strain gauge wires were isolated by flexible plastic tubes to prevent any damages to the strain gauges. Figure 3 shows the Fixing, isolation, protection, and types of used strain gauges.

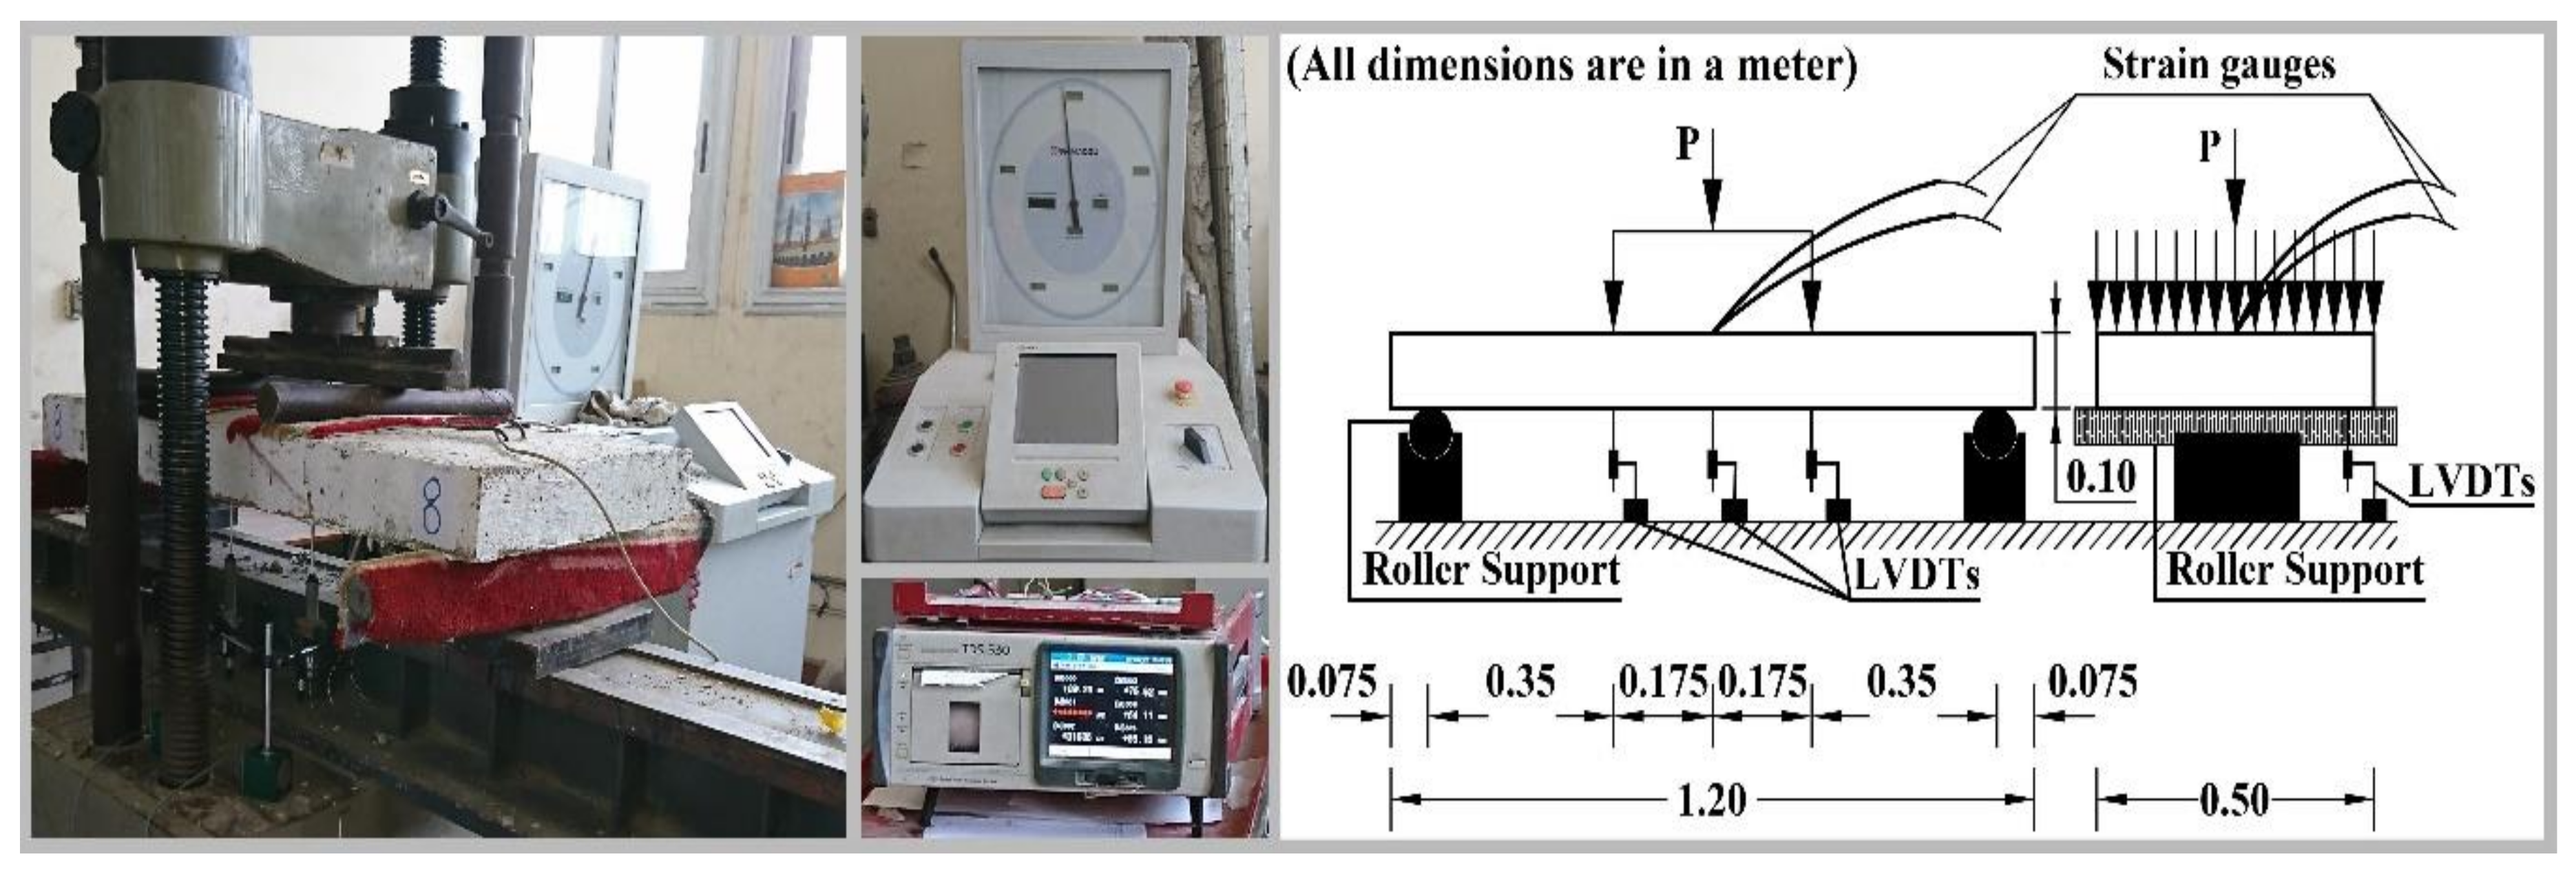
5. Test Set-Up and Loading Arrangement

All slabs were loaded and tested under gradually increasing four-point loading by Shimadzu machine with a capacity of 500 kN until they failed in flexure (loading protocol is a displacement control of 2 mm per minute). Each two-line load was applied at one-third of the clear span to provide a constant maximum bending moment and zero shear force in the middle third of the concrete slabs. Two roller-steel supports were used; each one was located at a distance of 7.5 cm from the slab end. Three vertical linear variable differential transducers (LVDTs) were fixed to the slabs to measure the deflection at the mid-span and in places where concentrated forces are applied. A computerized data logger was used to record the measurements of the machine load, the three vertical linear variable differential transducers (LVDTs), and the bottom reinforcement strain gauges. Figure 4 shows the Shimadzu machine, the computerized data logger, and the test set-up details.

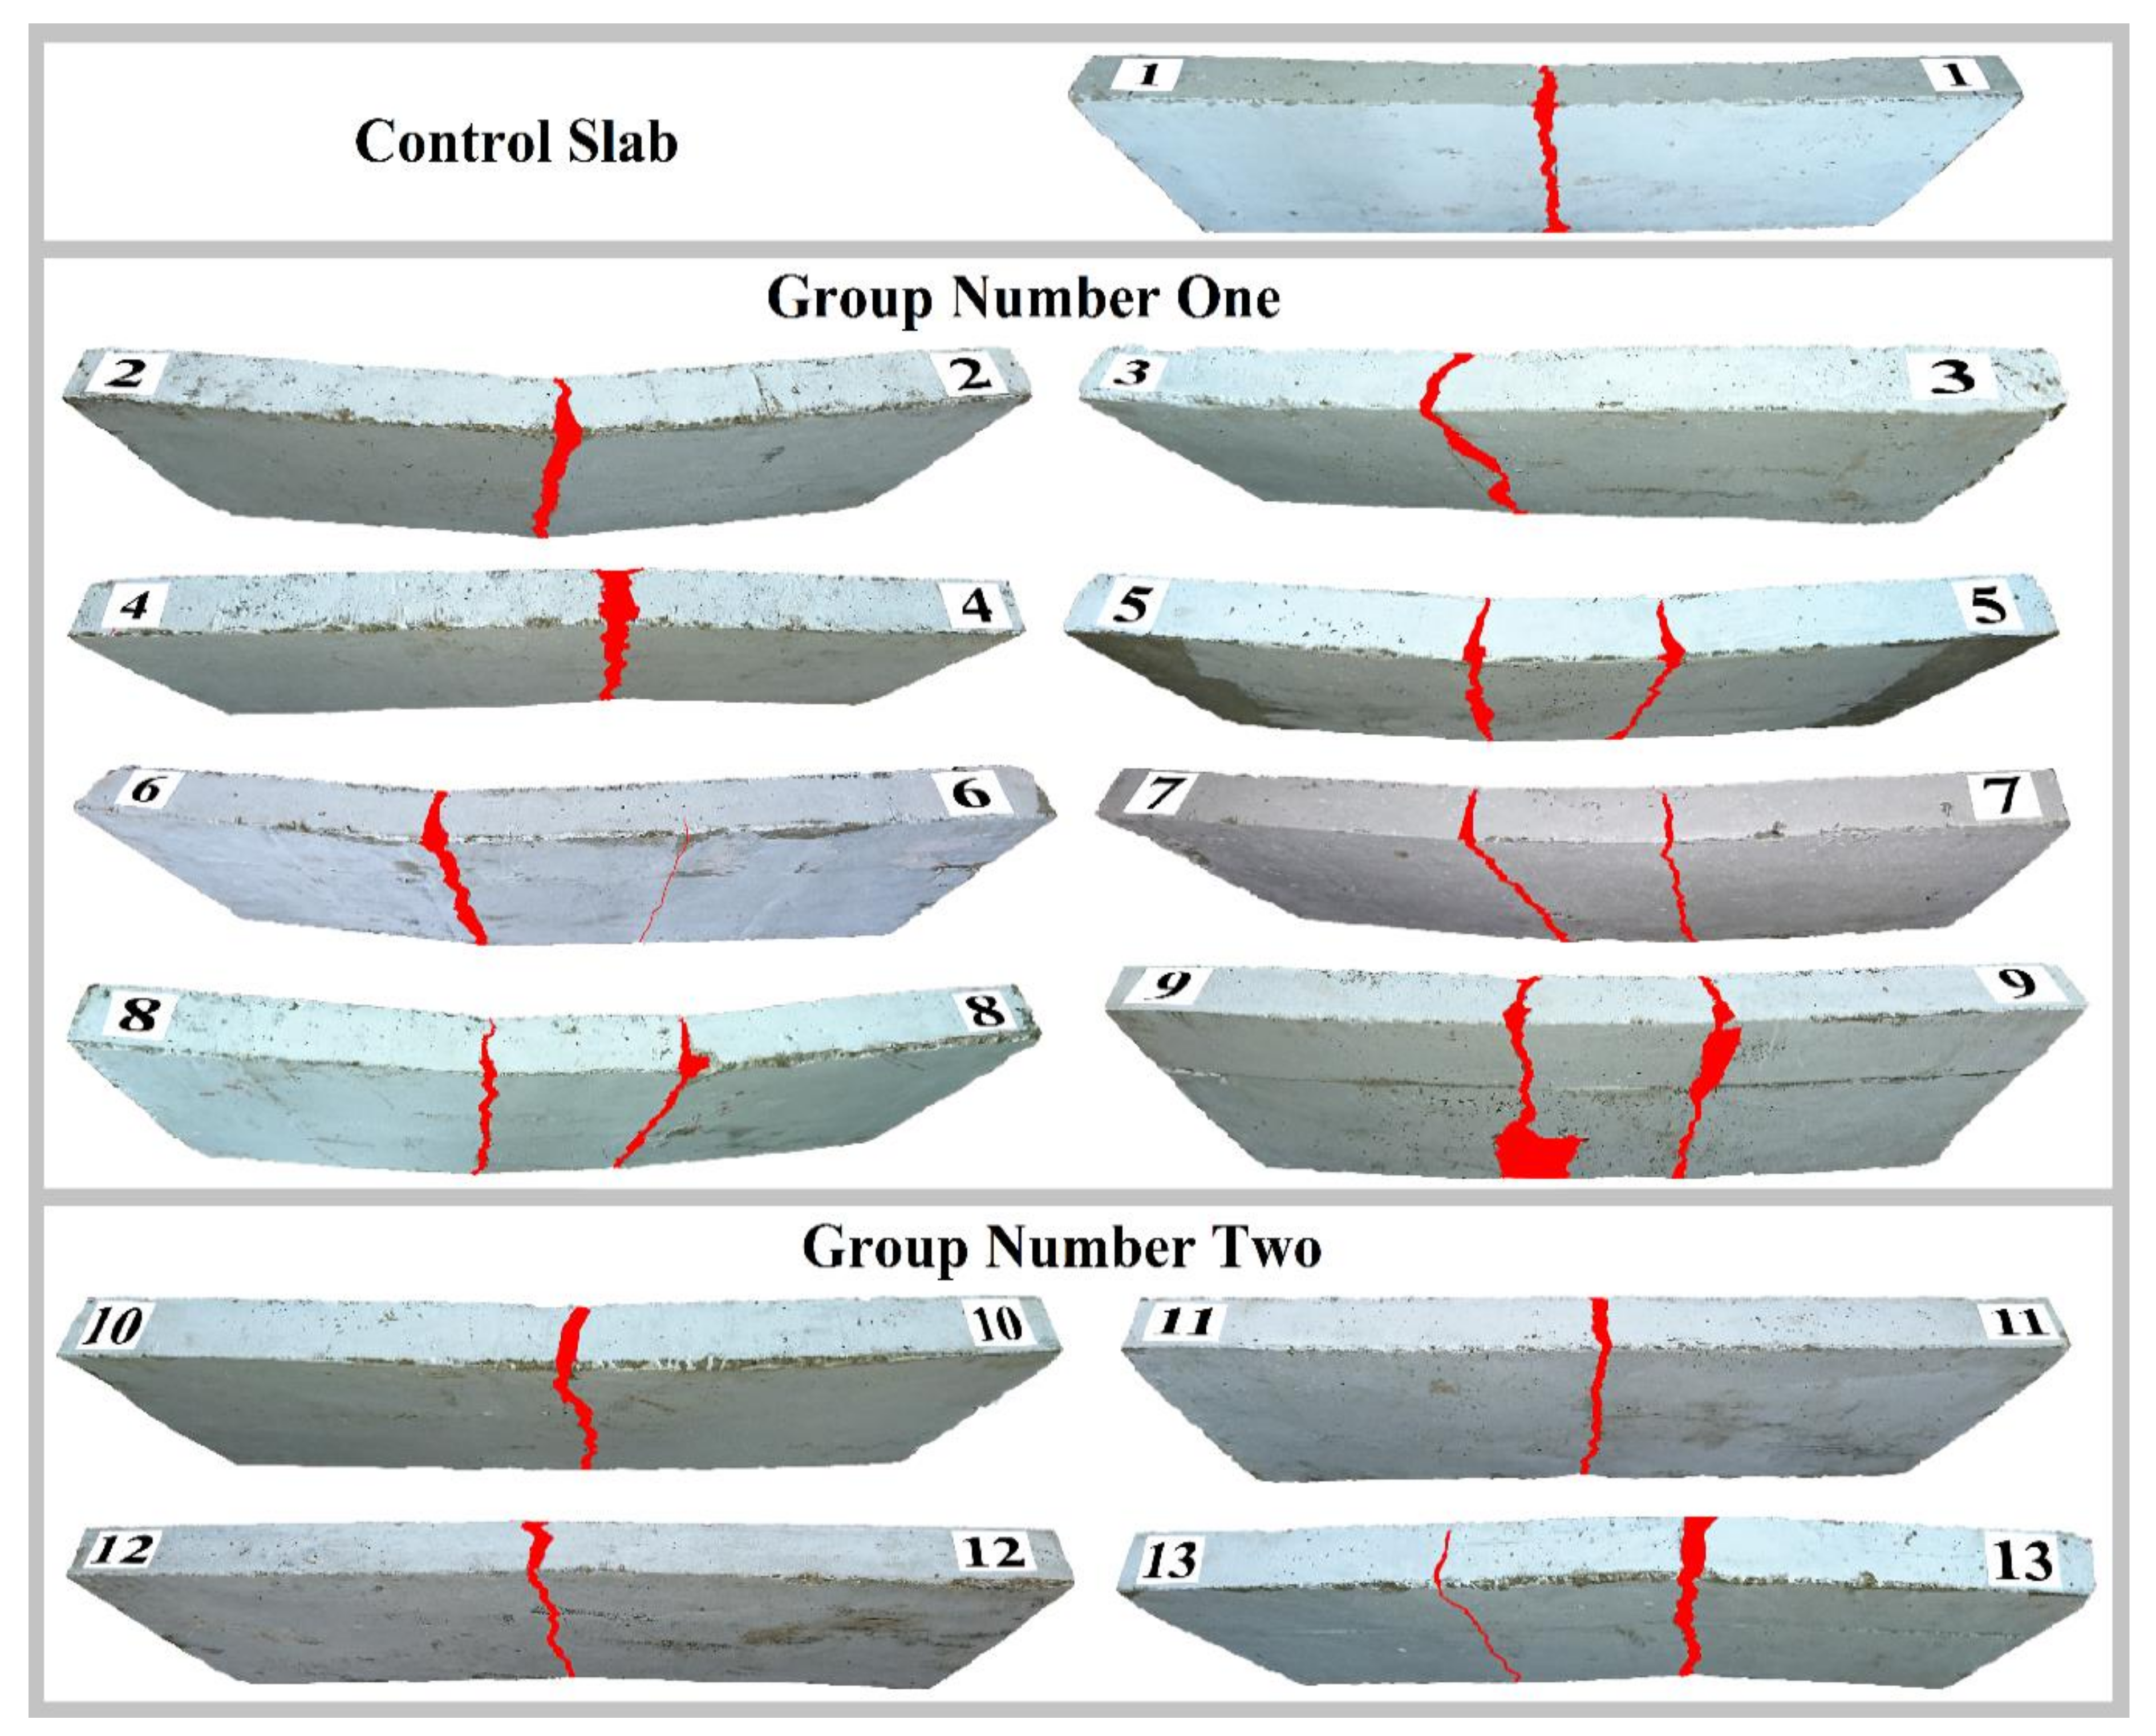
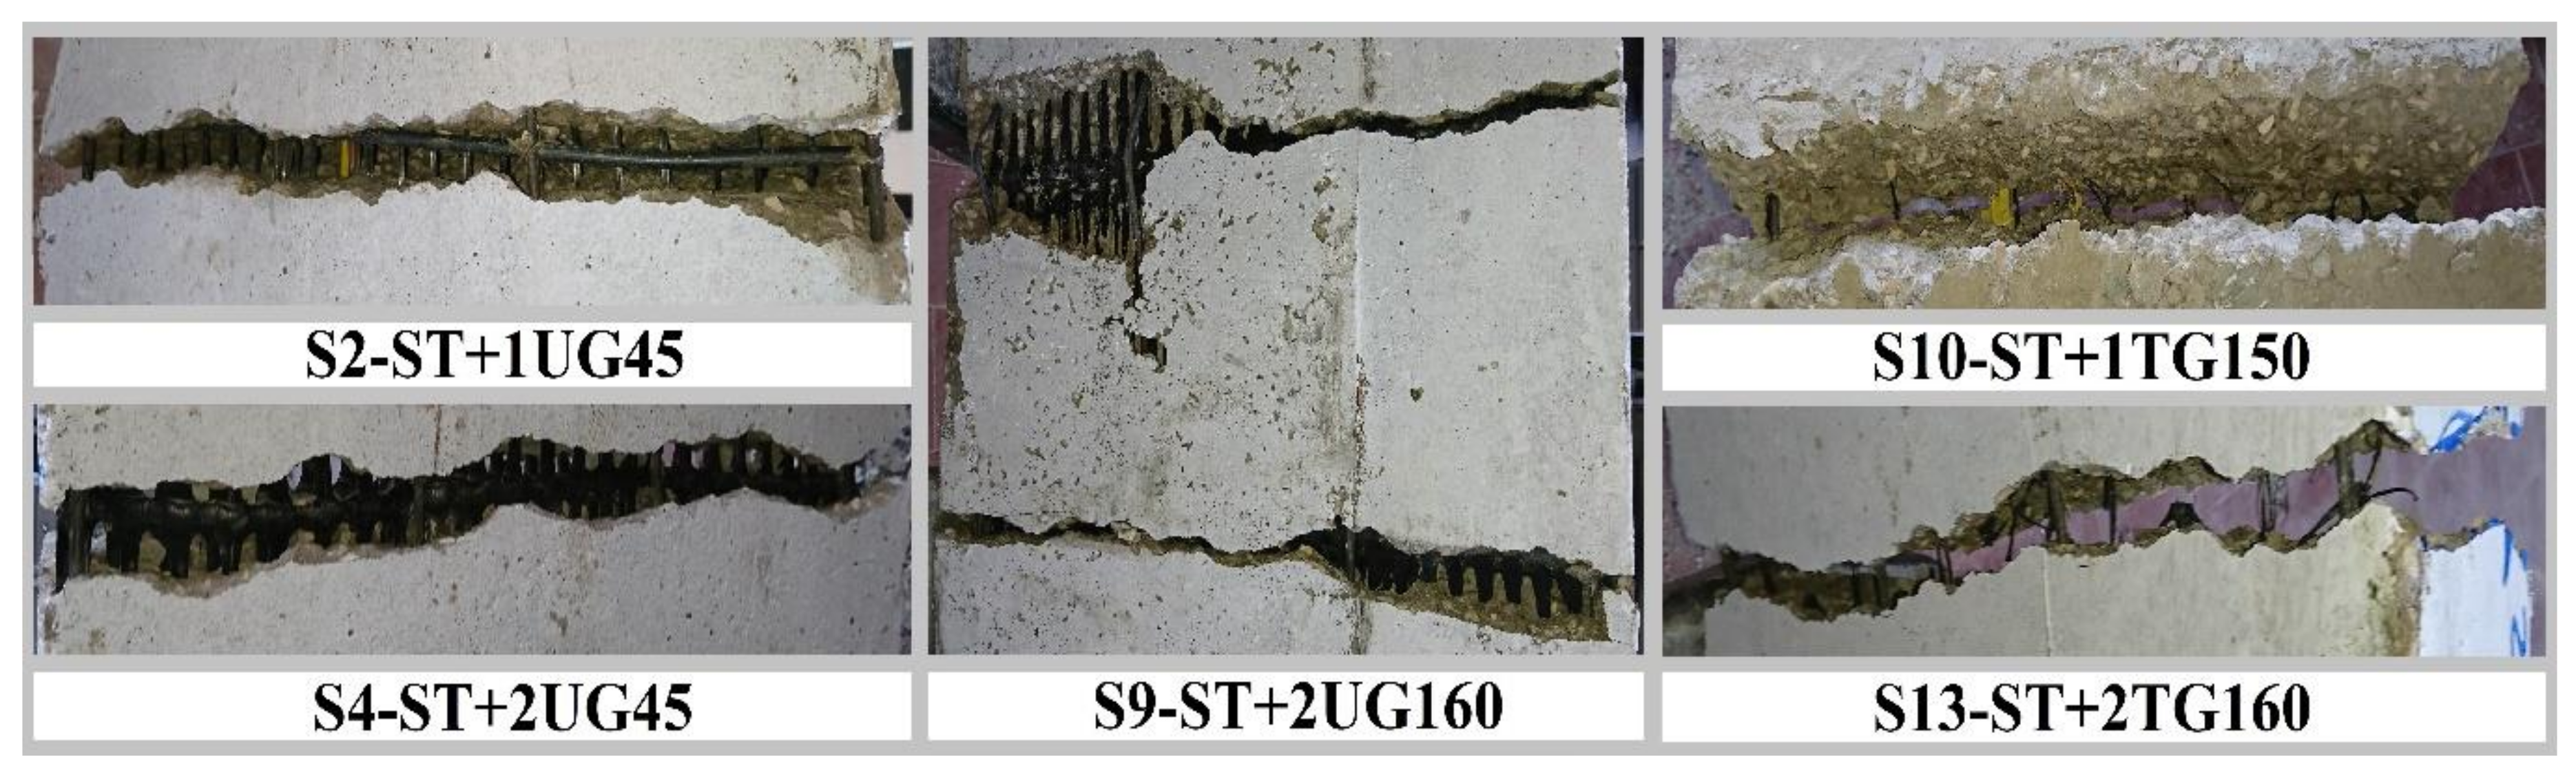
6. Failure Mechanism and Crack Patterns

In all concrete slabs, cracks occurred only in the middle third. Accordingly, only flexural cracks were formed, and no shear cracks were formed. The concrete slabs failure developed by the cracks widening, the formation of additional cracks in some slabs, and the extension of these cracks from the concrete bottom surface (tension zone) up to the concrete top surface (compression zone) until failure occurred. Figure 5 shows the slabs’ crack patterns. After the failure of all slabs, the cracks openings were checked to investigate the status of geogrids’ ribs. Figure 6 shows some examples of geogrids’ ribs status after the failure of the concrete slabs. For all uniaxial geogrids (group number one’ case study), no cutting occurred in the uniaxial geogrids’ ribs. For all triaxial geogrids (group number two’ case study), cutting occurred in most of the triaxial geogrids’ ribs. For concrete slab number S1 (the concrete control slab), only one crack was formed and increased gradually until the failure occurred. For group number one, concrete slabs number S2 to S4, only one crack was formed and increased gradually until the failure occurred; meanwhile, for concrete slabs number S5 to S9, two cracks were formed and increased gradually until the failure occurred. For group number two, concrete slabs number S10, to S12, only one crack was formed and increased gradually until the failure occurred; meanwhile, for concrete slab number S13, two cracks were formed and increased gradually until the failure occurred. Accordingly, there is a positive correlation between the number of occurred flexural cracks and the tensile strength of geogrids, as well as the number of geogrids’ layers.

7. Experimental Results Analysis and Discussions

The vertical displacements, load, and bottom reinforcement (geogrids and steel bars) strain, for all concrete slabs, were recorded; additionally, energy dissipation and ductility indexes for all concrete slabs were calculated. The experimental results and behaviors of group number one, and group number two will be discussed in comparison with the control slab.

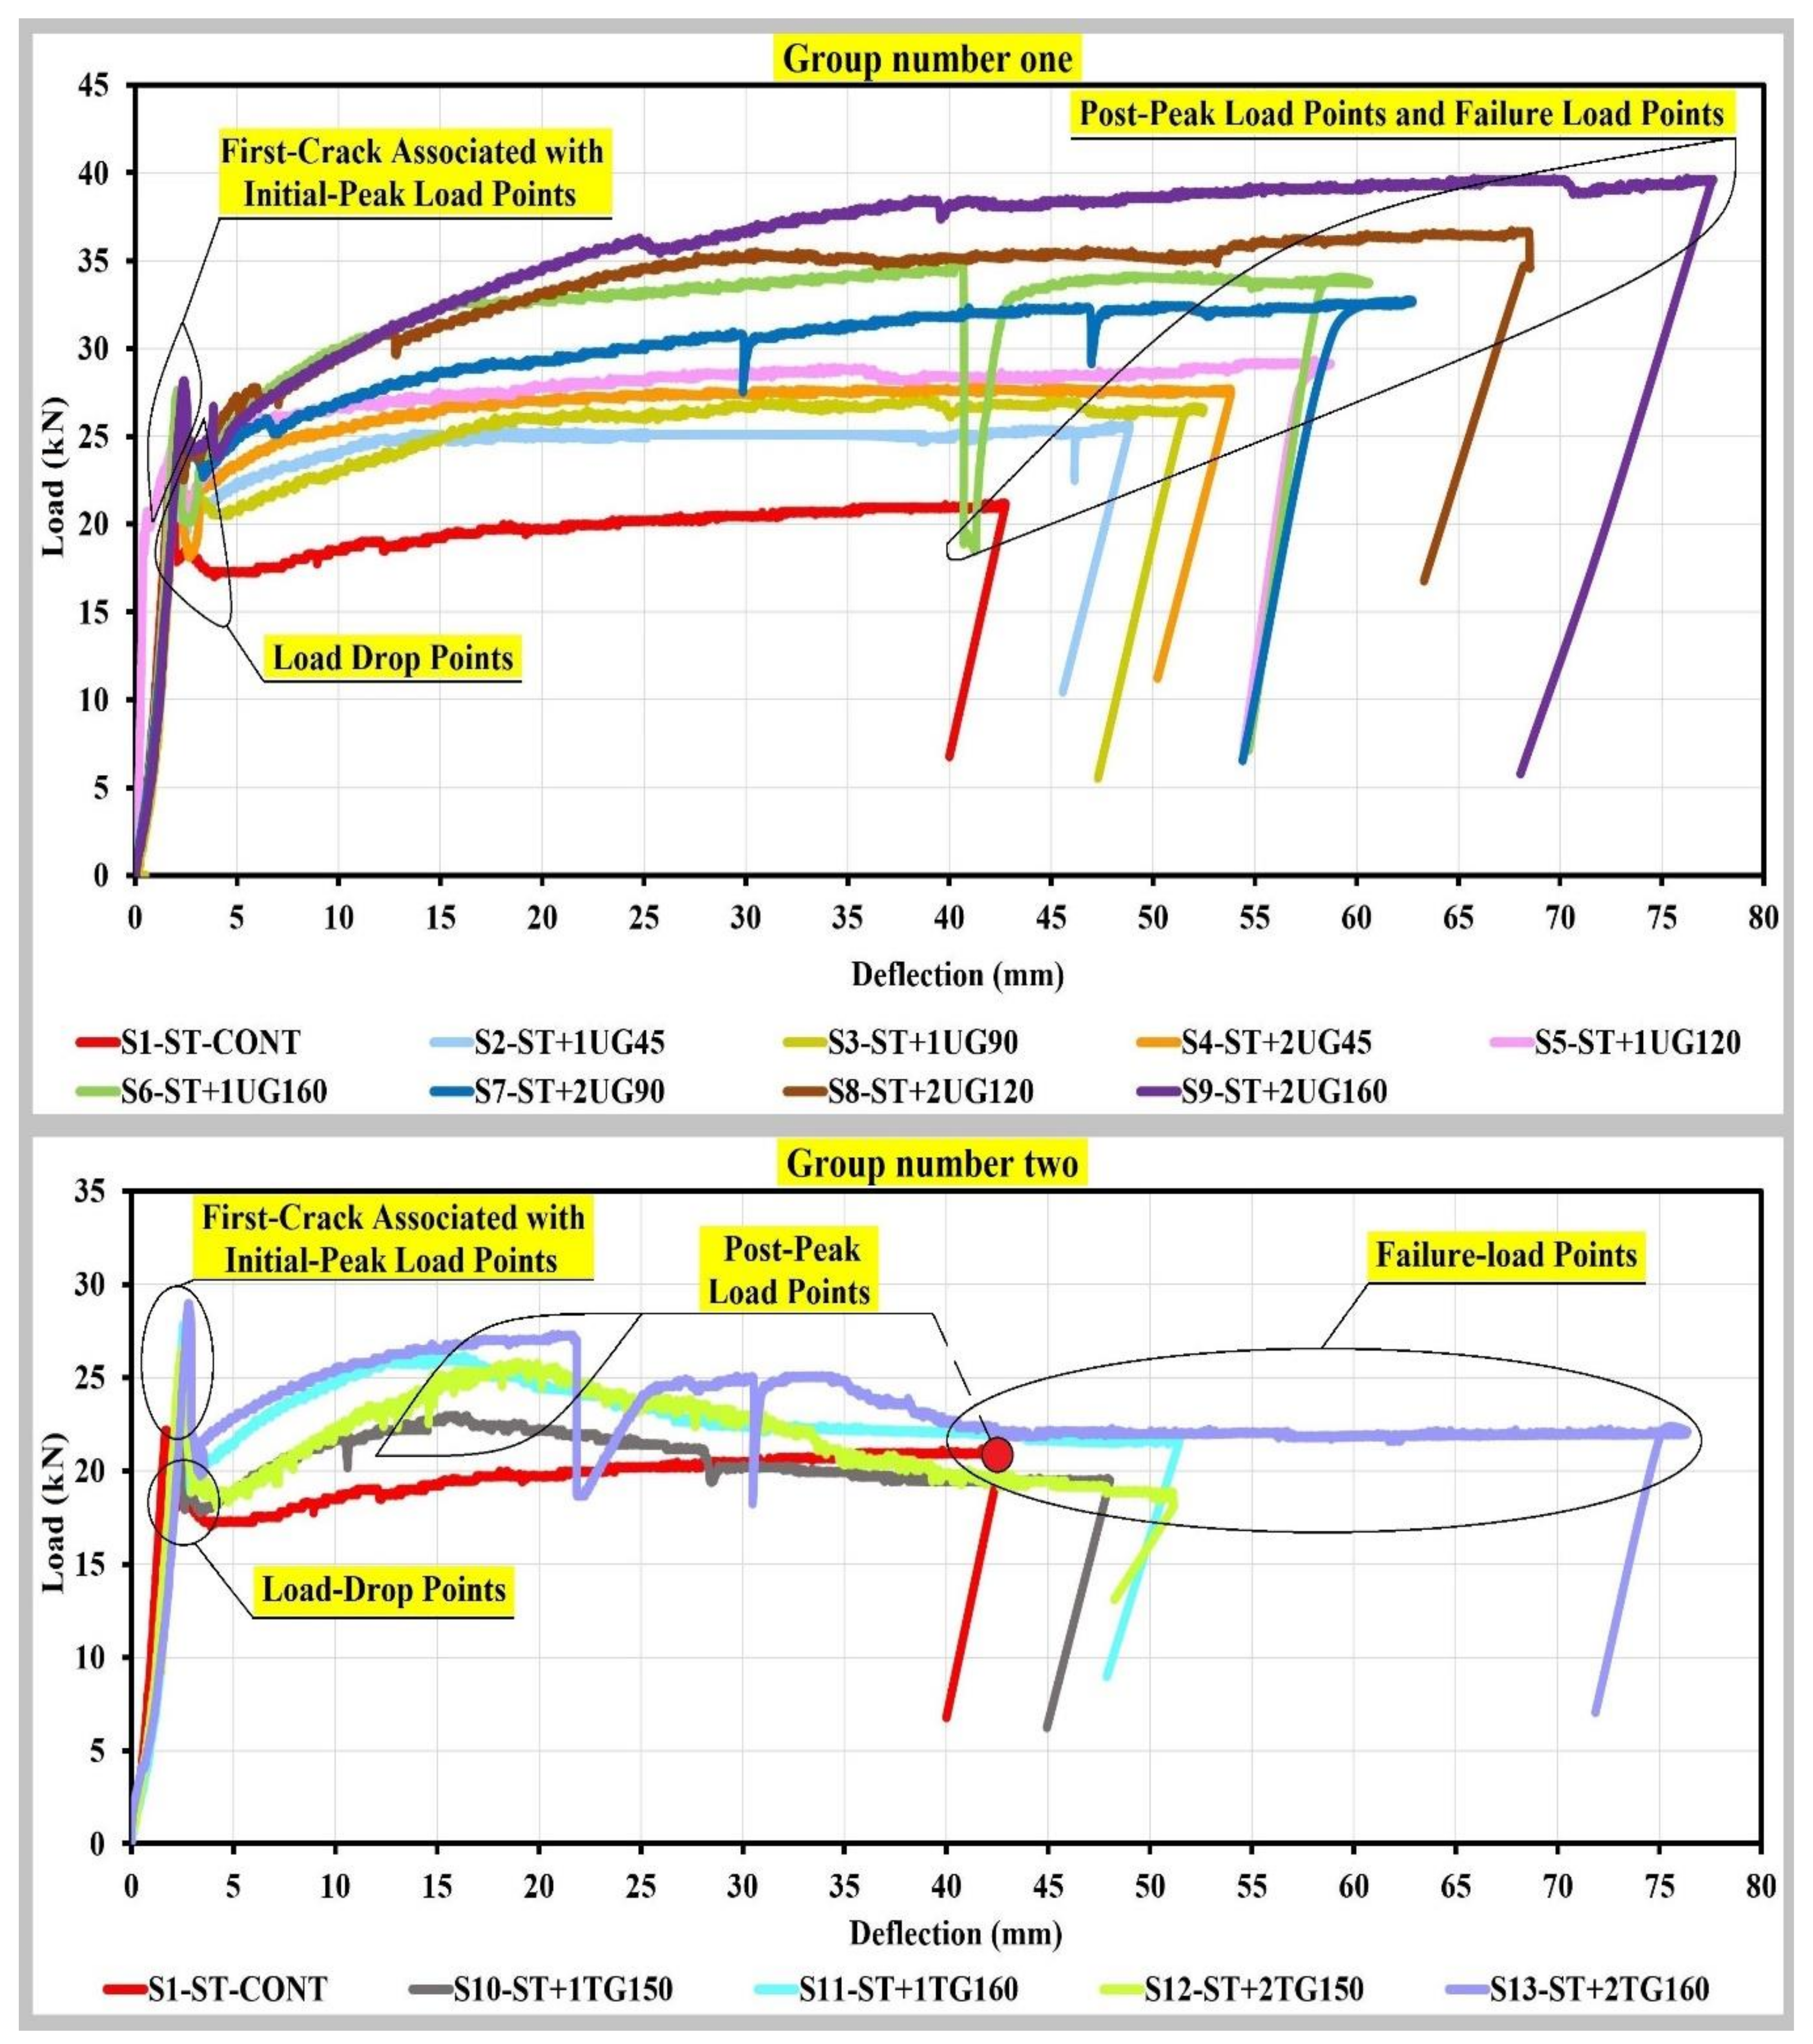
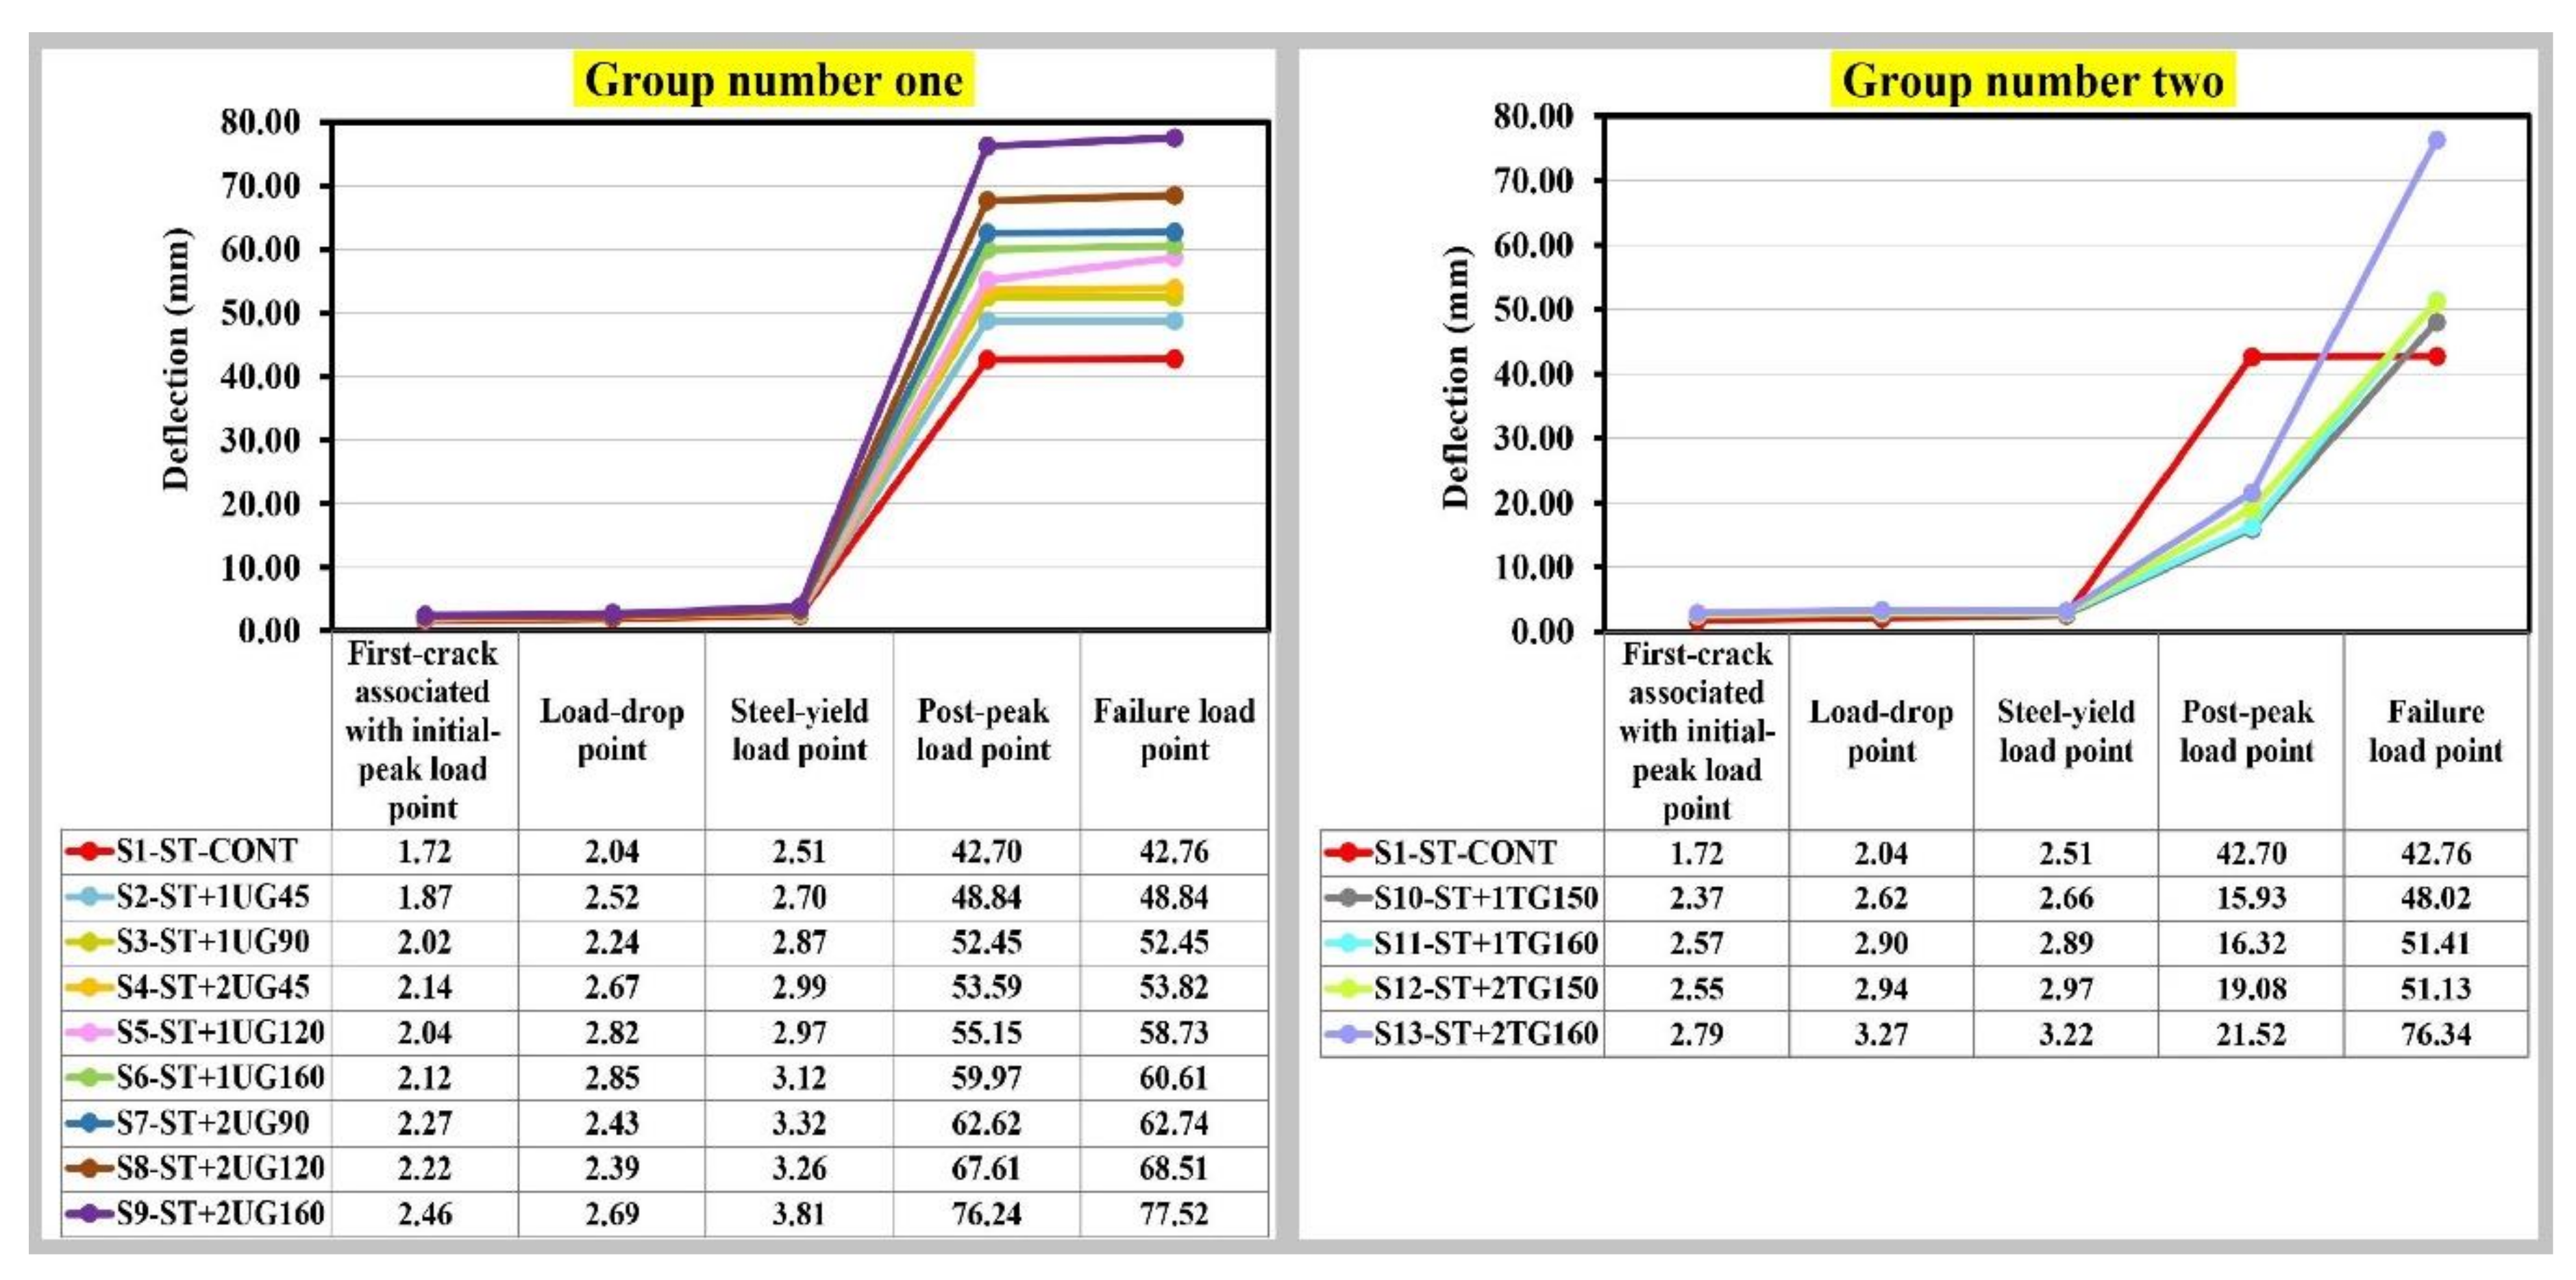
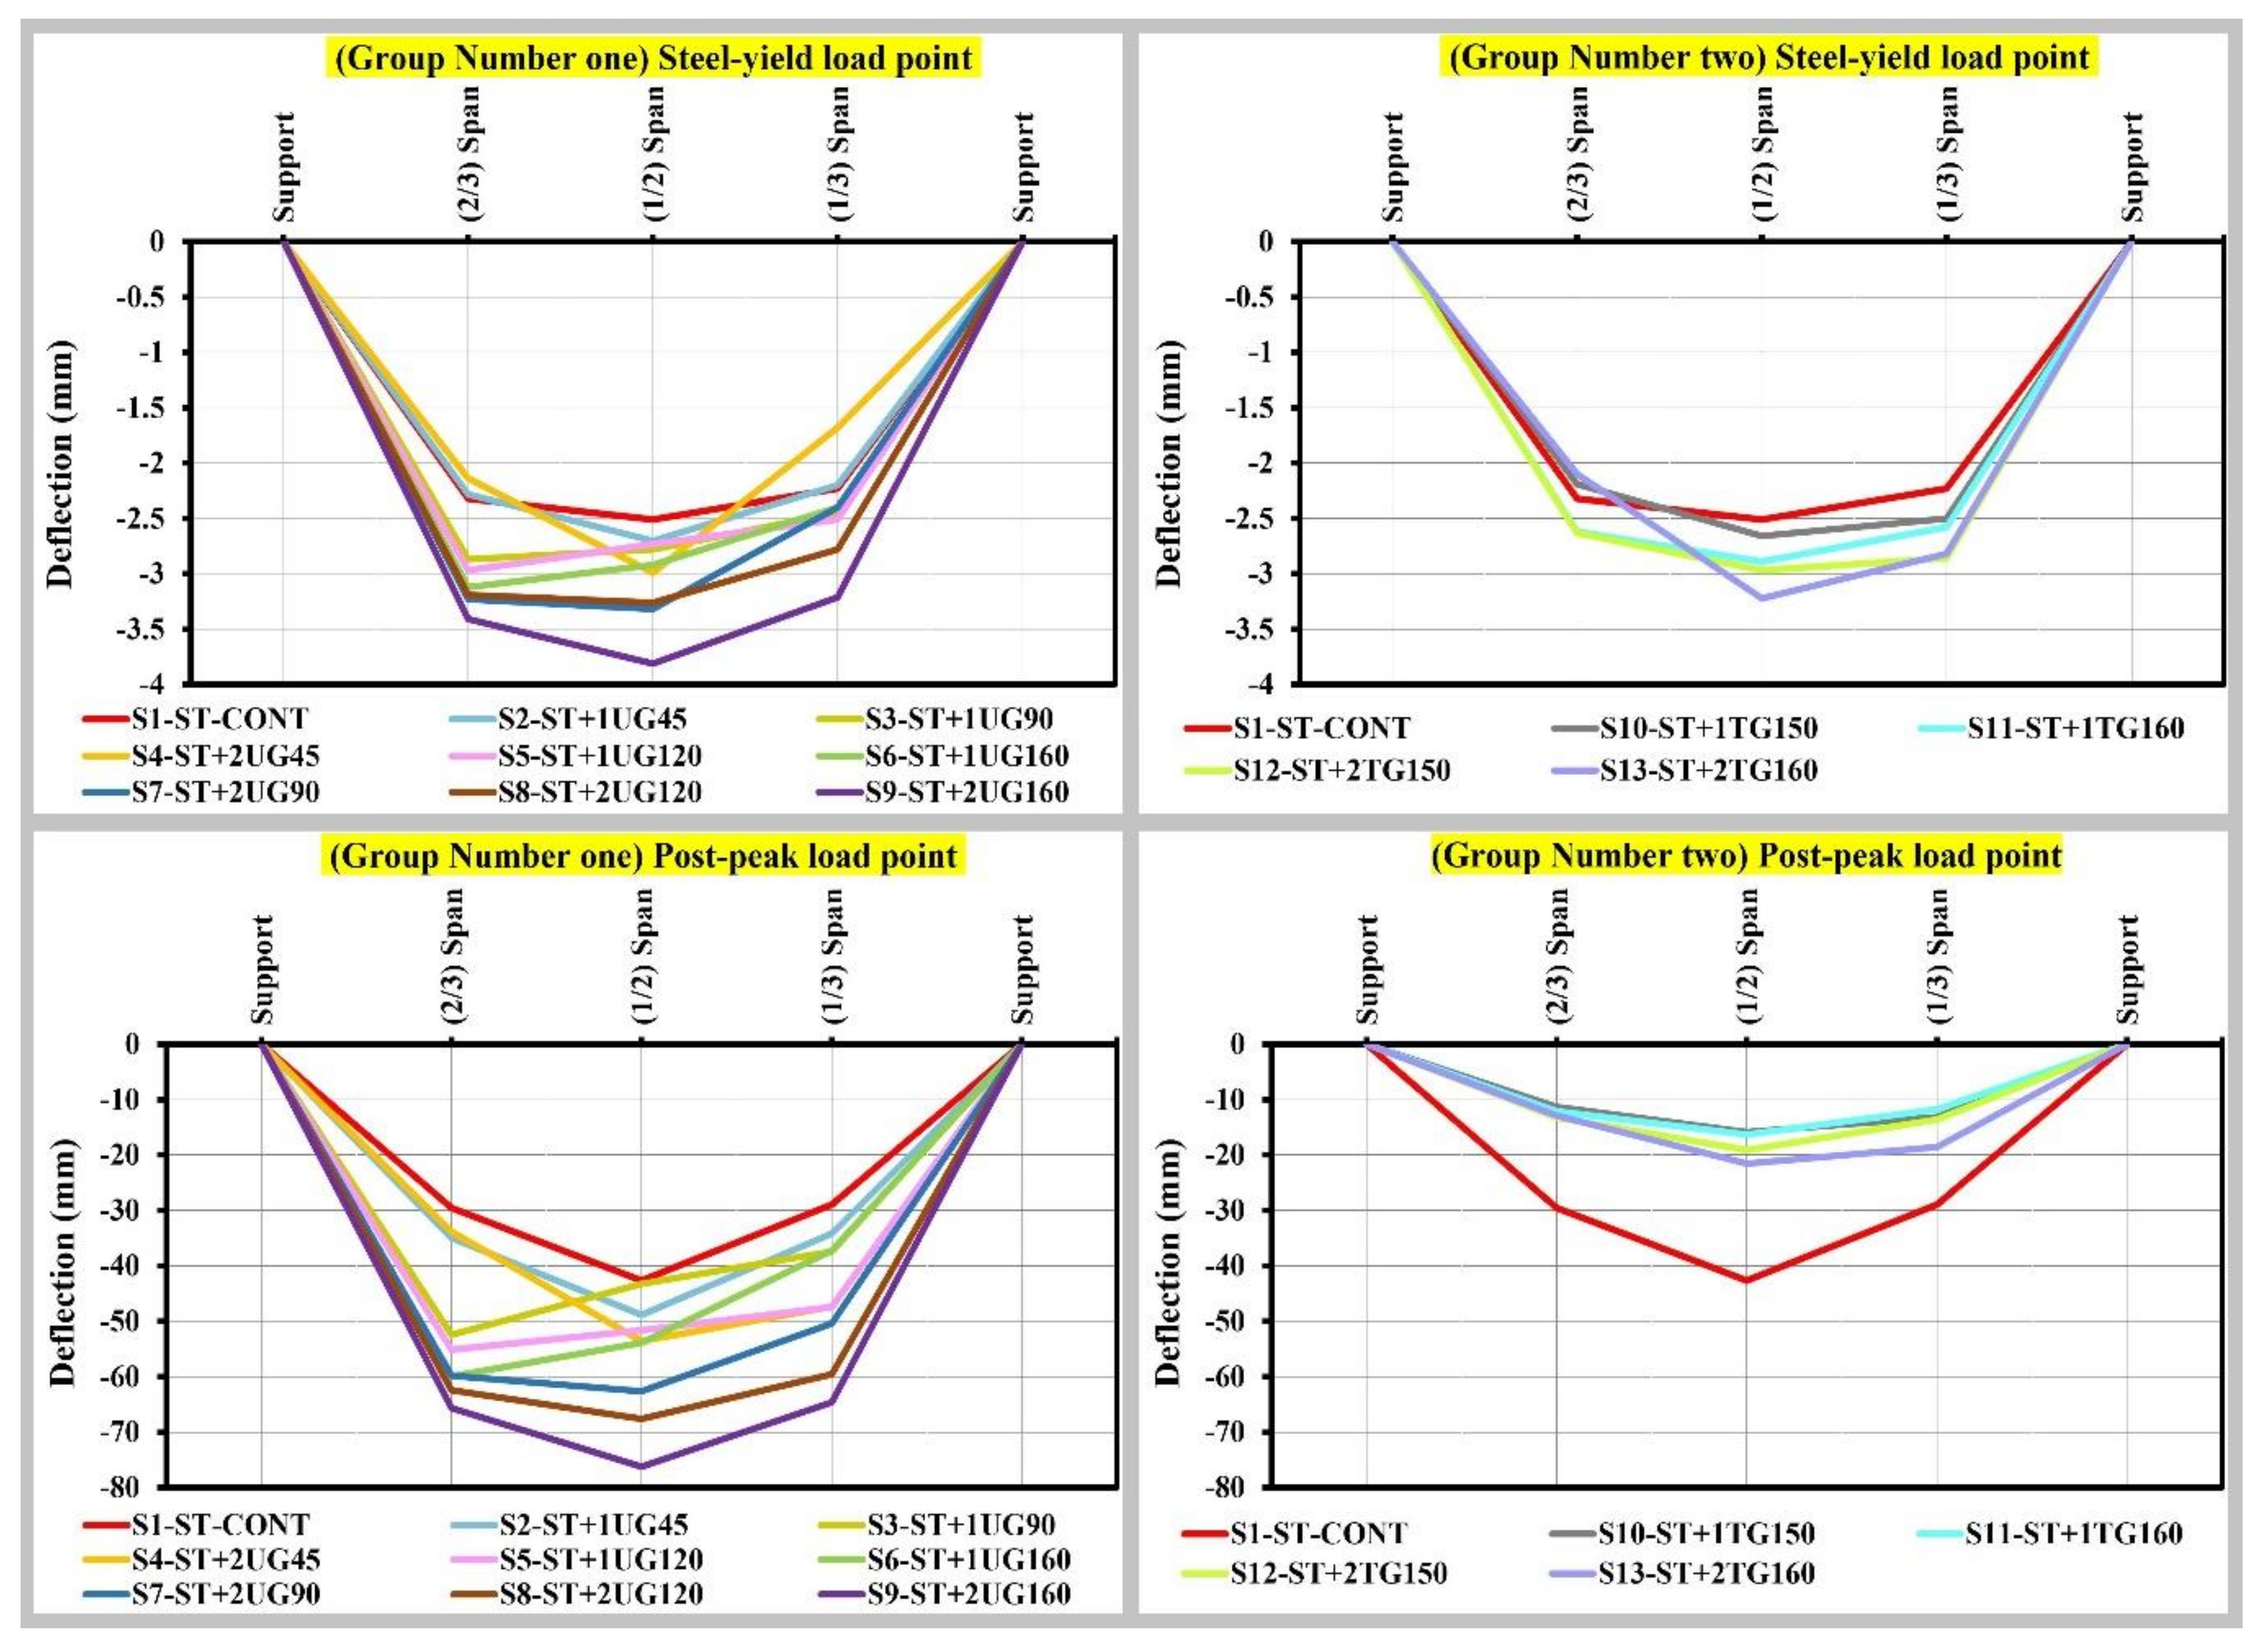
7.1. Load Versus Vertical Displacement Behavior

Before the first-crack, most of the tensile force was carried by the concrete section, and the load-deflection relation was a positive linear correlation until the load reached the first-crack. After that, a sudden drop in the load occurred concurrently with a sudden increase in the deflection, due to the used minimum ratio of the bottom reinforcement steel bars, which in turn, led to the inability of the concrete section to carry further tensile force after the first crack. The sudden drop in the load was with a percentage of 19% for the concrete control slab, a percentage varying from 8% to 30% for group number one’ concrete slabs, and a percentage varying from 26% to 32% for group number two’ concrete slabs, with no correlation to the tensile strength of geogrids and the number of geogrids’ layers. The sudden deflection increase was with a percentage of 19% for the concrete control slab, a percentage varying from 7% to 38% for group number one’ concrete slabs, and a percentage varying from 11% to 17% for group number two’ concrete slabs, with no correlation to the tensile strength of geogrids and the number of geogrids’ layers. It should be highlighted that the triaxial geogrids provided a higher sudden load drop percentage concurrently with a lower sudden deflection increase percentage when compared with the uniaxial geogrids. The first-crack was associated with initial-peak load and occurred at a load value of 1.05 times the post-peak load for the concrete control slab, a load value varying from 0.95 to 0.71 times the post-peak load for group number one’ concrete slabs, and a load value varying from 1.12 to 1.03 times the post-peak load for group number two’ concrete slabs. After the first-crack and at the site of crack, the tensile force carried by the concrete section transferred to the bottom reinforcement (geogrids and steel bars), and the concrete slabs recovered its strength and carried a further load, with a non-linear relation to the deflection, leading to a new load raise until the bottom reinforcement steel bars reached the steel-yield load at a load value of 0.87 times the post-peak load for the concrete control slab, a load value varying from 0.80 to 0.63 times the post-peak load for group number one’ concrete slabs, and a load value varying from 0.84 to 0.77 times the post-peak load for group number two’ concrete slabs. After that, the load continues to increase until it reached the post-peak load and providing post-cracking ductility and extra load capacity. The new raise of the load-deflection curve was a slow, gradual increase with a lower correlation slope, due to the decrease of the modulus of elasticity. Furthermore, slight drops in the load may occur due to yield or rupture of one or more geogrids’ ribs, or due to the partial movement of uniaxial geogrids’ transverse bars or triaxial geogrids’ integral nodes. These slight load drops were followed by a sudden load increase, due to the redistribution of the tensile force on the geogrids’ ribs. Figure 7 shows the load-deflection curves per each group concrete slabs in comparison to the concrete control slab. The deflection values at the first-crack load (initial peak load) increased by a percent varying from 9% to 43% for group number one’ concrete slabs, and percent varying from 38% to 62% for group number two’ concrete slabs, compared to the concrete control slab with a weak positive correlation to the tensile strength of geogrids and the number of geogrids’ layers. The deflection values at the steel-yield load increased by a percent varying from 8% to 52% for group number one’ concrete slabs, and percent varying from 6% to 28% for group number two’ concrete slabs, compared to the concrete control slab with a positive correlation to the tensile strength of geogrids and the number of geogrids’ layers. For group number one, the deflection values at the post-peak load increased by a percent varying from 23% to 79% compared to the concrete control slab with a positive correlation to the tensile strength of uniaxial geogrids and the number of uniaxial geogrids’ layers. Meanwhile, for group number two, the deflection values at the post-peak load decreased by a percent varying from 63% to 50% compared to the concrete control slab, while it has a positive correlation to the tensile strength of triaxial geogrids and the number of triaxial geogrids’ layers. Figure 8 shows the deflection values of each group concrete slabs at the concrete slabs’ critical load points compared to the concrete control slab. Figure 9 shows the deflection patterns of each group concrete slabs at the steel-yield load and post-peak load compared to the concrete control slab. It should be highlighted that concrete slab number S13 provided a higher increment of the deflection at failure load, due to the occurring of two flexural crack, not one crack compared to the other group number two’ concrete slabs, which in turn increased the number of contributed triaxial geogrids’ hexagon pitches to carry the tensile force; meanwhile, for group number one, the gradual increase of uniaxial geogrids’ ribs portions contributing to carrying the tensile force led to a gradual increment of the deflection. It should be highlighted that for group number two, the occurred numerous triaxial geogrids’ ribs cutting led to a gradual decrease of load after the post-peak load followed by a large incremental increase of the deflection until the cutting of the most of ribs then the failure occurred; meanwhile, for the group number one, as no uniaxial geogrids’ ribs were cutting occurred the post-load increased gradually until the post-peak load then the failure occurred.
The relation between the deflection at the initial-peak load, the steel yield load or the post-peak load, and the tensile strength of geogrids or the number of geogrids’ layers was studied in detail and presented in Figure 10. It is clear that: It is a positive correlation during the loading period for both cases of using uniaxial geogrid or triaxial geogrid as additional reinforcement to the steel bars. Meanwhile, the cases of using triaxial geogrid as additional reinforcement to the steel bars provided lower deflection values when compared with the uniaxial geogrid, especially for the deflection values at the post-peak load.

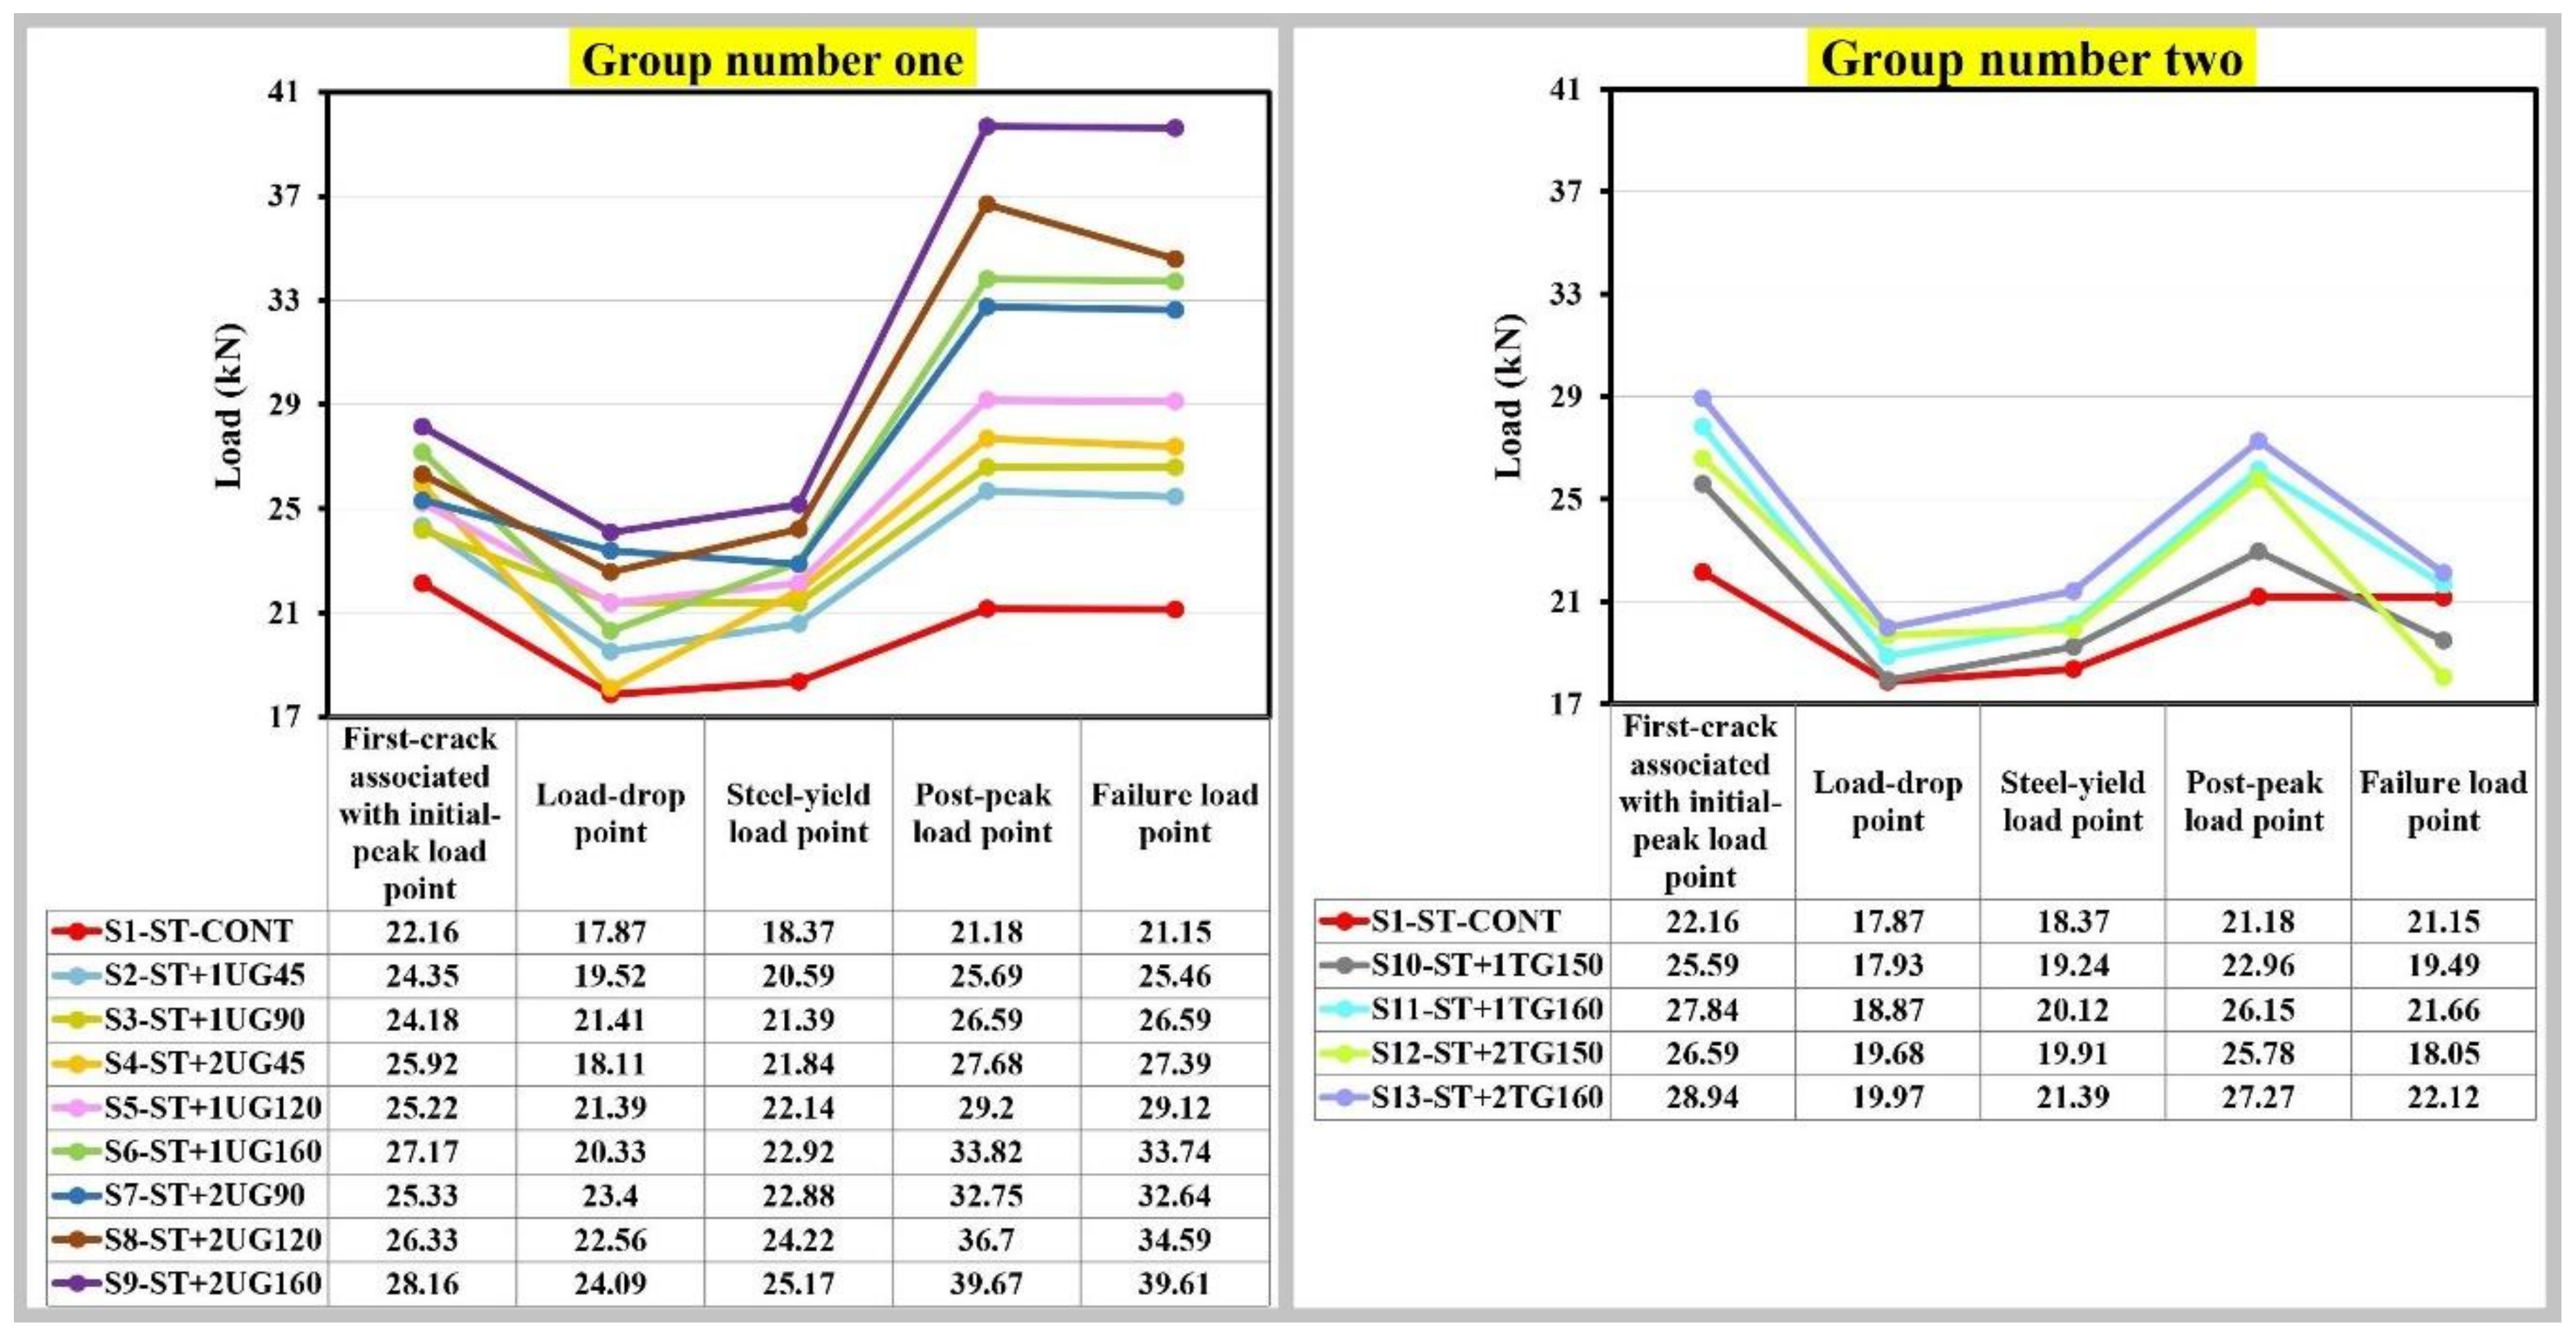
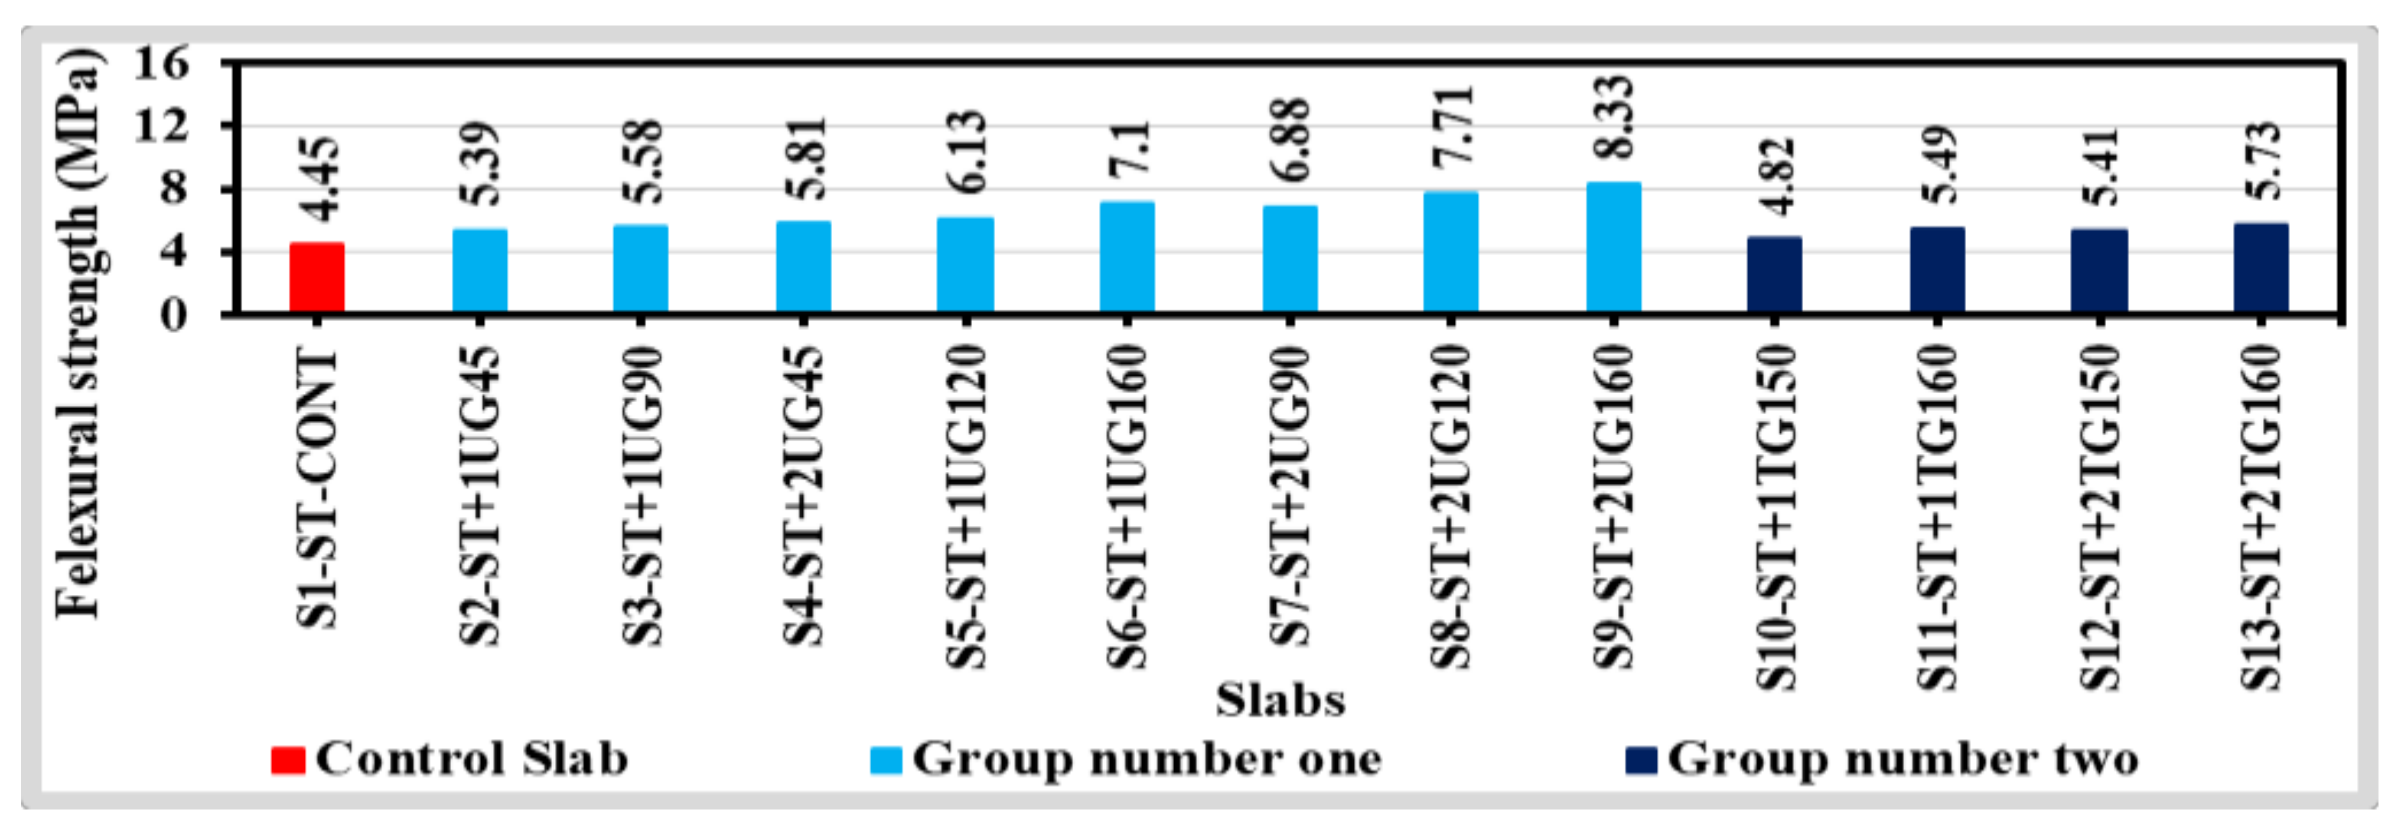
7.2. Cracking Load, Steel-Yield Load, Ultimate Load, and Flexural Strength

First-crack load (initial-peak load), steel-yield load, and post-peak load were recorded, and post-peak flexural strength values were calculated from equation-1. The first-crack load (initial peak load) values increased by a percent varying from 10% to 27% for group number one’ concrete slabs, and percent varying from 15% to 31% for group number two’ concrete slabs, compared to the concrete control slab with a weak positive correlation to the tensile strength of geogrids and the number of geogrids’ layers. The steel-yield load values increased by a percent varying from 12% to 37% for group number one’ concrete slabs, and percent varying from 5% to 16% for group number two’ concrete slabs, compared to the concrete control slab with a positive correlation to the tensile strength of geogrids and the number of geogrids’ layers. The post-peak load values increased by a percent varying from 21% to 87% for group number one’ concrete slabs, and percent varying from 8% to 29% for group number two’ concrete slabs, compared to the concrete control slab with a positive correlation to the tensile strength of geogrids and the number of geogrids’ layers. Figure 11 shows load values at different critical points per each group concrete slabs compared to the control slab. Figure 12 shows the values of the post-peak flexural strength for each concrete slab compared to the concrete control slab.
The post-peak flexural strength of the concrete slabs ( σ ,   in   MPa ) was calculated using the following Equation (1);
σ = 3 P L L i 2 b d 2
where; P is the post-peak load (N), L is the distance between the supports (mm), Li is the distance between the line-loads (mm), b is the width of the concrete slab (mm), and d is the depth of the concrete slab (mm).
The relation between initial-peak load, steel yield load, or post-peak load, and the tensile strength of geogrids or the number of geogrids’ layers was studied in detail and presented in Figure 13. It is clear that there is a weak positive correlation during the initial-Peak loading period, while it changed gradually through the post-weak loading period to be a positive correlation at the post-peak load. Meanwhile, the cases of using triaxial geogrids as additional reinforcement to the steel bars provided higher first-crack load (initial-peak load), lower steel-yield load, and lower post-peak load values when compared with the uniaxial geogrid.

7.3. Displacement Ductility Behavior

The structural element ductility might be defined by its ability to deform under large deflection at or near the failure load without a significant reduction in its strength, providing an adequate warning before failure. Concrete structures should maintain the strength above the yield strength up to at least the allowable plastic deformation adopted in the design that allows a certain degree of damage during earthquakes; therefore, it becomes necessary to provide a sufficient amount of ductility to concrete structures so that they should not collapse during the expected earthquakes [29]. The displacement ductility index is the ratio of the deflection value at failure (ultimate state) to the deflection value of the steel-yield or the first-crack [30]. The displacement ductility index under this study was calculated as the ratio of deflection at the concrete slab failure to the deflection at the bottom reinforcement steel-yield load. The displacement ductility indexes were increased by a percent varying from 6% to 23% for group number one’ concrete slabs, compared to the concrete control slab with a positive correlation to the tensile strength of uniaxial geogrids and the number of uniaxial geogrids’ layers, while it was increased by a percent equal to 6%, 4%, 1%, and 31% for group number two’ concrete slabs numbers S10, S11, S12, and S13, respectively, compared to the concrete control slab with a weak positive correlation to the tensile strength of triaxial geogrids and the number of triaxial geogrids’ layers, as shown in Figure 14. The one and two layers of uniaxial geogrids with the experimental tensile strength of 103.91 kN/m and 143.46 kN/m provide more efficient utilization as they had higher displacement ductility index values when compared to the other geogrids’ cases, as shown in Figure 14, Except for S13. As S13 provided a higher increment of the deflection at failure load, due to the occurring of two flexural crack (not one crack), which in turn increased the number of contributed triaxial geogrids’ hexagon pitches to carry the tensile force, consequently, provided a higher increment of the displacement ductility index compared to the other group number two’ concrete slabs; meanwhile, for group number one, the gradual increase of uniaxial geogrids’ ribs portions contributing to carrying the tensile force led to a gradual increment of the displacement ductility index.

7.4. Energy Dissipation Behavior

Considerable energy dissipation ability is favorable in the case of large earthquakes under which significant energy dissipation is required because a smaller energy dissipation results in a significant dynamic response and hysteretic damping of concrete structures during earthquakes [29]. Energy dissipation was calculated based on the area enclosed by the load-deflection curve [24]. The behavior of the tested slabs under flexure has also been compared in the form of energy dissipation capacity, which was calculated as the area under its load-deflection curves in Figure 7. The energy dissipation capacities were increased by a percent varying from 38% to 234% for group number one’ concrete slabs, compared to the concrete control slab with a positive correlation to the tensile strength of uniaxial geogrids and the number of uniaxial geogrids’ layers, while it was increased by a percent equal to 22%, 40%, 67%, and 122% for group number two’ concrete slabs numbers S10, S11, S12, and S13, respectively, compared to the concrete control slab with a positive correlation to the tensile strength of triaxial geogrids and the number of triaxial geogrids’ layers, as shown in Figure 15. The one and two uniaxial geogrids’ layers with the experimental tensile strength of 103.91 kN/m and 143.46 kN/m provide more efficient utilization as they had higher energy dissipation values when compared to the other geogrids’ cases, as shown in Figure 15. It should be highlighted that: S13 provided a higher increment of the energy dissipation capacity, due to it has an approximate duplication of contributed triaxial geogrids’ hexagon pitches to carry the tensile force (two cracks occurred) compared to the other group number two’ concrete slabs. Meanwhile, for group number one, the gradual increase of uniaxial geogrids’ ribs portions contributing to carrying the tensile force led to a gradual increment of the energy dissipation capacity.

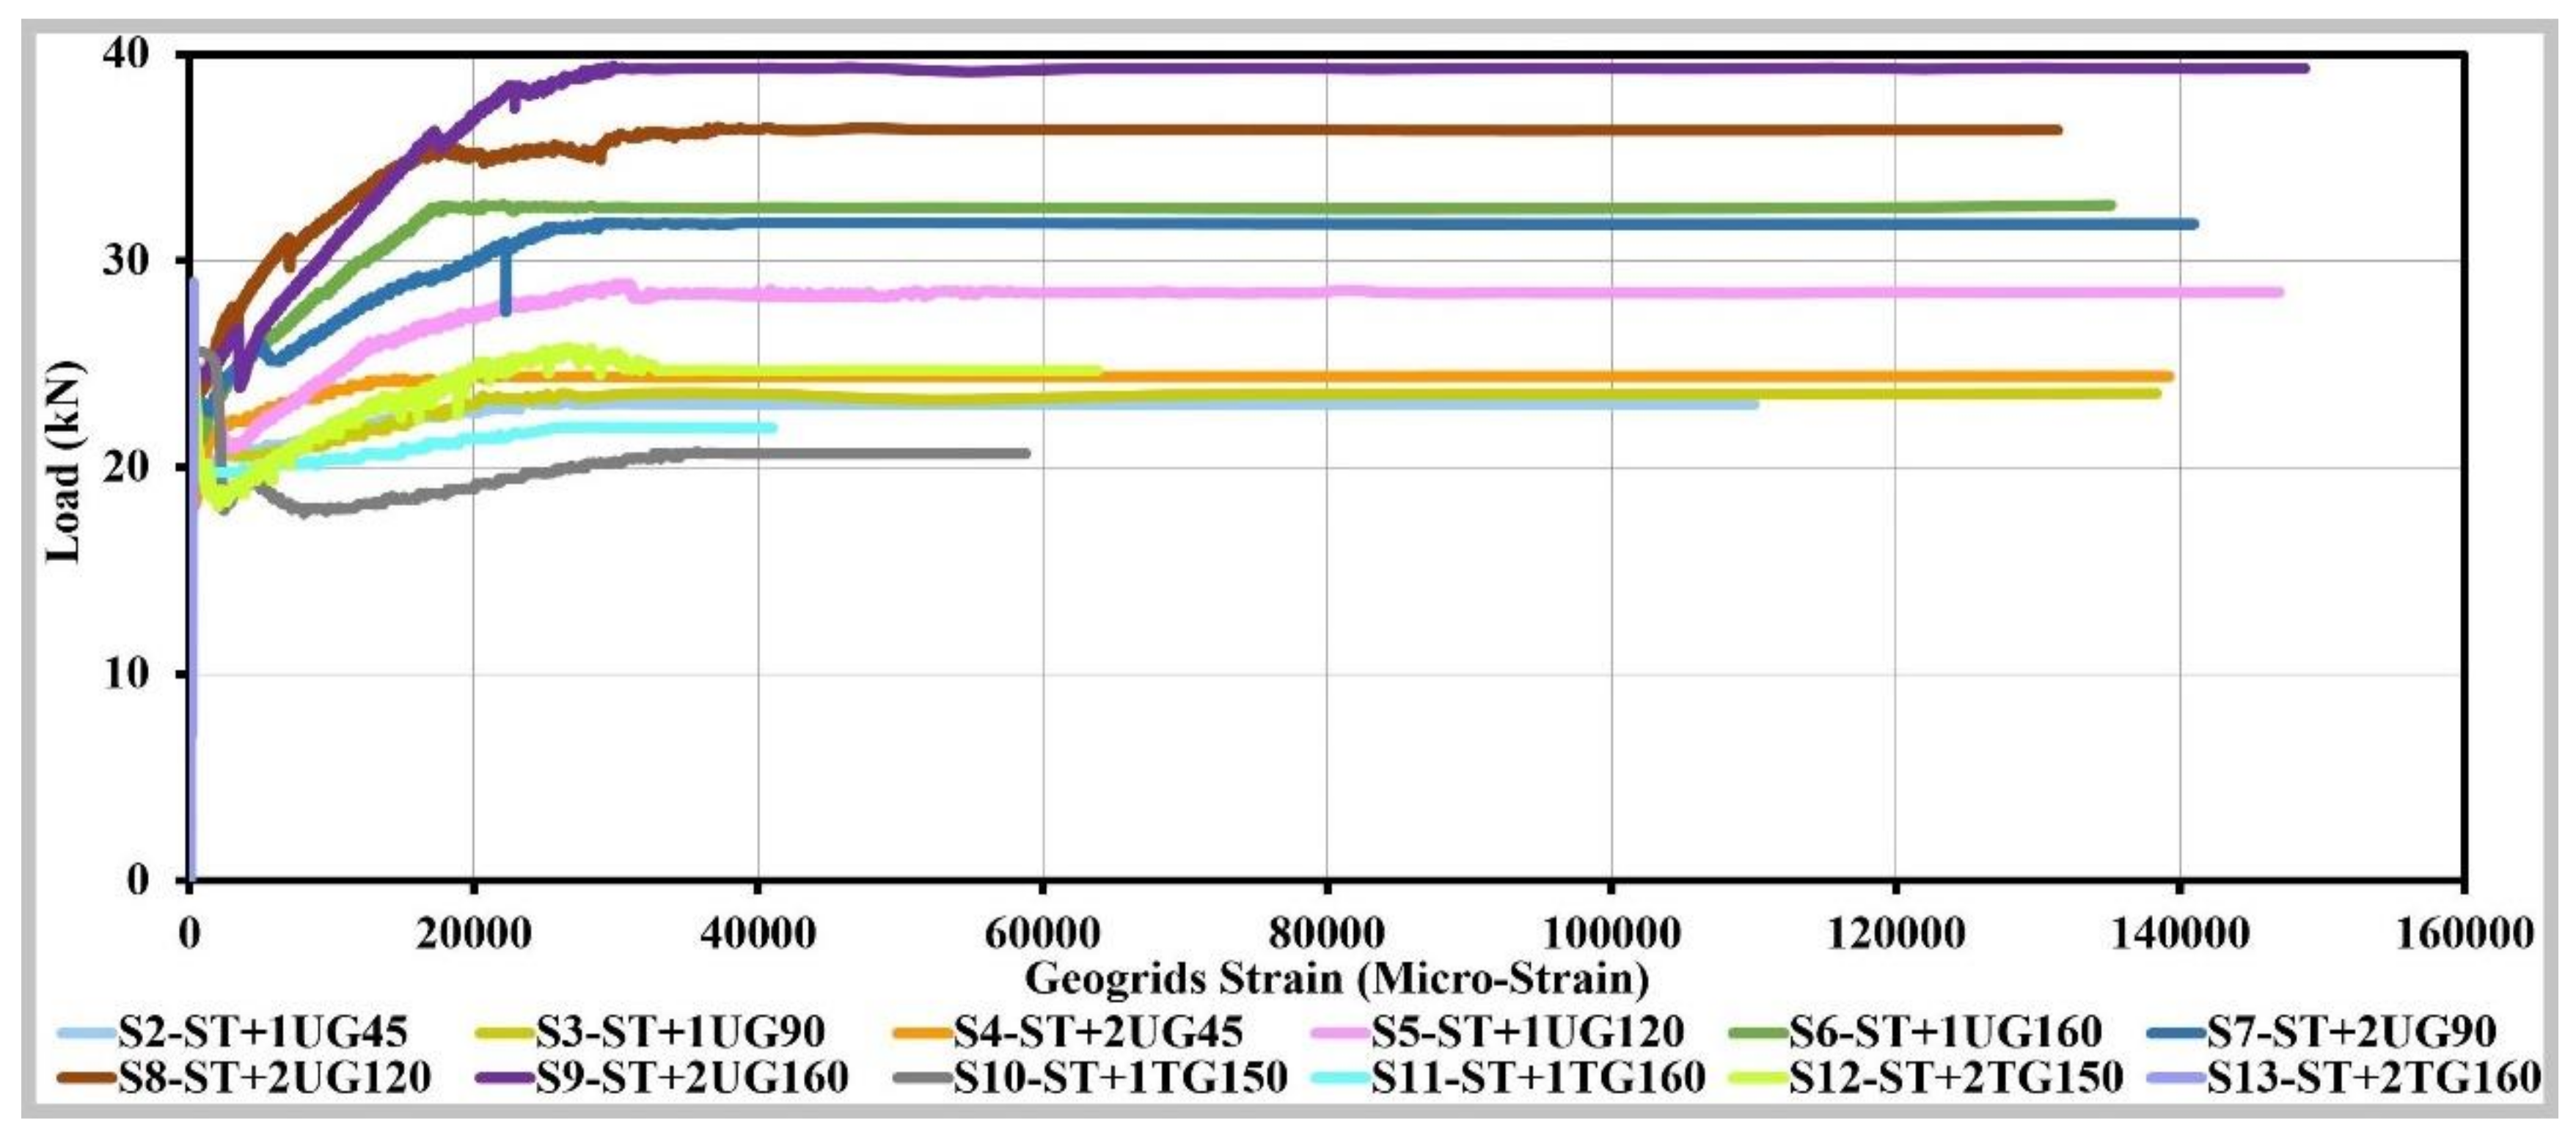
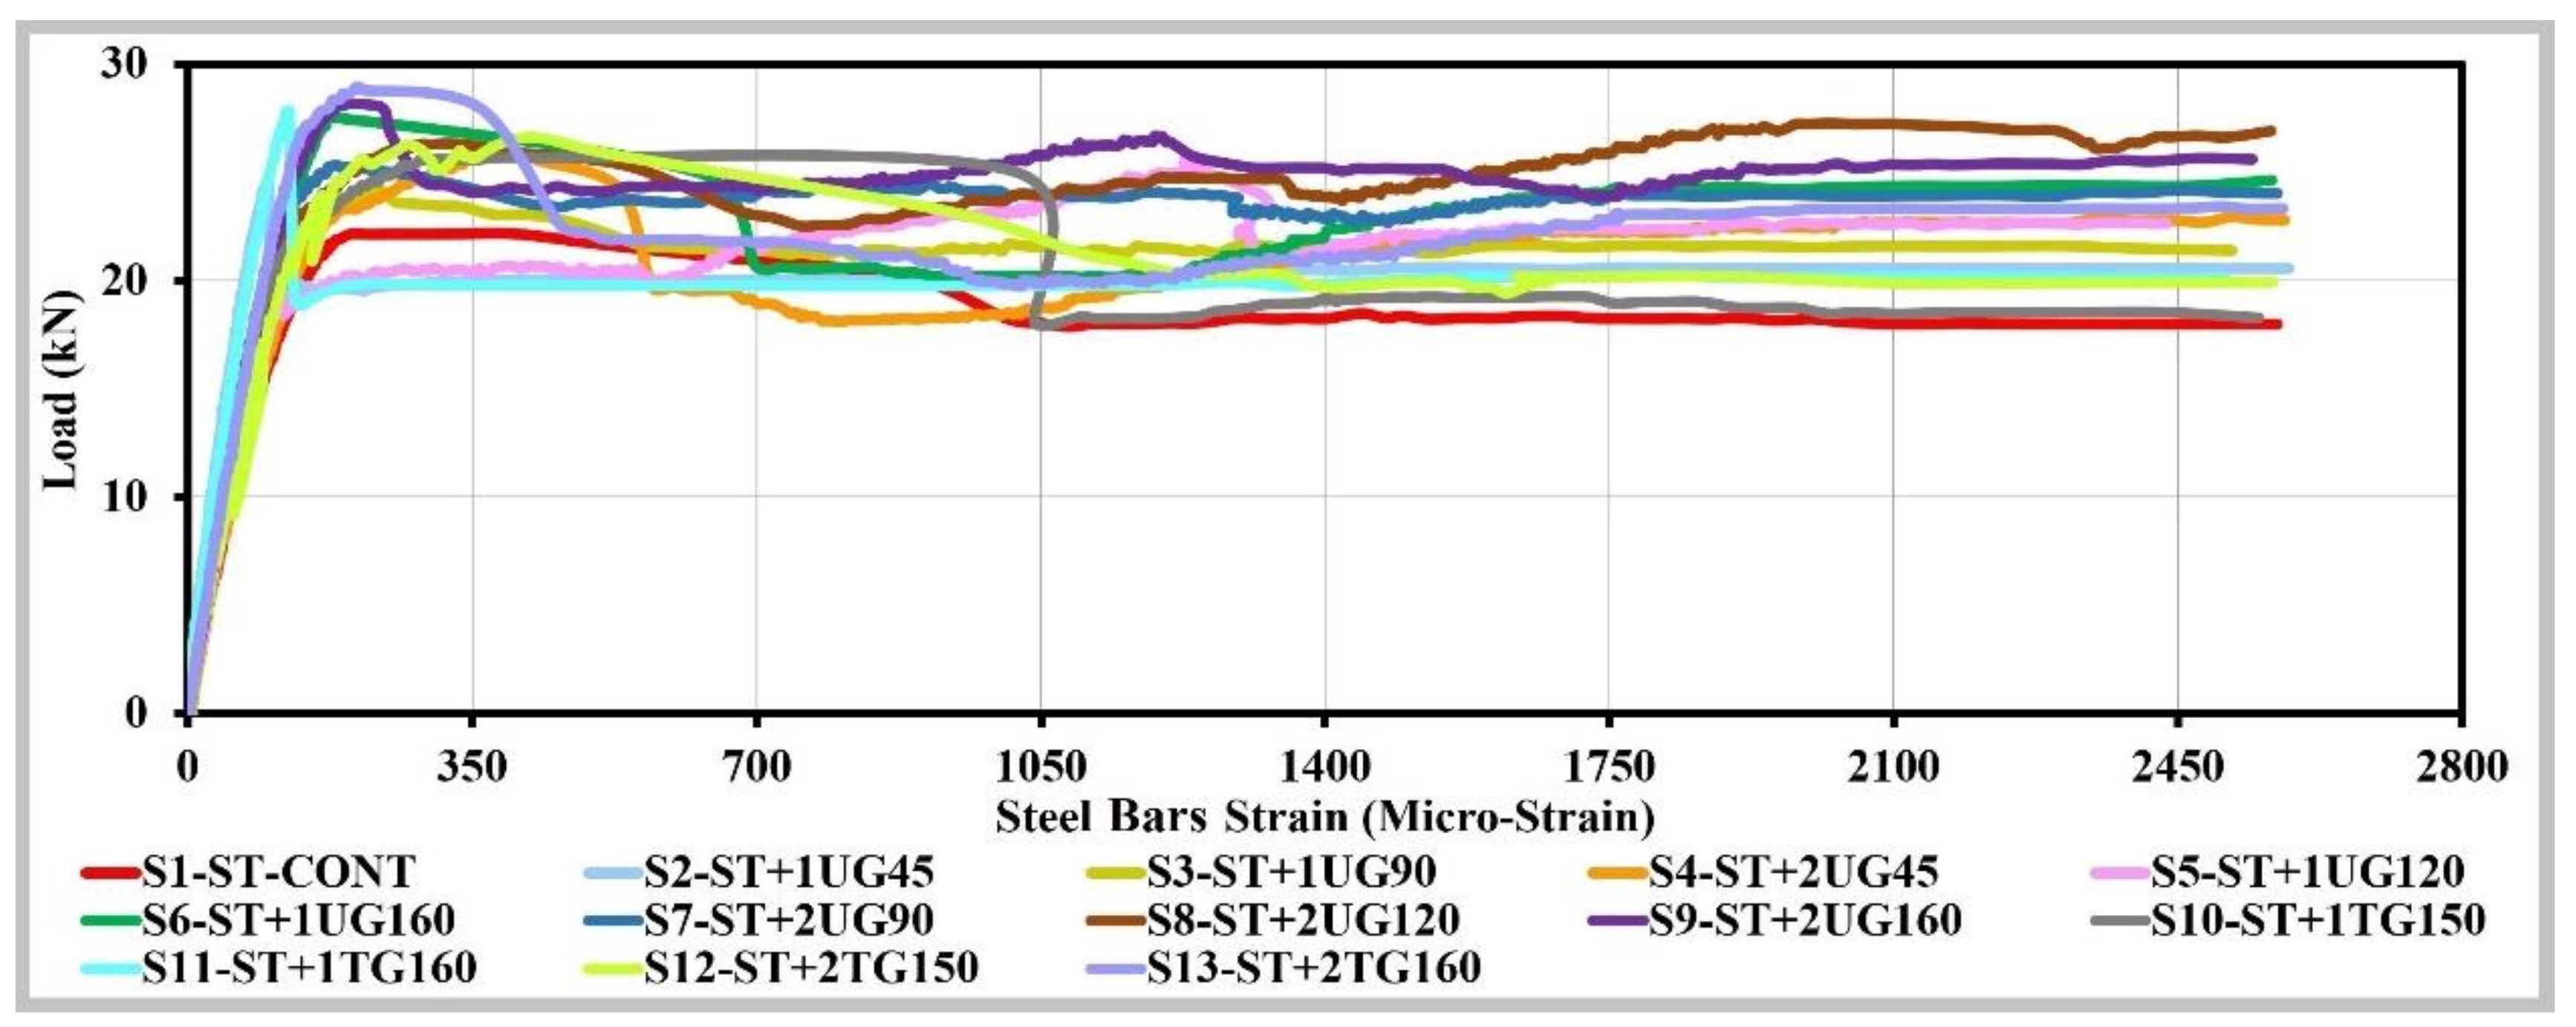
7.5. Bottom Reinforcement Strain-Load Behavior

The examination of the developed strain behavior in bottom reinforcement for the cases of using uniaxial geogrids or triaxial geogrids as additional bottom reinforcement to the bottom reinforcement steel bars will help in understanding the flexural behavior and the effectiveness of geogrids and steel bars hybrid reinforcement for concrete slabs. Figure 16 shows the load-strain curves of geogrids per each concrete slab. Figure 17 shows the load-strain curves of steel bars per each concrete slab compared to the concrete control slab. The bottom reinforcement general arrangement, the strain gauges’ locations, the uniaxial geogrids’ ribs portions, and transverse bars numbering system, and the triaxial geogrids’ hexagon pitches numbering system are shown in Figure 18.
After applying the flexural load and before the first crack, all bottom reinforcement partially contributed to carrying the tensile force, and the geogrids started to carry the tensile force concurrently with the steel bars. The strain values of steel bars and geogrids increased gradually until the load reaches the first-crack load (initial-peak load) with no correlation to the tensile strength of geogrids and the number of geogrids’ layers. After the first-crack (load-drop), a sudden increase of the strain values occurred for the steel bars, with no correlation to the tensile strength of geogrids and the number of geogrids’ layers; meanwhile, a sudden increase or decrease of the strain values occurred for the geogrids depending on the location of the first-crack related to the location of the uniaxial geogrids’ ribs portion number R3 or triaxial geogrids’ hexagon pitches H6 and H6-H7, where strain gauges were attached, with no correlation to the tensile strength of geogrids and the number of geogrids’ layers. Table 5 shows the locations of cracks per each hybrid reinforced concrete slab, according to the mentioned numbering system in Figure 18. Table 6 shows the bottom reinforcement strain values’ records at the first-crack (initial-peak load) and after the first-crack (load-drop).
After the load drop point, the strain value of geogrids at the steel-yield load (at a steel-yield strain of 1485 micro-strain) increased gradually to reach a strain value varying from 974 to 3471 micro-strain for group number one’ concrete slabs. A strain value varying from 194 to 4806 micro-strain for group number two’ concrete slabs, with no correlation to the tensile strength of geogrids and the number of geogrids’ layers. After the steel-yield load point of group number one’ concrete slabs, the strain values of uniaxial geogrids increased gradually to reach the proposed uniaxial geogrids-yield strain by the manufacturer at a load value varying from 88% to 90% of the post-peak load for concrete slabs number S2 to S4, and at a load value varying from 97% to 99% of the post-peak load for concrete slabs number S5 to S9, with no correlation to the tensile strength of uniaxial geogrids and the number of uniaxial geogrids’ layers. It should be mention that, for concrete slabs number S2 to S4, only one crack occurred; meanwhile, for concrete slabs number S5 to S9, two cracks occurred, leading to increasing the contributed uniaxial geogrids’ ribs portions to carry tensile forces, accordingly, the increasing of the number of flexural cracks leading to increase the uniaxial geogrids-yield load. After the steel-yield load point of group number two’ concrete slabs, the strain values of triaxial geogrids increased gradually to reach a strain value equal to 58783, 40968, 26721, and 237 micro-strain at load value equal to 90%, 84%, 100%, and 100% of the post-peak load for S10, S11, S12, and S13, respectively, with no correlation to the tensile strength of triaxial geogrids and the number of triaxial geogrids’ layers. It should be mentioned that, for concrete slab number S13, the value of triaxial geogrids was very low because (as highlighted above) the ability of triaxial geogrids’ ribs to carry tensile forces is restricted to hexagon pitches where the flexural cracks developed. The recorded range of geogrids strain value corresponding to the bottom reinforcement steel-yield strain had no impact on the concrete slabs’ overall performance, indicating that the tensile force was not distributed uniformly to the geogrids’ ribs. Which, in turn, indicates the existence of numerous possible strain values in the remaining geogrids’ ribs of the same concrete slab. This also indicated that, if the test was repeated for the same concrete slab reinforcement details and with the same conditions, there would be many numbers of strain values possibilities varying from 974 to 3471 micro-strain for uniaxial geogrids and a strain values possibilities varying from 815 to 4806 micro-strain for triaxial geogrids corresponding to the steel-yield strain, due to the random distribution of tensile force to the geogrids’ ribs. It should be mentioned that the strain record of S13 was excluded from the possibilities range of triaxial geogrids because, as highlighted above, the flexural cracks were not in hexagon pitches where the strain gauge was attached. Accordingly, a probability distribution analysis was done for the corresponding uniaxial geogrids, and triaxial geogrids strain values to bottom reinforcement steel-yield load, to provide a more accurate value of it, as shown in Figure 19. The probability distribution analysis results indicated that for the uniaxial geogrids, the weighted average value was equal to 1576.05 micro-strain (0.16%), the mean value was equal to 1789.38 micro-strain (0.18%), and the median value was equal to 1666.15 micro-strain (0.17%); meanwhile, for the triaxial geogrids, the weighted average value was equal to 2203.21 micro-strain (0.22%), the mean value was equal to 2204.38 micro-strain (0.22%), and the median value was equal to 2132.39 micro-strain (0.21%). The experimental yield strain of reinforcement steel bars was 1485 micro-strain (0.15%), as shown in Table 2, which nearly equal to the uniaxial geogrids and the triaxial geogrids strain probability distribution analysis results. The uniaxial geogrids’ theoretical yield strain value is 130000 micro-strain (13%—by manufacturer), and the triaxial geogrids’ numerical yield strain value is 64000 micro-strain (6.4%—[27]), which are very far from the concrete slabs elastic range, and acceptable plastic range, so the definition of geogrids’ proof-strain was decided to be used when the geogrids will be used as concrete slab reinforcement, to be sure that the geogrids reinforced concrete slabs will not exceed the elastic range or an acceptable plastic range. Accordingly, the geogrids’ proof-strain value was determined to be equal to the reinforcement steel-yield strain value (which varies from 1250 (0.13%) to 2500 (0.25%) micro-stain based on the steel grade), when it is used as an additional reinforcement to the reinforcement steel bars, which will keep the geogrids reinforced concrete slab in the elastic range or an acceptable plastic range.

7.6. Value Engineering

Value engineering aims to achieve optimum value and lowest life cycle costs by optimizing design concepts and by providing optimum utilization of construction materials [31]. The value of using geogrids material as additional reinforcement (to steel bars) in concrete slabs was examined by dividing the gained benefits (post-peak load, displacement ductility index, or energy absorption capacity) by the total cost of the concrete slab (hybrid reinforcement, concrete, and formwork excluding shoring system) in Egyptian pound (L.E), as shown in Figure 20. It is clear that the group number one had more efficient utilization than group number two, as it had higher benefits to cost ratios, especially for uniaxial geogrids with the experimental tensile strength of 103.91 kN/m and 143.46 kN/m, as it had the highest benefits value, while they provided the highest benefit to cost ratios. On the other hand, as illustrated above, the ability of geogrids to carry tensile forces is restricted to the areas where the flexural cracks developed; accordingly, its benefits could be enhanced if the number of flexural cracks increased, spread, and distributed widely throughout the concrete slab tension zone length. This condition could be achieved by using a moderate (not the minimum) reinforcement ratio of the steel bars and could increase its benefits values. Also, as the ability of geogrids to carry tensile forces is restricted to the areas where the flexural cracks developed, the cost of geogrids reinforcement could be reduced by applying it only for the tension zone with suitable development lengths.

8. Conclusions and Recommendations

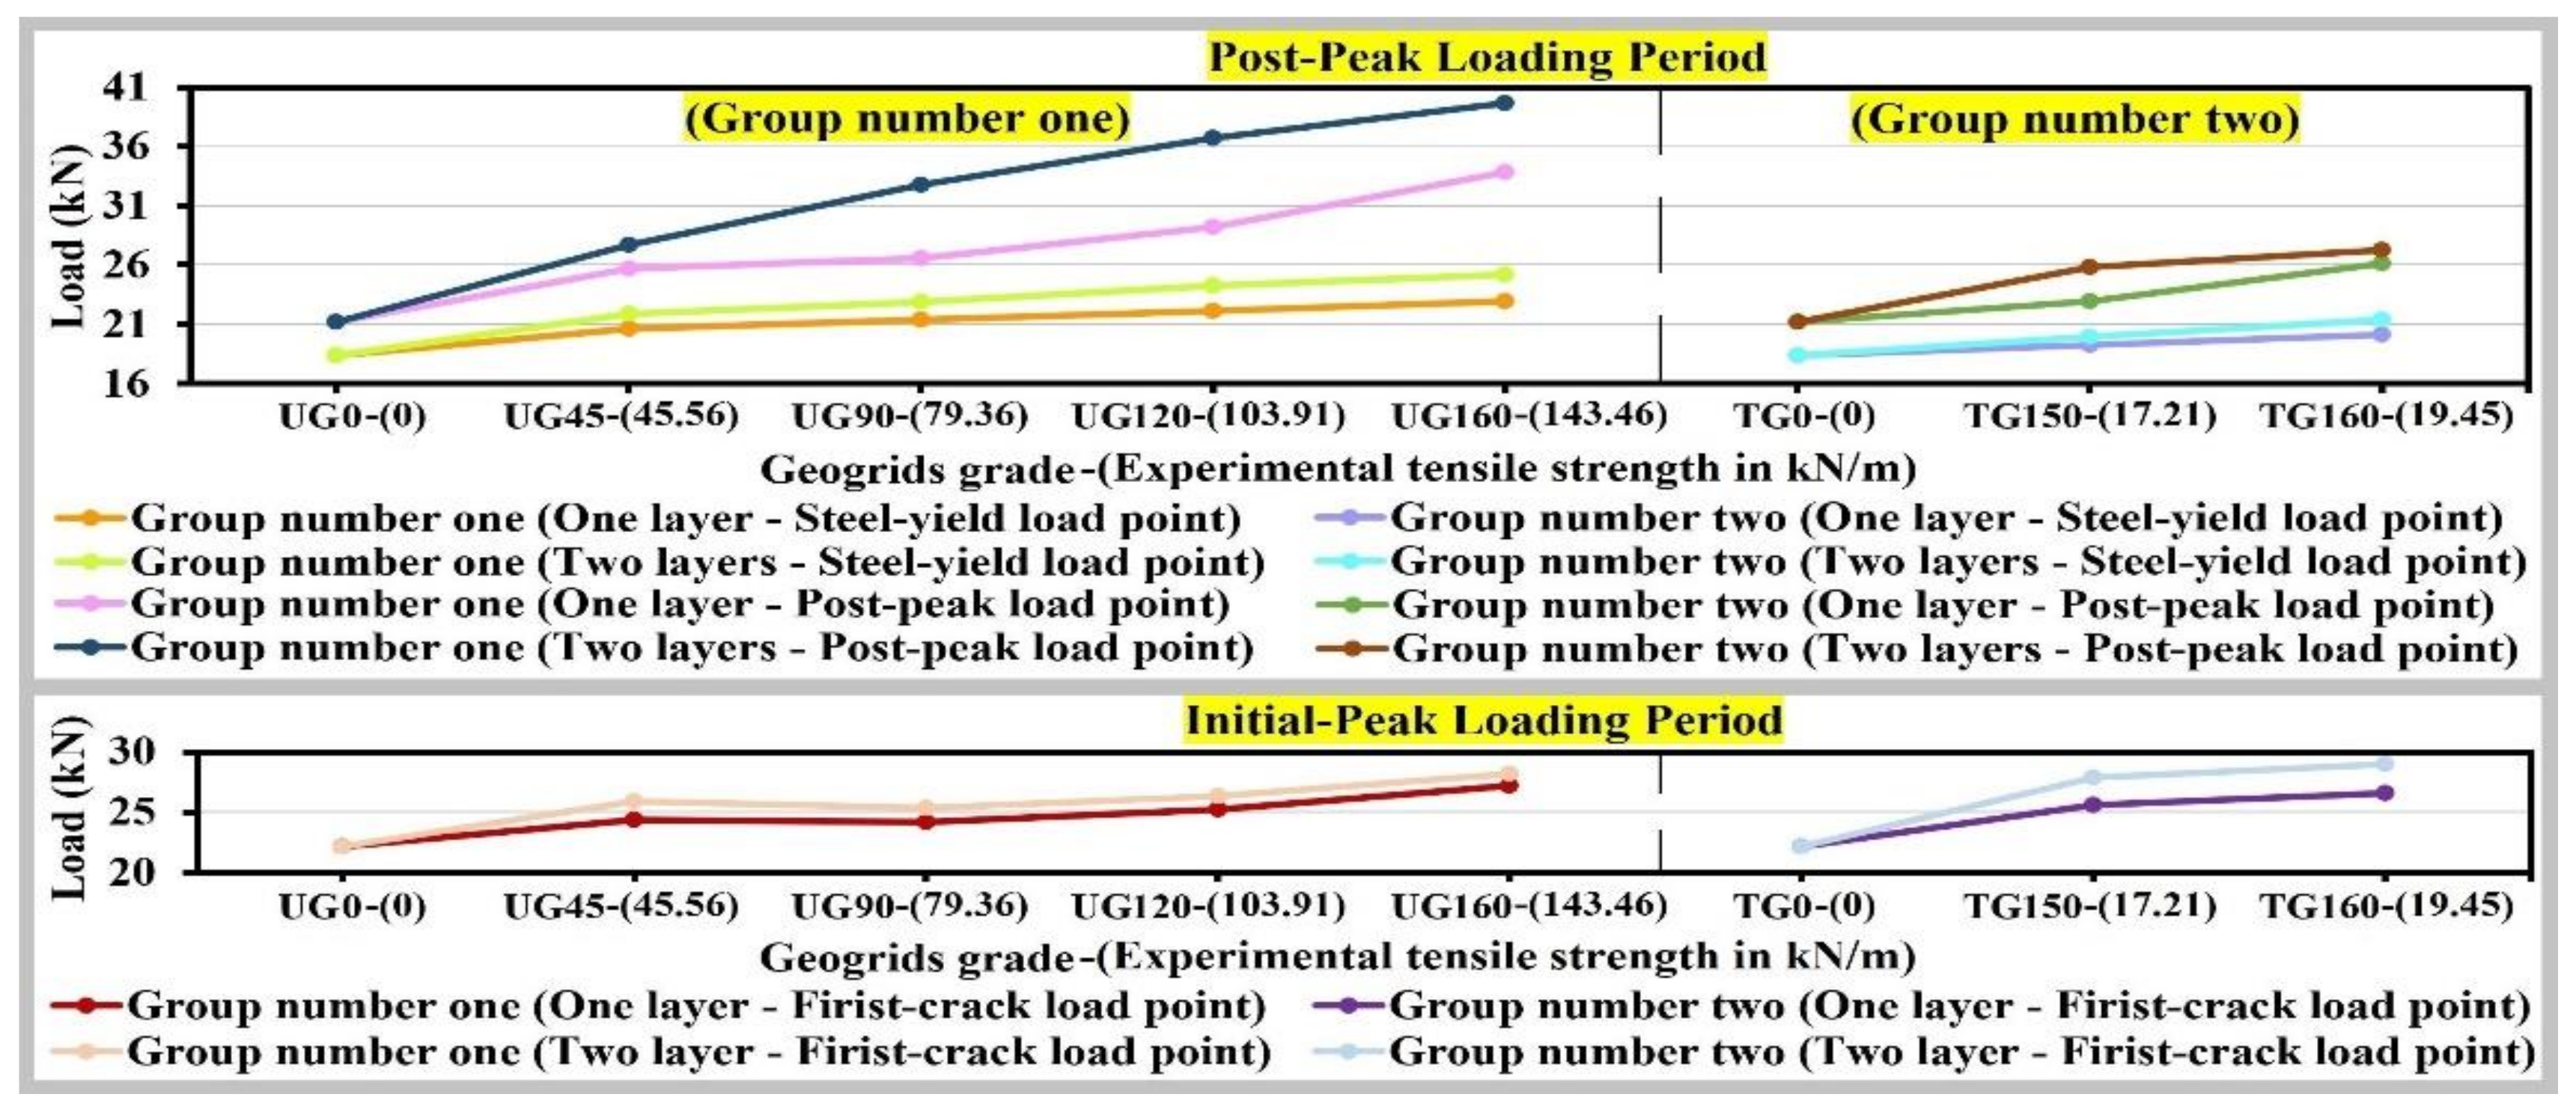
  • The reinforcement steel bars had the minimum reinforcement ratio, due to the fact that the minimally reinforced concrete sections are brittle structures, to provide one flexural crack in the control concrete slab, and to depend more on the geogrids and deeply study its behavior as additional reinforcement to the steel bars. Accordingly, the loading period of the concrete slabs under this research included the following load points: First-crack load associated with initial-peak load, a sudden load drop in conjunction with a sudden deflection increase, steel-yield load, post-peak load, and failure load in sequential order. Such a loading period demonstrated post cracking ductility. The concrete Slabs loading behavior when using uniaxial geogrids as additional bottom reinforcement to the reinforcement steel bars is most preferred as it provides lower load drops and higher load values, with nearly equal deflections values at the steel yield load when compared with the triaxial geogrids; however, it provided higher deflection values at the post-peak load.
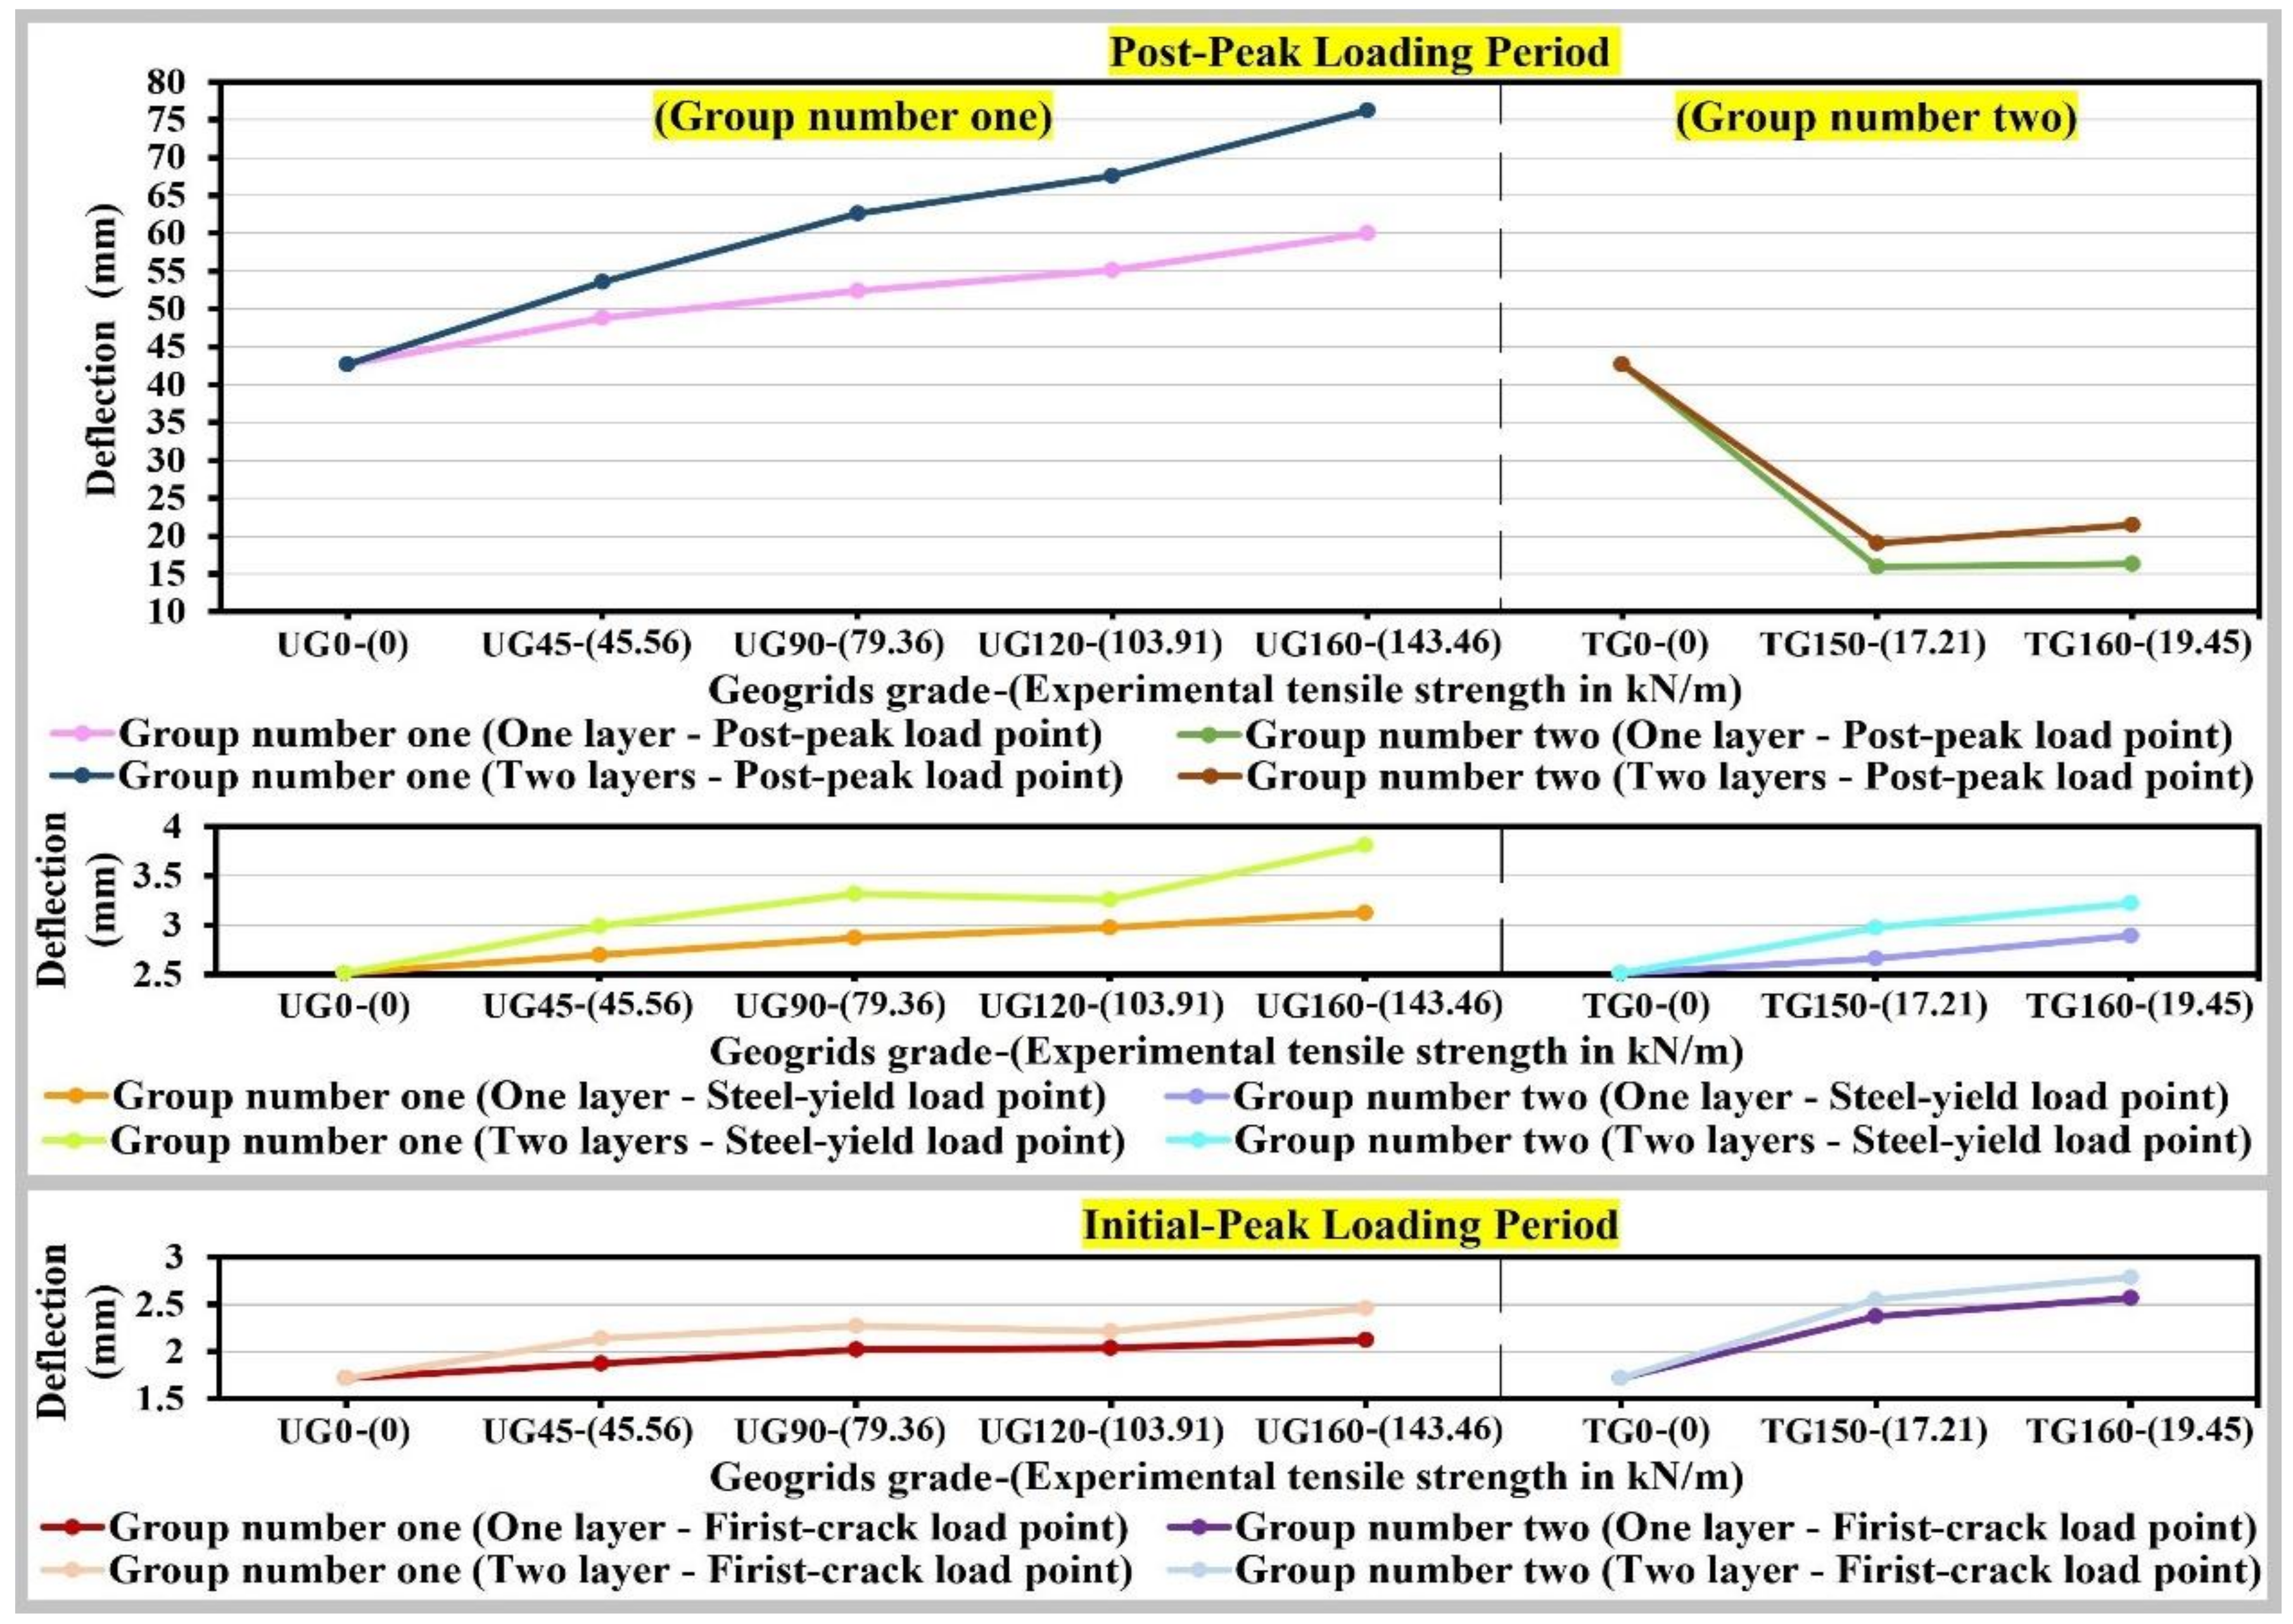
  • The number of flexural cracks, deflection, load, flexural strength, displacement ductility index, and energy dissipation has a positive correlation with the tensile strength of geogrids and the number of geogrids’ layers. The case of using uniaxial geogrids as additional bottom reinforcement to the reinforcement steel bars is most preferred as it provides higher values of these parameters when compared with the triaxial geogrids; however, it provided higher deflection values at the post-peak load.
  • The initial-peak load has a weak positive correlation with the tensile strength of geogrids and the number of geogrids’ layers; meanwhile, the post-peak load has a normal positive correlation with the tensile strength of geogrids and the number of geogrids’ layers. The reason is that, when the first-crack occurs, the geogrids’ ribs control the crack propagation, and the crack opening leads to geogrids’ ribs elongation, resulting in geogrids’ ribs being tension-stressed, and accordingly, geogrids provide better performance when tension-stressed. Therefore, geogrids are recommended to be tension stressed before the concrete casting as this condition can expedite and enhance its participation in carrying the tensile force. This condition can be achieved by the uniaxial geogrids; meanwhile, it is difficult to achieve by the triaxial geogrids.
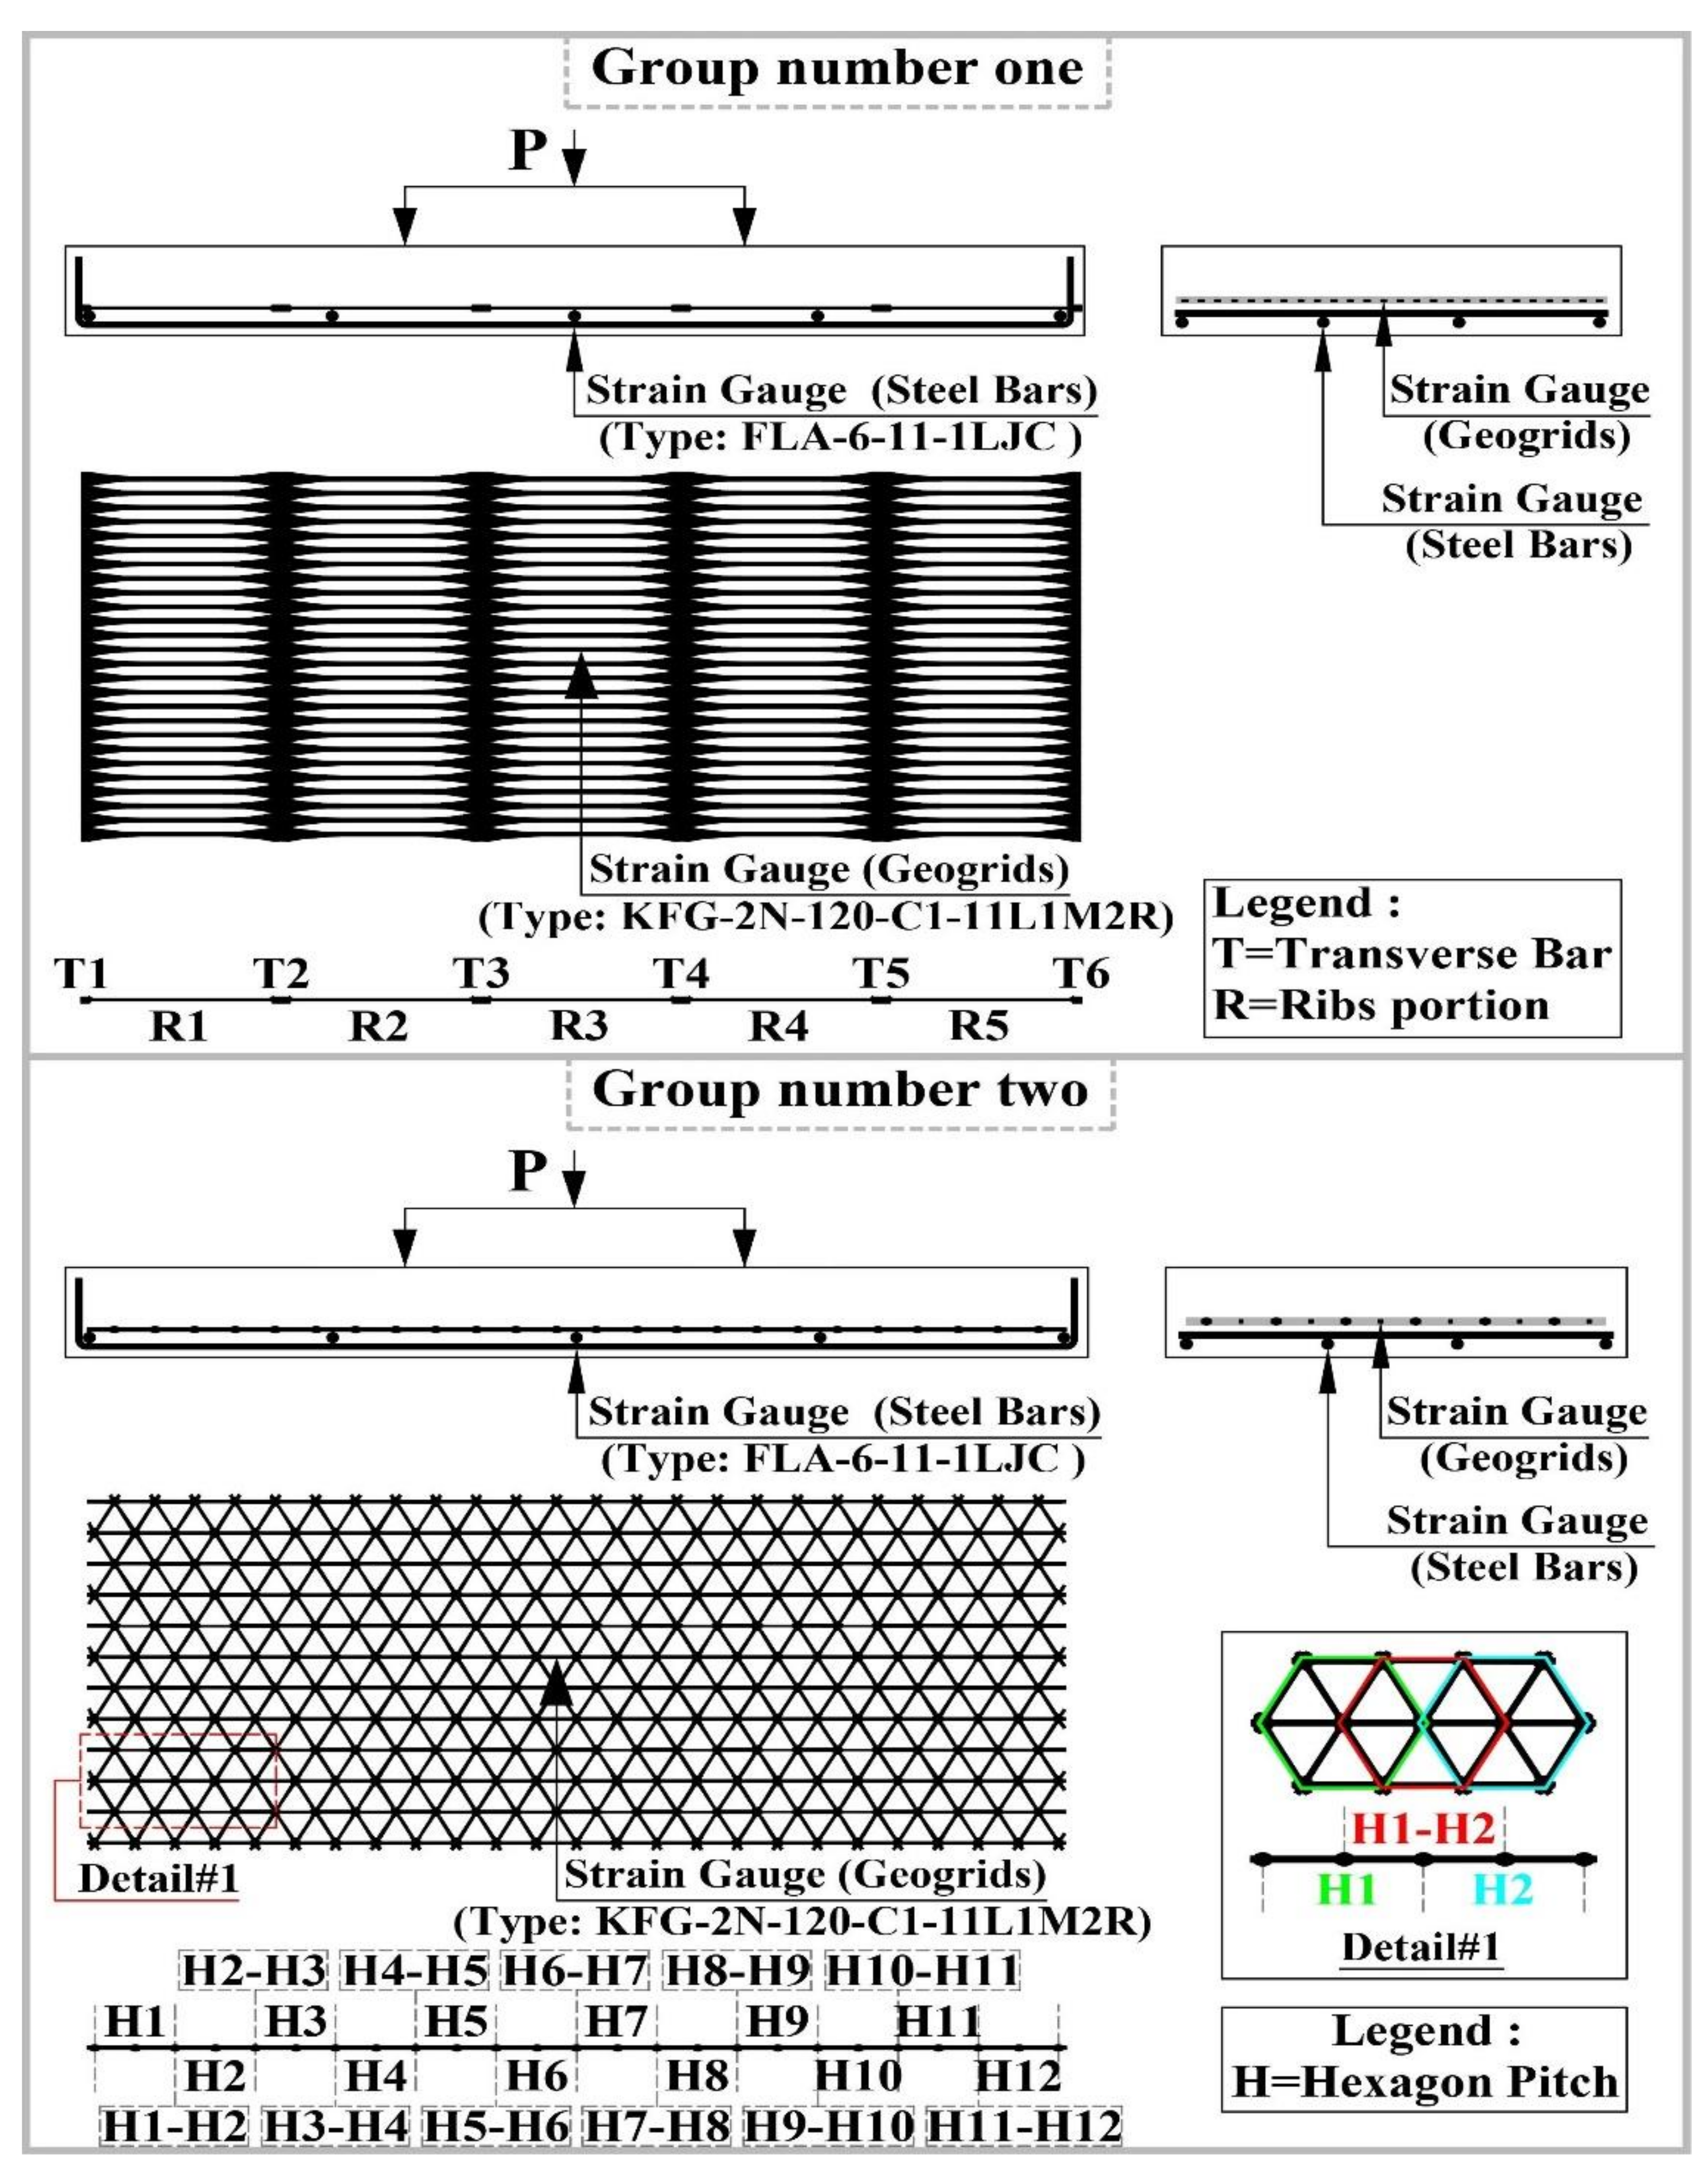
  • As the friction between the geogrids and concrete interface is weak, the mechanism of geogrids to carry tensile force is; the uniaxial geogrids’ transverse bars or the triaxial geogrids’ integral nodes are entirely confined by the concrete, keeping its location, and preventing tensile force transmission to the following uniaxial geogrids’ ribs portions or triaxial geogrids’ hexagon pitches. This gives the geogrids’ ribs the ability to control the crack propagation, and the crack opening leads to geogrids’ ribs elongation and carrying the tensile force. As the triaxial geogrids’ integral nodes are uniformly staggered distributed to the whole area, the triaxial geogrids could be cut at any location. Meanwhile, as the uniaxial geogrids’ transverse bars are parallelly distributed with an equal offset, the uniaxial geogrids should be cut at transverse bars location to provide a transverse bar at its beginning and its end.
  • The ability of geogrids to carry tensile force as concrete slab reinforcement is limited by the ribs portions or the hexagon pitches where concrete cracks hit the ribs. Accordingly, the geogrids’ performance and benefits as concrete slab reinforcement will be enhanced as the number of concrete flexural cracks increased, spread, and distributed widely throughout the concrete slab tension zone length. This condition can be achieved by using geogrids of the higher experimental tensile strength (like; 103.91 kN/m for UG, 19.45 kN/m for TG, and higher tensile strengths), and as an expectation, it may be achieved by using the geogrids as additional bottom reinforcement to a moderate reinforcement ratio (not a minimum reinforcement ratio) of steel bars.
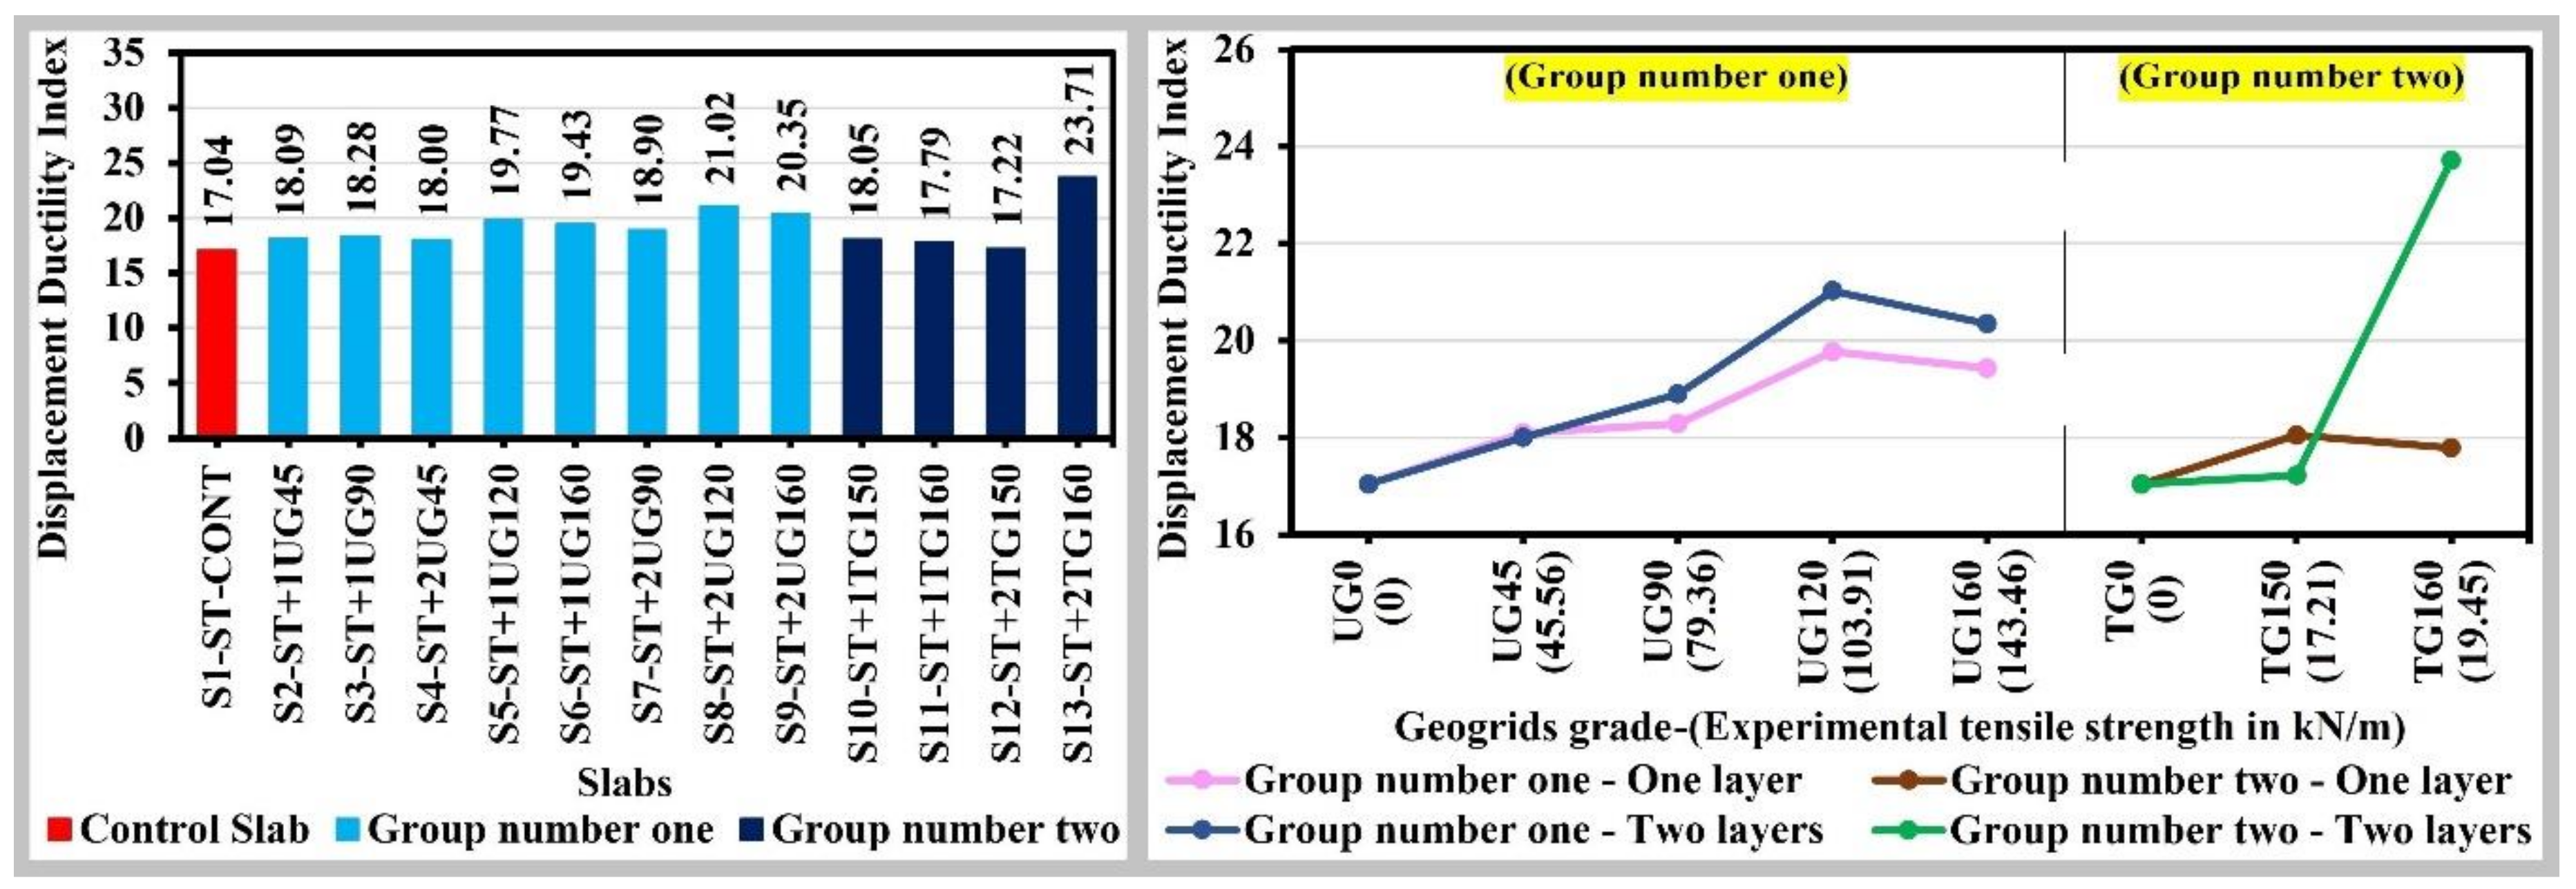
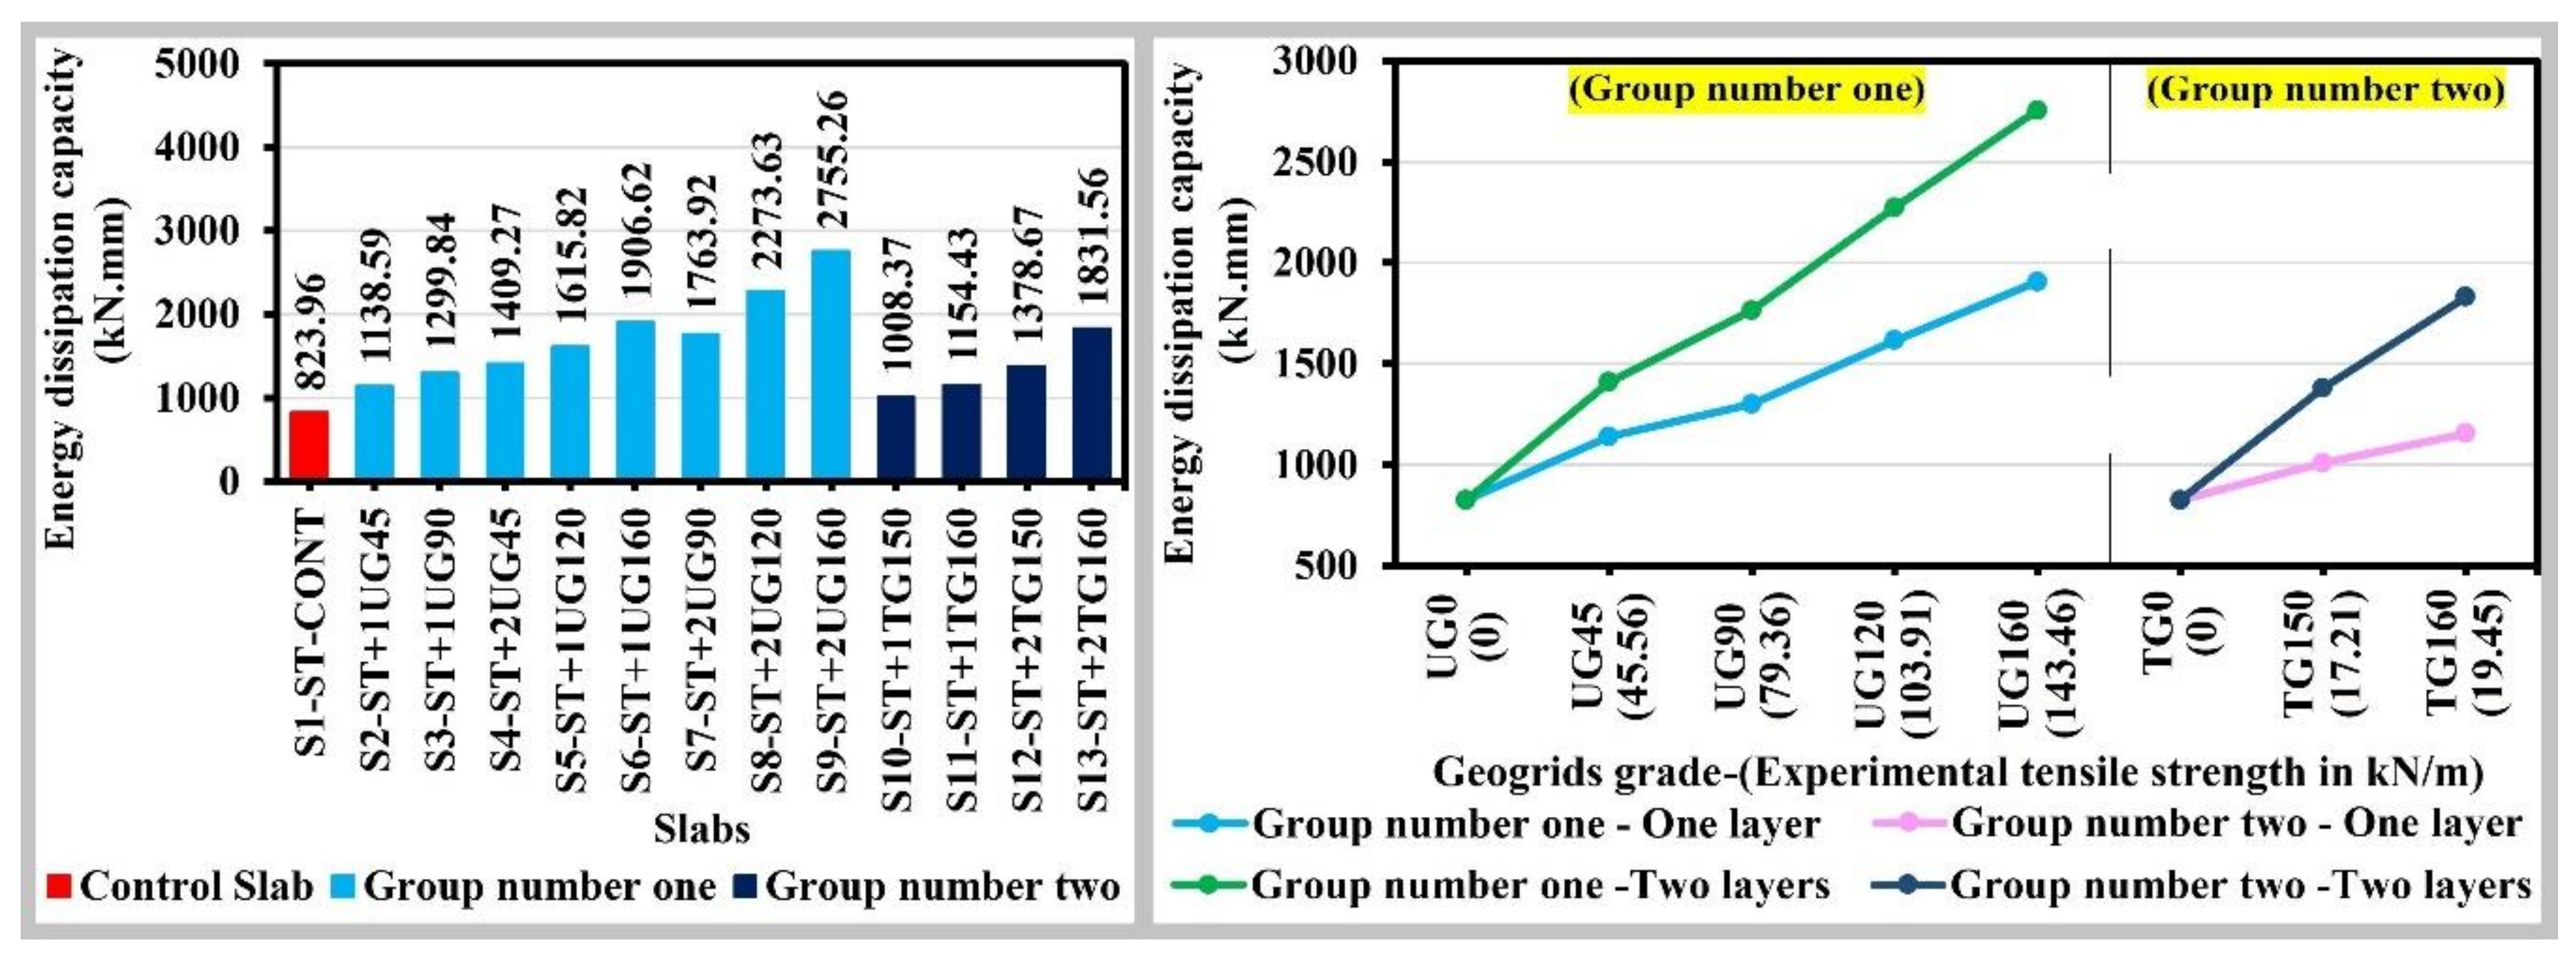
  • As each uniaxial geogrids’ ribs portions cover a larger area than triaxial geogrids’ hexagon pitches and as the number of uniaxial geogrids’ ribs portions contributing to carrying the tensile force is gradually increasing with increasing of the tensile strength of uniaxial geogrids and the number of uniaxial geogrids’ layers; meanwhile, the number of triaxial geogrids’ hexagon pitches contributing to carrying the tensile force kept constant while it duplicated in the case of using double layers of triaxial geogrids with the experimental tensile strength of 19.45 kN/m (based on the number and locations of the flexural cracks), the displacement ductility index value and the energy absorption capacity value were gradually increased for the cases of using uniaxial geogrids as additional reinforcement to steel bars; meanwhile, it had a large increment in the case of using double layers of triaxial geogrids with the experimental tensile strength of 19.45 kN/m. On the other hand, the cases of three uniaxial geogrids’ ribs portions contributing to carrying tensile forces (cases of two occurred flexural cracks), provide higher loads at uniaxial geogrids’ yield-strain when compared with other cases of uniaxial geogrids. Accordingly, it is recommended to use a moderate (not the minimum) reinforcement ratio of the steel bars.
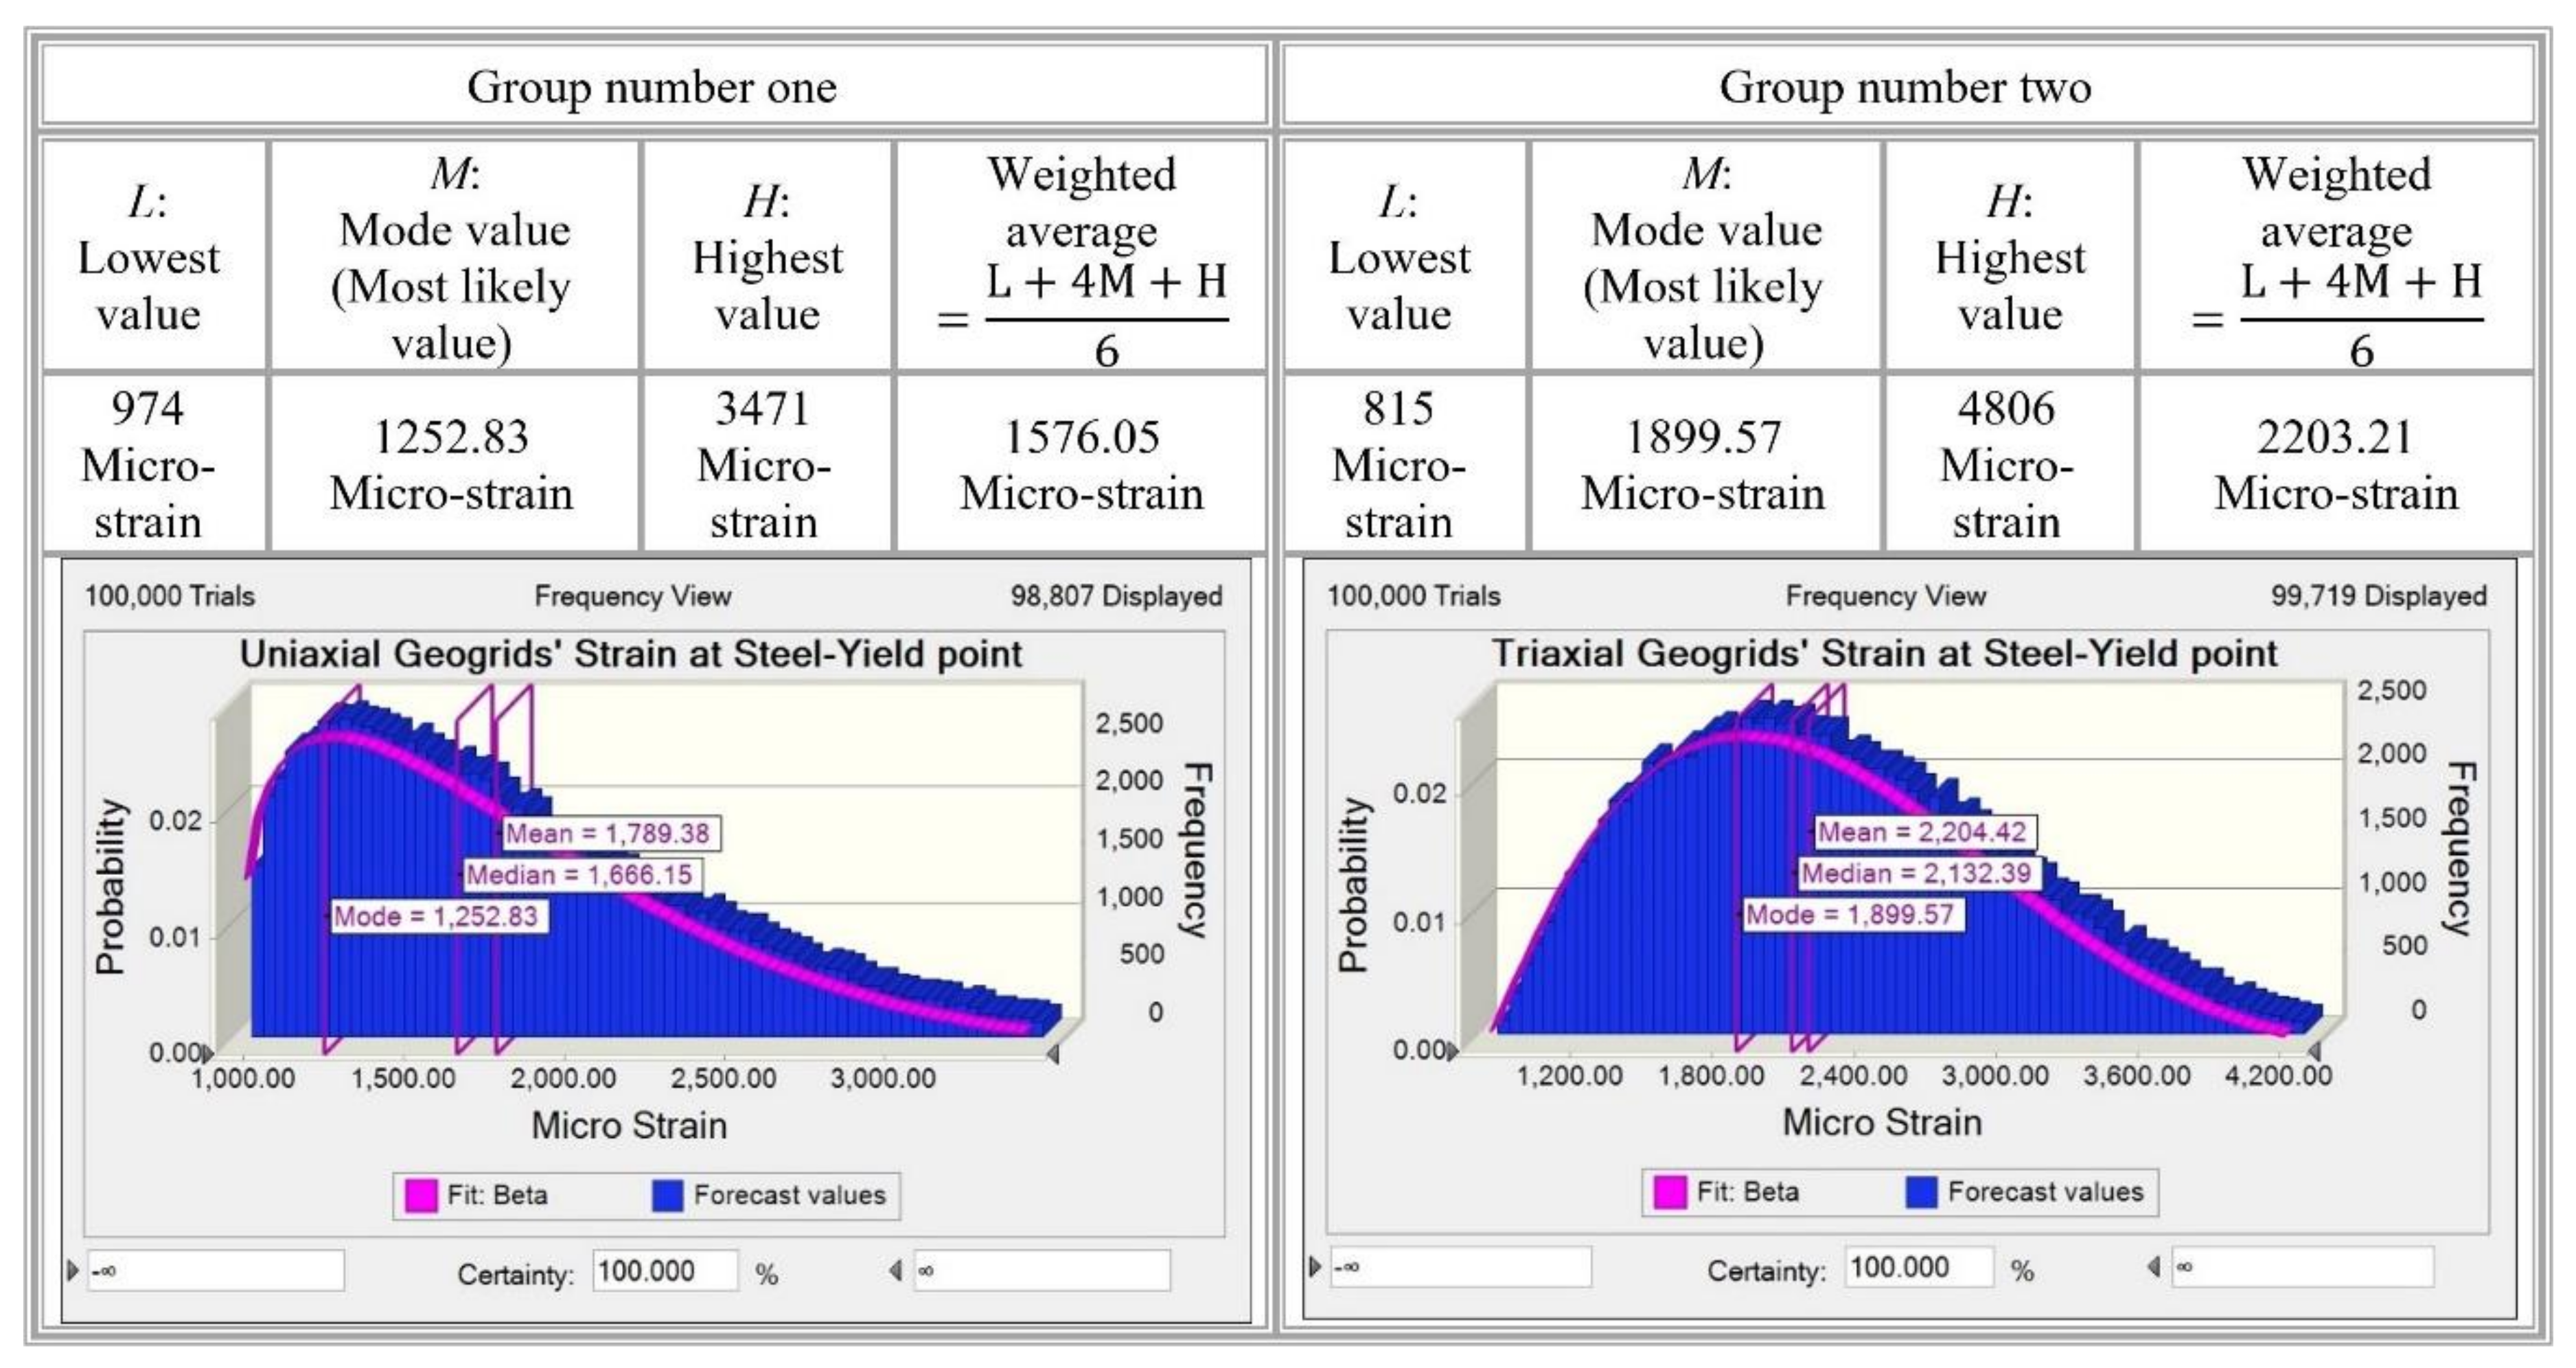
  • The uniaxial geogrids material yield-strain is 13% (as proposed by the manufacturer), and the triaxial geogrids material yield-strain is 6.4% (Numerical yield Strain)—which is very far from the concrete slabs elastic range and acceptable plastic range. Accordingly, the term “geogrids’ proof-strain” was defined to guarantee that the geogrids reinforced concrete slabs will not exceed the acceptable concrete slabs behavior ranges (the elastic range or an acceptable plastic range). The geogrids’ proof-strain was chosen to be equal to the reinforcement steel-yield strain value (which varies from 1250 (0.13%) to 2500 (0.25%) micro-stain based on the steel grade) when it is used as additional reinforcement to the steel bars.
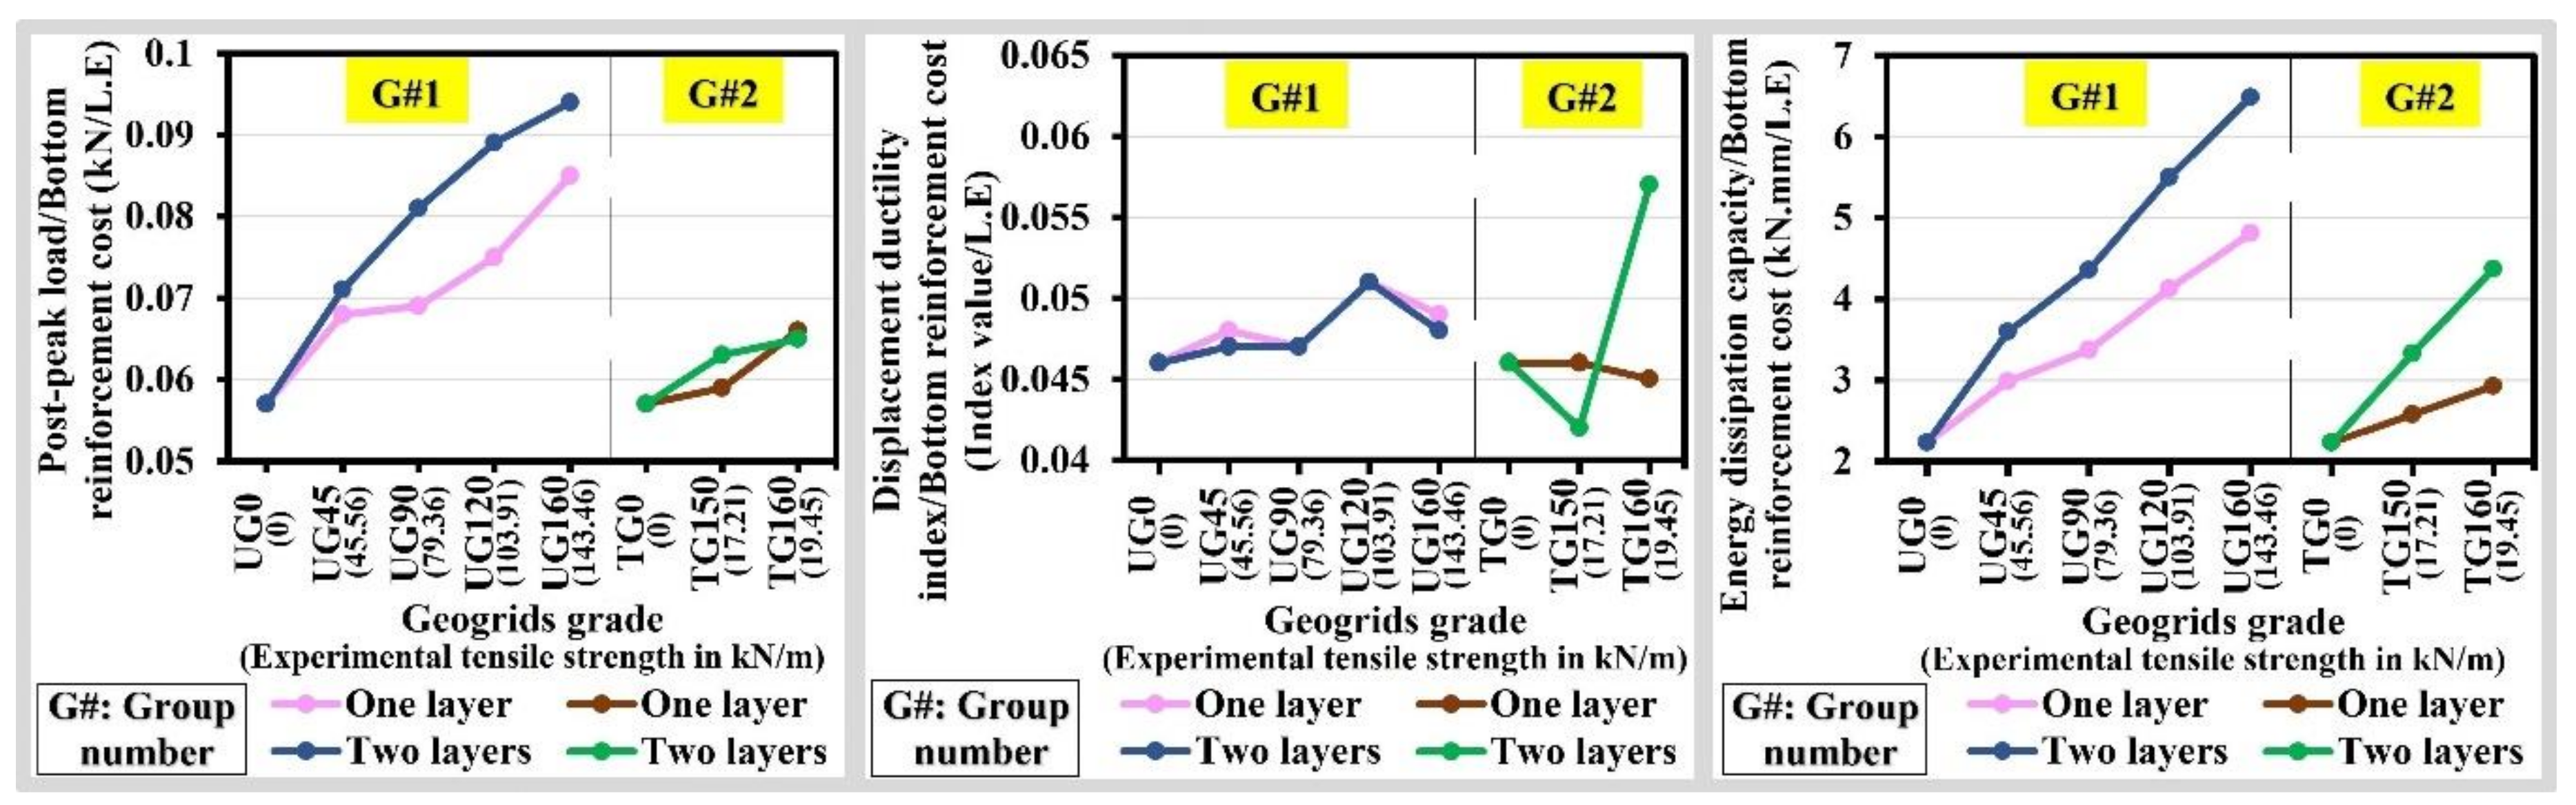
  • The using of uniaxial geogrids as additional reinforcement to the steel bars provide more efficient utilization than the using of triaxial geogrids as additional reinforcement to the steel bars as it has higher benefits to cost ratios, especially for uniaxial geogrids with the experimental tensile strength of 103.91 kN/m and 143.46 kN/m, as it has the highest benefits values (steel yield load, post-peak load, displacement ductility index, and energy absorption capacity), while they provided benefit to cost values higher than the lower uniaxial geogrids’ tensile strength. Meanwhile, the triaxial geogrids provided lower deflection values, especially for the deflection at the post-peak load.
  • Based on the applied configuration of the geogrids and steel bars hybrid reinforcement system for concrete slabs under this study (the geogrids was applied for the whole slab area and with minimum reinforcement ratio of the steel bars), the hybrid reinforcement system provides a higher benefit to cost ratios when it compared with the case of using conventional reinforcement of steel bars (concrete control slab). In some cases, it nearly provided double benefits values when compared with the concrete control slab. Meanwhile, In order to increase the benefit to cost ratios of the hybrid reinforcement system, the geogrids are recommended to be applied only for the tension zone with suitable development lengths (decreasing its cost) and with the use of moderate (not the minimum) reinforcement ratio of the steel bars (increasing its benefits values, as an expectation).
Based on the above-mentioned conclusions and recommendations, the hybrid reinforcement system of geogrids and steel bars, could be used as concrete slabs reinforcement and provide better performance and efficient utilization in the case of using uniaxial geogrids as additional reinforcement to the steel bars, especially for uniaxial geogrids with the experimental tensile strength of 103.91 kN/m and higher tensile strengths, as it provides higher benefits values (including, but not limited to, initial-peak load, steel-yield load, post-peak load, displacement ductility index, and energy absorption capacity) and more efficient utilization (including, but not limited to, higher benefits to cost values and better flexural performance) than the case of using conventional reinforcement of steel bars and the cases of using triaxial geogrids as additional reinforcement to the steel bars; however, triaxial geogrids provide lower deflection values and higher first-crack load values. The uniaxial geogrids are highly recommended to be tension-stressed before the concrete casting. It should be mentioned that this hybrid reinforcement system could decrease the influence of corrosion, due to environmental actions, as part of the system is not subjected to corrosion (geogrids). Accordingly, this will contribute to reducing its degree of damage, its effect on the structural behavior, and the associated cost and time with repair. Moreover, it provides higher benefits to cost ratios compared to the conventional reinforcement of steel bars.

9. Future Studies

  • Study the efficiency of pre-tensioning the uniaxial geogrids before the concrete casting to provide uniaxial geogrids pre-stressed concrete slabs. Based on the above-mentioned conclusions and recommendations, uniaxial geogrids are expected to provide better performance as concrete slabs reinforcement if it were tension-stressed before the concrete casting; on the other hand, the uniaxial geogrids material yield-strain is 13%, which is considerably higher than the concrete slabs elastic range and an acceptable plastic range; meanwhile, the geogrids proof-strain is varying from 0.13% to 0.25%; accordingly, uniaxial geogrids could be tensioned before the concrete casting up to a strain of 8% (for example), providing uniaxial geogrids pre-stressed concrete slabs and adding a new utilization concept of uniaxial geogrids in structural engineering. This concept is expected to reduce the plastic deformation, enhance the mechanical properties, and increase the benefits to cost ratios.
  • Study the efficient steel bars reinforcement ratio for the hybrid reinforcement of geogrids and steel bars.
  • Study the efficiency of geogrids and steel bars hybrid reinforcement system in the two-ways concrete slabs.
  • Study the ways to enhance the bonding at the geogrids-concrete interface.
  • Study the effect of dynamic loads on geogrids reinforced concrete.
  • Study the effect of cyclic loading on geogrids reinforced concrete.
  • Study the effect of span to depth ratio on the geogrids reinforced concrete slabs.
  • Study the shear behavior on the geogrids reinforced concrete slabs.
  • Study the effect of high-temperature changes on the geogrids reinforced concrete.

Author Contributions

All authors contributed to this study and discussed the results and reviews during all stages of the manuscript. All authors have read and agreed to the published version of the manuscript.

Funding

This research received no external funding.

Conflicts of Interest

The authors declare no conflict of interest.

References

  1. Saranyadevi, M.; Suresh, M.; Sivaraja, M. Strengthening of Concrete Beam by Reinforcing with Geosynthetic Materials. Int. J. Adv. Res. Educ. Technol. 2016, 3, 245–251. [Google Scholar]
  2. Maxwell, S.; Kim, W.-H.; Tuncer, B.E.; Benson, C.H. Effectiveness of Geo-Synthetics in Stabilizing Soft Subgrades; University of Wisconsin-Madison: Madison, WI, USA, 2005. [Google Scholar]
  3. Webster, S.L. Geogrid Reinforced Base Course for Flexible Pavements for Light Aircraft: Test Section Construction, Behaviour under Traffic, Laboratory Tests, and Design Criteria; National Technical Information Service: Springfield, VA, USA, 1992. [Google Scholar]
  4. Sharbaf, M. Laboratory Evaluation of Geogrid-Reinforced Flexible Pavements. Master’s Thesis, University of Nevada, Las Vegas, NV, USA, May 2016. [Google Scholar]
  5. Al-Hedad, S.A.; Bambridge, E.; Muhammad, N.S. Influence of Geogrid on The Drying Shrinkage Performance of Concrete Pavements. Construct. Build. Mater. 2017, 146, 165–174. [Google Scholar] [CrossRef] [Green Version]
  6. Al Basiouni Al Masri, Z.; Daou, A.; Haj Chhade, R.; Chehab, G. Experimental and Numerical Assessment of the Behavior of Geogrid-Reinforced Concrete and Its Application in Concrete Overlays. J. Mater. Civ. Eng. 2018, 30, 04018332. [Google Scholar] [CrossRef]
  7. Itani, H.; Saad, G.A.; Chehab, G.R. The use of geogrid reinforcement for enhancing the performance of concrete overlays: An experimental and numerical assessment. Constr. Build. Mater. 2016, 124, 826–837. [Google Scholar] [CrossRef]
  8. Khodaii, A.; Fallah, S. Effects of Geo-Synthetic Reinforcement on The Propagation of Reflection Cracking in Asphalt Overlays. Int. J. Civ. Eng. 2009, 7, 131–140. [Google Scholar]
  9. Walubita, L.F.; Nyamuhokya, T.P.; Komba, J.; Tanvir, H.A.; Souliman, M.; Naik, B. Comparative assessment of the interlayer shear-bond strength of geogrid reinforcements in hot-mix asphalt. Constr. Build. Mater. 2018, 191, 726–735. [Google Scholar] [CrossRef]
  10. Tang, X.; Chehab, G.R.; Kim, S. Laboratory study of geogrid reinforcement in Portland cement concrete. In Proceedings of the 6th RILEM International Conference on Cracking in Pavements, Chicago, IL, USA, 16–18 June 2018; pp. 769–778. [Google Scholar]
  11. Ahmed Shaban, A.H.G. Strengthening of Reinforced Concrete Slabs Using Different types of Geo-Grids. Int. J. Civ. Eng. Technol. 2019, 10, 1851–1861. [Google Scholar]
  12. Al Qadi, A.N.; Al-Kadi, Q.N.S.; Al-Zaidyeen, S.M. Impact Strength of Oil-Palm Shell on Lightweight Concrete Slabs Reinforced with a Geo-Grid. J. Mater. Civ. Eng. 2015, 27, 04014264. [Google Scholar] [CrossRef]
  13. Tang, X.; Mohamad, N.; Higgins, J.; Higgins, I. Concrete Slab-on-Grade Reinforced by Geogrids. In Proceedings of the Eight International Conference on Case Histories in Geotechnical Engineering, Philadelphia, PA, USA, 24–27 March 2019. [Google Scholar] [CrossRef]
  14. El Meski, F.; Chehab, G.R. Flexural Behavior of Concrete Beams Reinforced with Different Types of Geogrids. J. Mater. Civ. Eng. 2014, 26, 04014038. [Google Scholar] [CrossRef]
  15. Shobana, S.; Yalamesh, G. Experimental study of concrete beams reinforced with uniaxial and biaxial geogrids. Int. J. ChemTech Res. 2015, 8, 1290–1295. [Google Scholar]
  16. Murekar, A.; Devikar, D.; Singandhupe, J.; Faizan Farooqui, M.; Ghodmare, S. Comparative Study and Analysis of PCC Beam and Reinforced Concrete Beam using Geogrid. Int. J. Sci. Technol. Eng. 2017, 3, 247–253. [Google Scholar]
  17. Ahmed Alamli, A.S.; Yousif, M.A.; Mohammed, M.H. Reinforced Concrete Strengthening by Using Geotextile Reinforcement for Foundations and Slabs. Int. J. Civ. Struct. Environ. Infrastruct. Eng. Res. Dev. 2017, 7, 35–46. [Google Scholar] [CrossRef]
  18. Ali, Y.S.; Awad Waryosh, W.; Yousif, M.A. Increasing Ultimate Strength of Reinforced Concrete Slab by Using Geogrid. Glob. J. Eng. Sci. Res. Manag. 2018, 5, 83–94. [Google Scholar]
  19. Tharani, K.; Mahendran, N.; Vijay, T.J. Experimental Investigation of Geogrid Reinforced Concrete Slab. Int. J. Eng. Adv. Technol. 2019, 8, 158–163. [Google Scholar]
  20. Ramakrishnan, S.; Arun, M.; Loganayagan, S.; Mugeshkanna, M. Strength and Behaviour of Geogrid Reinforced Concrete Beams. Int. J. Civ. Eng. Technol. 2018, 9, 1295–1303. [Google Scholar]
  21. Tang, X.; Higgins, I.; Jlilati, M.N. Behavior of Geogrid-Reinforced Portland Cement Concrete under Static Flexural Loading. Infrastructures 2018, 3, 41. [Google Scholar] [CrossRef] [Green Version]
  22. Meng, X.; Chi, Y.; Jiang, Q.; Liu, R.; Wu, K.; Li, S. Experimental investigation on the flexural behavior of pervious concrete beams reinforced with geogrids. Constr. Build. Mater. 2019, 215, 275–284. [Google Scholar] [CrossRef]
  23. Chidambaram, R.S.; Agarwal, P. Flexural and shear behavior of geo-grid confined RC beams with steel fiber reinforced concrete. Constr. Build. Mater. 2015, 78, 271–280. [Google Scholar] [CrossRef]
  24. Sivakamasundari, S.; Daniel, A.J.; Kumar, A. Study on Flexural Behavior of Steel Fiber RC Beams Confined With Biaxial Geo-Grid. Procedia Eng. 2017, 173, 1431–1438. [Google Scholar] [CrossRef]
  25. Chidambaram, R.; Agarwal, P. The confining effect of geo-grid on the mechanical properties of concrete specimens with steel fiber under compression and flexure. Constr. Build. Mater. 2014, 71, 628–637. [Google Scholar] [CrossRef]
  26. Aluri, A.K.; Anand, Y.B. A Complete Study on Behaviour of Concrete Columns by Using Biaxial Geogrid Encasement. SSRG Int. J. Civ. Eng. 2015, 2, 10–17. [Google Scholar]
  27. Dong, Y.-L.; Han, J.; Bai, X.-H. Numerical analysis of tensile behavior of geogrids with rectangular and triangular apertures. Geotext. Geomembranes 2011, 29, 83–91. [Google Scholar] [CrossRef]
  28. Carmona, J.R.; Ruiz, G.; Del Viso, J.R. Mixed-mode crack propagation through reinforced concrete. Eng. Fract. Mech. 2007, 74, 2788–2809. [Google Scholar] [CrossRef]
  29. Susumu, I. Ductility and Energy Dissipation of Concrete Beam Members and Their Damage Evaluation Based on Hysteretic Dissipated Energy. Ph.D. Thesis, Kyoto University, Kyoto, Japan, January 1994. [Google Scholar]
  30. Rao, G.A.; Vijayanand, I.; Eligehausen, R. Studies on ductility of RC beams in flexure and size effect. In Proceedings of the 6th International Conference on Fracture Mechanics of Concrete and Concrete Structures, Catania, Italy, 17 June 2017; Volume 2. [Google Scholar]
  31. AACE International. Skills and Knowledge of Cost Engineering, 6th ed.; Hastak, M., Ed.; AACE International: Morgantown, WV, USA, 2015. [Google Scholar]
Figure 1. Dimensional characteristics of uniaxial geogrids and triaxial geogrids.
Buildings 10 00161 g001
Figure 2. General reinforcement details per each group and specific reinforcement details per each concrete slab.
Buildings 10 00161 g002
Figure 3. Fixing, isolation, protection, and types of used strain gauges.
Buildings 10 00161 g003
Figure 4. The Shimadzu machine, the computerized data logger, and the test set-up details.
Buildings 10 00161 g004
Figure 5. The concrete slabs crack patterns.
Buildings 10 00161 g005
Figure 6. Some examples of geogrids’ ribs status after the failure of the concrete slabs.
Buildings 10 00161 g006
Figure 7. The load-deflection curves per each group concrete slabs in comparison to the concrete control slab.
Buildings 10 00161 g007
Figure 8. Concrete slabs deflection values at concrete slabs critical load points in comparison to the concrete control slab.
Buildings 10 00161 g008
Figure 9. Concrete slabs deflection patterns at concrete slabs critical load points in comparison to the concrete control slab.
Buildings 10 00161 g009
Figure 10. The effect of geogrids type, the tensile strength of geogrids, and the number of geogrids’ layers on concrete slabs’ deflection.
Buildings 10 00161 g010
Figure 11. The concrete slabs load at different critical points in comparison to the concrete control slab.
Buildings 10 00161 g011
Figure 12. The Post-peak flexural strength values for each concrete slab in comparison to the concrete control slab.
Buildings 10 00161 g012
Figure 13. The effect of geogrids type, the tensile strength of geogrids, and the number of geogrids’ layers on concrete slabs’ load.
Buildings 10 00161 g013
Figure 14. The displacement ductility index values and the relation between the displacement ductility index and the tensile strength of geogrids or the number of geogrids’ layers.
Buildings 10 00161 g014
Figure 15. The energy dissipation values, and the relation between the energy dissipation and the tensile strength of geogrids or the number of geogrids’ layers.
Buildings 10 00161 g015
Figure 16. The load-strain curves of geogrids.
Buildings 10 00161 g016
Figure 17. The load-strain curves of steel bars.
Buildings 10 00161 g017
Figure 18. The bottom reinforcement general arrangement, the strain gauges’ locations, the uniaxial geogrids’ ribs portions, and transverse bars numbering system, and the triaxial geogrids’ hexagon pitches numbering system.
Buildings 10 00161 g018
Figure 19. Probability distribution analysis of geogrids strain values at the steel-yield strain.
Buildings 10 00161 g019
Figure 20. Geogrids utilization benefit to cost analysis.
Buildings 10 00161 g020
Table 1. The mix design of the used concrete.
Concrete–Mix, WC = 0.5, 1.5% Admixture
Cement
Grade 42.5
SandCrushed
Limestone
WaterWater Reducing and Super-Plasticizer Concrete AdmixtureCone SlumpCompressive Strength after 28 days
400 kg/m3600 kg/m31200 kg/m3200 kg/m36 kg/m36.5 cm40 N/mm2
Table 2. The reinforcement steel bars’ properties as per experimental tests.
Properties of the Steel Bars
Nominal Diameter (mm)6Nominal Cross-Area (mm2)28.29
Experimental Weight (kg/m)0.224Experimental Cross-Area (mm2)28.52
Experimental Yield Load (kN)8.4Experimental Ultimate Load (kN)13.51
Experimental Yield Stress (N/mm2)296.97Experimental Tensile Resistance (N/mm2)477.51
Experimental Yield Strain (Micro-strain)1485Experimental Elongation After Break Down (%)32.7
Table 3. Properties of the uniaxial geogrids by the manufacturer and experimental tests.
PropertiesUniaxial Geogrids (UG) Grades
UG45UG90UG120UG160
RL (mm)220220220220
Rs (mm)18151513
Bw (mm)12.51516.819.5
Rw (mm)2.73.346.1
Bt (mm)3.65.577.5
Rt (mm)1.31.72.42.3
Mass per Unit Area (g/m2)3006008001000
Theoretical Tensile Strength at 2% Strain (kN/m)11263645
Theoretical Tensile Strength at 5% Strain (kN/m)25507290
Theoretical Tensile Fesign Strength (kN/m)21.242.456.575.4
Theoretical Yield Point Elongation (%)11.5131313
Theoretical Peak Tensile Strength (kN/m)4590120160
Experimental Peak Tensile Strength (kN/m)45.5679.36103.91143.46
Experimental Peak Strain (%)30303030
MaterialHigh-Density Polyethylene (HDPE)
Table 4. Properties of the triaxial geogrids by the manufacturer, experimental tests, and numerical analysis.
PropertiesTriaxial Geogrids (TG) Grades
TG150TG160
Transverse (1)Diagonal (2)Transverse (1)Diagonal (2)
Mid-rib depth (D = mm) 1.11.41.51.8
Mid-rib width (W = mm)1.211.31.1
Rib pitch (P = mm)4040
Rib shapeRectangularRectangular
Aperture shapeTriangularTriangular
Theoretical Radial Secant Stiffness at 0.5% Strain (kN/m)360 (−75)390 (−75)
Theoretical Radial Secant Stiffness at 2% Strain (kN/m)250 (−65)290 (−65)
Hexagon Pitch (mm)80 (±4)80 (±4)
Radial Secant Stiffness Ratio0.80.8
Experimental Peak Tensile Strength (kN/m)17.2119.45
Experimental Radial Secant Stiffness at 2% strain (kN/m), based on BS EN 1SO 10319:1996195245
Experimental Peak Strain (%)14.514.5
Numerical Yield Strain (%) [27]6.46.4
MaterialPolypropylene with a Minimum of 2% Finely Divided Carbon Black Content
Table 5. Locations of cracks per each hybrid reinforced concrete slab, according to the mentioned numbering system in Figure 18.
Slab NumberCracks’ LocationsThe Tensile Force Expected to be Carried by
1st Crack2nd Crack
Group Number One Concrete Slabs
S2-ST+1UG45R3 R3
S3-ST+1UG90T3 R2 and R3
S4-ST+2UG45T4 R4 and R3
S5-ST+1UG120T3 T4 R2, R3, and R4
S6-ST+1UG160T3 T4 R2, R3, and R4
S7-ST+2UG90R2 adjacent to T3T4 R2, R3, and R4
S8-ST+2UG120T3 T4 R2, R3, and R4
S9-ST+2UG160T3 T4 R2, R3, and R4
Group Number Two Concrete Slabs
S10-ST+1TG150H6-H7 H6-H7 and H-6
S11-ST+1TG160H6-H7 H6-H7 and H-6
S12-ST+2TG150H6 H6-H7 and H-6
S13-ST+2TG160H8 H4-H5H4, H4-H5, H7-H8, and H8
Table 6. Bottom reinforcement strain values’ records at the first-crack (initial-peak load) and after the first-crack (load-drop).
Slab Number Steel Bars Geogrids
Strain Value at the First-Crack Load (Initial-Peak Load Point)
(Micro-Strain)
Strain Value after the First-Crack Load (Load-Drop Point)
(Micro-Strain)
Percentage of Strain Values’ Sudden Increase after the First-Crack Load (%)Strain Value at the first-Crack Load (Initial-Peak Load Point)
(Micro-Strain)
Strain Value after the First-Crack Load (Load-Drop Point)
(Micro-Strain)
Percentage of Strain Values’ Sudden Increase or Decrease after the First-Crack Load (%)
Control Slab
S1-ST-CONT3411085+218%
Group Number One Concrete Slabs
S2-ST+1UG4596217+126%82191+133%
S3-ST+1UG90236654+177%114176+54%
S4-ST+2UG45385803+109%52327+529%
S5-ST+1UG120307349+14%151514+241%
S6-ST+1UG160170492+189%114421+269%
S7-ST+2UG90184461+151%9183−9%
S8-ST+2UG120321777+142%154363+136%
S9-ST+2UG160204512+151%113242+114%
Group Number Two Concrete Slabs
S10-ST+1TG1503021050+248%1732389+1281%
S11-ST+1TG160125143+14%95108+14%
S12-ST+2TG1504331411+226%212771+264%
S13-ST+2TG160208973+368%260194−25%

