Ecological Assessment of Clay Brick Manufacturing in China Using Emergy Analysis


1
School of Architecture, Southeast University, Nanjing 210096, China
2
Urban Building Energy, Sensing, Controls, Big Data Analysis, and Visualization (UrbSys) Laboratory, M.E. Rinker, Sr. School of Building Construction, College of Design, Construction and Planning, University of Florida, Gainesville, FL 32612, USA
3
Key Laboratory of Urban and Architectural Heritage Conservation, Ministry of Education, Nanjing 210096, China
*
Authors to whom correspondence should be addressed.
Buildings 2020, 10(11), 190; https://0-doi-org.brum.beds.ac.uk/10.3390/buildings10110190
Submission received: 6 August 2020
/
Revised: 7 October 2020
/
Accepted: 16 October 2020
/
Published: 22 October 2020
(This article belongs to the Section Building Materials, and Repair & Renovation)
Abstract
:Clay brick is a commonly used building material in China. Due to the enormous land destruction and excessive consumption of resources, such as materials and energy in the manufacture of clay brick, it is important to study its overall sustainability, i.e., in terms of impact on the environment, services, and economy. In this study, emergy analysis is employed, which offers a holistic perspective, unlike typical environmental studies. A series of emergy indices such as renewability rate (R%), nonrenewability rate (N%), unit emergy values (UEVs), emergy yield ratio (EYR), environmental loading ratio (ELR), and emergy sustainability index (ESI) were used to study manufacturing of clay brick. In addition to calculating UEVs of clay brick manufacturing in China (7.18 × 10¹² sej/kg), our detailed analysis shows that the nonrenewable resources and imported energy have a dominant impact on the emergy contribution (50.6%) and within the nonrenewable resources, clay is the foremost item, accounting for 33.5% of local emergy inputs. Given different electricity UEVs, the change ranges of clay brick system UEVs are 14.9% (scenario 1), 7.24% (scenario 2), 8.91% (scenario 3), and 6.94% (scenario 4). Furthermore, several policy suggestions are discussed for improving the sustainability of the evaluated system, involving the energy structure adjustment, recycling material replacement, and promotion of energy-saving systems.
1. Introduction
Before the advent of cement-based materials for buildings, clay bricks were one of the most commonly used materials for more than two thousand years in China, as seen in ancient buildings [1,2]. Despite China’s rapid growth from the reform in the 1980s [3], clay bricks continued to be used in building construction in rural areas. While much attention has been aimed at cementitious bricks in terms of sustainability assessments, the research community has rarely focused on the overall sustainability, i.e., in a holistic perspective, of clay bricks in China.
Sustainability demonstrates the concept of the triple bottom line, which is a comprehensive dimension study related to the environment, society, and economy. Sustainability is an important concept and central issue which is widely used in various fields such as supply chain management [4], engineering analysis [5], building construction program [6], information aspect [7], tourism growth [8], agricultural directions [9], national sustainability [10], urban assessments [11], groundwater sustainability assessment [12], dryland regions [13], and campus culture [14].
In the case of the manufacturing of clay bricks, several approaches were used to assess the sustainability, namely, life cycle assessment (LCA), material flow analysis (MFA), energy analysis (EA), economic evaluation (EE), etc. Previous works [15,16,17,18] attempted to estimate the impact on land, water, and air due to the manufacturing of clay bricks. While MFA focused on coal ash, wastes additives, fabric reinforced cementitious mortar in bricks [19], EA estimated the energy consumption used in clay brick manufacturing. In EA, the coal and other primary energy resources that were used in the manufacturing were converted to a common unit base on power generation equipment, for example, electricity, diesel, and fuel oil [20]. EE focuses on the cost impact only, for example, reusing fly ash in the brick industry [21]. However, an integrated LCA and EE assessments offer insight both into cost impact as well as impact on the environment [22].
However, none of these approaches offers a comprehensive performance evaluation of clay bricks that takes into consideration the constructs of the triple bottom line, namely environment (resource), society (service), and economy. Emergy analysis (EMA), put forward by H.T. Odum, integrates mass flow, energy flow, currency flow, and information flow into a unified platform to compute the environment, service, and economy in emergy units [23]. Depending on a set of indicators, the sustainability of the targeted system can be displayed.
Needless to say, there is a strong need for a comprehensive assessment of clay brick manufacturing in China using emergy theory. However, at this time, there are no such assessments available for the manufacturing of clay brick in China using emergy analysis. This paper discusses the sustainability assessment of clay brick manufacturing in China using EMA, and more specifically by utilizing (i) unit emergy values and (ii) sustainability-based emergy indices such as emergy yield ratio (EYR), environmental loading ratio (ELR), and emergy sustainability index (ESI).
While unit emergy values (UEVs) of clay bricks can be used to calculate emergy of buildings and infrastructure that use clay brick in China, emergy indices are crucial to developing policies to ease the environmental load. The entire paper is organized as below. Section 1 is the introduction. Section 2 shows the evaluated methodology. Section 3 discusses the results of emergy analysis followed by a discussion. Finally, Section 4 draws conclusions of the study.
2. Emergy Analysis Method of Clay Brick Manufacturing in China
2.1. Emergy Methodology
Emergy analysis offers a holistic ecological evaluation of a system or product, including materials, energy, resources, and service over the entire lifespan of that system or product. As a unique concept, emergy was used to elucidate the sustainability of materials.
Emergy can realize the integration between environment and inputs, including resources, energy, and service [24]. Therein, unit emergy values (UEVs) are the key concept for calculating the emergy amount based on the unit of solar emergy joules (sej), which has three types, emergy/energy (sej/j), specific emergy (sej/g), and emergy/money (sej/$) [25].
Emergy baseline is the base of emergy calculation, related to solar, tidal, and geothermal energy. To date, five versions have been put forward, which are 9.44 × 1024 sej/year [23], 9.26 × 1024 sej/year [26], 15.83 × 1024 sej/year [27], 15.2 × 1024 sej/year [28], and 12 × 1024 sej/year [29]. The latest emergy baseline (12 × 1024 sej/year) combines the above four calculated methods of geobiosphere emergy baseline [29]. On the basis of the newest emergy baseline, several UEVs have been developed. For this work, an emergy baseline of 12 × 1024 sej/year was used.
The emergy accounting process comprises three steps, namely, Step 1: Establishing a system diagram to capture all inputs and outputs of the system; Step 2: Constructing an emergy value inventory table; and Step 3: Calculating ratios and emergy indices. Following Step 3, an in-depth analysis and relevant policy discussions can be made. Basic calculation formulas of emergy can be shown as:
where U is the emergy (sej); N, M, V represent the units of Joules (J), grams (g), and money ($), respectively. UEV is emergy per unit of product, energy, service, or money. These are the definitions that illustrate the efficiency of an evaluation system [30].
U(sej) = N(J) × UEV(sej/J)
U(sej) = M(g) × UEV(sej/g)
U(sej) = V($) × UEV(sej/$)
2.2. Emergy Sustainability Indicators
The following emergy indices have been used in this study:
- (1)
- Basic indicators:
Renewability rate (R%), a ratio with a renewable emergy part and total emergy part. A higher renewability rate represents a better ecological level.
Nonrenewability rate (N%) signifies the ratio of the nonrenewable emergy part and total emergy part. A higher nonrenewability rate implies a worse ecological level.
Other related indicators are UEVs, imported resources, imported energy, and labor and service.
- (2)
- Emergy yield ratio (EYR):
EYR is defined as the ratio between total emergy and imported emergy, and it represents the ability to generate emergy. The less input of purchased emergy will lead to lower EYR, which expounds the competitive ability and economic status of the targeted object.
- (3)
- Environmental loading ratio (ELR):
ELR is the ratio between nonrenewable resources and imported emergy to renewable emergy. ELR has been used to formulate the ecological pressure of targeted ecosystems. Environmental loads are made up of non-resource emergy, imported emergy, and others, such as gas emissions, waste discharge, etc. Some researchers have already given the related standard for different environmental load situations [31].
- (4)
- Emergy sustainability index (ESI):
ESI is the ratio of two emergy indicators, EYR and ELR. It implies the integral sustainable situation of one system, which can be used to assess the overall effect. Generally speaking, in view of the literature [31], there are three numerical segments to signify the sustainable degrees, which contain ESI < 1 (sustainable), 1 < ESI < 5 (medium sustainability), and ESI > 5 (unsustainable), in the long term.
2.3. Clay Brick Manufacturing Process and Data in China
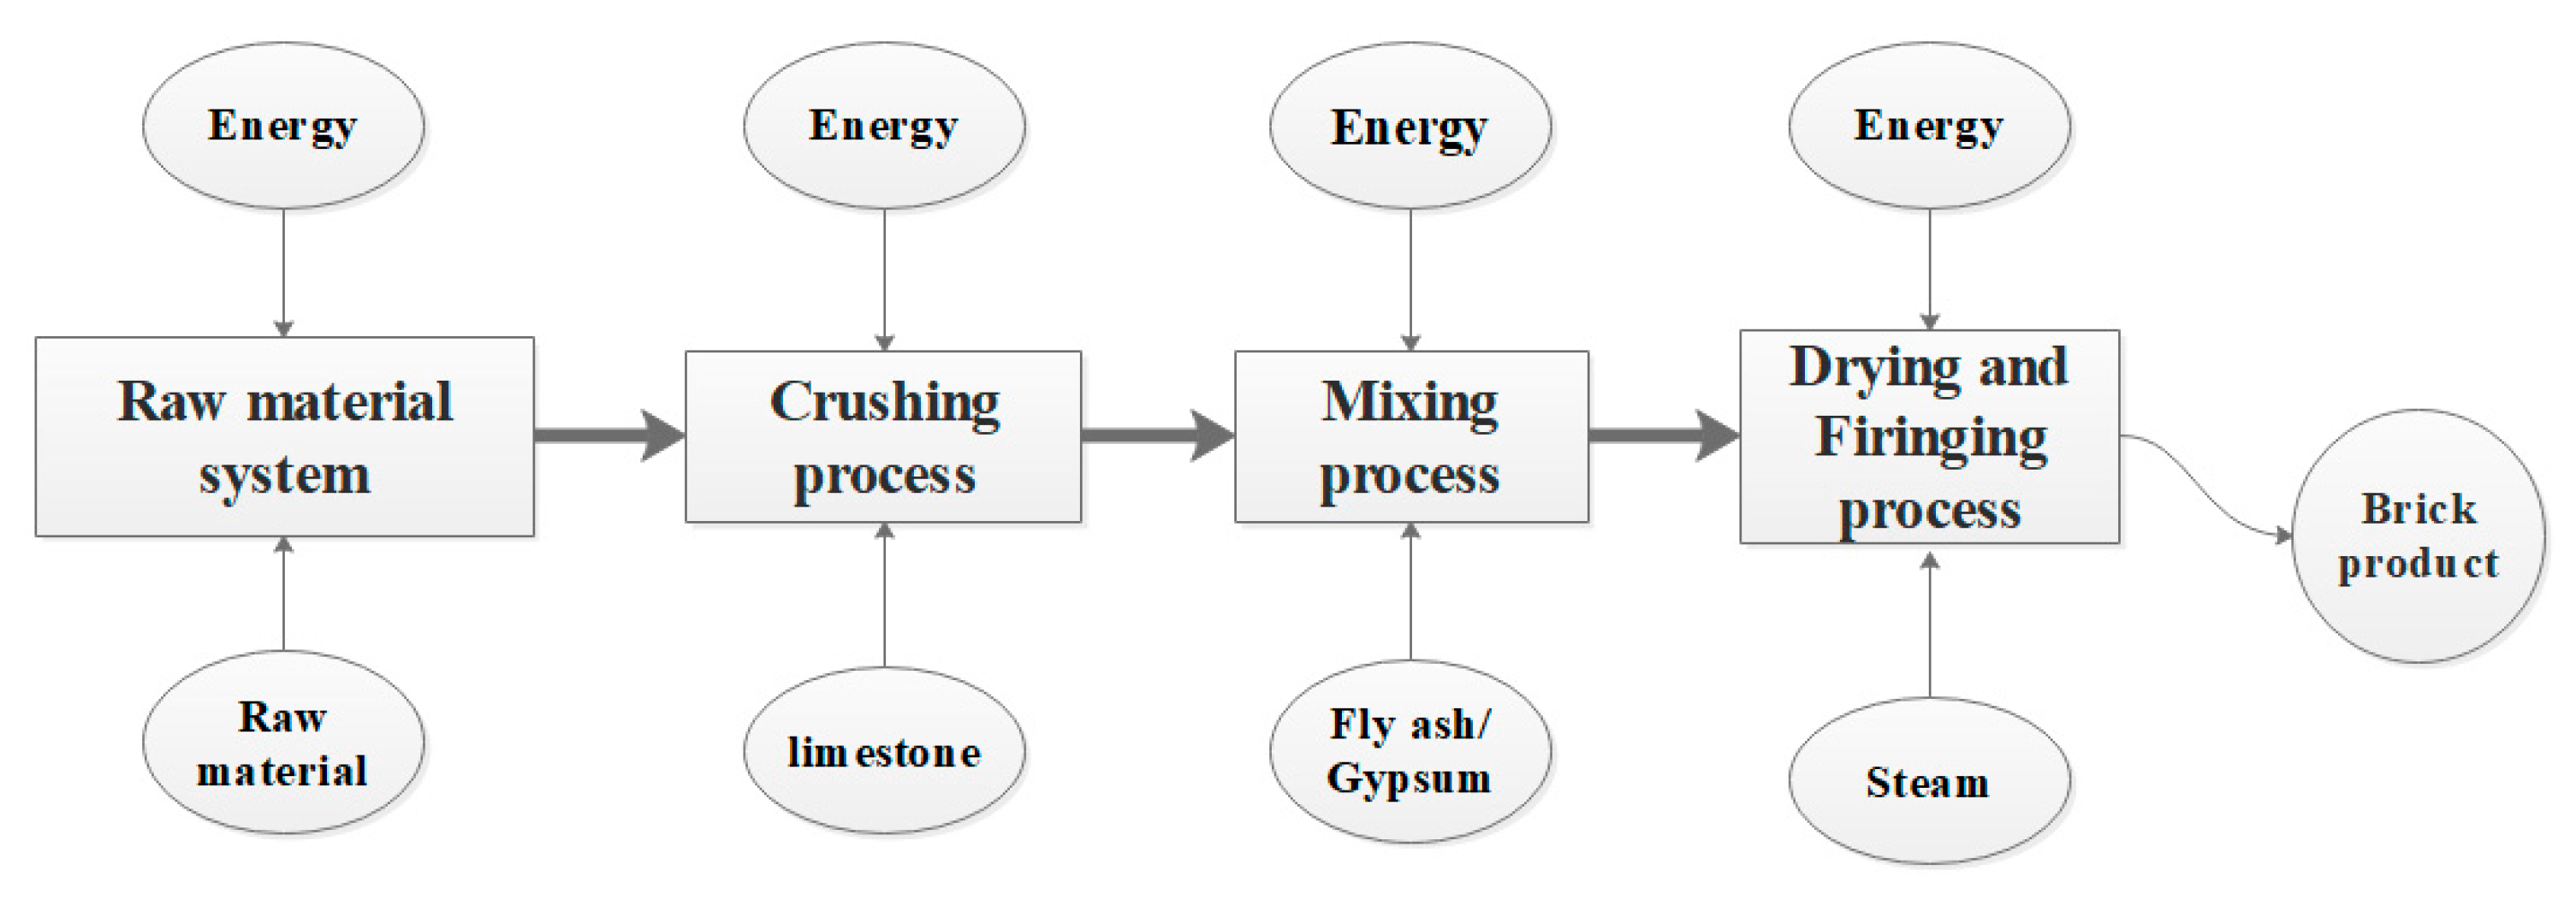
As clay bricks are still used as a primary building material in China, there are over 60,000 clay brick manufacturing plants in operation today, producing 800 billion clay bricks on an annual basis [32]. For the purposes of this work, a medium-sized clay brick manufacturing plant located in Shijiazhuang City of Hebei Province in China was selected. The manufacturing plant has an area of 5000 square meters. The annual manufacturing of this plant is approximately 6 million standard sized bricks (240mm × 115mm × 53mm) in a year [33]. Data used in this work were obtained from this manufacturing plant. Figure 1 shows the process of the manufacturing of clay brick.
The traditional manufacturing processes of brick product (Figure 1) are composed of the raw material preparation process, crushing process, mixing process, drying, and firing process. The entire process can be simplified to four major processes, namely raw material, crushing, mixing, and drying and firing processes, in that order [34].
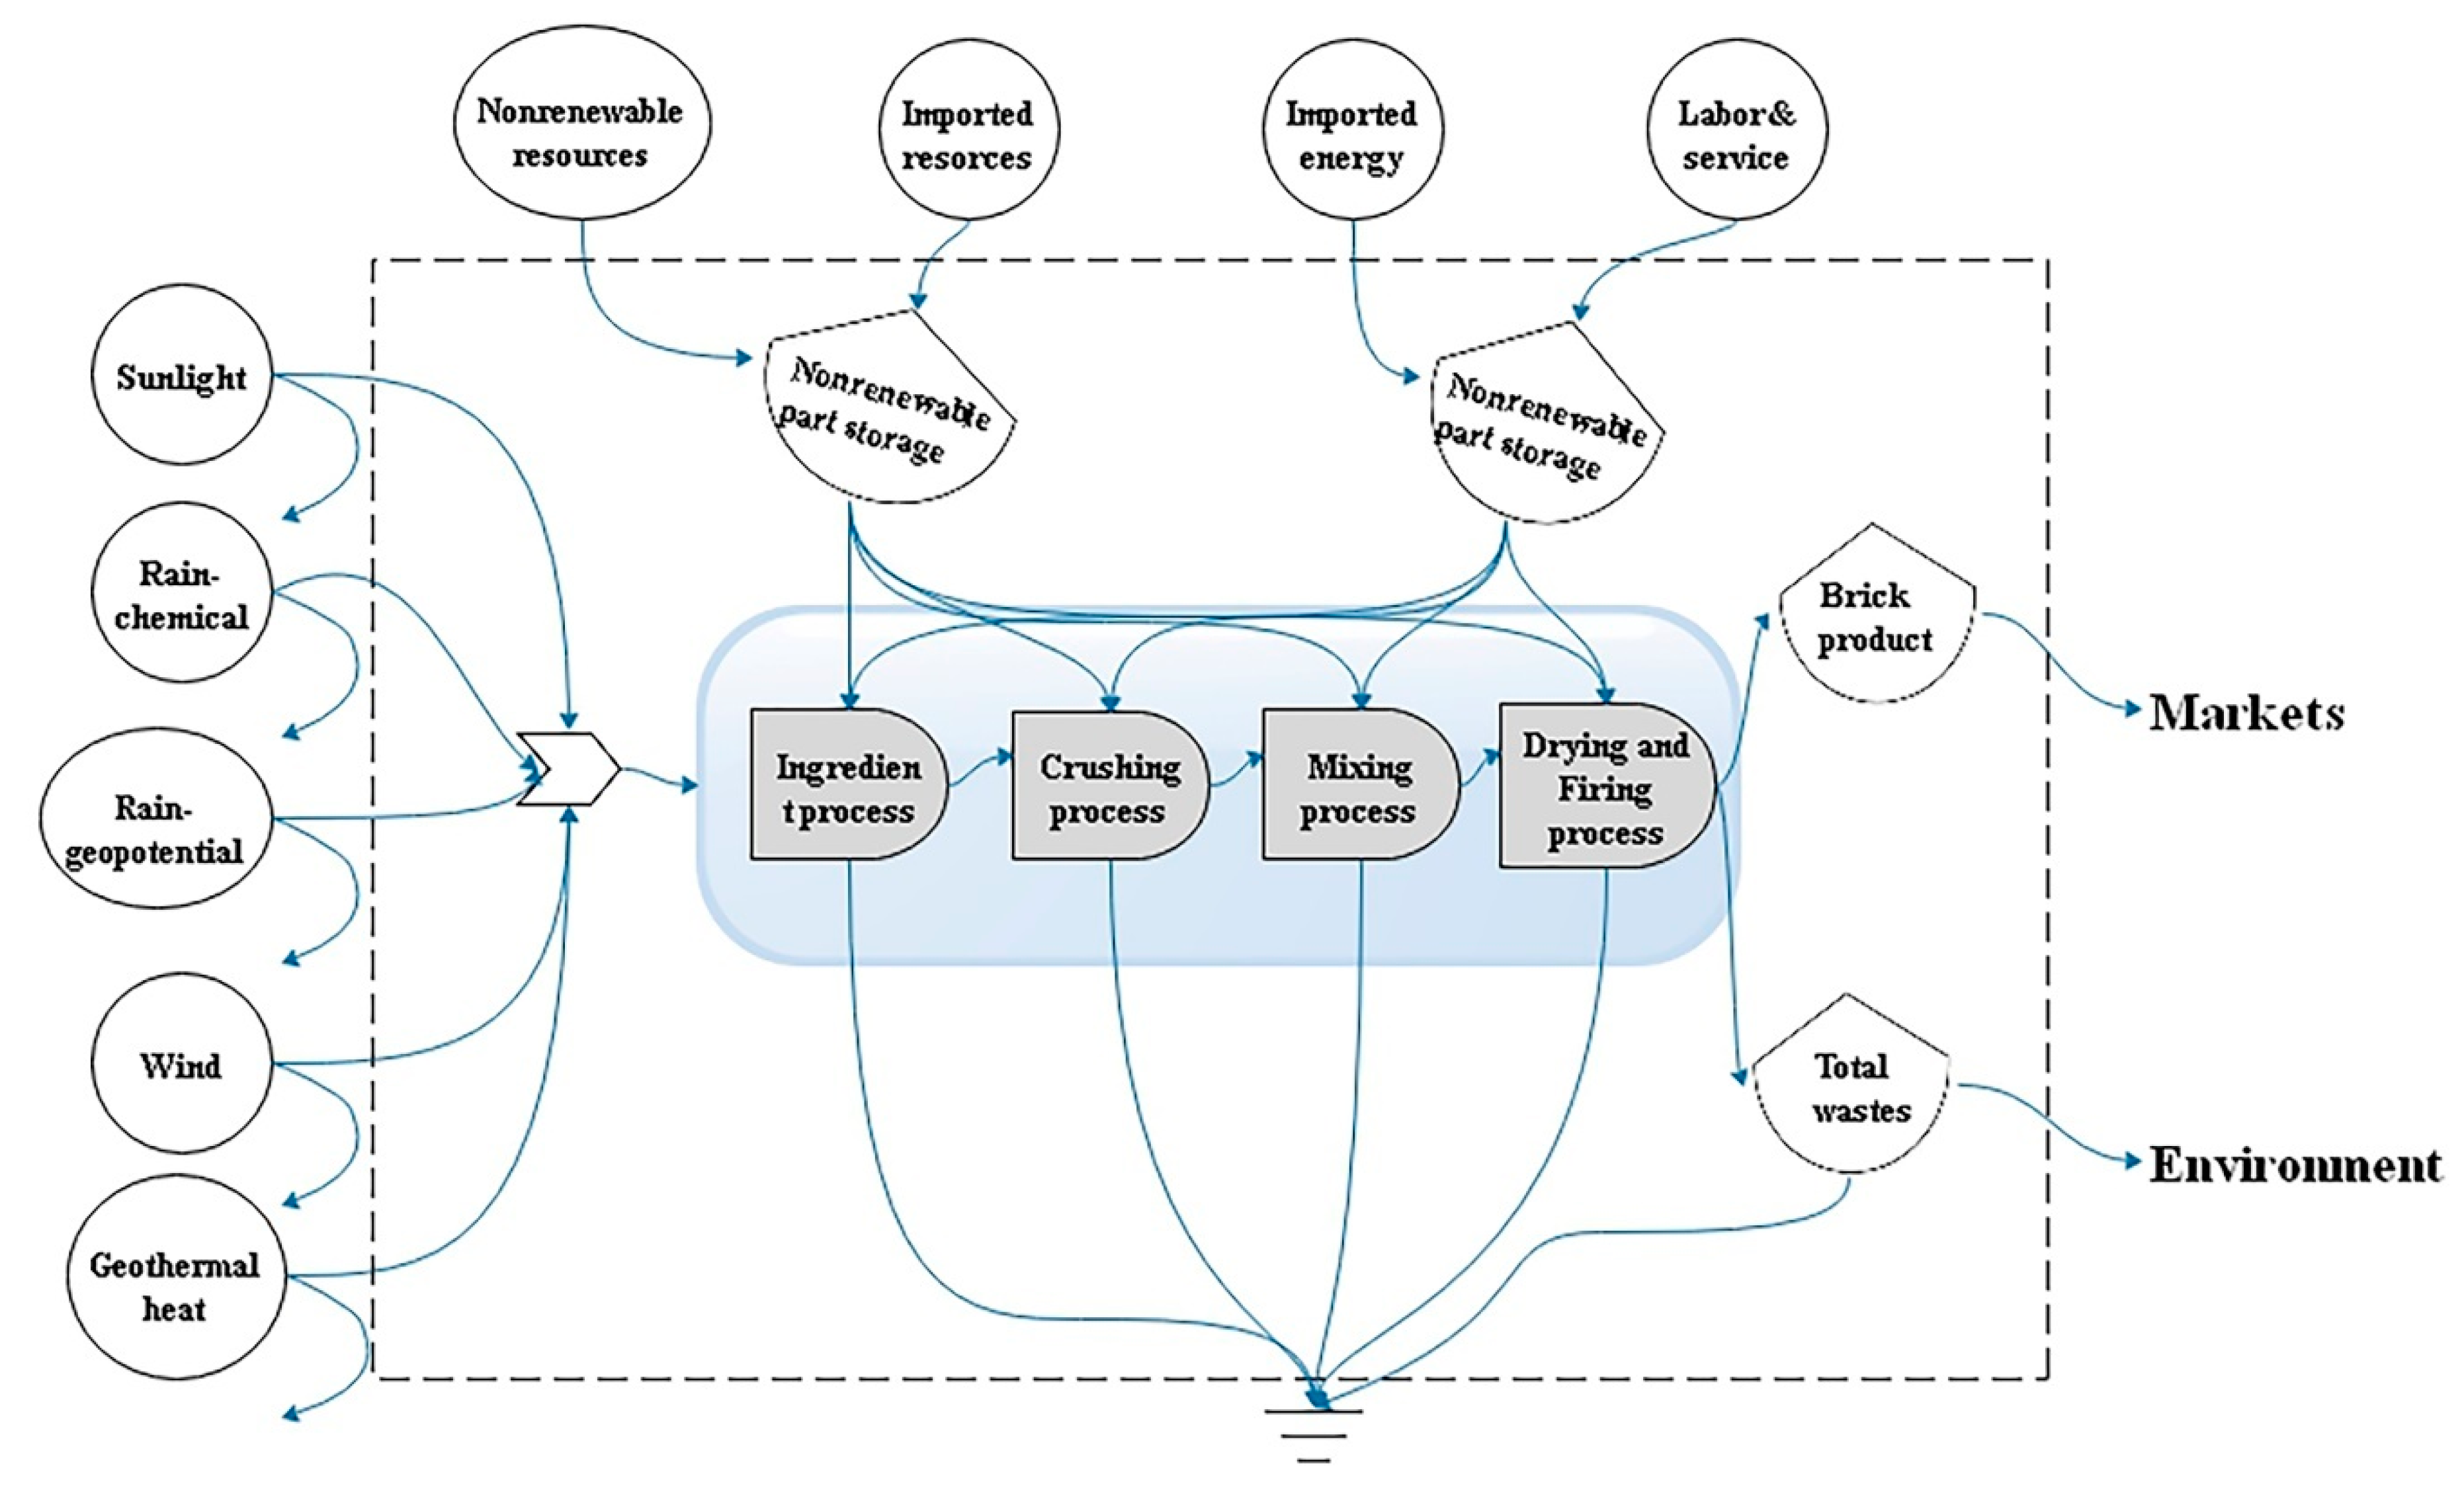
2.4. Emergy Flow Diagram of Clay Brick Manufacturing Process in China
Figure 2 shows the emergy diagram of manufacturing of clay brick. The system boundary of clay brick manufacturing includes renewable, nonrenewable, and imported resources, imported energy, and labor and service. Energy is used in four main processes of brick manufacturing, including the ingredient, crushing, and mixing processes, as well as the drying and firing process.
2.5. Emergy Analysis and Calculation of UEV
The sustainability assessment of clay brick manufacturing takes into account environment, service, and economical factors. For this work, in addition to typical emergy analysis, we can include air pollutant emission and its environmental impact (in sej), ecological service accounting, and economy accounting with an emphasis on disability-adjusted life years (DALYs) lost [24].
2.5.1. Air Pollutants and Related Emissions
According to the China’s National Mandatory Standard [35], there are three main air pollutants in building brick manufacturing, namely dust, sulfur dioxide (SO2), and nitrogen oxides (NOx). The exhaust can cause severe effects on human health and ecosystem sustainability, specifically by causing respiratory disease and disrupting ecological balance aspects. To obtain a careful consideration, the ecological service and economic loss calculations have been performed in this study. The initial emission data contain 80 mg/m3 (dust), 20 mg/m3 (SO2), and 50 mg/m3 (NOx) based on the GB 3095-2012 standard.
2.5.2. Economic Loss Accounting
2.5.3. Ecological Services Accounting
There is a close relationship between the ecological services calculation and environmental impacts. Therefore, three air pollutants have been chosen (dust, SO2, and NOx) for emergy assessment. For the estimate of the ecological service, as a first step, the waste gas amount must be estimated according to Equation (5) [24].
Secondly, the emergy of ecological services is calculated as below.
where Mi, i, c, Ui, and si are air dilution (Kg/a), gas species, air density (1.23 Kg/m3), the amount of air pollution each year, and acceptable concentration (dust, 0.08 mg/m3; SO2, 0.02 mg/m3; NOx, 0.05), respectively [35]. Rair,i, v, and Tw are environmental emergy, wind speed (2.8 m/s), and transformity of wind (1.86 × 10³ sej/J) [24].
3. Results and Discussion
3.1. Emergy Table Calculations
The emergy analysis calculations of clay brick manufacturing in China are given in Table 2. The calculated items comprise renewable resources, nonrenewable resources, imported resources, imported energy, and labor and service. In the evaluated system, five renewable inputs are considered, such as sunlight, rain (chemical energy), rain (geopotential), wind (kinetic energy), and geothermal heat. Nonrenewable resources consist of clay and shale. Imported resources are mainly purchased resources, gypsum, limestone, steam, and fly ash. Imported energy is electricity. Based on local economic conditions, labor and service were included in emergy calculation.
In Table 2, there are six emergy sections in the brick manufacturing system and have vital effects on sustainability. Based on this background, a few important emergy values are 4.97 × 10¹⁷ sej/year for renewable resources, 2.18 × 10²⁰ sej/year for nonrenewable resources, 2.23 × 10¹⁹ sej/year for imported resources, 7.79 × 10¹⁹ sej/year for imported energy, and 1.11 × 10²⁰ sej/year for labor and service.
The emergy results shown in Table 2 reveal that the most important factors are nonrenewable resources (50.7%), followed by labor and service (25.8%) and imported energy (18.1%). Compared with those items, renewable resources play a minor role in the input emergy.
For nonrenewable resources, clay is the major contributor, accounting for about 66.1% of nonrenewable resources in emergy terms and 33.5% of the total emergy needed. Shale emergy, in second place, uses 33.9% and 17.1%, respectively. For the imported resources, the contribution ratios are 1.78% for limestone emergy, 1.78% for gypsum emergy, and 1.63% for fly ash emergy. Low quantities of renewable resources were used as inputs. Overall, results show that, in emergy terms, clay, shale, electricity, and labor and service are dominant components for clay brick manufacturing in China.
3.2. Emergy-Based Indicators
A series of indicators, namely, renewability rate, nonrenewability rate, emergy yield ratio, environmental loading ratio, and emergy sustainability index, were calculated and are shown in Table 3; details are as follows.
- (1)
- Renewability rate (%R)
The renewability rate of clay brick manufacturing in China is calculated as 0.01%. This value symbolizes the sustainable level for the evaluated system and represents the proportion of renewable resources. The renewability rate is too low for clay brick manufacturing in China. Because of the high emergy costs of energy and resources, a large number of nonrenewable resources are used in the brick plant, resulting in a high non-renewable rate.
Therefore, enhancing the renewability rate is an urgent task for clay brick manufacturing plants in China. In light of recent research results, some measures have been put into practice to improve the clay brick manufacturing process, such as the use of rainwater recycling technology [41] and wastewater reuse technology [42,43]. For example, if the renewable resource can be increased by 10%, %R can be improved by 50%.
- (2)
- Nonrenewability rate (%N)
The nonrenewability rate of clay brick manufacturing in China is 50.6%. This large percentage shows the share of negative strain on the sustainability of the evaluated system. The higher the nonrenewability rate, the worse its sustainability. There are two approaches to mitigate this situation, i.e., reduce %N, namely, by enhancing energy utilization efficiency and using alternative materials to replace nonrenewable resources. For example, if energy utilization efficiency can be enhanced by 10%, the nonrenewability rate can be reduced by 0.76%; meanwhile, if 10% of the clay can be replaced by brick fragments, the nonrenewability rate will be reduced by 3.21%. In the case of alternative materials, for instance, when clay is decreased by 10%, the nonrenewability rate (%N) can be reduced by 5.07%. Therefore, using alternative materials is critical to improve %N.
Other studies have implemented similar approaches to realize sustainable development. According to Prafulla et al. [44], the activated alumina was used to substitute clay to for brick making, and, to a certain extent, the sustainable development model of the brick factory was improved. Taking advantage of fly ash and fly ash wastes, eco-friendly clay brick manufacturing was attempted by Mucahit et al. [45].
- (3)
- Unit emergy values (UEVs)
The unit emergy value of building clay brick manufacturing is calculated as 7.18 × 10¹² sej/kg, which is different from other researchers’ results, see Table 4. The UEV based on this study differs from existing studies due to the emergy baseline used (12.0 × 1024 sej/year), evaluated system boundaries, specific manufacturing processes, UEVs of input items, brick types, labor and service situations, energy structure and efficiency, etc.
- (4)
- Emergy yield ratio (EYR)
The Emergy yield ratio of clay brick manufacturing in China is 18.3. This signifies that the imported emergy item is far less than total emergy. The local resource (clay) is the main source of non-resource emergy causing serious clay waste and vast environmental pollution.
- (5)
- Environmental loading ratio (ELR):
The environmental loading ratio for clay brick manufacturing in China is 486, which is far greater than the relevant standard and empirical values, which indicates serious environmental burden. It is to be noted that, based on emergy analysis, clay brick manufacturing will bring greater damage to the local ecological environment. One option is to, among others, to use sustainable raw materials for brick manufacturing to reduce the impact to the environment.
- (6)
- Emergy sustainability index (ESI):
The emergy sustainability index of clay brick manufacturing in China is 0.038. Based on the ESI, the manufacturing process is not a sustainable state in the long run. In order to improve the unsustainable state of the brick factory, several environmentally friendly brick products (shale, gypsum, limestone, etc.) can be used as alternatives.
3.3. Sensitivity Analysis
As shown in Table 2, the total emergy input is divided into five parts, involving renewable resources, nonrenewable resources, imported resources, imported energy, and labor and service. The accuracies of basic data and UEVs can be impacted by various sources. Therefore, it is necessary to conduct the sensitivity analysis.
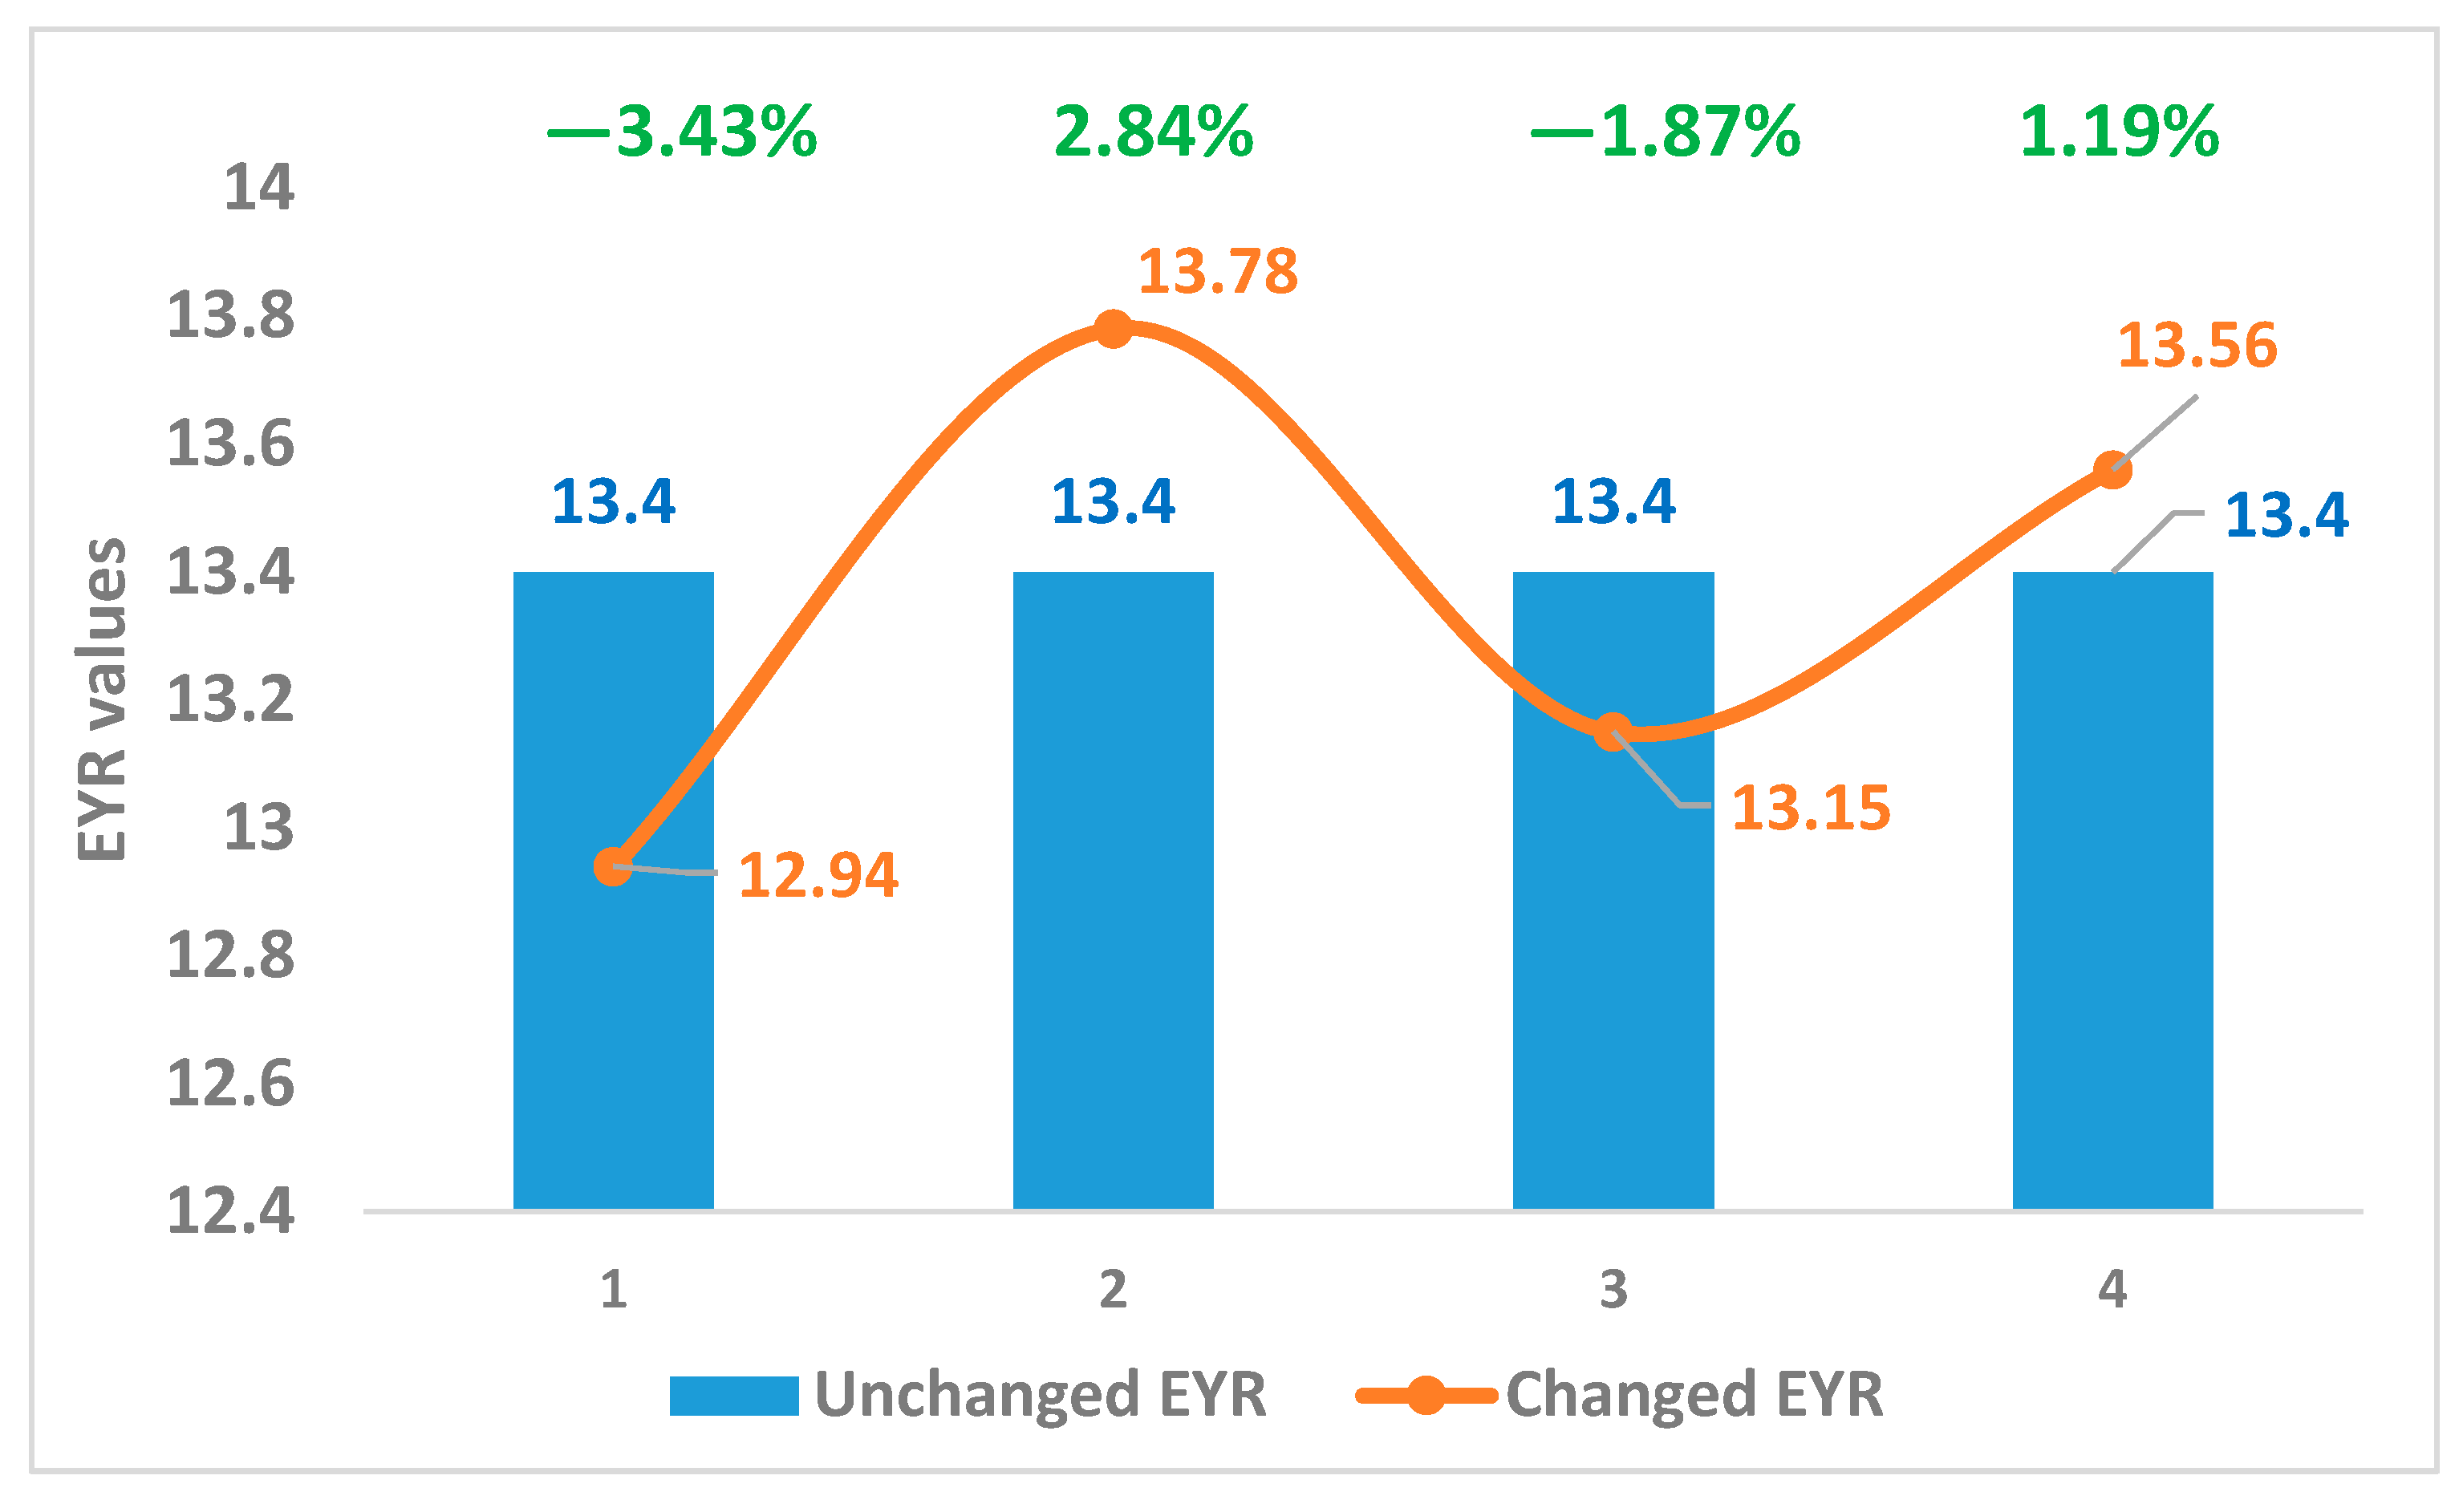
For the purposes of sensitivity analysis, the nonrenewable resources and imported energy are prioritized owing to their major influence on total emergy. Here, four scenarios are tested for sensitivity; scenario 1: the UEVs of nonrenewable resources change by −5% (i.e., reducing the nonrenewable resources by 5%); scenario 2: the UEVs of nonrenewable resources vary by +5%; scenario 3: the UEVs of imported energy are the target that have a −5% range of change; and scenario 4: the UEVs of imported energy are altered by +5%. The resultant sensitivity data of four scenarios are shown in Figure 3 and Figure 4.
Scenario 1 has the biggest fluctuation (−3.43%), followed by scenario 2 (2.84%), scenario 3 (−1.87%), and scenario 4 (1.19%), in this order. Based on −5% changes of four scenarios, the UEVs of nonrenewable resources have a greater influence than imported energy (from −3.43% to −1.87%). It means that a 5% reduction of nonrenewable resources and imported energy can cause 3.43% and 1.87% decreases for the entire emergy input, respectively. For a +5% variation in EYR, a similar trend is seen, as shown in Figure 3 (from 2.84% to 1.19%). Nonrenewable resources play a major role, as can be seen in the emergy contribution ratio, accounting for 50.6% of total emergy in the evaluated system. The higher the emergy ratio, the greater the sensitivity results. In addition, based on EYR and ELR calculations, the ESI can be computed through a formula (EYR was divided by ELR). Because ELR is much larger than EYR, this results in an essentially unchanged ESI for this paper.
To improve overall sustainability of clay brick manufacturing, we recommend the use of clean energy as well as increased use of recycled materials.
3.4. Different Electricity UEV Effects Based on Multiple Literature Sources
In terms of Table 2, there are four primary inputs, which are clay, shale, electricity, and labor and service, accounting for 33.5%, 17.1%, 18.1%, and 25.9% of the total emergy in the brick plant, respectively. Owing to the large variations in different pieces of literature within the context of China, four groups of new electricity UEVs were selected and calculated from other studies in the last five years [49,50,51,52]. Specific data can be found in Table 5.
Based on different electricity UEV selections from other studies (in Table 5), the four scenarios previously mentioned were considered and calculated in this paper. All input proportions of the four new scenarios have been computed to analyze the disparate electricity UEV impacts on the sustainability of clay brick plants.
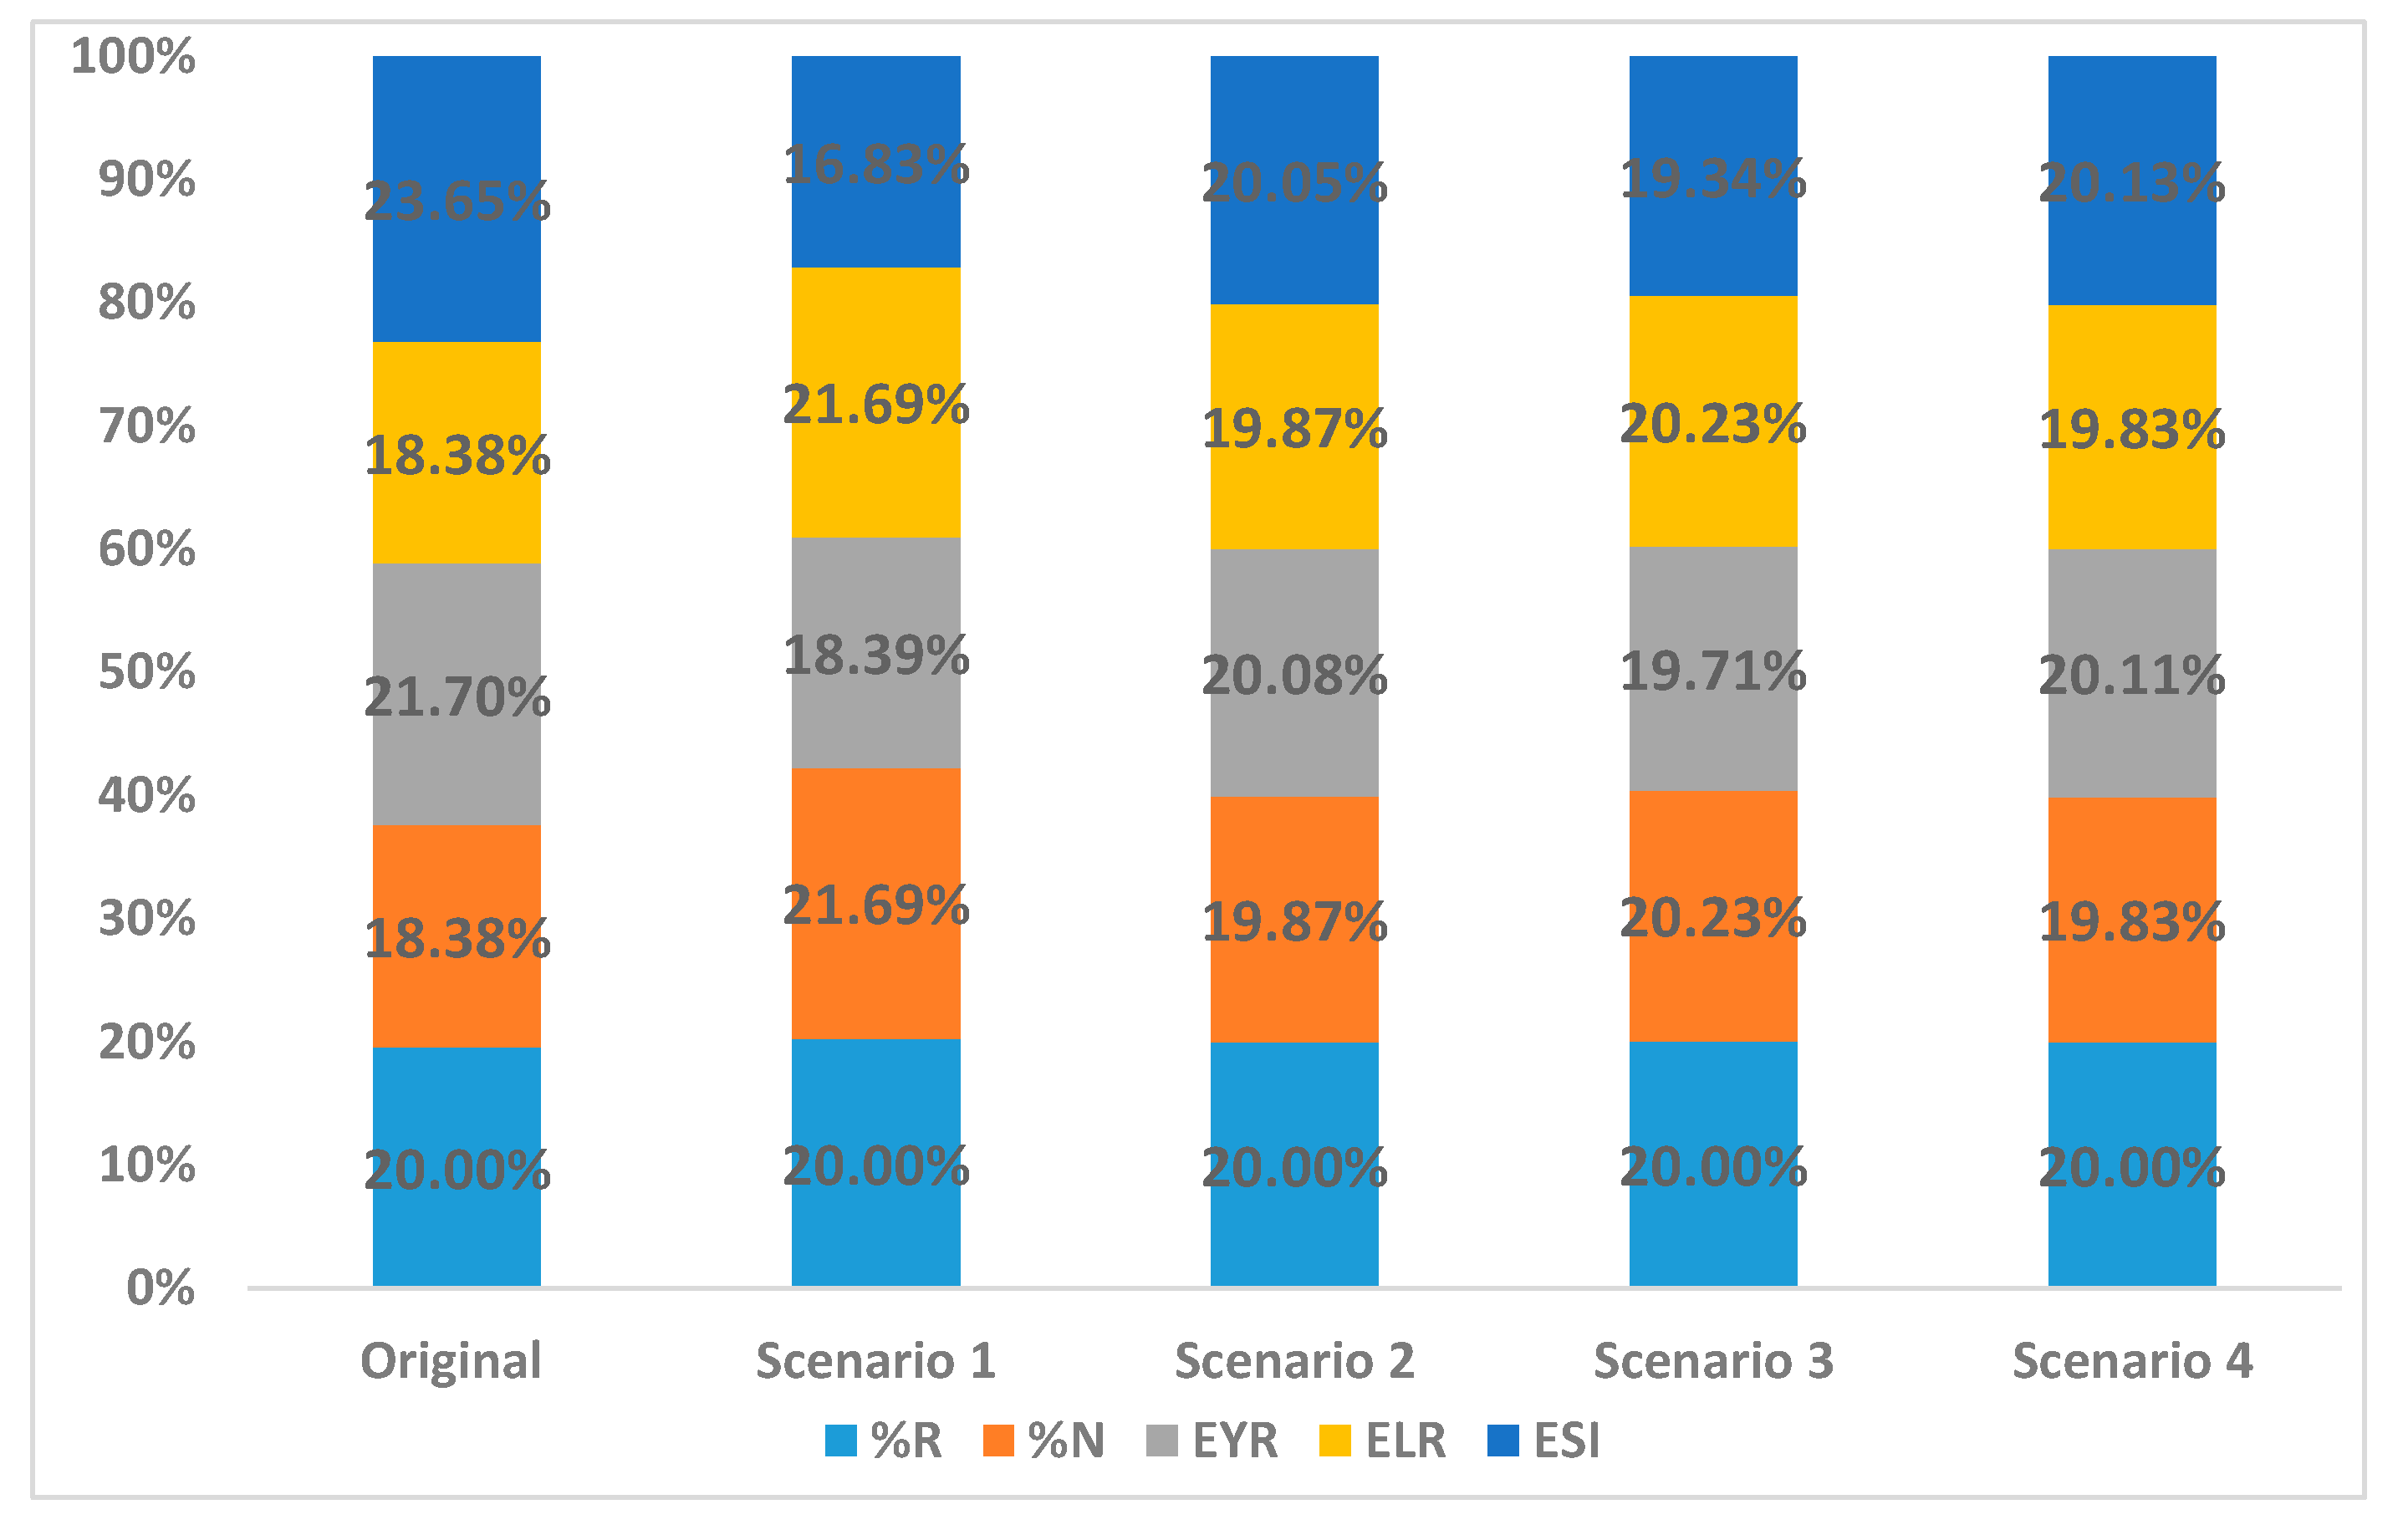
Table 6 lists the final emergy sustainability results and Figure 5 shows the comparison of the scenarios. Firstly, given the small renewability rate (R%) input for all scenarios, its proportion has no change. In all cases, it is 0.01%. In addition to renewable inputs, other cases have different variations, such as %N (from 18.38% input to 21.69%), EYR (from 18.39% input to 21.7%), ELR (from 18.38% input to 21.69%), and ESI (from 16.83% input to 23.65%). On the whole, the ranges of variation are from 3.31% to 6.82%, which demonstrate that different electricity UEVs of multiple literature sources have a greater impact on the assessment results. In this paper, taking the ESI as an example, the biggest gap was 6.8%, resulting in inaccurate sustainability results.
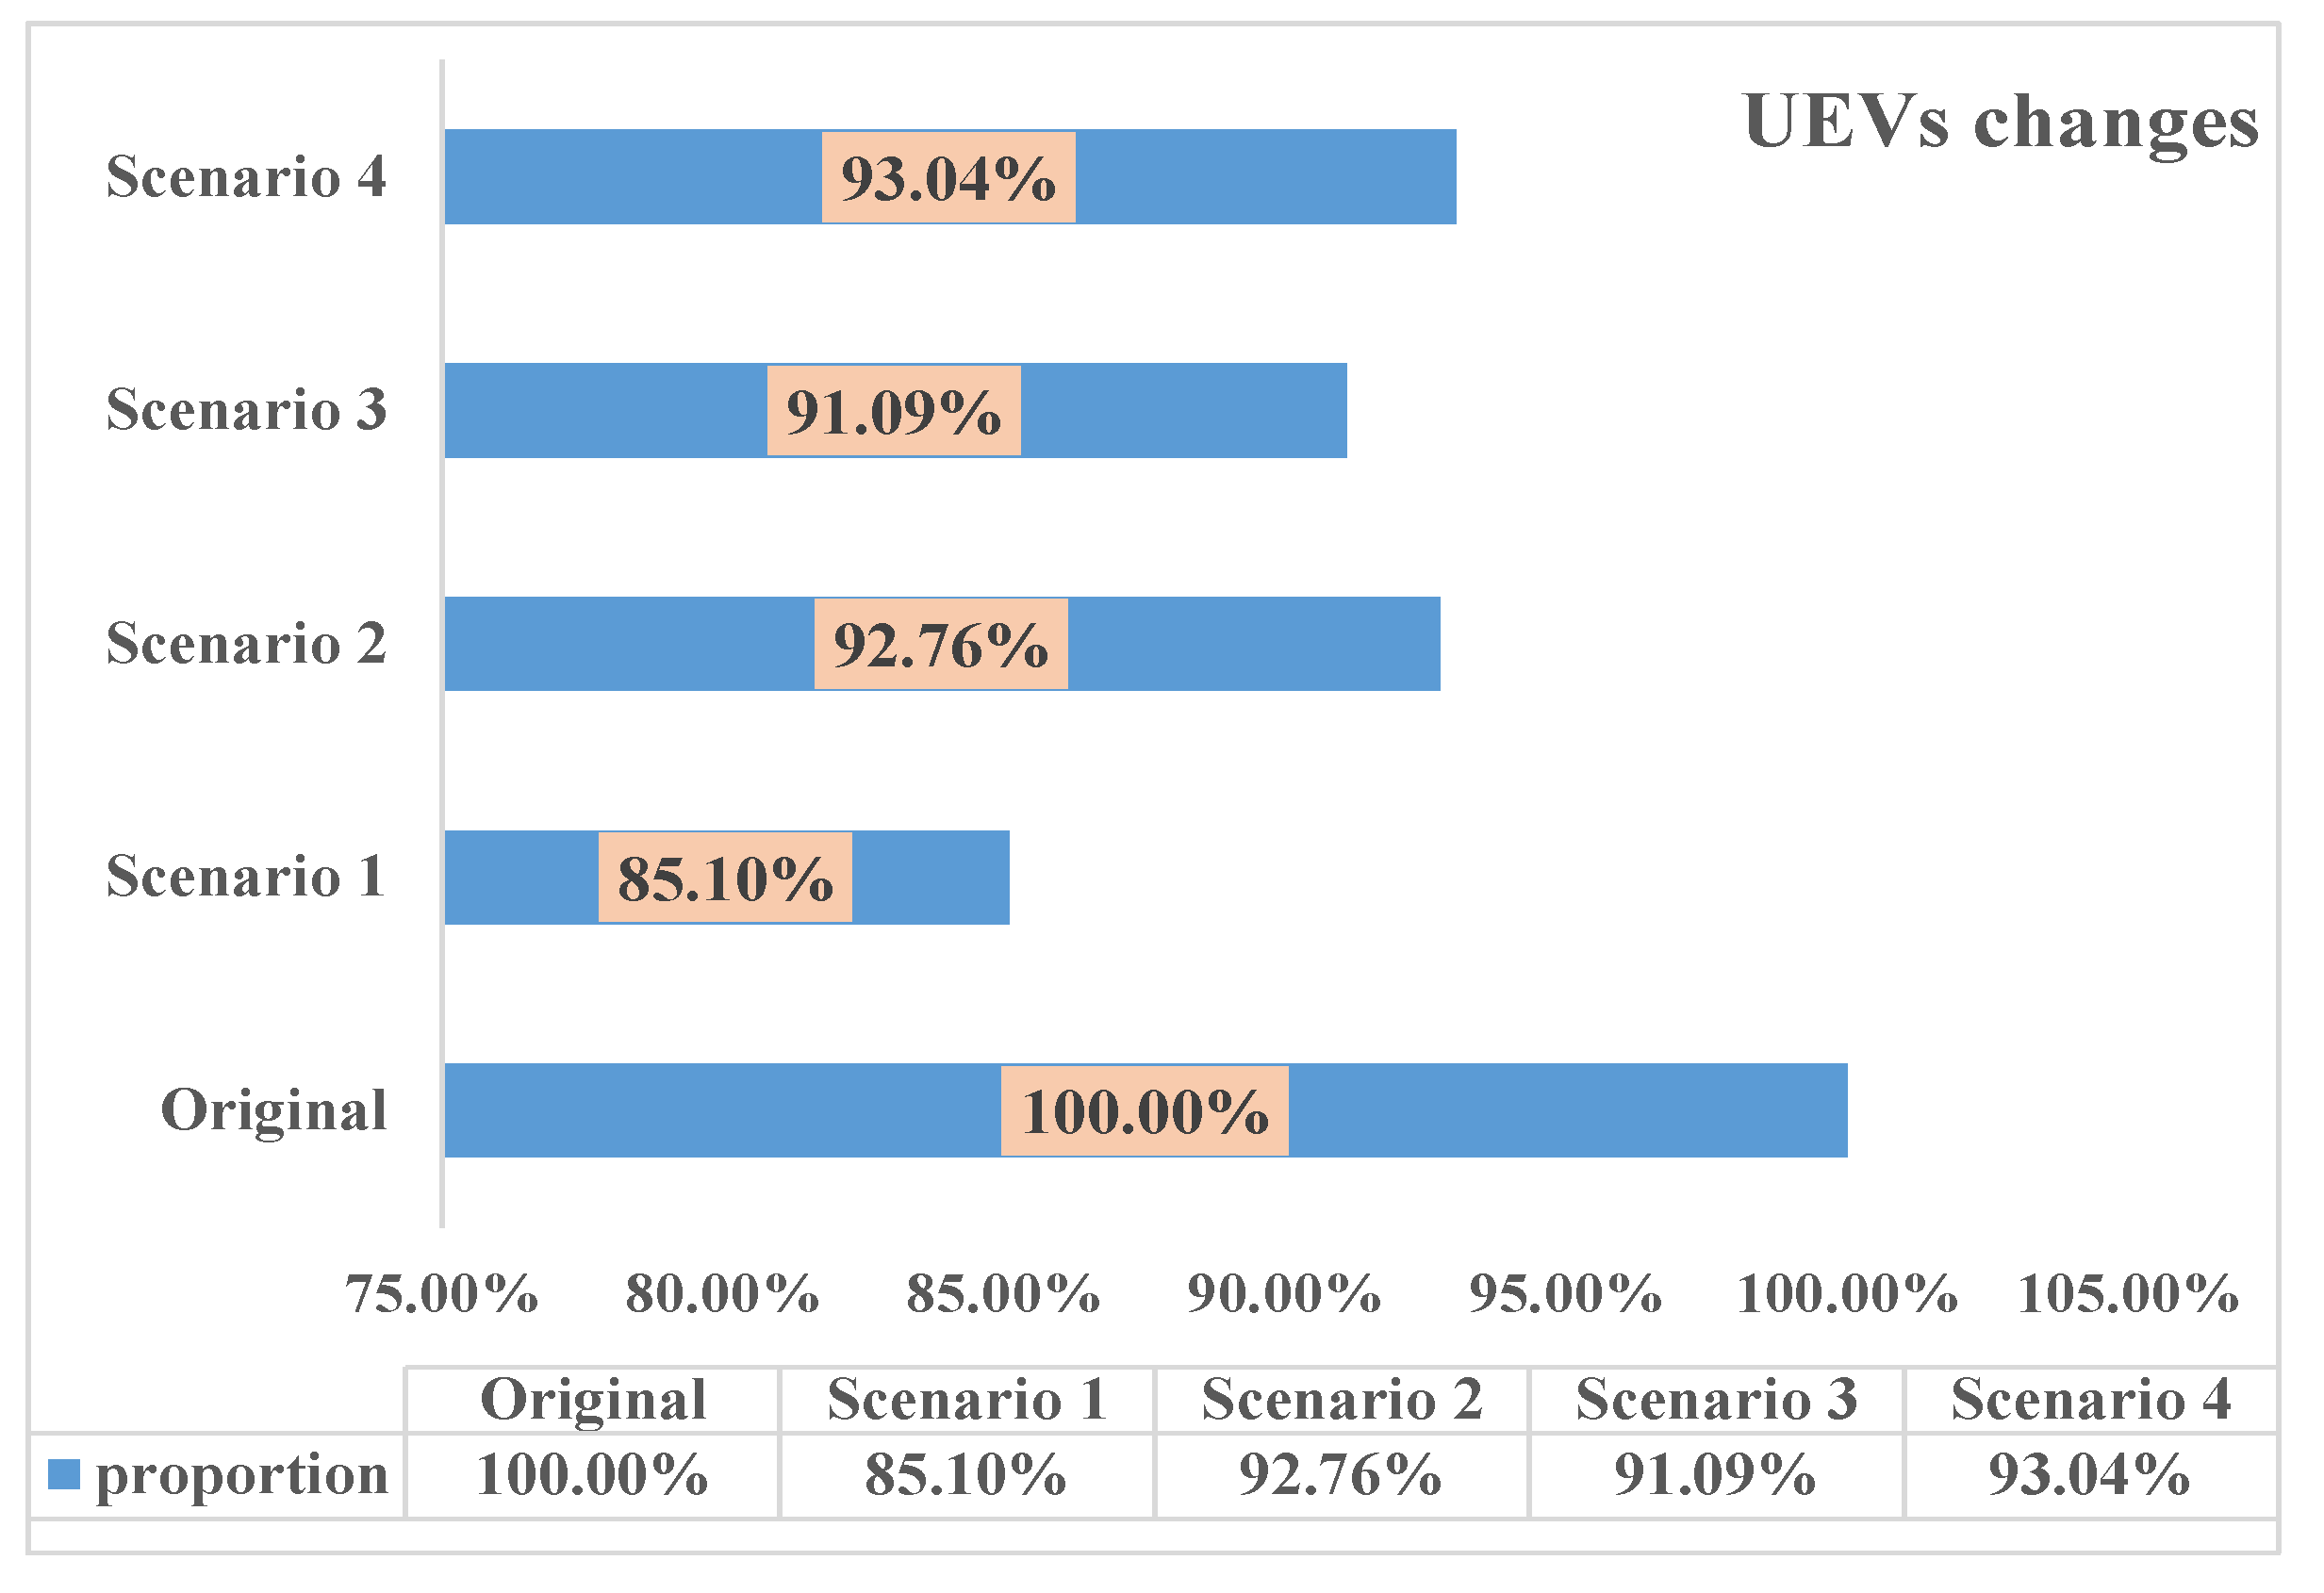
Table 7 reveals the UEVs of a clay brick system on the basis of five scenarios. All calculations were conducted in view of the latest baseline in this paper. Taking the original version as the calculation basis, four new change scenarios are illustrated in Figure 6, which are 85.1% for scenario 1, 92.76% for scenario 2, 91.09% for scenario 3, and 93.04% for scenario 4. The change ranges of clay brick system UEVs are from 6.94% (scenario 4) to 14.9% (scenario 1). Hence, based on four new scenarios from different literature data, single input element UEVs have a significant influence on the accuracy. In order to enhance the accuracy of calculation results, all unit UEVs of input elements should be considered carefully in the calculation.
4. Policy Implications
In light of the studies in this article, three policies are suggested to improve the overall sustainability of clay brick manufacturing in China:
- (1)
- Adjustment of primary energy resources
Unbalanced energy resources are one of the main problems for clay brick manufacturing in China. To date, there are five types of power energy resources in China: thermal power (75.08%), hydroelectric power (13.15%), wind power (6.1%), nuclear power (4.17%), and the other types (1.49%) [53]. In this paper, the main source of electricity is thermal power generation. If 10% of electricity supplied by thermal energy (primarily generated using coal) was replaced by wind power, the environmental load ratio can be reduced by approximately 3.1%. Hence, several renewable energy resources should be carefully considered, including solar power [54], hydropower [55], and wind power [56], which are the most common and important sources of renewable energy in China. However, a few shortcomings restrict the use of these renewable energy resources, particularly those related to huge investment, professional and technical barriers, and geographical conditions, which can be only managed effectively by local governments in China. For instance, necessary financial subsidies and advantageous tax policies needs to be offered so as to strengthen the promotion of clean energy.
- (2)
- Recycling materials
Owing to over dependence on clay in clay brick manufacturing, heavy environmental loading can be observed. Material substitution is currently proving to be effective, especially focusing on industrial waste and by-products. If 10% of clay is replaced by construction material waste while still maintaining strength, as per, the UEVs will be reduced to 3.99 × 10¹² sej/kg; this is a 5.67% reduction from the current UEV calculation. Moreover, the environmental loading ratio will be lowered by 4.1%. Several researchers have attempted material substitution in the brick industry [57,58,59,60]. Munz et al. (2014) reviewed sustainable construction material wastes for the fired clay brick industry and 44 sustainable alternative wastes with an aim to achieve sustainable brick manufacturing [57]. Taking asphalt mix as an added material, Eduardo (2018) carried out a study to design an innovative and new building brick [58]. Armando (2017) made use of construction wastes to bring about the manufacturing of ecological bricks [59]. Mamdooh et al. (2019) used aluminum recycling raw material to manufacture ecological clay bricks [60]. We suggest that China’s clay brick factories should continue to increase the proportion of alternative material applications.
- (3)
- Promotion of energy-saving systems
According to the sustainability assessment of clay brick manufacturing, imported energy is the third largest contributor to the unsustainable state, so it is necessary to take some measures to mitigate the negative effect. In this study, if electricity consumption was reduced by 5%, the factory’s sustainability indicators may be improved by 1.1%. The residual energy reutilization of advanced systems should be deemed as the optimal sustainable approach and be adopted to realize the reduction of imported energy [61,62,63]. Other new energy-saving systems can be given priority for application and promotion, which consist of waste water recovery systems, waste heat recovery systems, cooling recovery systems, kiln top heat exchange and reuse systems, etc.
5. Conclusion
In this paper, emergy analysis was used to assess manufacturing of clay brick in China. The main conclusions are summarized as follows.
- (1)
- Emergy contributors: nonrenewable resources (approximately 50.6%), labor service (approximately 25.9%), and imported energy (approximately 18.1%).
- (2)
- For the nonrenewable resources, clay accounts for 66.1% of local emergy input and 33.5% of the total emergy needed, considered to have paramount status in the evaluated brick plant system.
- (3)
- A series of indicators are 0.01% (renewability rate); 50.6% (nonrenewability rate); 18.3 (emergy yield ratio); 486 (environmental loading ratio); 0.038 (emergy sustainability indicator).
- (4)
- The unit emergy value of the building clay brick plant is 7.18 × 10¹² sej/kg, which is twice the value of other studies conducted primarily in the U.S.
- (5)
- Based on different electricity UEV selections from multiple literature sources, four new scenarios have been considered and calculated in this paper.
- (6)
- The R% proportion has no change. In addition to renewable inputs, other cases have different variations, such as %N (from 18.38% input to 21.69%), EYR (from 18.39% input to 21.7%), ELR (from 18.38% input to 21.69%), and ESI (from 16.83% input to 23.65%).
- (7)
- Given different electricity UEVs, the change ranges of clay brick system UEVs are 14.9% (scenario 1), 7.24% (scenario 2), 8.91% (scenario 3), and 6.94% (scenario 4), which remind us that the different sources of UEV data should be considered and selected fully and carefully.
Several policy suggestions were discussed for improving the sustainability of the evaluated system; they include the energy structure adjustment, recycling material replacement, and promotion of energy-saving systems.
Author Contributions
Conceptualization, J.Z.; methodology, R.S.S. and J.Z.; validation, R.S.S. and C.P.; formal analysis, J.Z.; investigation, J.Z.; resources, J.Z.; data curation, J.Z.; writing—original draft preparation, J.Z.; writing—review and editing, R.S.S.; supervision, R.S.S. and C.P. All authors have read and agreed to the published version of the manuscript.
Funding
The work described in this paper was supported by the Postgraduate Research & Practice Innovation Program of Jiangsu Province (KYCX18_0104) and the Ministry of Science and Technology of the Peoples Republic of China (Key Projects of Technological Innovation for Green Livable Village, Grant No. 2019YFD1100805).
Conflicts of Interest
The authors declare no conflict of interest.
Appendix A
The calculated emergy baseline is 12 × 1024 sej/yr in Table 2.
- Renewable energy calculation:
1-Renewable Energy calculation:
Solar energy calculation: Area of brick plant = 5000 m2; Insolation (Hubei Province, China) = 5.00 × 10⁹~5.85 × 10⁹ J/m2/y [64]; Albedo = 0.30 [64]. Energy = (insolation) × (1 − albedo) × (area) = (5.43 × 10⁹ J/m2/y) × (1 − 0.30) × (5000 m2) = 2.07 × 10⁶ J/y. UEV = 1.00 sej/J by definition. Emergy of one year = 2.07 × 10⁶ J/y × 1 y × 1.00 sej/J = 2.07 × 10⁶ sej.
Rain (geopotential energy) calculation: Area of brick plant = 5000 m2; Rainfall (annual average, n = 5) = 0.68 m/year; Average elevation = 316 m [65]; water density = 1.00 × 10³ kg/m3; Runoff rate = 40.00%. Energy = (area) × (rainfall) × (runoff rate) × (water density) × (average elevation) × (gravity) = (5000 m2) × (0.71 m/y) × (40%) × (1 × 10³ kg/m3) × (316 m) × (9.8 kg/m2) = 6.59 × 10⁹ J/y. UEV = 2.79 × 10⁴ sej/J [37]. Emergy of one year = 6.59 × 10⁹ J/y × 1 y ×2.79 × 104 sej/J =1.84 × 10¹⁴ sej.
Rain (chemical potential energy) calculation: Area of brick plant = 5000 m2; Rainfall (annual average, n = 5) = 0.68 m/year [66]; Water density = 1.00 kg/m3; Evapotranspiration rate = 60%; Gibbs free energy of water = 4.94 × 10³ J/kg. Energy = (area) × (rainfall) × (evapotranspiration rate) × (water density) × (Gibbs free energy of water) = (5000 m2) × (0.71 m/y) × (1 × 10³ kg/m3) × (60%) × (1 × 10³ kg/m3) × (4.94 × 103 J/kg) = 1.05 × 10¹³ J/year. UEV = 2.35 × 10⁴ sej/J [67]. Emergy of one year = 1.05 × 10¹³ J/y × 1 y × 2.35 × 104 sej/J =2.47 × 10¹⁷ sej
Wind energy calculation: Area of brick plant = 5000 m2; Air density = 1.29 kg/m3; Wind velocity (annual average, n=2) = 1.95 m/s [68]; Velocity of geostrophic wind = 3.25 m/s, surface winds are considered as 0.6 of geostrophic wind; Drag coefficient = 1.00 × 10⁻³ [69]. Energy = (area) × (air density) × (drag coefficient) × (velocity of geostrophic wind)3 = (5000 m2) × (1.29 kg/m3) × (1.00 × 10−3) × (3.17 m/s)3 × (3.15 × 107 s/year) = 6.44 × 10⁸ J/y. UEV = 1.90 × 10³ sej/J. Emergy of one year = 6.44 × 10⁸ J/y × 1 y × 1.90 × 103 sej/J = 1.22 × 10¹² sej
Geothermal heat calculation: Area of brick plant = 5000 m2; Heat flow (average) = 3.50 × 10⁻² J/m2/s. Energy = (area) × (heat flow) = (5000 m2) × (3.50 × 10−2 J/m2/s) × (3.15 × 10⁷ s/year) = 5.51 × 10⁹ J/y. UEV = 3.44 × 10⁴ sej/J.Emergy of one year = 5.51 × 10⁹ J/y × 1 y × 3.44 × 104 sej/J = 1.90 × 10¹⁴ sej
- 2.
- Nonrenewable resource emergy
Clay emergy calculation: annual clay consumption = 7.20 × 10⁷ kg.
Shale emergy calculation: annual shale consumption = 1.00 × 10⁷ kg.
- 3.
- Imported resource emergy
Gypsum emergy calculation: annual Gypsum consumption = 6.00 × 10⁶ kg.
Limestone emergy calculation: annual Limestone consumption = 6.00 × 10⁶ kg.
Fly ash emergy calculation: annual fly ash consumption = 5.00 × 10⁵ kg.
water basic data include 50 tons of water reuse every day
- 4.
- Imported energy
Electricity emergy calculation: actual manufacturing line energy consumption = 4.8 × 10⁸ kW·h
- 5.
- Labor and service
Labor and services emergy calculation: annual labor and services cost = 1.50 × 10⁸ yuan
Annual labor and services emergy = 1.5 × 108 × 7.42 × 1011 = 1.11 × 10²⁰ sej
- 6.
- Air pollutant emergy
- (1)
- The economic loss emergy:
- (2)
- The ecological service emergy:
- (3)
- The sum:Dust emergy = 5.04 × 10¹¹ + 1.12 × 1010 = 5.15 × 10¹¹ sejSO2 emergy = 1.83 × 10¹⁰ + 1.35 × 1011 = 1.53× 10¹¹ sejNOx emergy = 7.46 × 10¹⁰ + 4.48 × 1010 = 1.19 × 10¹¹ sej
References
- Jin, P.J.; Zhang, Y.; Wang, S.; Yang, X.; Zhang, M. Characterization of the superficial weathering of bricks on the City Wall of Xi’an, China. Constr. Build. Mater. 2017, 149, 139–148. [Google Scholar] [CrossRef]
- Meng, C.L.; Zhang, H.; Zhang, B.J.; Fang, S.Q. Chemical and Microscopic Study of Masonry Mortar in Ancient Pagodas in East China. Int. J. Archit. Herit. 2015, 9, 942–948. [Google Scholar] [CrossRef]
- Liu, K.; Lin, B. Research on influencing factors of environmental pollution in China: A spatial econometric analysis. J. Clean. Prod. 2019, 206, 356–364. [Google Scholar] [CrossRef]
- Hou, G.; Wang, Y.; Xin, B. A coordinated strategy for sustainable supply chain management with product sustainability, environmental effect and social reputation. J. Clean. Prod. 2019, 228, 1143–1156. [Google Scholar] [CrossRef]
- Raoufi, K.; Addison, K.; Wisthoff, B.; DuPont, L.; Karl, R.H. A questionnaire-based methodology to assist non-experts in selecting sustainable engineering analysis methods and software tools. J. Clean. Prod. 2019, 229, 528–541. [Google Scholar] [CrossRef]
- Hamza, S.; Jamal, A.H.B.M.; Kamin, Y.B.; Al-Rahmi, W.M.; Kosnin, A.; Saud, M.S.; Suhairom, N.; Yahya, N.; Nordin, M.S. Assimilating Green Skills in Building Construction Programme: Crucial to Realizing Environmental Sustainability. IEEE Access 2019, 7, 125214–125224. [Google Scholar] [CrossRef]
- Helfaya, A.; Whittington, M. Does designing environmental sustainability disclosure quality measures make a difference. Bus. Strategy Environ. 2019, 28, 525–541. [Google Scholar] [CrossRef]
- Pulido-Fernandez, J.I.; Cárdenas-García, P.J.; Espinosa-Pulido, J.A. Does environmental sustainability contribute to tourism growth? An analysis at the country level. J. Clean. Prod. 2019, 213, 309–319. [Google Scholar] [CrossRef]
- Djagba, J.F.; Zwart, S.J.; Houssou, C.S.; Tenté, B.H.A.; Kiepe, P. Ecological sustainability and environmental risks of agricultural intensification in inland valleys in Benin. Environ. Dev. Sustain. 2019, 21, 1869–1890. [Google Scholar] [CrossRef]
- Shah, S.A.A.; Shah, P.; Zhou, G.D.; Walasai, M.M. Energy security and environmental sustainability index of South Asian countries: A composite index approach. Ecol. Indicat. 2019, 106, 105507. [Google Scholar] [CrossRef]
- Tao, Y.; Li, F.; Crittenden, J.; Lu, Z.; Ou, W.; Song, Y. Measuring urban environmental sustainability performance in China: A multi-scale comparison among different cities, urban clusters, and geographic regions. Cities 2019, 94, 200–210. [Google Scholar] [CrossRef]
- Bui, N.T.; Kawamura, A.; Bui, D.D.; Amaguchi, H.; Bui, D.D.; Truong, N.T.; Do, H.H.T.; Nguyen, C.T. Groundwater sustainability assessment framework: A demonstration of environmental sustainability index for Hanoi, Vietnam. J. Environ. Manag. 2019, 241, 479–487. [Google Scholar] [CrossRef] [PubMed]
- Liu, Z.; Ding, M.; He, C.; Li, J.; Wu, J. The impairment of environmental sustainability due to rapid urbanization in the dryland region of northern China. Landsc. Urban Plan. 2019, 187, 165–180. [Google Scholar] [CrossRef]
- Levy, B.L.; Marans, R.W. Towards a campus culture of environmental sustainability. Int. J. Sustain. High. Edu. 2012, 13, 4. [Google Scholar] [CrossRef]
- Wang, W.; Jiang, D.; Chen, D.; Chen, Z.; Zhou, W.; Zhu, B. A Material Flow Analysis (MFA)-based potential analysis of eco-efficiency indicators of China’s cement and cement-based materials industry. J. Clean. Prod. 2016, 112, 787–796. [Google Scholar] [CrossRef]
- Wen, Z.; Chen, M.; Meng, F. Evaluation of energy saving potential in China’s cement industry using the Asian-Pacific Integrated Model and the technology promotion policy analysis. Energy Policy 2015, 77, 227–237. [Google Scholar] [CrossRef]
- Li, J.; Tharakan, P.; Macdonald, D.; Liang, X. Technological, economic and financial prospects of carbon dioxide capture in the cement industry. Energy Policy 2013, 61, 1377–1387. [Google Scholar] [CrossRef]
- Chen, W.; Hong, J.; Xu, C. Pollutants generated by cement production in China, their impacts, and the potential for environmental improvement. J. Clean. Prod. 2015, 103, 61–69. [Google Scholar] [CrossRef]
- Limami, H.; Manssouri, I.; Cherkaoui, K.; Khaldoun, A. Study of the suitability of unfired clay bricks with polymeric HDPE & PET wastes additives as a construction material. J. Build Eng. 2020, 27, 100956. [Google Scholar]
- An, J.; Li, Y.; Richard, S.M. Reducing energy consumption and carbon emissions of magnesia refractory products: A life-cycle perspective. J. Clean. Prod. 2018, 182, 363–371. [Google Scholar] [CrossRef]
- Huang, T.Y.; Chiueh, P.T.; Lo, S.L. Life-cycle environmental and cost impacts of reusing fly ash. Resour. Conserv. Recycl. 2017, 123, 255–260. [Google Scholar] [CrossRef]
- Reza, B.; Soltani, A.; Ruparathna, R.; Sadiq, R.; Hewage, K. Environmental and economic aspects of production and utilization of RDF as alternative fuel in cement plants: A case study of MetroVancouver Waste Management. Resour. Conserv. Recycl. 2013, 81, 105–114. [Google Scholar] [CrossRef]
- Odum, H.T. Environmental Accounting: Emergy and Environmental Decision Making; John Wiley and Sons: New York, NY, USA, 1996. [Google Scholar]
- Qi, Y.; Zhang, X.; Yang, X.; Lv, Y.; Wu, J.; Lin, L.; Xiao, Y.; Qi, H.; Yu, X.; Zhang, Y. The environmental sustainability evaluation of an urban tap water treatment plant based on emergy. Ecol. Indic. 2018, 94, 28–38. [Google Scholar] [CrossRef]
- Zhou, J.B.; Jiang, M.M.; Chen, B. Emergy evaluations for constructed wetland and conventional wastewater treatment. Commun. Nonlinear Sci. Numer. Simul. 2009, 14, 1781–1789. [Google Scholar] [CrossRef]
- Campbell, D.E. Emergy analysis of human carrying capacity and regional sustainability: An example using the State of Maine. Environ. Monit. Assess. 1998, 51, 531–569. [Google Scholar] [CrossRef]
- Odum, H.T. Handbook of emergy Evaluation (Folio #2): Emergy of Global Processes. Center for Environmental Policy Environmental Engineering Sciences; University of Florida: Gainesville, FL, USA, 2000; Volume 32622–36450, pp. 17–18. [Google Scholar]
- Mark, T.; Brown, S.U. Updated evaluation of exergy and emergy driving the geobiosphere: A review and refinement of the emergy baseline. Ecol. Model. 2010, 221, 2501–2508. [Google Scholar]
- Brown, M.T.; Ulgiati, S. Assessing the global environmental sources driving the geobiosphere: A revised emergy baseline. Ecol. Model. 2016, 339, 126–132. [Google Scholar] [CrossRef] [Green Version]
- Zhang, J.; Srinivasan, R.S.; Peng, C. A Systematic Approach to Calculate Unit Emergy Values of Cement Manufacturing in China Using Consumption Quota of Dry and Wet Raw Materials. Buildings 2020, 10, 128. [Google Scholar]
- Cao, C.; Feng, X. Distribution of emergy indices and its application. Energ. Fuels 2007, 21, 1717–1723. [Google Scholar] [CrossRef]
- China Standard Brick Industry Report. 2015. Available online: http://www.chyxx.com/research/201504/309618.html (accessed on 20 September 2020).
- GB/T 5101-2003. Fired common brick. Available online: http://www.doc88.com/p-173806715246.html (accessed on 20 September 2020).
- Xu, G.Z. The analysis of sintering process of grey bricks and tile (in Chinese). Brick Tile 2006, 5, 34–35. [Google Scholar]
- GB3095-2012. Ambient Air Quality Standards. Available online: https://www.doc88.com/p-3867369563075.html (accessed on 20 September 2020).
- Bhavik, R.B. A thermodynamic framework for ecologically conscious process systems engineering. Comp. Chem. Eng. 2002, 26, 269–282. [Google Scholar]
- Brown, M.T.; Bardi, E. Handbook of emergy evaluation: A compendium of data for emergy computation in a series of folios, Folio. In #3. Center for Environmental Policy; University of Florida: Gainesville, FL, USA, 2001. [Google Scholar]
- Brown, M.T.; Buranakarn, V. Emergy indices and ratios for sustainable material cycles and recycle options. Resour. Conserv. Recycl. 2003, 38, 1–22. [Google Scholar] [CrossRef]
- Brown, M.T.; Raugei, M.; Ulgiati, S. On boundaries and ‘investments’in emergy synthesis and LCA: A case study on thermal vs. photovoltaic electricity. Ecol. Indic. 2012, 15, 227–235. [Google Scholar] [CrossRef]
- Lou, B.; Ulgiati, S. Identifying the environmental support and constraints to the Chinese economic growthdan application of the emergy accounting method. Energy Policy 2013, 55, 217–233. [Google Scholar] [CrossRef]
- Bing, W.; Soon, G.Q.Y.; Chong, T.H. Recycling rainwater by submerged gravity-driven membrane (GDM) reactors: Effect of hydraulic retention time and periodic backwash. Sci. Total Environ. 2019, 654, 10–18. [Google Scholar]
- Capocelli, M.; Prisciandaro, V.; Piemonte, D.B. A technical-economical approach to promote the water treatment & reuse processes. J. Clean. Prod. 2019, 207, 85–96. [Google Scholar]
- Prieto, D.; Swinnen, N.; Blanco, L.; Hermosilla, D.; Cauwenberg, P.; Blanco, Á.; Negro, C. Drivers and economic aspects for the implementation of advanced wastewater treatment and water reuse in a PVC plant. Water Resour. Ind. 2016, 14, 26–30. [Google Scholar] [CrossRef] [Green Version]
- Pokhara, P.; Aravinth, S.S.; Ekamparam, A.; Gupta, D.C.; Rai, A.S. Activated alumina sludge as partial substitute for fine aggregates in brick making. Construct. Build. Mater. 2019, 221, 244–252. [Google Scholar] [CrossRef]
- Sutcu, M.; Erdogmus, E.; Gencel, O.; Gholampour, A.; Atan, E.; Ozbakkaloglu, T. Recycling of bottom ash and fly ash wastes in eco-friendly clay brick Production. J. Clean. Prod. 2019, 233, 753–764. [Google Scholar] [CrossRef]
- Buranakarn, V. Evaluation of Recycling and Reuse of Building Materials Using the Emergy Analysis Method. Ph.D. Dissertation, Department of Architecture, University of Florida, Gainesville, FL, USA, 1998; p. 257. [Google Scholar]
- Hwang, Y.; Ravi, S.; Srinivasan, W.; Braham, W. An integrated energyeemergy approach to building form optimization: Use of EnergyPlus, emergy analysis and Taguchi-regression method. Build. Environ. 2015, 84, 89–104. [Google Scholar]
- Pulselli, R.M.; Simoncini, F.M.; Pulselli, S.B. Emergy analysis of building manufacturing, maintenance and use: Em-building indices to evaluate housing sustainability. Energy Build. 2007, 39, 620–628. [Google Scholar] [CrossRef]
- Pan, H.; Zhang, X.; Wu, J.; Zhang, Y.; Lin, L.; Yang, G.; Deng, S.; Li, L.; Yu, X.; Qi, H.; et al. Sustainability evaluation of a steel production system in China based on emergy. J. Clean. Prod. 2016, 112, 1498–1509. [Google Scholar] [CrossRef]
- Peng, W.; Wang, X.; Li, X.; He, C. Sustainability Evaluation Based on the Emergy Ecological Footprint Method: A Case Study of Qingdao, China, from 2004 to 2014. Ecol. Indic. 2018, 85, 1249–1261. [Google Scholar] [CrossRef]
- Yang, Q.; Liu, G.; Hao, Y.; Coscieme, L.; Zhang, J.; Jiang, N.; Casazza, M.; Giannetti, B.F. Quantitative analysis of the dynamic changes of ecological security in the provinces of China through emergy-ecological footprint hybrid indicators. J. Clean. Prod. 2018, 184, 678–695. [Google Scholar] [CrossRef]
- Liu, C.; Cai, W.; Dinolov, O.; Zhang, C.; Rao, W.; Jia, S.; Li, L.; Chan, F.T.S. Emergy based sustainability evaluation of remanufacturing machining Systems. Energy 2018, 150, 670–680. [Google Scholar] [CrossRef]
- China Power Analysis Report in 2018. Available online: http://www.cec.org.cn/yaowenkuaidi/2018-06-14/181765.html (accessed on 20 September 2020).
- Peronato, P.; Rastogi, E.; Rey, M.; Andersen, G. A toolkit for multi-scale mapping of the solar energy-generation potential of buildings in urban environments under uncertainty. Sol. Energy 2018, 173, 861–874. [Google Scholar] [CrossRef] [Green Version]
- Tang, S.; Chen, J.; Sun, P.; Li, Y.; Yu, P.; Chen, E. Current and future hydropower development in Southeast Asia countries (Malaysia, Indonesia, Thailand and Myanmar). Energy Policy 2019, 129, 239–249. [Google Scholar] [CrossRef]
- Wang, Y.; Zhao, M.; Chang, J.; Wang, X.; Tian, Y. Study on the combined operation of a hydro-thermal-wind hybrid power system based on hydro-wind power compensating principles. Energy Convers. Manag. 2019, 194, 94–111. [Google Scholar] [CrossRef]
- Munz Velasco, P.; Morales Ortíz, M.P.; Mendívil Giró, M.A.; Munz Velasco, L. Fired clay bricks manufactured by adding wastes as sustainable construction material—A review. Construct. Build. Mater. 2014, 63, 97–107. [Google Scholar] [CrossRef]
- Bonet-Martínez, E.; Pérez-Villarejo, L.; Eliche-Quesada, D.; Castro, E. Manufacture of Sustainable Clay Bricks Using Waste from Secondary Aluminum Recycling as Raw Material. Materials 2018, 11, 2439. [Google Scholar] [CrossRef] [PubMed] [Green Version]
- Aguilar-Penagos, A.; Gómez-Soberón, J.M.; Rojas-Valencia, M.N. Physicochemical, Mineralogical and Microscopic Evaluation of Sustainable Bricks Manufactured with Construction Wastes. Appl. Sci. 2017, 7, 1012. [Google Scholar] [CrossRef] [Green Version]
- Alwetaishi, M.; Kamel, M.; Al-Bustami, n. Sustainable applications of asphalt mixes with reclaimed asphalt pavement (RAP) materials: Innovative and new building brick. Int. J. Low Carbon Technol. 2019, 14, 364–374. [Google Scholar] [CrossRef] [Green Version]
- Afroza Nahar, M.; Hasanuzzaman, N.A.; Rahim, S.P. Numerical investigation on the effect of different parameters in enhancing heat transfer performance of photovoltaic thermal systems. Renew. Energy 2019, 132, 284–295. [Google Scholar] [CrossRef]
- Arabhosseini, A.; Samimi-Akhijahani, H.; Motahayyer, M. Increasing the energy and exergy efficiencies of a collector using porous and recycling system. Renew. Energy 2019, 132, 308–325. [Google Scholar] [CrossRef]
- Wanjiru, E.; Xia, X. Optimal energy-water management in urban residential buildings through grey water recycling. Sustain. Cities Soc. 2017, 32, 654–668. [Google Scholar] [CrossRef] [Green Version]
- Lu, Y.M.; Yue, T.X.; Chen, C.F.; Fan, Z.M.; Wang, Q.M. Solar radiation modeling based on stepwise regression analysis in China. J. Remote Sens. 2010, 14, 852–864. [Google Scholar]
- Wu, M.Q.; Zhang, A.D.; Kan, Z.Q.; Sun, X.B.; Lin, X. Land surface temperature retrieved using MODIS data in Shandong Province. In Proceedings of the 2013 21st International Conference on Geoinformatics, San Francisco, CA, USA, 20–22 June 2013. [Google Scholar]
- Hebei Provincial Bureau of Statistics, 2012–2016. Available online: http://tjj.hebei.gov.cn/hetj/tjsj/jjnj/ (accessed on 20 September 2020).
- Lee, J.M.; William, B.W. Building emergy analysis of Manhattan: Density parameters forhigh-density and high-rise developments. Ecol. Model. 2017, 363, 157–171. [Google Scholar] [CrossRef]
- CMA of Surface Winds Geostrophic, China Meteorological Administration. 2015. Available online: http://www.cma.gov.cn/2011qxfw/2011qtqyb/ (accessed on 20 September 2020).
- Miller, B.I. A study of the filling of hurricane Donna over land (2000). Mon. Weather Rev. 1964, 92, 389–406. [Google Scholar] [CrossRef] [Green Version]
Figure 1.
Core processes of clay brick manufacturing in China.

Figure 2.
Emergy diagram of clay brick manufacturing.

Figure 3.
Four scenarios used for sensitivity analysis of emergy yield ratio (EYR).

Figure 4.
Four scenarios for sensitivity analysis of environmental loading ratio (ELR).

Figure 5.
Sustainable indicator comparison of four scenarios.

Figure 6.
UEV changes of clay brick system within different electricity UEV scenarios.


Table 1.
Disability-adjusted life year (DALY) data of air pollutant emissions in this paper (Yan et al., 2018).
Table 1.
Disability-adjusted life year (DALY) data of air pollutant emissions in this paper (Yan et al., 2018).
| Element | Damage Impact | DALYs (a/Kg of Emissions) |
|---|---|---|
| Dust | Respiratory | 5.46 × 10⁻⁵ |
| SO2 | Respiratory | 8.87 × 10⁻⁵ |
| NOx | Respiratory | 3.75 × 10⁻⁴ |
Table 2.
Emergy calculation of clay brick manufacturing (refer to Appendix A for detailed calculations).
Table 2.
Emergy calculation of clay brick manufacturing (refer to Appendix A for detailed calculations).
| No. | Item | Unit | Amount | Ref. for Data | UEVs (sej/unit) | Emergy (sej/year) | Ref. for UEVs | % |
|---|---|---|---|---|---|---|---|---|
| 1. Renewable resources | 0.01 | |||||||
| Sunlight | 2.1 × 10⁶ J/y | Calculated | 1 | 2.07 × 10⁶ | [37] | 0.00 | ||
| Rain (chemical energy) | 1.1× 10¹³ J/y | Calculated | 2.35 × 10⁴ | 2.47 × 10¹⁷ | [37] | 0.01 | ||
| Rain (geopotential) | 6.6 × 10⁹ J/y | Calculated | 2.79 × 10⁴ | 1.84 × 10¹⁴ | [37] | 0.00 | ||
| Wind (kinetic energy) | 6.44 × 10⁸ J/y | Calculated | 1.9 × 10³ | 1.22 × 10¹² | [37] | 0.00 | ||
| Geothermal heat | 5.5 × 10⁸ J/y | Calculated | 3.44 × 10⁴ | 1.9 × 10¹⁴ | [37] | 0.00 | ||
| 2. Nonrenewable resources | 50.6 | |||||||
| Clay | 7.2 × 10⁷ kg | Collected | 2 × 10¹² | 1.44 × 10²⁰ | [38] | 33.5 | ||
| Shale | 3 × 10⁷ kg | Collected | 2.46 × 10¹² | 7.38 × 10¹⁹ | [38] | 17.1 | ||
| 3. Imported resources | 5.18 | |||||||
| Gypsum | 6 × 10⁶ kg | Collected | 1.27 × 10¹² | 7.62 × 10¹⁸ | [38] | 1.77 | ||
| Limestone | 6 × 10⁶ kg | Collected | 1.27 × 10¹² | 7.62 × 10¹⁸ | [38] | 1.77 | ||
| Fly ash | 5 × 10⁵ kg | Collected | 1.4 × 10¹³ | 7 × 10¹⁸ | [39] | 1.63 | ||
| Water | 2.63 × 10⁷ kg | Collected | 1.26 × 10⁹ | 3.31 × 10¹⁶ | [39] | 0.01 | ||
| 4. Imported energy | 18.1 | |||||||
| Electricity | 1.73 × 10¹⁴ J | Collected | 4.5 × 10⁵ | 7.79 × 10¹⁹ | [39] | 18.1 | ||
| 5. Labor and service | 25.9 | |||||||
| Labor and service | 1.5 × 10⁸ ¥ | Collected | 7.42 × 10¹¹ | 1.11 × 10²⁰ | [40] | 25.9 | ||
| 6. Emissions | 0.00 | |||||||
| Air pollutants | Dust | 80 mg/m3 | [35] | ~ | 5.15 × 10¹¹ | See note 6 | 0.00 | |
| SO2 | 20 mg/m3 | [35] | ~ | 1.53 × 10¹¹ | See note 6 | 0.00 | ||
| NOx | 50 mg/m3 | [35] | ~ | 1.19 × 10¹¹ | See note 6 | 0.00 | ||
| UEV | 7.18 × 10¹² sej/kg | 100 | ||||||
Table 3.
Emergy sustainable indexes of brick product.
| Note | Items | Index | Results |
|---|---|---|---|
| 1 | Renewability rate | %R | 0.01% |
| 2 | Nonrenewability rate | %N | 50.6% |
| 3 | Emergy yield ratio | EYR | 18.3 |
| 4 | Environmental loading ratio | ELR | 486 |
| 5 | Emergy sustainability index | ESI | 0.038 |
Table 4.
Unit emergy values (UEVs) for clay brick.
| Author | UEVs (sej/kg) | Baseline (sej/year) | Region |
|---|---|---|---|
| Buranakarn [46] | 2.03 × 10¹² | 9.44 × 1024 | USA |
| Hwang Yi et al. [47] | 3.33 × 10¹² | 9.44 × 1024 | USA |
| R.M. Pulselli et al. [48] | 3.68 × 10¹² | 9.44 × 1024 | Italy |
| This study, 2020 | 7.18 × 10¹² | 12.0 × 1024 | China |
| Item | UEVs | Unit | Country | Year | Ref. |
|---|---|---|---|---|---|
| Scenario 1 | 8.00 × 10⁴ | sej/j | China | 2016 | [49] |
| Scenario 2 | 2.68 × 10⁵ | sej/j | China | 2018 | [50] |
| Scenario 3 | 2.31 × 10⁵ | sej/j | China | 2018 | [51] |
| Scenario 4 | 2.78 × 10⁵ | sej/j | China | 2016 | [52] |
Table 6.
Emergy sustainable indexes of four new scenarios.
| Note | Items | Original | Scenario 1 | Scenario 2 | Scenario 3 | Scenario 4 |
|---|---|---|---|---|---|---|
| 1 | Renewability rate | 0.01% | 0.01% | 0.01% | 0.01% | 0.01% |
| 2 | Nonrenewability rate | 50.6% | 59.7% | 54.7% | 55.7% | 54.6% |
| 3 | Emergy yield ratio | 18.3 | 15.511 | 16.928 | 16.624 | 16.959 |
| 4 | Environmental loading ratio | 486 | 573.403 | 525.379 | 534.984 | 524.419 |
| 5 | Emergy sustainability index | 0.038 | 0.02705 | 0.03222 | 0.03107 | 0.03234 |
Table 7.
UEVs of clay brick based on four new scenarios.
| Item | UEVs (sej/kg) | Baseline (sej/year) | Region |
|---|---|---|---|
| Original | 7.18 × 10¹² | 12.0 × 1024 | China |
| Scenario 1 | 6.11 × 10¹² | 12.0 × 1024 | China |
| Scenario 2 | 6.66 × 10¹² | 12.0 × 1024 | China |
| Scenario 3 | 6.54 × 10¹² | 12.0 × 1024 | China |
| Scenario 4 | 6.68 × 10¹² | 12.0 × 1024 | China |
Publisher’s Note: MDPI stays neutral with regard to jurisdictional claims in published maps and institutional affiliations. |
© 2020 by the authors. Licensee MDPI, Basel, Switzerland. This article is an open access article distributed under the terms and conditions of the Creative Commons Attribution (CC BY) license (http://creativecommons.org/licenses/by/4.0/).
Share and Cite
MDPI and ACS Style
Zhang, J.; S. Srinivasan, R.; Peng, C. Ecological Assessment of Clay Brick Manufacturing in China Using Emergy Analysis. Buildings 2020, 10, 190. https://0-doi-org.brum.beds.ac.uk/10.3390/buildings10110190
AMA Style
Zhang J, S. Srinivasan R, Peng C. Ecological Assessment of Clay Brick Manufacturing in China Using Emergy Analysis. Buildings. 2020; 10(11):190. https://0-doi-org.brum.beds.ac.uk/10.3390/buildings10110190
Chicago/Turabian StyleZhang, Junxue, Ravi S. Srinivasan, and Changhai Peng. 2020. "Ecological Assessment of Clay Brick Manufacturing in China Using Emergy Analysis" Buildings 10, no. 11: 190. https://0-doi-org.brum.beds.ac.uk/10.3390/buildings10110190
Note that from the first issue of 2016, this journal uses article numbers instead of page numbers. See further details here.