
Improving the IAQ for Learning Efficiency with Indoor Plants in University Classrooms in Ajman, United Arab Emirates


Department of Architecture, College of Architecture, Art and Design, Ajman University, Ajman P.O. Box 346, United Arab Emirates
*
Author to whom correspondence should be addressed.
Buildings 2021, 11(7), 289; https://0-doi-org.brum.beds.ac.uk/10.3390/buildings11070289
Submission received: 19 May 2021
/
Revised: 13 June 2021
/
Accepted: 26 June 2021
/
Published: 4 July 2021
(This article belongs to the Special Issue Emerging Methodologies and Technologies for Assessing the Impact of Air Quality and Thermal, Visual, and Acoustic Comfort on Indoor Environmental Quality)
Abstract
:The objective of this paper is to investigate the effect of improving indoor air quality with indoor plants. As a methodology, two target classrooms with the same size (120.64 m2) and 32 students per room were selected. Then, 48 areca palm pots (average leaf area of 300 cm2/pot) were placed, and the plant density was 14.68% of the floor area. Subjective assessment for general questions, learning motivation, perceived air quality, and SBS symptoms was conducted at 5 min after the class started and 5 min before the class ended. The results showed that the CO2 concentration by respiration of the students (average of 1873 ppm) exceeded the regulatory standard (1000 ppm), but the students did not recognize the indoor CO2 concentration. The increase in CO2 concentration in the classroom was lower in the case with plant placement (624 ppm) compared with the case without plant placement (about 1205 ppm). It was statistically proven that the CO2 concentration by respiration could be reduced by 50% if the indoor plant leaf area density were maintained at about 14.68% of the floor area. In the case with plant placement, the students perceived the indoor air quality to be 40% fresher and showed a 140% higher acceptability. Moreover, the complaining of SBS symptoms was improved by 108%, and the students’ perception that it was better to focus on learning increased by about 120%. As the awareness of sustainability increases, indoor plants will be more actively placed in the United Arab Emirates. Indoor plants not only provide a visual green effect to improve human comfort but also purify indoor air pollutants.
1. Introduction
The residents in United Arab Emirates spend 90% of their time indoors due to sweltering summers and no clear demarcation between different seasons [1,2,3]. This natural environment is leading the UAE toward sick building syndrome (SBS) faster than any other country [4]. An environment with poor indoor air quality deteriorates not only the health of the occupants but also their work and learning efficiency [5,6,7]. As these research results are continuously raised, the degree of awareness of indoor air quality is increasing [8,9]. According to the results of previous studies, when the ventilation volume increases from 3 ℓ/s to 30 ℓ/s, the work efficiency (integrated evaluation of typing and correction) improves by 1.7% on average [10,11]. When the ventilation volume increases from 5 ℓ/s to 21 ℓ/s, work efficiency (typing: 5.3%; calculation: 4.2%; vocabulary: 9.1%) improves [12,13]. This increases productivity profits by 5.3% [14,15]. It is also suggested that if the ventilation volume in elementary school classrooms (range: 0.9–7.1 ℓ/s) increases by 1 ℓ/s, achievements in math (2.9%) and reading (2.7%) can be expected to improve [16,17]. In particular, university classrooms require a high level of learning efficiency, so efforts to improve indoor air quality that can provide high learning efficiency are required [18,19,20]. However, mechanical ventilation to improve indoor air quality requires additional energy consumption [21,22]. In most cases, indoor air quality and thermal comfort, which are the main factors that determine indoor environmental quality, conflict in terms of energy conservation [23,24].
As an alternative, interest in the use of indoor plants has been increasing to assist air conditioners [25,26,27]. Various foliage plants, known as indoor air purification plants, reduce CO2 concentrations of 25.90–378.3 ppm per 1 h from a 100 cm2 leaf area, but these are mainly laboratory results [28,29]. The air quality improvement effect of indoor plants is constantly changing because pollutants in actual space do not maintain a constant concentration [30,31]. On the other hand, because there is a difference between the minimum detected concentration of the human body and the exposure reference concentration of indoor air pollutants, occupants are not properly aware of this, even though they are exposed to dangerous levels of indoor air quality [32,33,34]. Therefore, in this study, plants are arranged for an Ajman University classroom in the United Arab Emirates, and the effect of improving the indoor air quality is comprehensively investigated. By measuring the concentration of indoor air pollutants, subjective factors such as the perceived air quality (PAQ) and sick building syndrome (SBS) as well as work productivity (e.g., learning concentration) are evaluated simultaneously.
2. Literature Review
Deterioration in indoor air quality lowers human comfort, health, job satisfaction, and work efficiency, and it eventually affects productivity [35,36,37]. It causes economic impact not only on individuals but eventually on the whole society [38]. Since the 1995, the Technical University of Denmark (DTU)’s International Center for Indoor Environment and Energy (ICIEE) has been proving that indoor air quality can negatively affect one’s comfort and health as well as reduce productivity [39]. Satish et al. (2012) also studied the effect of CO2 on human performance based on its economic importance, and confirmed that increased levels of CO2 affect decision-making performance [40]. As part of these efforts, research on the indoor air quality improvement effect of plants began at National Aeronautics and Space Administration (NASA) in the 1980s [41,42]. According to existing research, indoor plants purify not only carbon dioxide (CO2), which is the main material for photosynthesis and thus survival, but also volatile organic compounds (VOCs) such as benzene (C12H18O), ethylbenzene (C8H10), xylene ((CH3)2C6H4), toluene (C7H8), trichlorethylene (C2HCl3), and formaldehyde (CH2O) [43,44,45,46]. It also purifies gaseous pollutants like carbon monoxide (CO), nitrogen dioxide (NO2), and sulfur dioxide (SO2) [47].
Research on the effect of indoor plants is mainly being carried out in the horticultural field as a way to activate plant use [48]. However, as interest in sustainable design architecture has recently increased, there is a lot of interest in the application of indoor plants in buildings [49,50,51]. This is because the use of plants as a method for improving indoor air quality not only improves indoor air quality, but it also improves human psychological and physiological comfort through the visual comforting effect of greenery [52,53,54]. Lee et al. (2015), Ikei et al. (2014), and Qin et al. (2014) studied the effect of reducing the stress of natural landscapes or indoor plants in a stressed state through measuring and subjective evaluation of the physiological response of the human body. These works suggested that seeing natural scenery or plants after receiving stress decreases the level of stress rapidly and relieves pain [55,56,57]. As a result of a study on the effect of plant-specific impression evaluation on the psychology of residents, Park et al. (2016) suggested that the presence of plants produces more open, stable, dynamic, and bright feelings [58]. Aydogan and Cerone (2021) also studied the effect of plant-specific visual perception on the mental physiology of residents and suggested that the presence of plants shows psychological stability compared with those without ones [43]. As such, plants are thought to have the effect of not only improving indoor air quality, but also improving stress coping by maintaining the psychological and physiological stability of the occupants [59,60]. The exact cause and mechanism for this has not yet been identified, but it is clear that the psychological stability of the occupants thanks to plants will eventually lead to improved work efficiency.
3. Methodology
In order to find out the effect of improving the indoor air quality with indoor plants, the following experiments were conducted. First, during February 2020, two classrooms in the J2 Building at Ajman University were selected as the subjects, and the same experiment was performed in each classroom. During each lecture period (from 2:00 p.m. to 5:00 p.m.), absent (without plants) and present (with plant) trials were performed. The concentration of air pollutants in the classroom and the subjective evaluation of the occupants were simultaneously performed and analyzed.
3.1. Target Classroom, Indoor Plants, and Pollutants
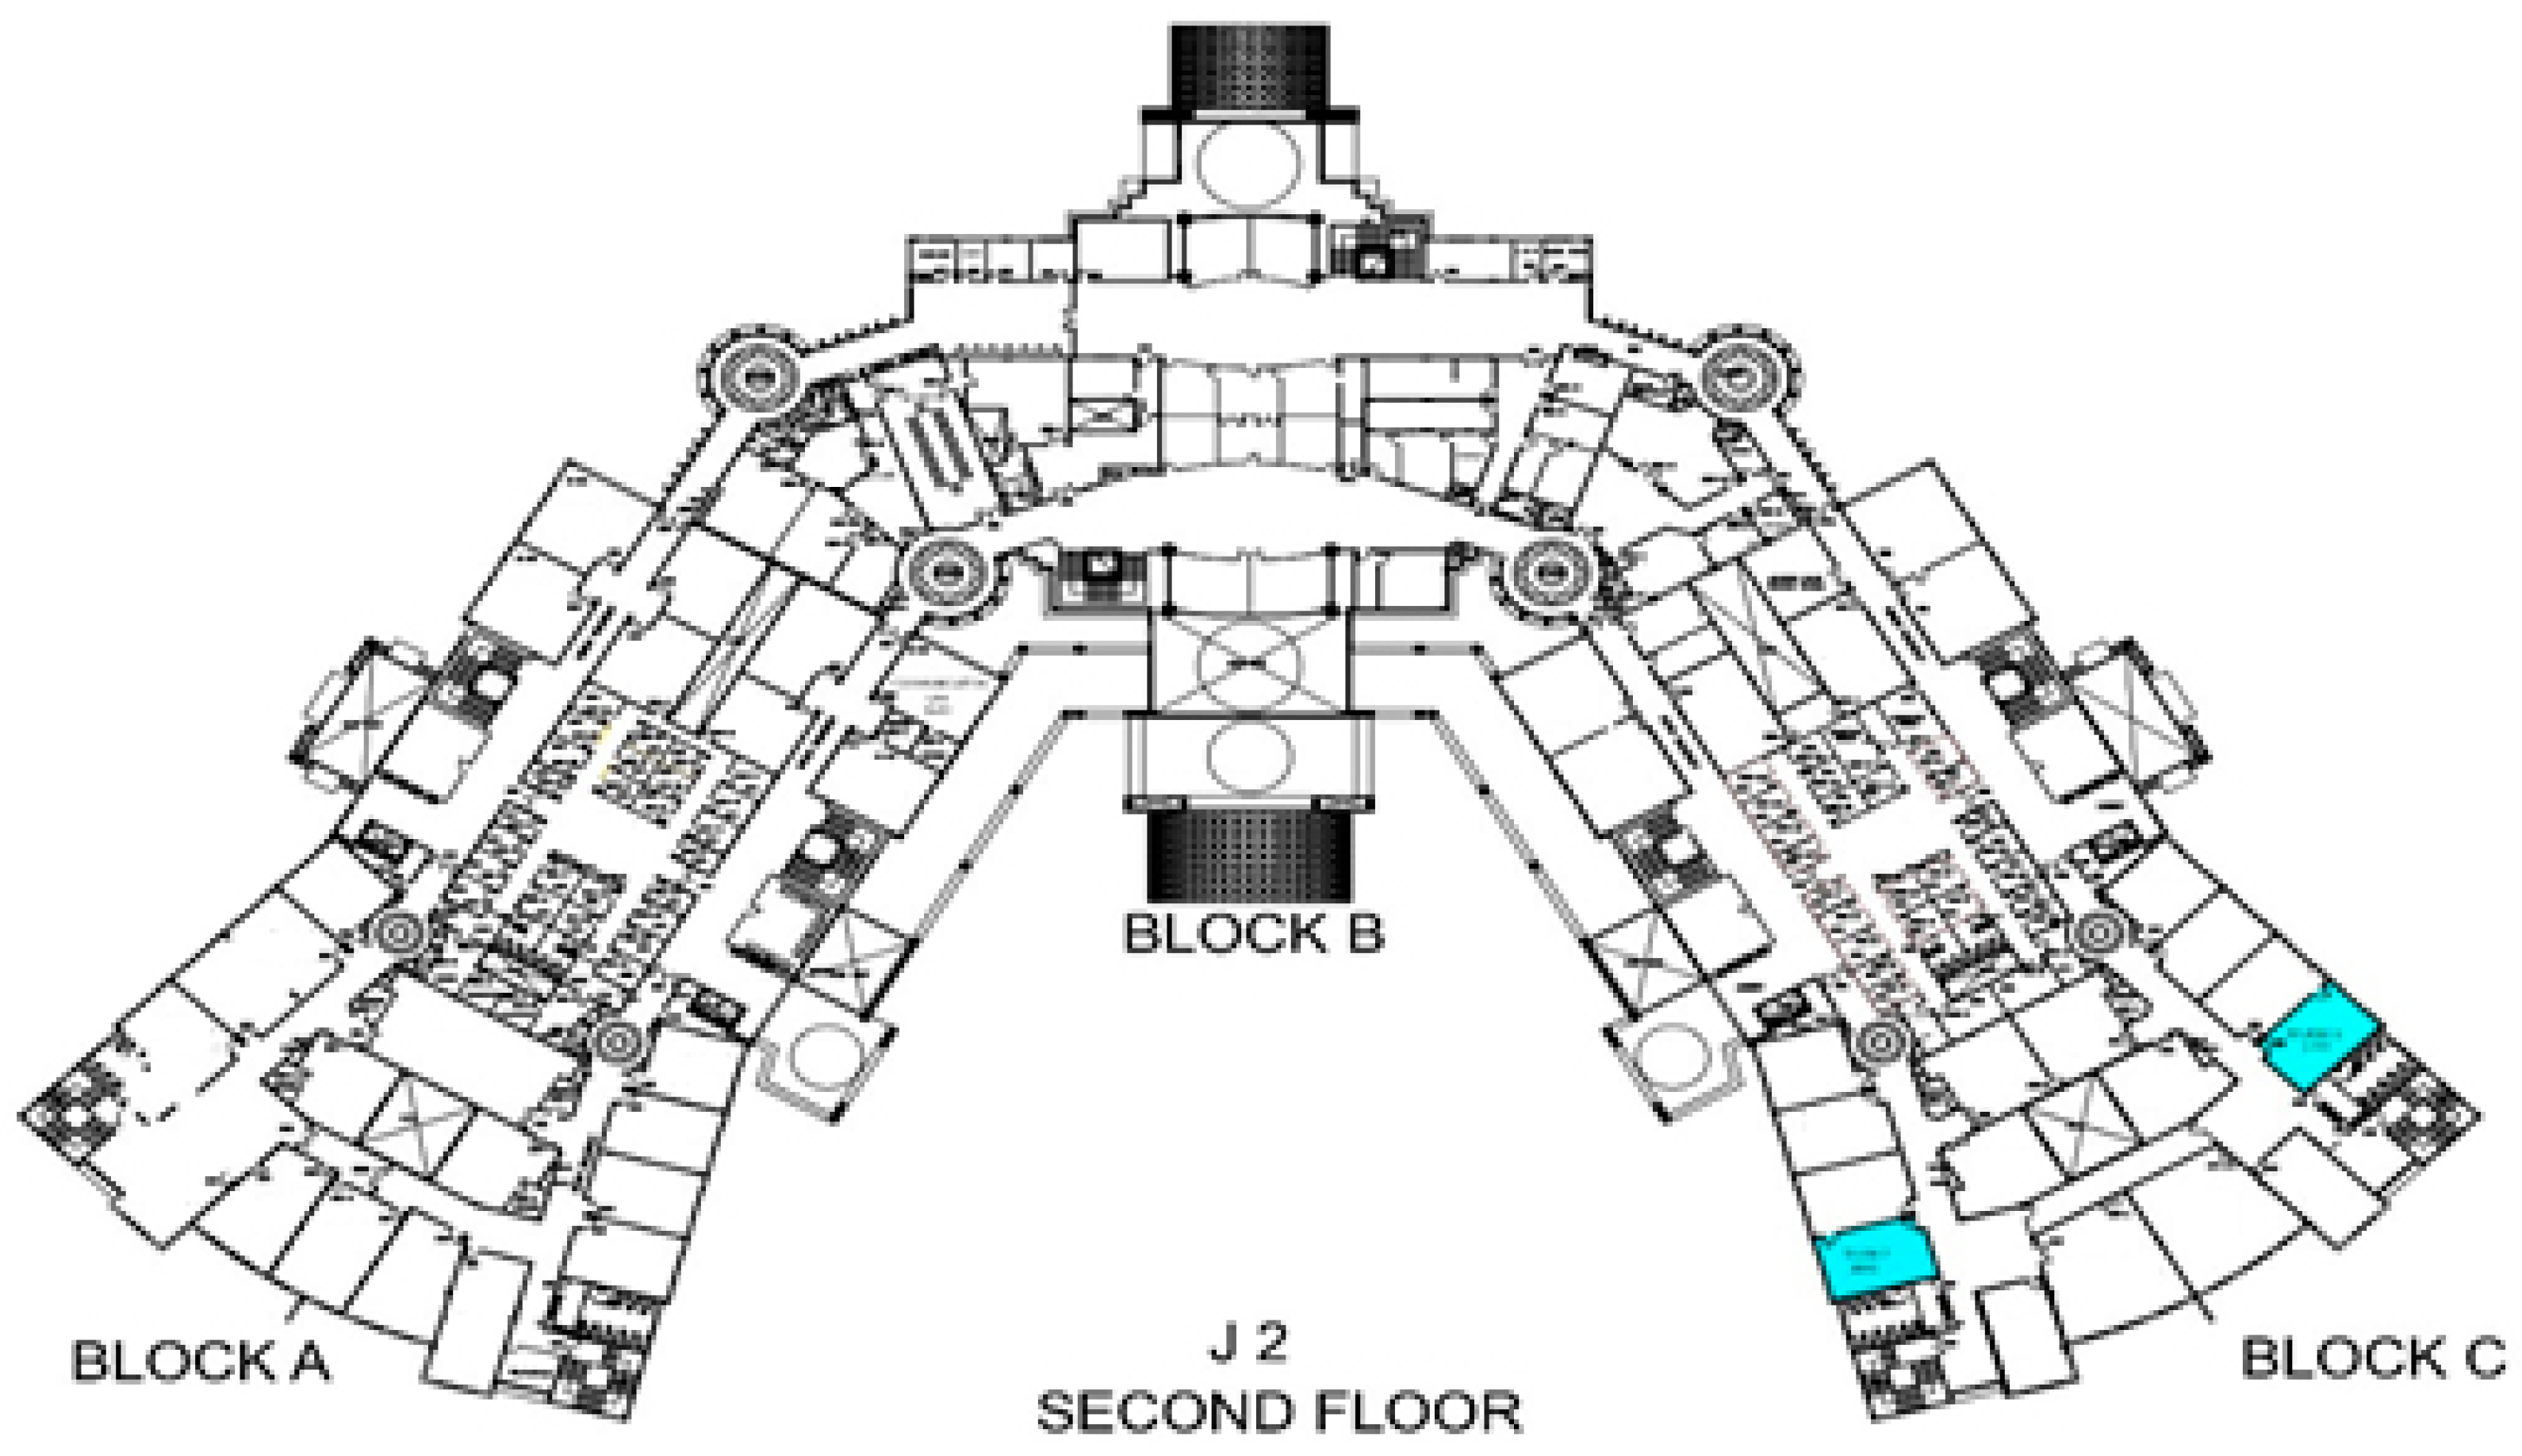
The target classrooms selected were two of the same size with an area of 120.64 m2, and the number of attendees was the same with 32 students per room. The target classroom was located on the same floor (first floor) at the college of architecture, art, and design at Ajman University in the United Arab Emirates, but the orientation of each room was different between room A (north) and room B (south). Figure 1 and Figure 2 show the foreground of the target building and the floor plan of the target lecture room.
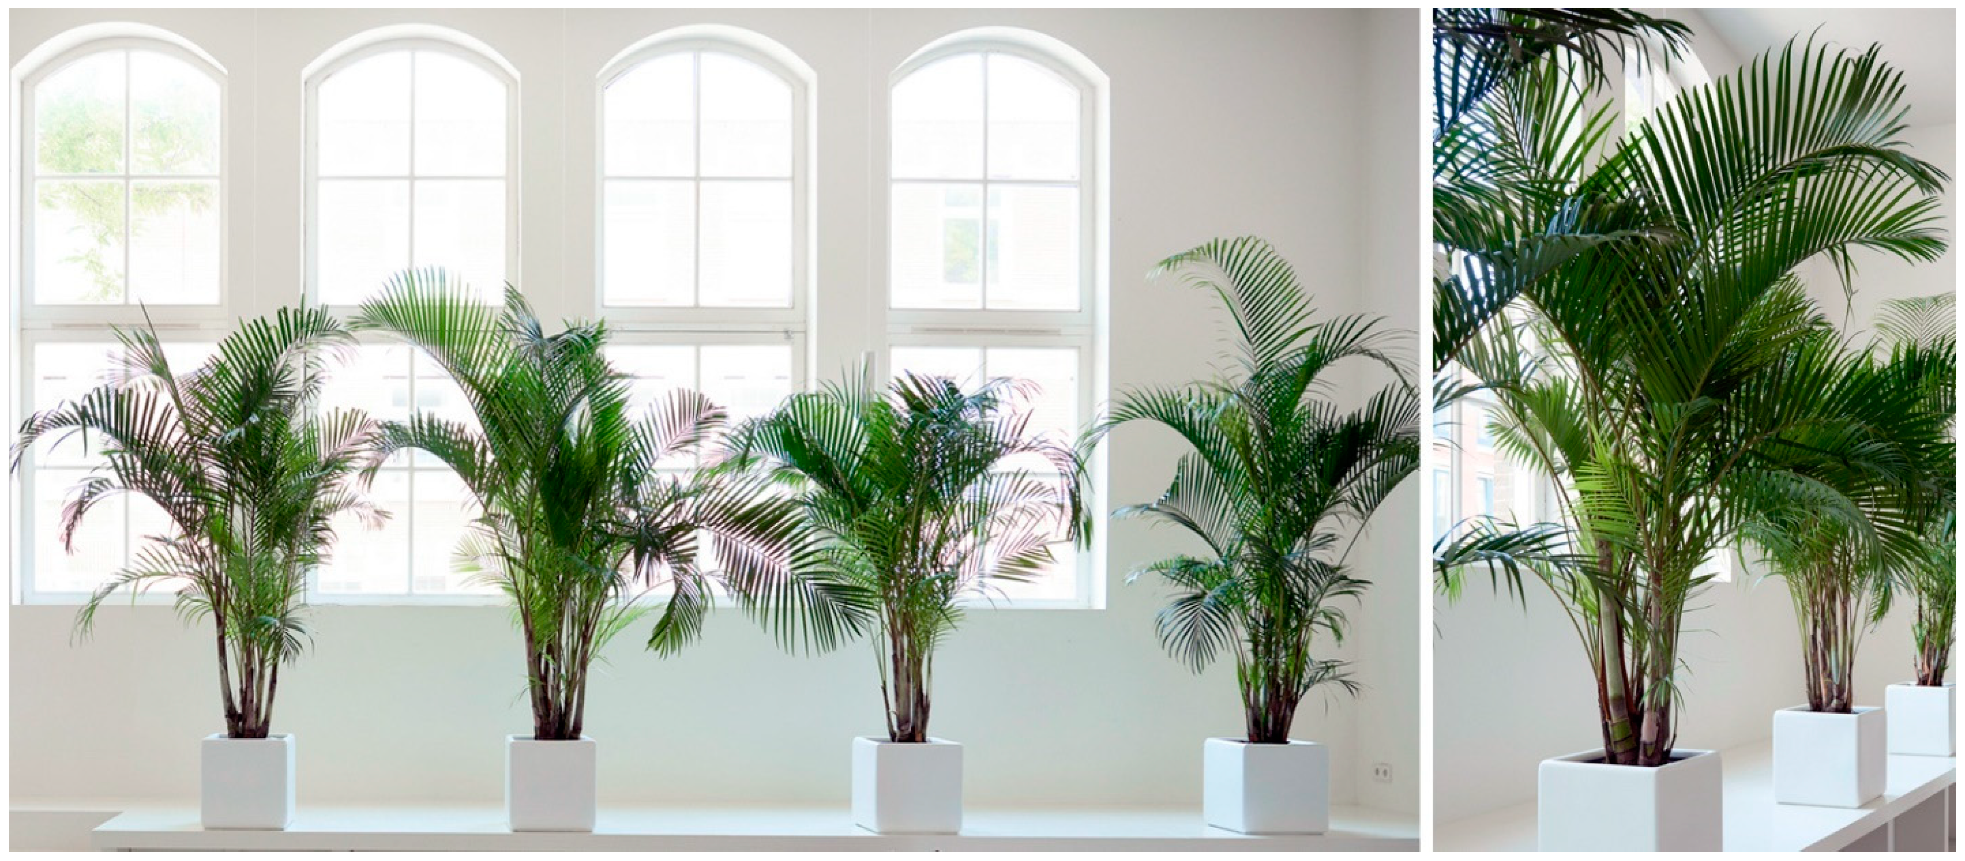
The target plant, areca palm (Figure 3), is recognized worldwide as one of the best indoor air purification plants, absorbing CO2 and producing O2 to detoxify its surroundings by removing air pollutants such as formaldehyde (CH2O), xylene (C8H10) and toluene (C7H8) [61,62]. Among the houseplants that can grow under low indoor illumination (300–1000 lx), it was selected due to having a high CO2 reduction effect in previous studies [63,64]. Based on the previous research, areca palm trees can increase O2 concentrations from 18.56% to 21.33% after 7 h and decrease CO2 concentrations from 428 ppm to 419 ppm [65]. The ratio of the absorption of CO2 and the emission of O2 for a given fixed time period is 3:1 (Table 1) [61].
The leaf area of the target plant was calculated using an AutoCAD program after scanning the average leaf, and it was 300 cm2/pot. A total of 48 pots of areca palms (pot size: 15 cm × 21 cm) were placed in a line next to the windows in each classroom, and the plant density was about 14.68% of the floor area. Based on the Dubai Municipality’s regulation regarding indoor air quality (IAQ), in 8 h of continuous monitoring prior to occupancy [66,67], 8 types of indoor pollutants (CO2, CO, O3, VOCs, HCHO, SO2, NH3, and NO2) were selected, but we focused on the CO2 concentrations in the classroom setting.
3.2. Field Measurement Experiment
It was intended to have the same experiment parameters for the two classrooms, where the same lecture (from 2:00 p.m. to 5:00 p.m.) was held during the same semester, and the experiment was conducted by R.A. after obtaining consent, explaining the experiment procedure to the students in advance. The specific experimental method was as follows. Before class started, each measuring device was installed at the measuring point (center of the classroom), and a questionnaire was distributed to the students after R.A. briefly explained the experiment. While class was in progress, the actual conditions of the indoor air quality in the target classroom were measured for 1 h in units of 1 min. During the lecture break, we placed the target plant under the window in the lecture room and then performed the measurement experiment in the same way as before class started. Subjective assessment for general questions, learning motivation, perceived air quality, and SBS symptoms was conducted 5 min after class started and 5 min before class ended. The learning concentration should be evaluated only 5 min before the end of the lecture [68].
In principle, all experiments were conducted in a state where the door was closed and the air conditioner was operated, but the occupants were allowed to control the opening and closing of the windows by themselves in order to maintain the thermal comfort of the students. The case of opening the windows was excluded from the analysis, since the air exchange rate (ACH) from outdoors could significantly dilute the indoor air pollution [16]. Moreover, due to the scorching hot weather conditions in the UAE, students rarely open windows. In addition, students with poor health status or low learning motivation were also excluded from the analysis. IBM SPSS Statistics 27 was used for statistical analysis of each variable according to the presence or absence of plant placement. Equality of variance was confirmed through an F-test (p < 0.05) between the two groups, and a t-test (p < 0.05) was performed [69]. The correlation between the CO2 concentration in the classroom and each variable was investigated through the Pearson correlation coefficient. The measurement equipment and resources are shown in Table 2.
4. Analysis
Table 3 below shows the general indoor environment quality without plants in the target classroom. Even though Ajman University is located in the United Arab Emirates (Middle East), the spring semester is opened in the pleasant winter (daytime temperature: 25–30 °C; nighttime temperature: 12–15 °C), so the thermal environment of the target classroom was comfortable with central air conditioning (PMV: 0.13). It was found that the light environment also satisfied the illuminance design standard (300–1000 lx) with an illuminance of 582 lx. In the case of the indoor air environment, most sick building syndrome (SBS) pollutants except CO2 appeared below the regulation standard because the J2 building in Ajman University is more than 10 years old. On the other hand, the concentration of CO2 continuously increased and exceeded the regulation standard (1000 ppm) with an average of 1873 ppm. This seems to be due to the respiration of the students. In addition, CO2 is an essential element of plant photosynthesis and is recognized as a major indoor air pollutant. Although it does not harm the human body by itself, an increase in its concentration often indicates a deterioration in thermal conditions or an increase in other pollutants. For this reason, this study aimed to analyze the effect of improving the IAQ while focusing on CO2.
4.1. Indoor Air Quality Improvement Effect from Plants
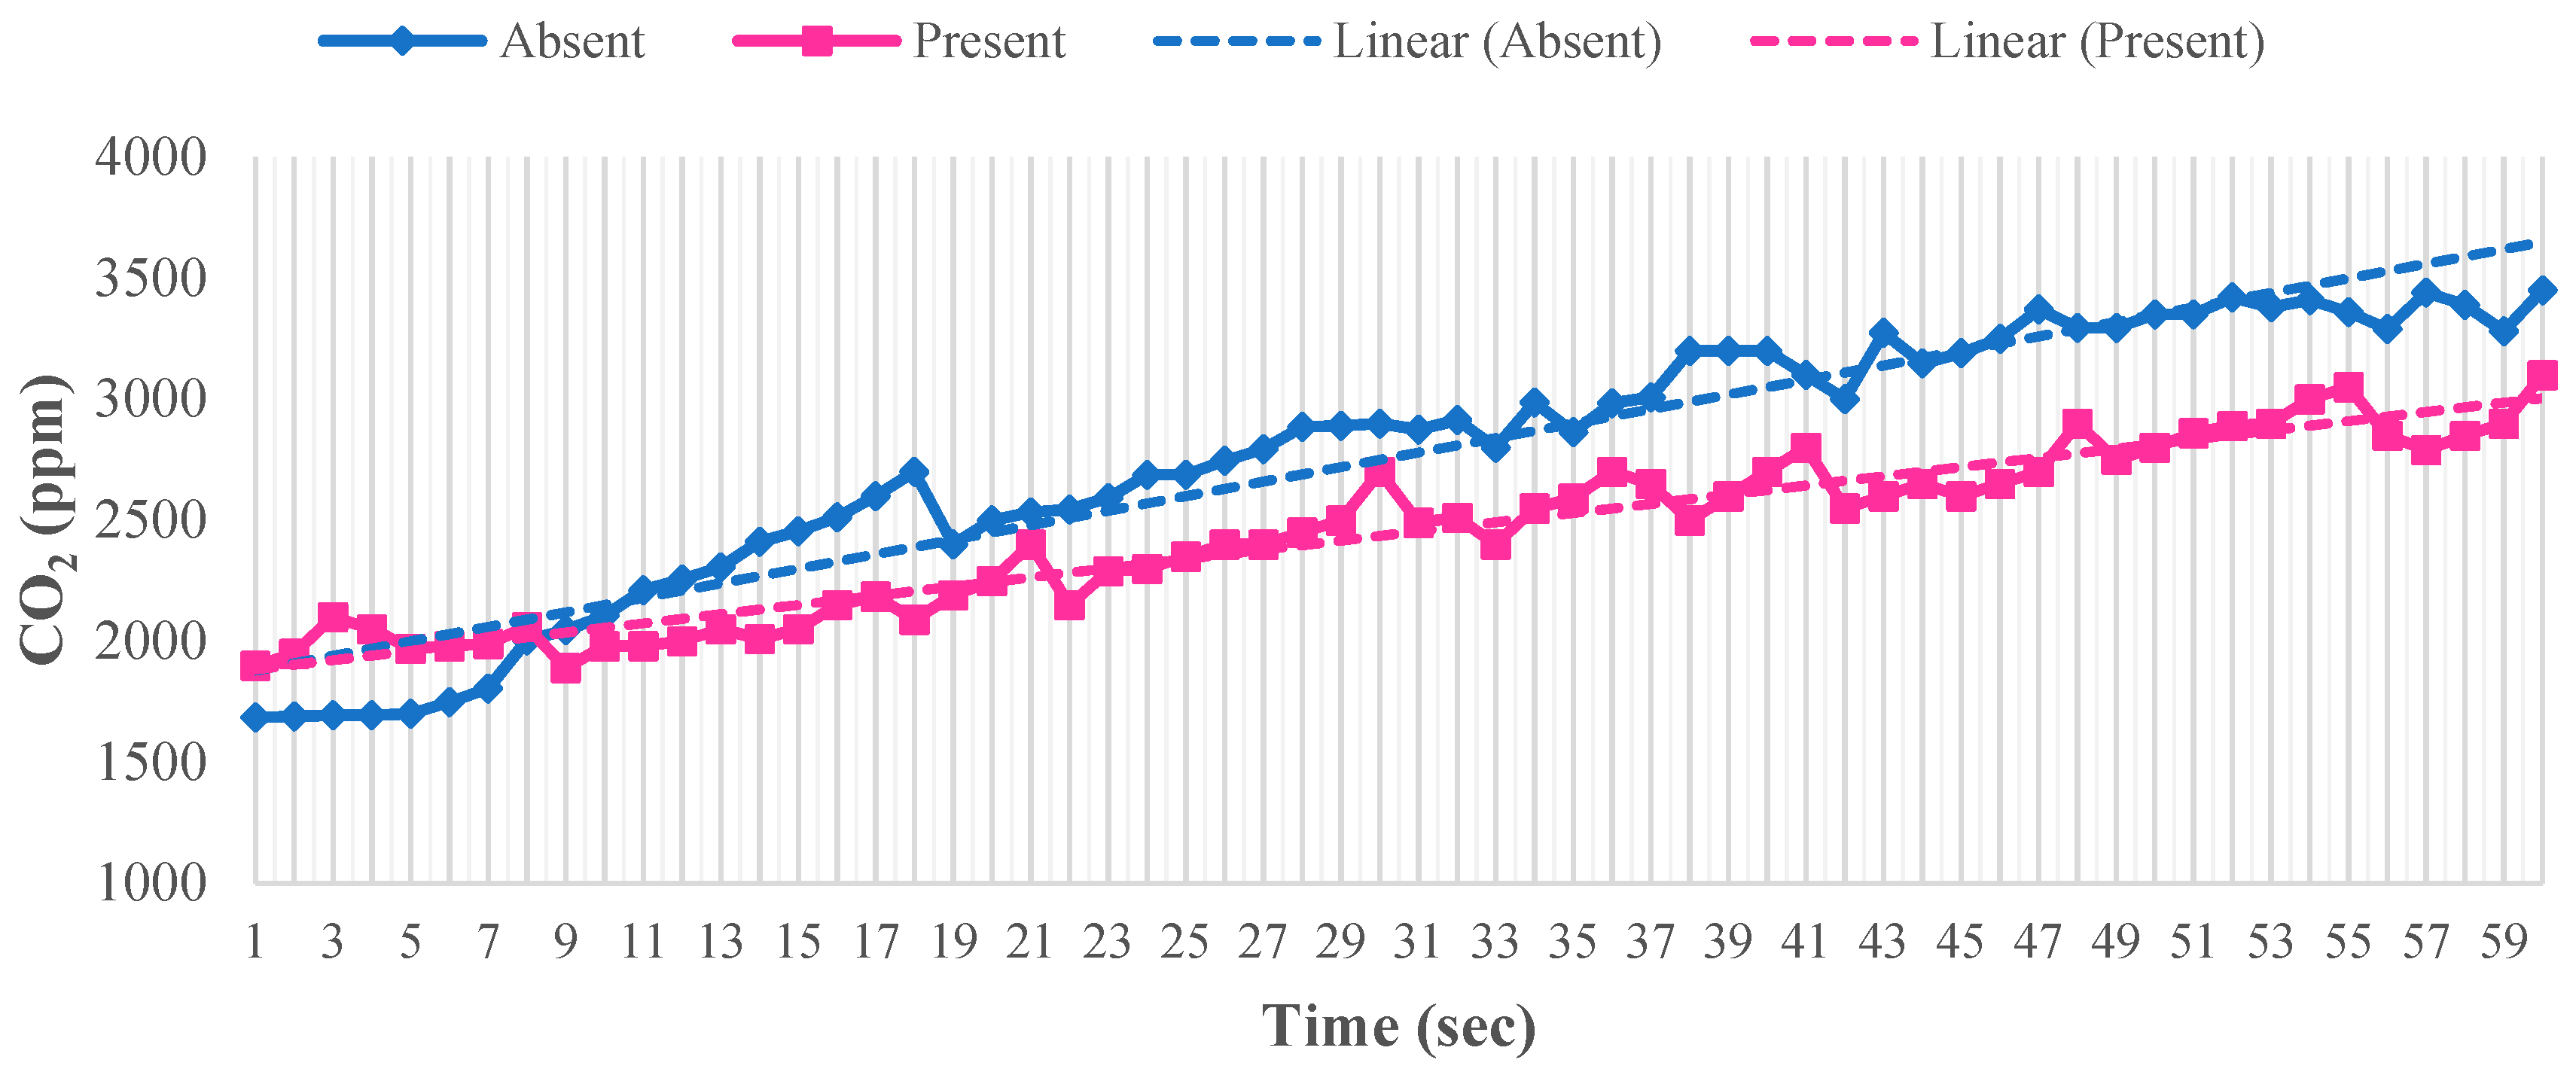
In all cases, when the plant was placed (present), the CO2 concentration was found to increase gradually compared with the case where it was not (absent). Figure 4 shows the experimental results of the classroom (room 2) on the afternoon of 24 February 2020, and most of them show similar trends. The increase in the CO2 concentration (ΔCO2 = after (average CO2 concentration for 5 min before the class ends) − before (average CO2 concentration for 5 min after the class starts)) in the classroom for each case was also found to be lower in the case where indoor plants were placed (average 668 ppm) compared with the case where indoor plants were not placed (average 1205 ppm) in all cases. Compared with the calculation of the decrease in the CO2 concentration by areca palm trees in the previous research (average 773 ppm) [65], the result (average 668 ppm) was not very different. If the leaf area density was placed indoors at about 14.68% of the floor area, there was an effect of about a 50% reduction in the CO2 concentration, which continuously increased due to respiration of the occupants and by the photosynthetic activity of plants (p = 0.1). The results of calculating the increase in the CO2 concentration are shown in Figure 5.
4.2. Perceived Air Quality Improvement Effect from Plants
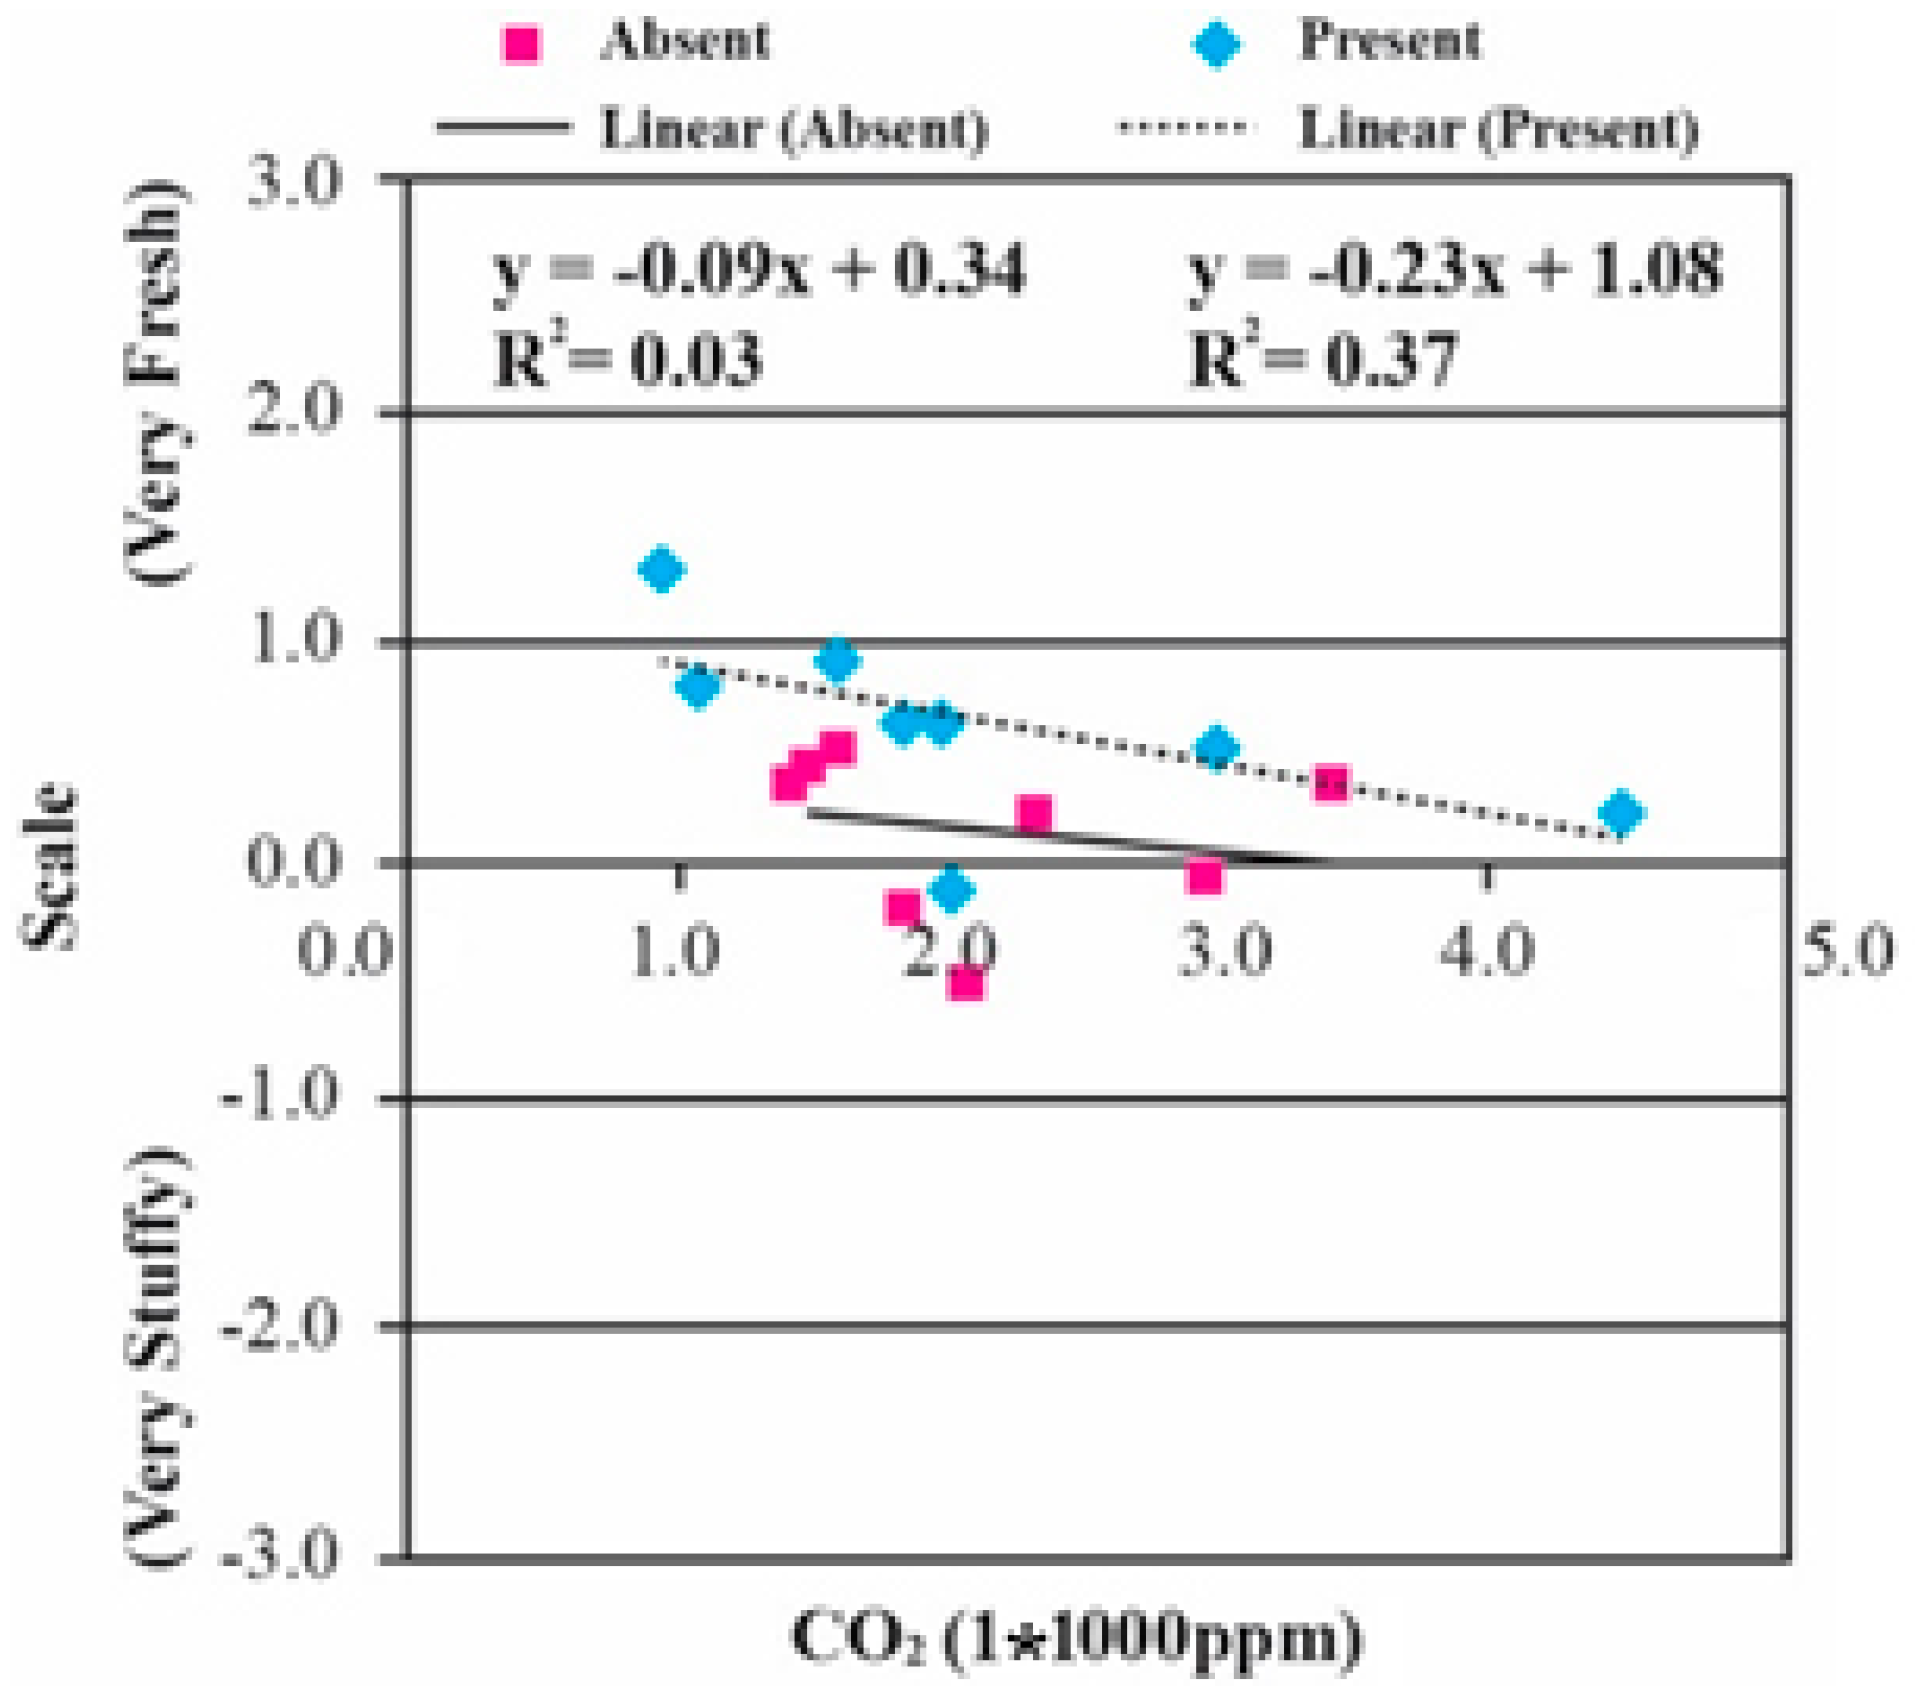
Perceived air quality refers to quantifying the human perception of indoor air quality as satisfaction and dissatisfaction. In this study, we tried to evaluate the perceived air quality by freshness and acceptability. Freshness was determined to be “fresh” or “stuffy”, as this was vocabulary that students could easily and comprehensively use to express the degree of perception of indoor air quality through a preliminary survey. It was placed at both ends and evaluated by classification on a seven-point scale. The acceptance of freshness was created by referring to 11 scales from the ASHRAE thermal sensation scale [70].
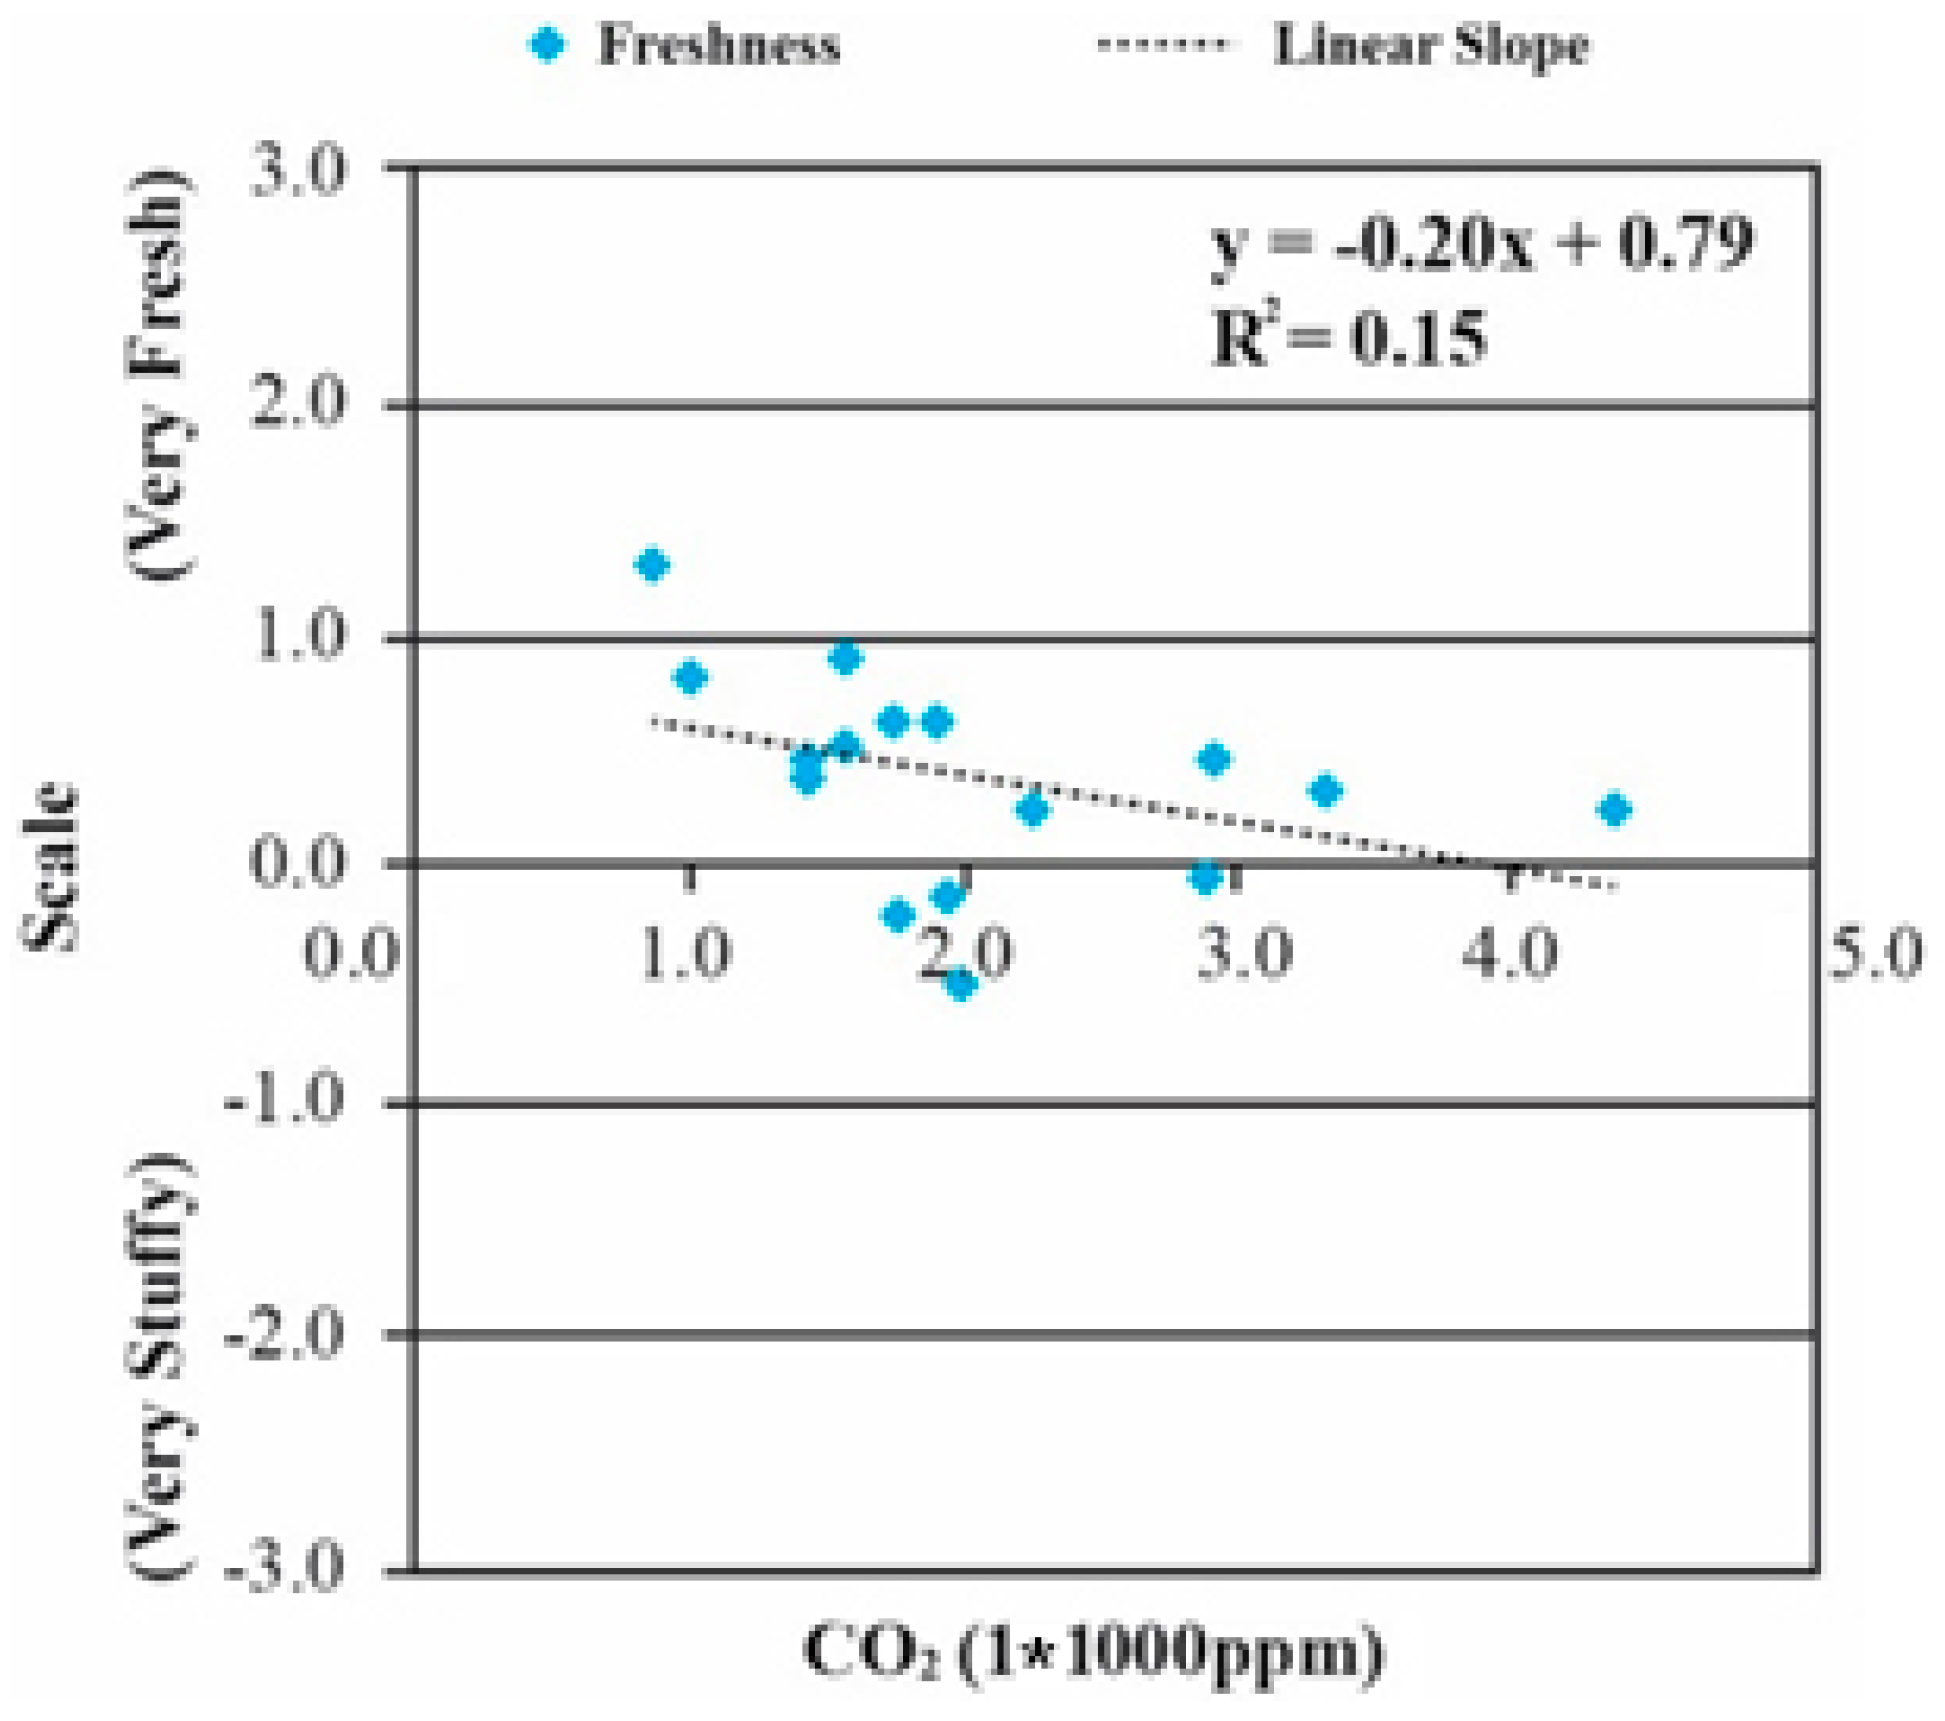
As is shown in Figure 6 and Figure 7, as the concentration of CO2 in the classroom increased, regardless of plant presence, the freshness of the indoor air quality perceived by the occupants shifted toward “stuffy”. It can be seen that the acceptability of the indoor air quality also showed a tendency to move from “comfort” to “intolerance”. The correlation coefficient (freshness: 0.154; acceptability: 0.167) was low, so it was not significant. However, students perceived the indoor air quality to be 40% fresher when plants were placed (average freshness: 0.62) than when they were not (average freshness: 0.15). The indoor air quality was considered to be 140% more suitable when plants were placed (average water content of 0.74) than without them (average water content of 1.04). It was found that the presence or absence of indoor plants had a significant effect on students’ freshness and acceptance ratings (freshness p = 0.03, acceptance p = 0.04). Moreover, students appeared to be more sensitive to the CO2 concentrations when plants were placed than when they were not. The results are shown in Figure 8 and Figure 9.
4.3. Sick Building Syndrome Improvement Effect from Plants
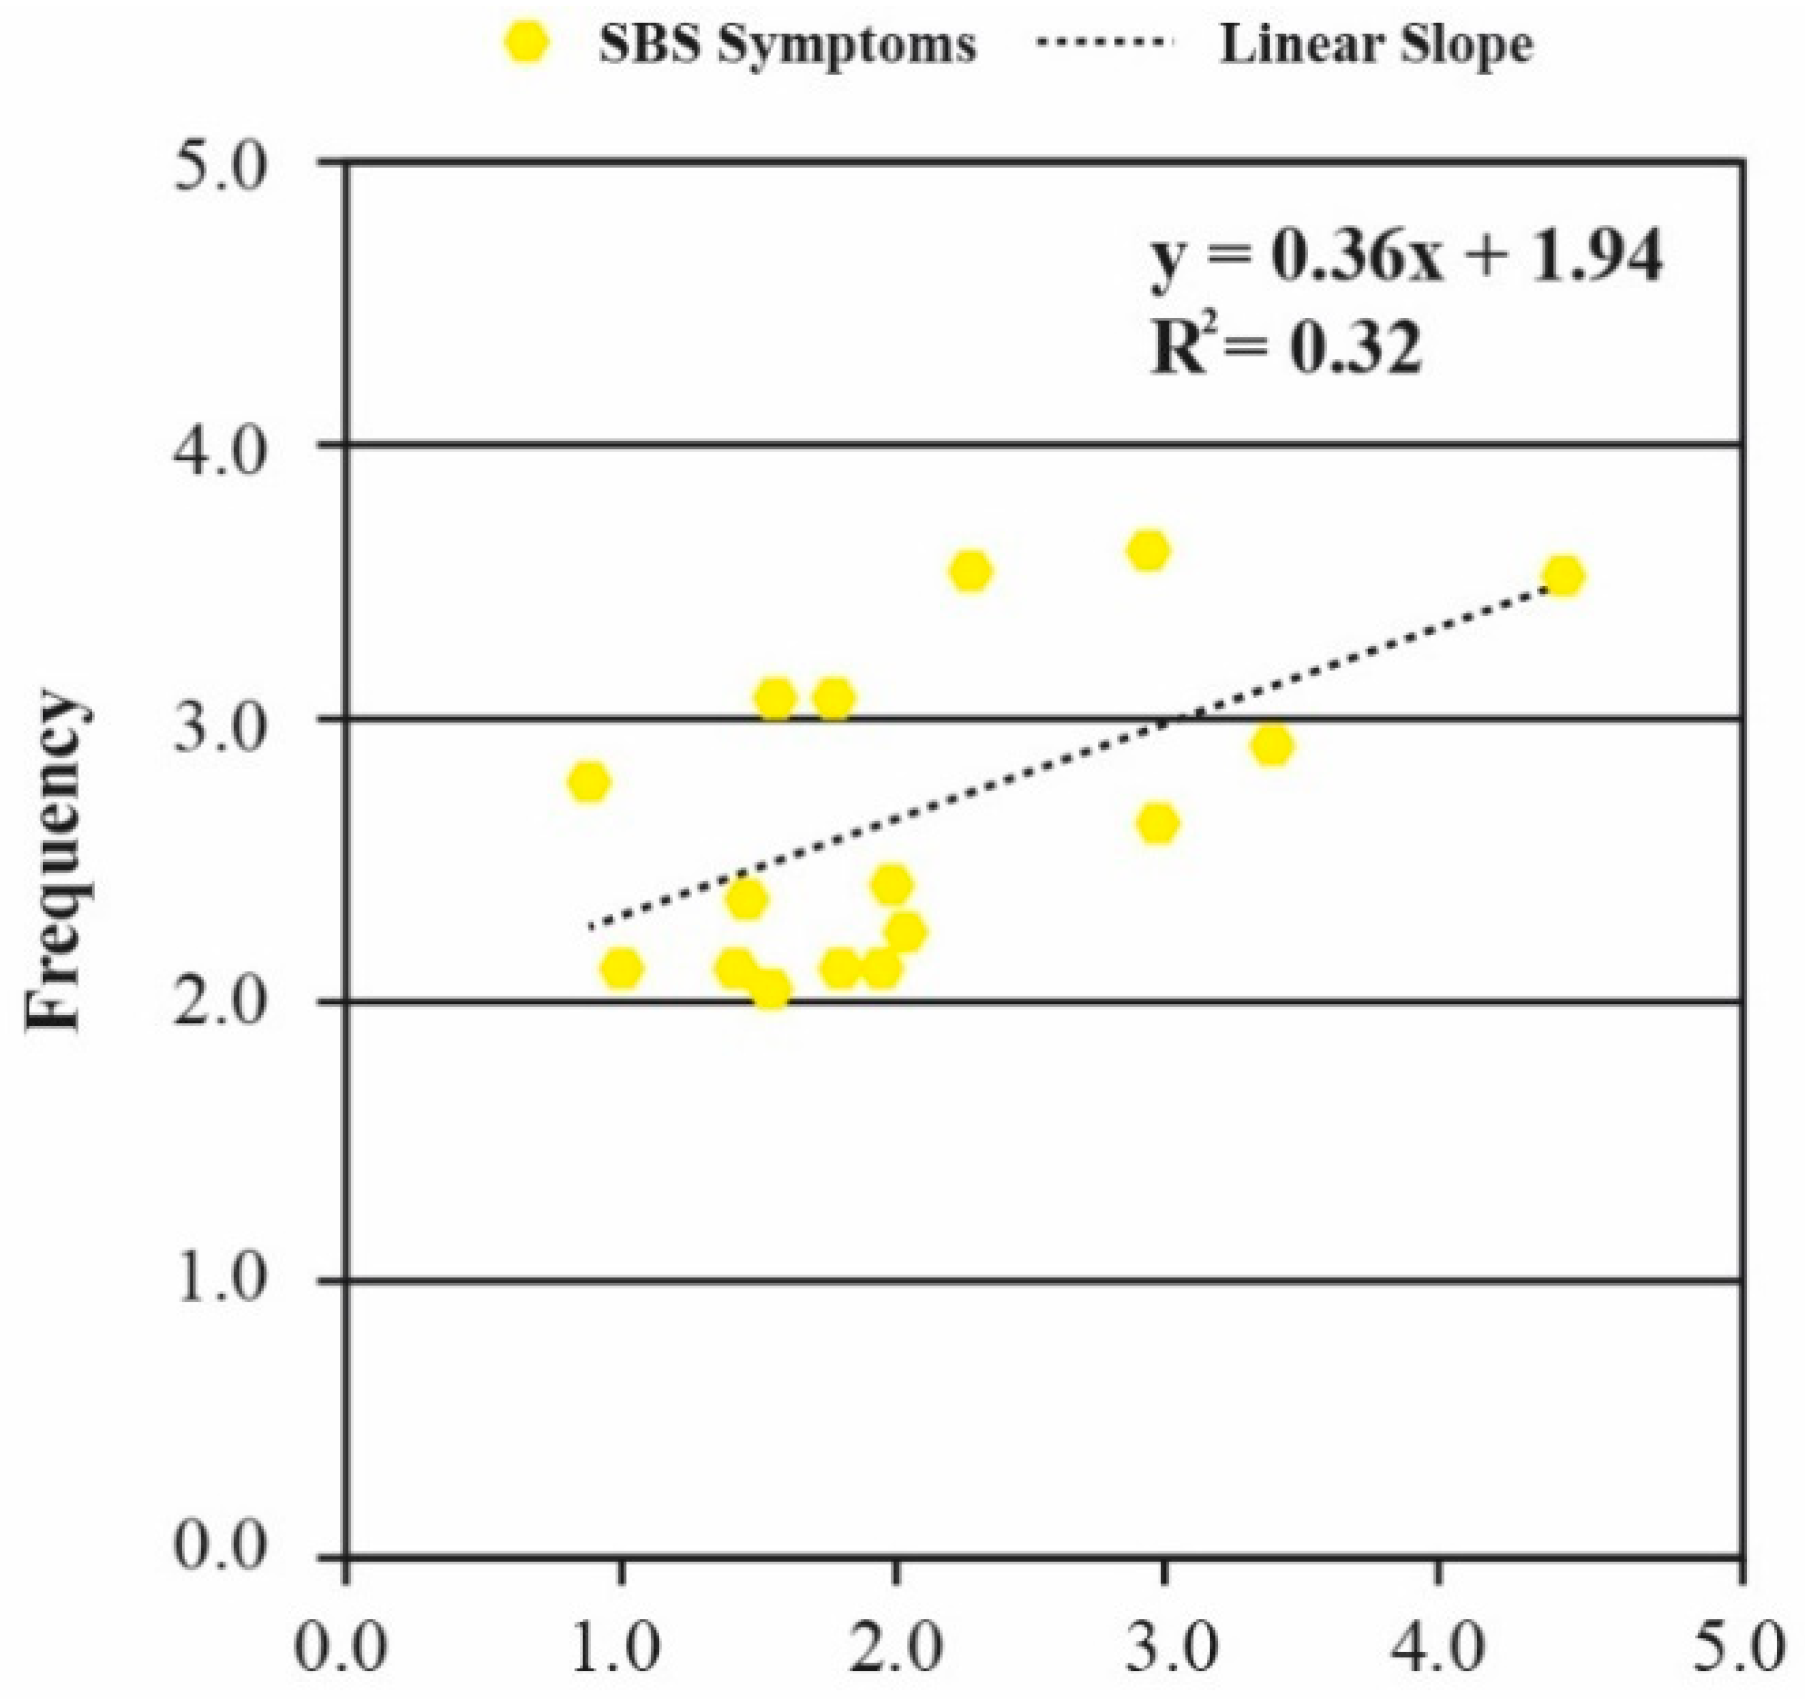
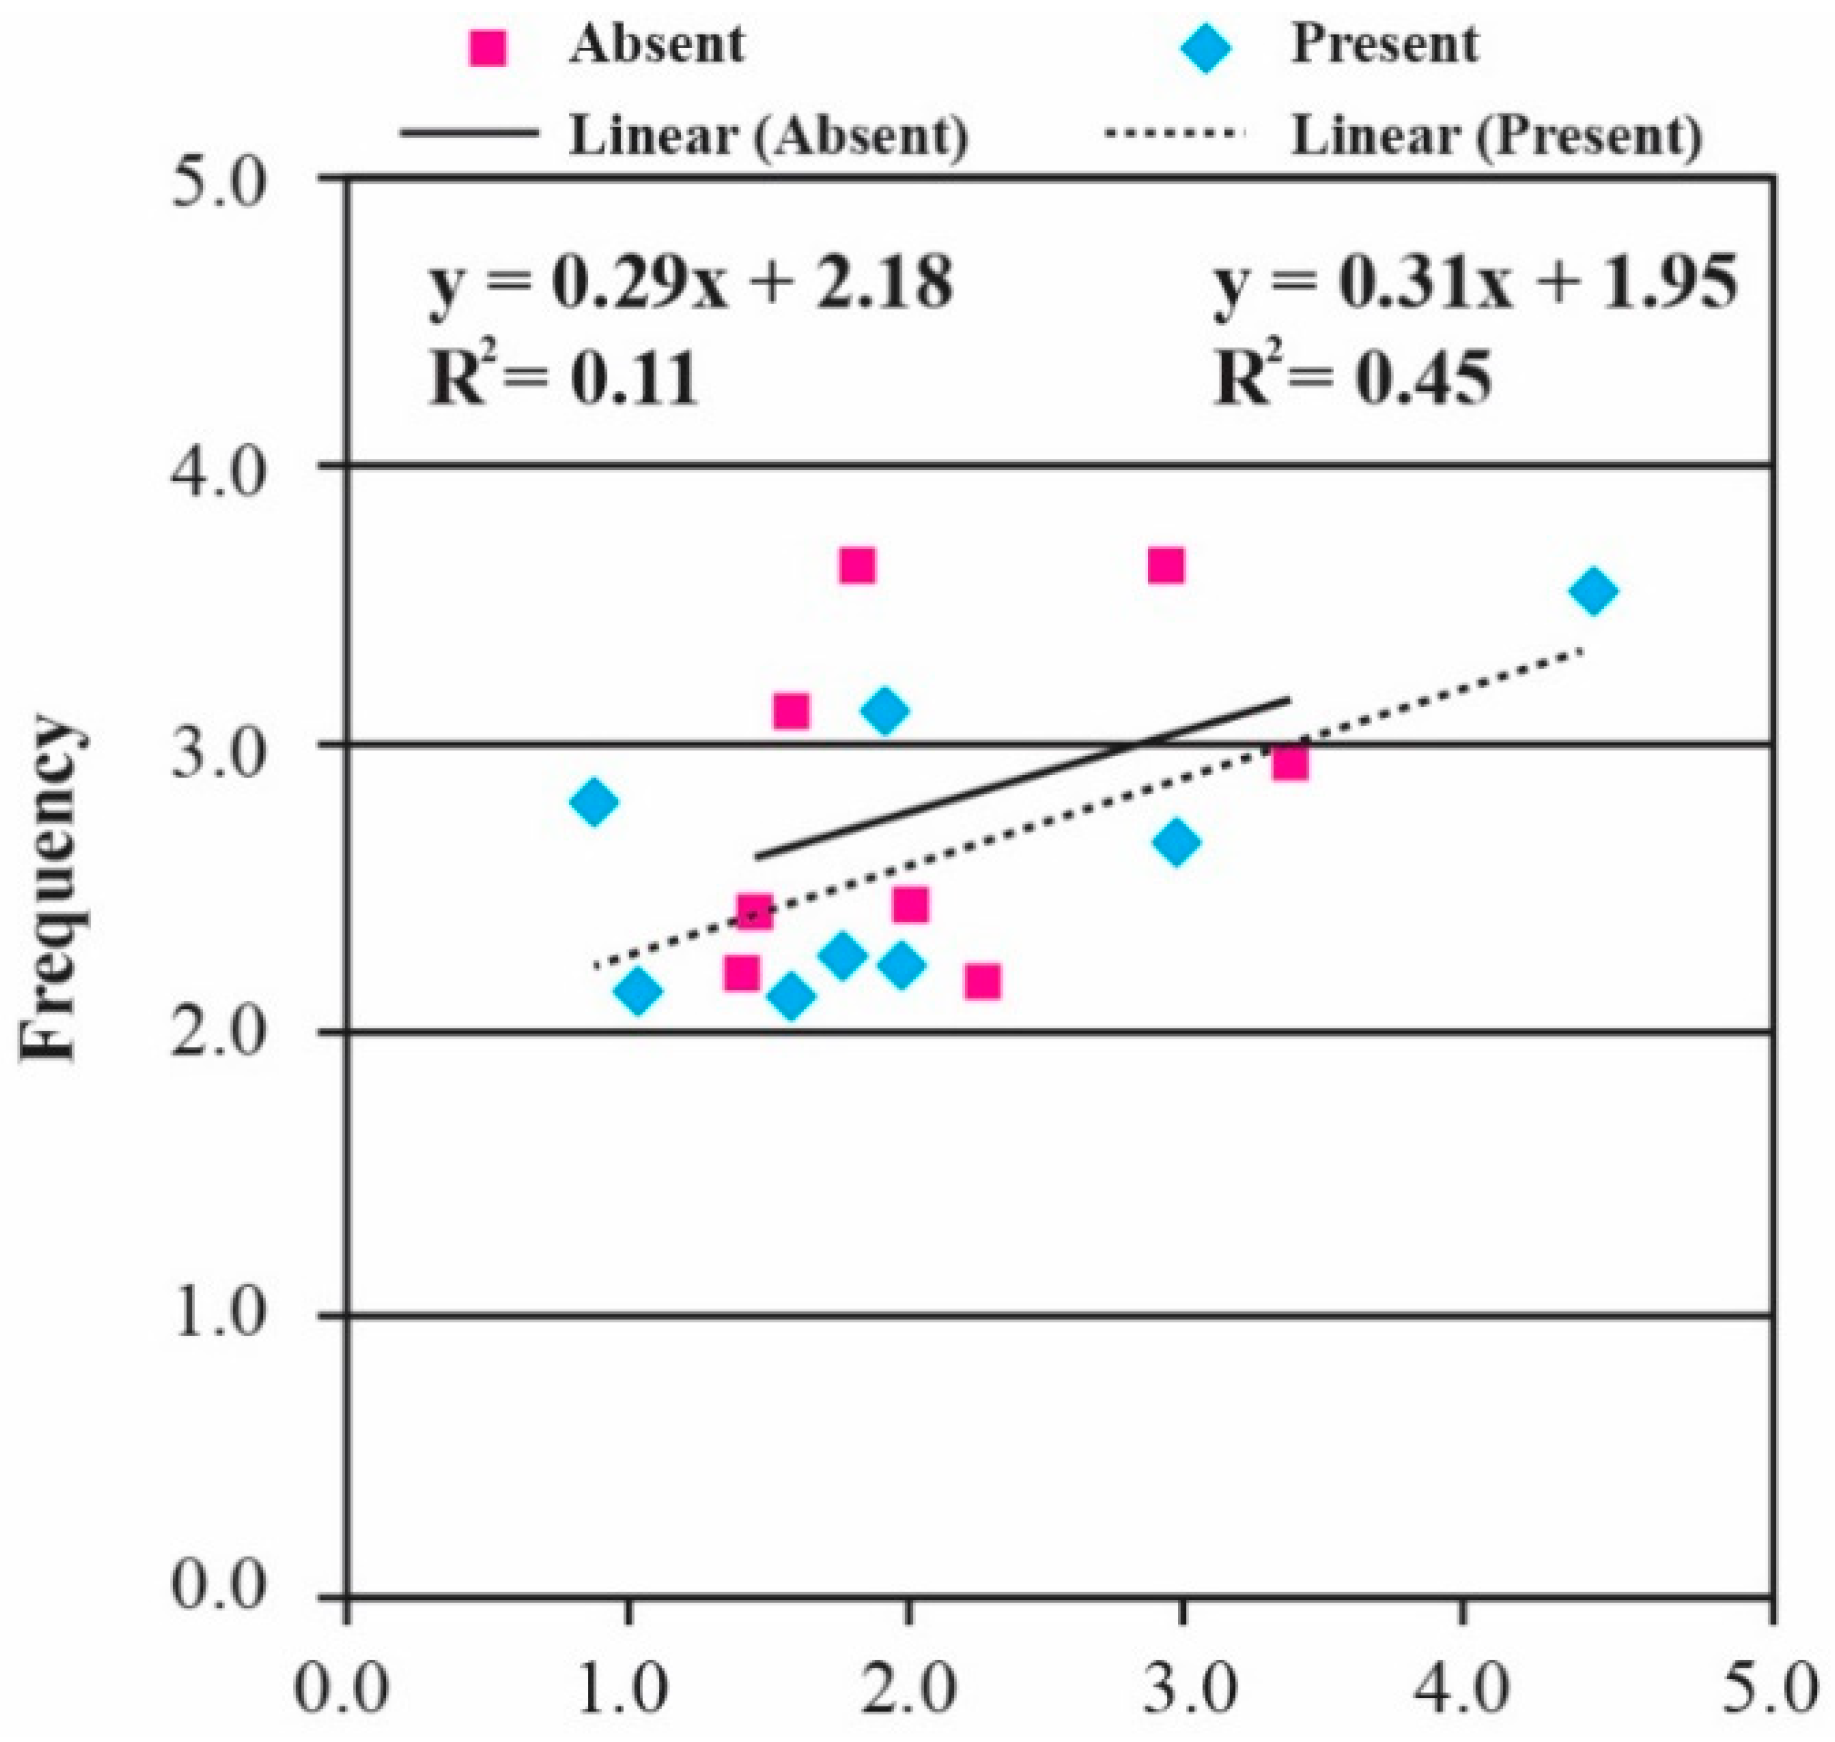
Sick building syndrome (SBS) is a symptom that appears in the human body within a building and refers to all cases for which no clear cause is known, except that the building is the main cause [71]. As is shown in Figure 10, the incidence of SBS increased as the CO2 concentration in the classroom increased, regardless of the placement of plants, but the correlation coefficient was 0.251, indicating that the significance was low. The incidence of complaining of SBS symptoms among students was found to be improved by 108% in the case of plant placement (2.59 times) than in the case without it (2.79 times) (p = 0.49). The results are shown in Figure 11.
In this study, SBS symptoms were classified into six categories: skin, eyes, ears, nose, throat, and nerve or mental, and a total of 27 symptoms were evaluated [72]. The target symptoms and incidence of each symptom are shown in Table 4. During the experiment, students complained of throat dryness (14.02%), eye dryness (12.65%), and skin dryness (12.06%) at high frequencies. According to the previous research, placing indoor plants in about 2–5% of the room area increases the humidity in the room by about 5–10%, and increasing the plant placement to 8–10% can increase the humidity by 20–30% [73]. In our experiment, RH was increased by 26.4%, but students still complained about throat dryness (14.02%), eye dryness (12.65%), and skin dryness (12.06%) at high frequencies. It is assumed that continuous air conditioning at 18 °C was related to this result. Next, the nerve or mental effects of dozing off (9.41%), drowsiness (7.51%), and tiredness (6.62%) were in order. In recognizing the indoor air quality, dryness of the neck, eyes, and skin was very important, and it seems that the students’ activities required high nerves and mental power.
4.4. Learning Concentration Improvement Effect from Plants
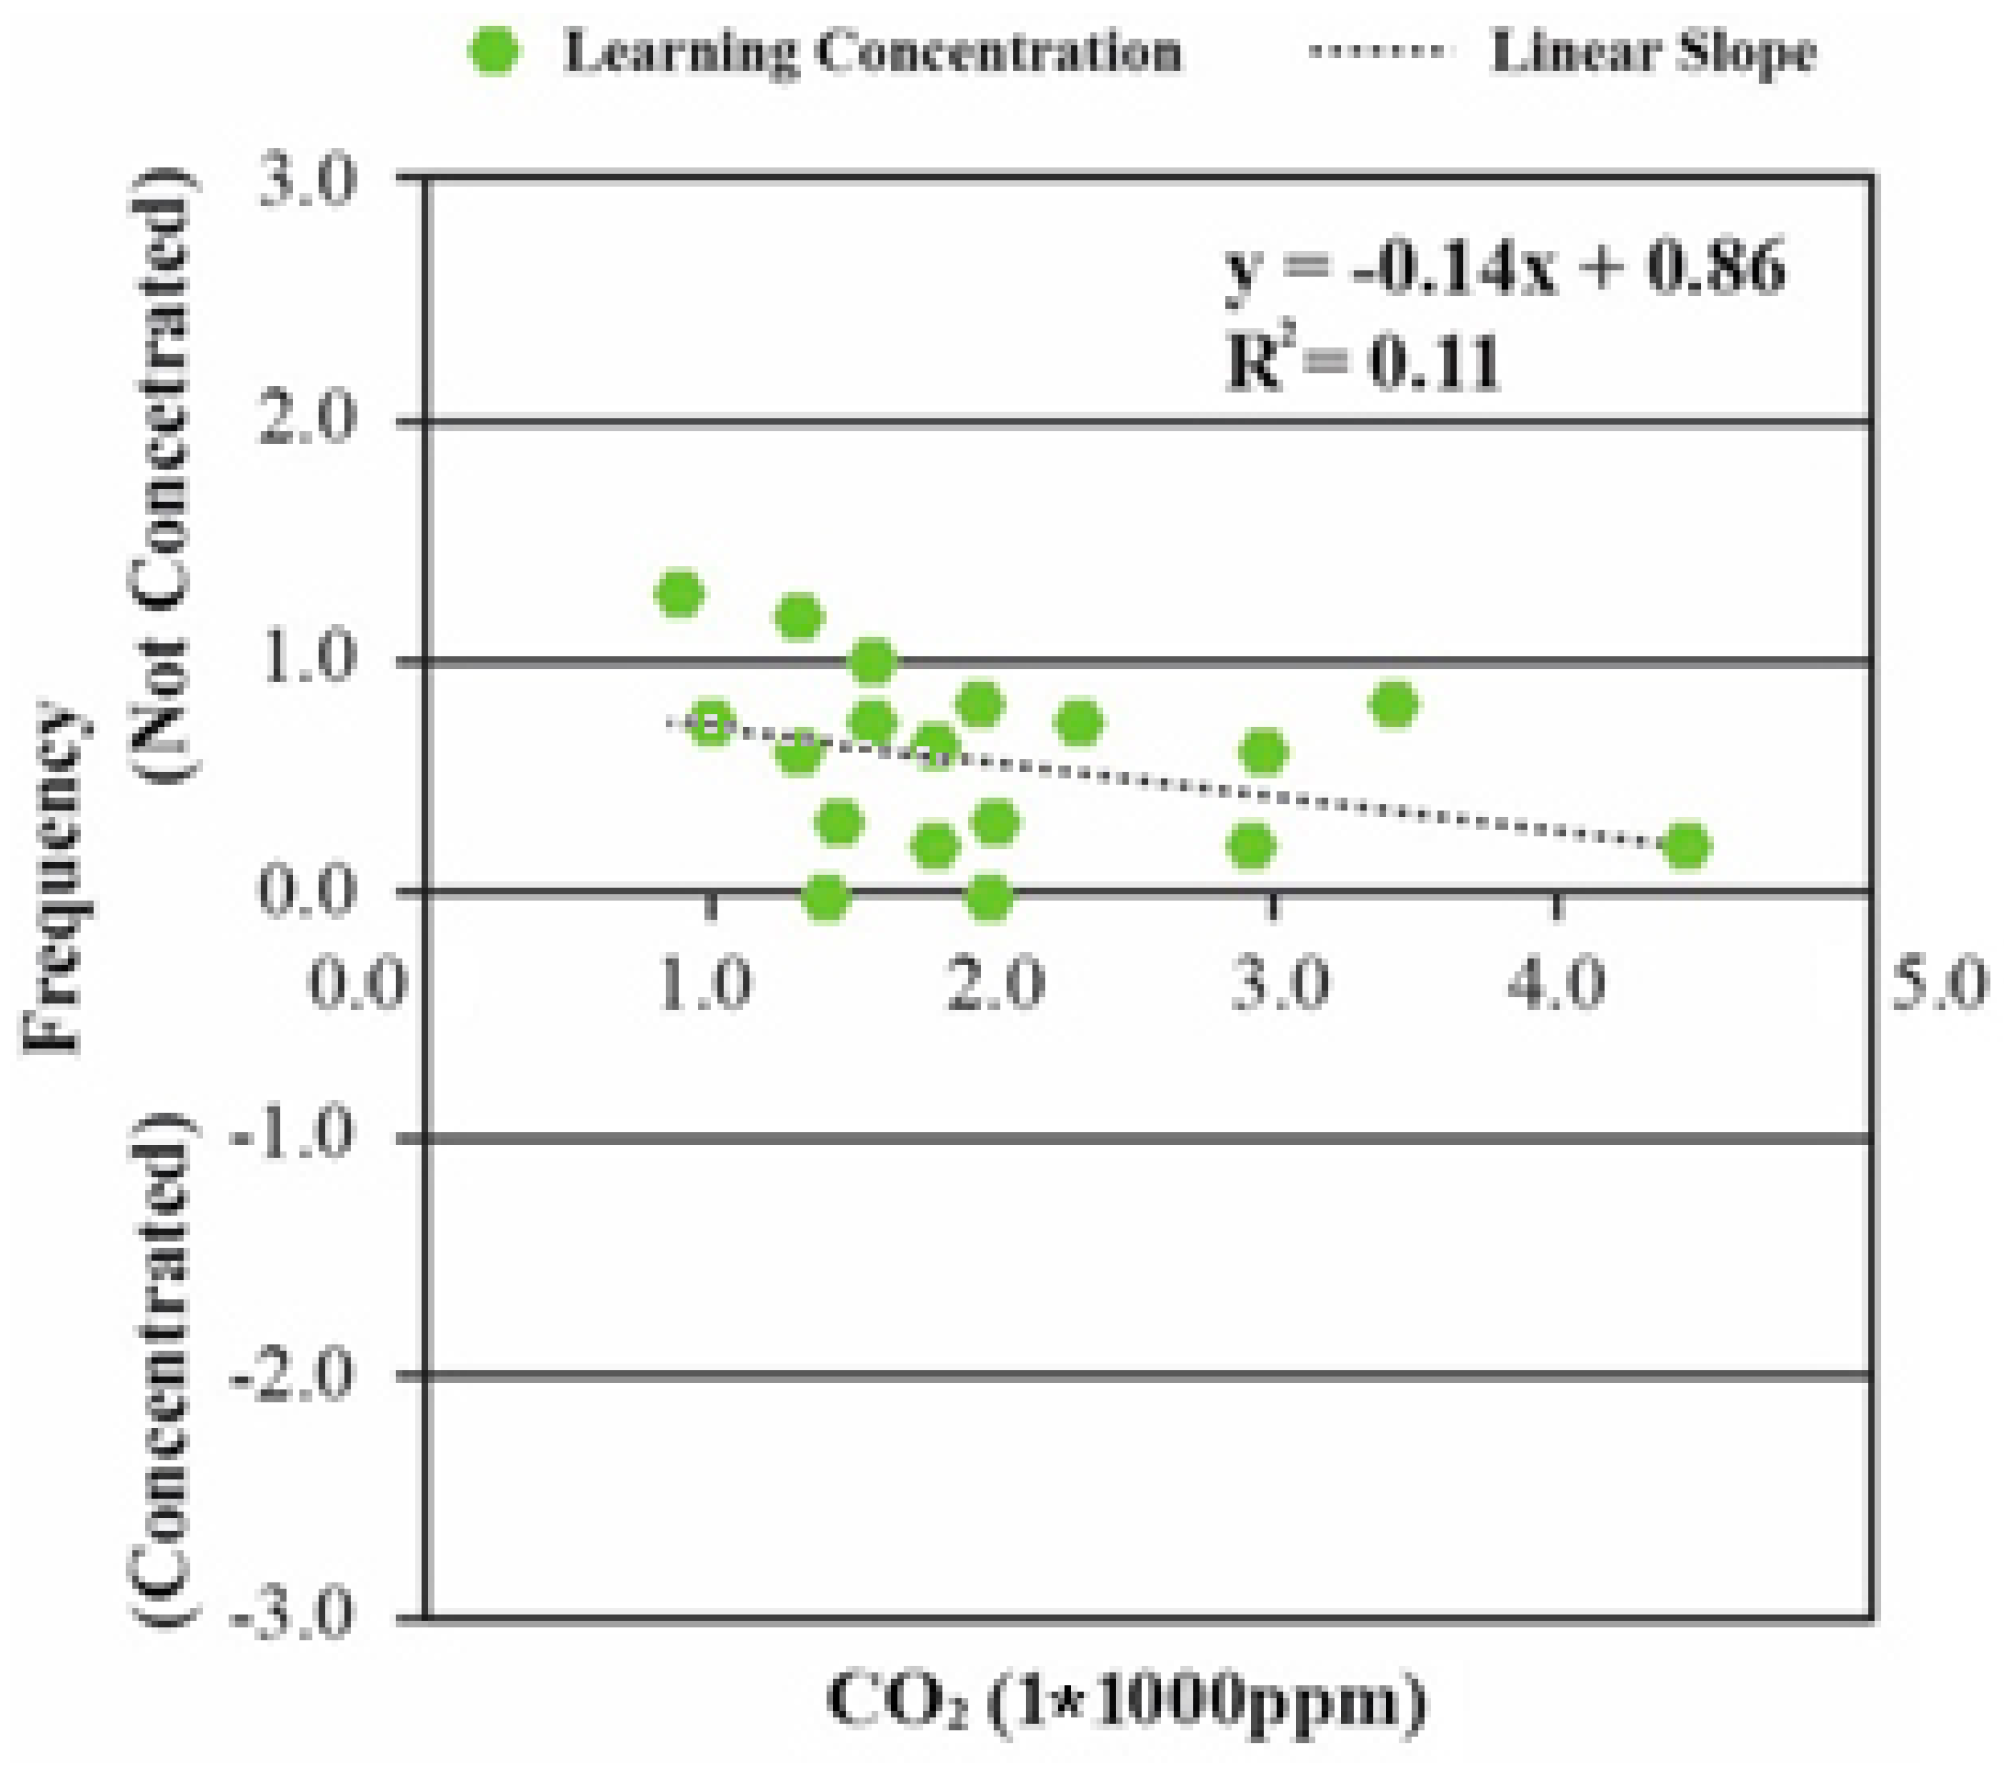
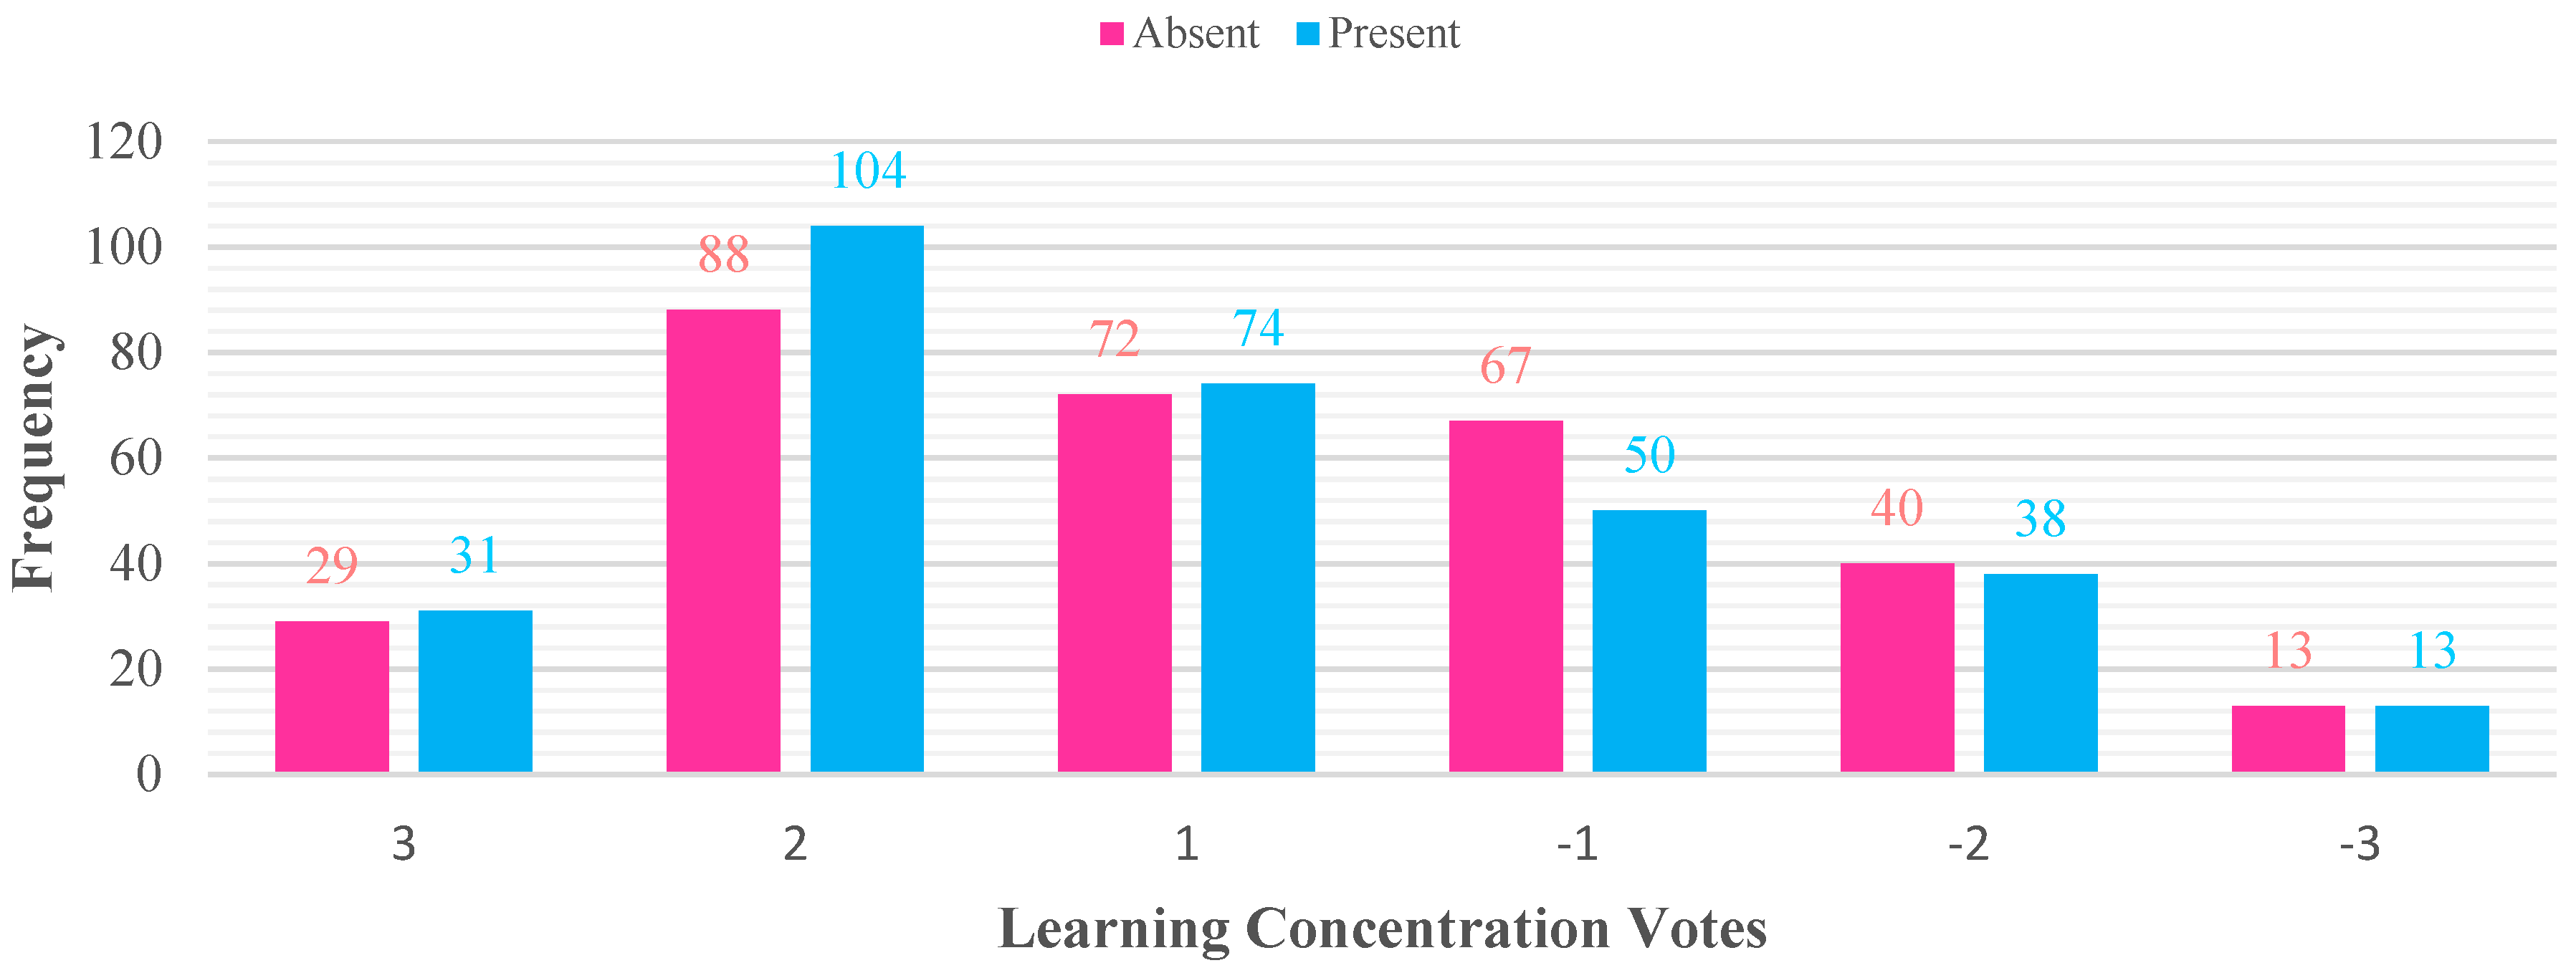
In this study, “very concentrated” and “not very concentrated” were selected as vocabulary that students could use to easily express their learning concentration and evaluated on a six-point scale placed at both ends [74]. As is shown in Figure 12, the learning concentration decreased as the CO2 concentration in the classroom increased, but the correlation coefficient was 0.058, indicating that the significance was low. The learning concentration was perceived to be 120% better (p = 0.62) when indoor plants were placed (average concentration of 0.61), compared with the case where they were not (average concentration of 0.51). The ratio of “concentrated” (1–3) students appeared to be 6% higher than the “not concentrated” (−1–3) students (Figure 13 and Figure 14).
In the case of plant placement, as the air quality became worse, the learning concentration tended to decrease, as can be inferred from the previous research. When plants were not arranged, the concentration of learning tended to increase. This is because students can perceive the changes in their environment and body more sensibly due to the placement of plants. In the analysis of freshness, acceptability, and SBS symptoms presented above, this is considered to be the same reason that plant placement had a higher coefficient of determination (R2) than the case where they were not present, and further research is needed in this regard.
5. Discussion
As the awareness of sustainability increases, the introduction of indoor plants into indoor spaces will become more active. Especially in the United Arab Emirates, people who find it difficult to enjoy the green landscape in their daily life prefer to have indoor plants in their spaces. Aside from the form of a potted plant, indoor plant implementation can be seamlessly integrated with a building’s design [75]. It can even help to obtain better Leadership in Energy and Environmental Design (LEED) levels. One of the categories in LEED is indoor environmental quality (IEQ) [76]. This is not directly related to indoor plants, but there are few innovative methods for indoor plants to be implemented to earn LEED credits. First, a biofilter wall is a wall filled with hydroponic plants to be integrated with a ventilation system to improve air quality [77,78]. Second, biophilia design is a type of interior landscaping to replicate nature indoors to give users visual comfort [79,80]. Third, based on the 2008 study carried out by the Indian government, indoor plants can reduce HVAC loads by 15% [81]. Fourth, indoor plants boost the relative humidity by up to 5–30% [82]. It can help conserve water in conditions where active humidification is required.
In the future, further studies to quantify the effects of areca palm trees on SBS air pollutants such as formaldehyde (CH2O), xylene (C8H10) and toluene (C7H8) in the classroom setting are planned to be carried out. Experiment parameters such as the density of the leaves, temperature variation, relative humidity, and the material of the pots, will be added. Furthermore, further investigations on the intensification of air purification in comparatively smaller classrooms (40–50 m2) with bigger numbers of students will be performed in future research.
6. Conclusions
In order to find out the effect of plants placed in the classroom, the results of actual classroom field measurement experiments and subjective evaluation by the occupants are as follows.
The target classrooms were found to be comfortable in thermal and light environments with a PMV of 0.13 and an illuminance of 582 lx. In the case of the air environment, most of the pollutants, excluding the CO2 concentration, met the Dubai Municipality regulation standards, and due to the nature of the classroom, the CO2 concentration by respiration of the occupants averaged 1873 ppm, exceeding the regulatory standard (1000 ppm). Although the main indoor air pollutant in the classroom is CO2, it was found that the students did not accurately recognize the indoor CO2 concentration.
The increase in the CO2 concentration in the classroom was lower in the case with plant placement (624 ppm) compared with the case without plant placement (about 1205 ppm). This can reduce the increase in CO2 concentration by the respiration of residents by 50% if the indoor plant leaf area density is maintained at about 14.68% of the floor area (p = 0.11).
In the case with plant placement, students perceived the indoor air quality to be 40% fresher (p = 0.03) and showed a 140% higher acceptability (p = 0.04).
Compared with the case without plant placement, the complaining of SBS symptoms was improved by 108% (p = 0.49). The symptoms were reported in the order of throat dryness (14.0 2%), eye dryness (12.65%), skin dryness (12.06%), and nervous or mental effects of dozing off (9.41%) and drowsiness (7.51%).
In the case with plant placement, students perceived that it was easier to focus on learning by about 120% (p = 0.62). The percentage of “Concentrated” students was 6% higher than that of “Not Concentrated” students. The coefficient of determination (R2) of each variable according to the indoor CO2 concentration was high when plants were placed.
Indoor plants not only provide a visual green effect to improve human comfort, but they also purify indoor air pollutants. Furthermore, it is expected to help the human body to perceive the indoor air quality more sensitively.
Author Contributions
All authors contributed significantly to this study. C.J. and J.A. identified and secured the example buildings used in the study. The data acquisition system and installation of sensors were designed and installed by C.J. J.A. was responsible for data collection. Data analysis was performed by C.J. The manuscript was compiled by C.J. and reviewed by J.A. All authors have read and agreed to the published version of the manuscript.
Funding
This research received no external funding.
Institutional Review Board Statement
The study was conducted according to the guidelines of Ajman University Research Ethics Committee.
Informed Consent Statement
Informed consent was obtained from all subjects involved in the study.
Data Availability Statement
New data were created or analyzed in this study. Data will be shared upon request and consideration of the authors.
Acknowledgments
The authors would like to express their gratitude to Ajman University for the generous support to publish this paper.
Conflicts of Interest
The authors declare no conflict of interest.
References
- Air Quality Index: Sustainable Environment and Infrastructure. 2018. Available online: https://u.ae/en/information-and-services/environment-and-energy/improving-air-quality (accessed on 10 April 2021).
- Sick Building Syndrome: The Killer within. 2011. Available online: https://www.khaleejtimes.com/nation/general/sick-building-syndrome-the-killer-within (accessed on 26 May 2021).
- Hachicha, A.A.; Al-Sawafta, I.; Said, Z. Impact of dust on the performance of solar photovoltaic (PV) systems under United Arab Emirates weather conditions. Renew. Energy 2019, 141, 287–297. [Google Scholar] [CrossRef]
- Sick Buildings Are Leading to Sick UAE Office Workers, Doctors Say. 2016. Available online: https://www.thenationalnews.com/uae/health/sick-buildings-are-leading-to-sick-uae-office-workers-doctors-say-1.175866 (accessed on 26 May 2021).
- Steinemann, A.; Wargocki, P.; Rismanchi, B. Ten questions concerning green buildings and indoor air quality. Build. Environ. 2017, 112, 351–358. [Google Scholar] [CrossRef] [Green Version]
- Kelly, F.J.; Fussell, J.C. Improving indoor air quality, health and performance within environments where people live, travel, learn and work. Atmos. Environ. 2019, 200, 90–109. [Google Scholar] [CrossRef] [Green Version]
- Perez-Padilla, R.; Schilmann, A.; Riojas-Rodriguez, H. Respiratory health effects of indoor air pollution. Int. J. Tuberc. Lung Dis. 2010, 14, 1079–1086. [Google Scholar]
- Spiru, P.; Simona, P.L. A review on interactions between energy performance of the buildings, outdoor air pollution and the indoor air quality. Energy Procedia 2017, 128, 179–186. [Google Scholar] [CrossRef]
- Seguel, J.M.; Merrill, R.; Seguel, D.; Campagna, A.C. Indoor Air Quality. Am. J. Lifestyle Med. 2017, 11, 284–295. [Google Scholar] [CrossRef]
- Lukcso, D.; Guidotti, T.L.; Franklin, D.E.; Burt, A. Indoor environmental and air quality characteristics, building-related health symptoms, and worker productivity in a federal government building complex. Arch. Environ. Occup. Health 2016, 71, 85–101. [Google Scholar] [CrossRef]
- Budaiova, Z.; Vilčeková, S. Assessing the effect of indoor environmental quality on productivity at office work. Sel. Sci. Pap. J. Civ. Eng. 2015, 10, 37–46. [Google Scholar] [CrossRef] [Green Version]
- Johnson, D.L.; Lynch, R.A.; Floyd, E.L.; Wang, J.; Bartels, J.N. Indoor air quality in classrooms: Environmental measures and effective ventilation rate modeling in urban elementary schools. Build. Environ. 2018, 136, 185–197. [Google Scholar] [CrossRef]
- Kamaruzzaman, S.N.; Sabrani, N.A. The effect of indoor air quality (IAQ) towards occupants’ psychological performance in office buildings. J. Des. Built 2011, 4, 49–61. [Google Scholar]
- Geng, Y.; Ji, W.; Lin, B.; Zhu, Y. The impact of thermal environment on occupant IEQ perception and productivity. Build. Environ. 2017, 121, 158–167. [Google Scholar] [CrossRef]
- Tham, K.W. Indoor air quality and its effects on humans—A review of challenges and developments in the last 30 years. Energy Build. 2016, 130, 637–650. [Google Scholar] [CrossRef]
- Wargocki, P.; Wyon, D.P. Ten questions concerning thermal and indoor air quality effects on the performance of office work and schoolwork. Build. Environ. 2017, 112, 359–366. [Google Scholar] [CrossRef] [Green Version]
- Turunen, M.; Toyinbo, O.; Putus, T.; Nevalainen, A.; Shaughnessy, R.; Haverinen-Shaughnessy, U. Indoor environmental quality in school buildings, and the health and wellbeing of students. Int. J. Hyg. Environ. Health 2014, 217, 733–739. [Google Scholar] [CrossRef] [PubMed]
- Merabtine, A.; Maalouf, C.; Hawila, A.A.W.; Martaj, N.; Polidori, G. Building energy audit, thermal comfort, and IAQ assessment of a school building: A case study. Build. Environ. 2018, 145, 62–76. [Google Scholar] [CrossRef]
- Kang, S.; Ou, D.; Mak, C.M. The impact of indoor environmental quality on work productivity in university open-plan research offices. Build. Environ. 2017, 124, 78–89. [Google Scholar] [CrossRef]
- Di Giulio, M.; Grande, R.; Di Campli, E.; Di Bartolomeo, S.; Cellini, L. Indoor air quality in university environments. Environ. Monit. Assess. 2010, 170, 509–517. [Google Scholar] [CrossRef]
- Sekhar, S.; Goh, S. Thermal comfort and IAQ characteristics of naturally/mechanically ventilated and air-conditioned bedrooms in a hot and humid climate. Build. Environ. 2011, 46, 1905–1916. [Google Scholar] [CrossRef]
- Ben-David, T.; Waring, M.S. Impact of natural versus mechanical ventilation on simulated indoor air quality and energy consumption in offices in fourteen U.S. cities. Build. Environ. 2016, 104, 320–336. [Google Scholar] [CrossRef] [Green Version]
- Awbi, H.B. Ventilation for Good Indoor Air Quality and Energy Efficiency. Energy Procedia 2017, 112, 277–286. [Google Scholar] [CrossRef]
- Pereira, L.D.; Raimondo, D.; Corgnati, S.P.; da Silva, M.G. Assessment of indoor air quality and thermal comfort in Portuguese secondary classrooms: Methodology and results. Build. Environ. 2014, 81, 69–80. [Google Scholar] [CrossRef]
- Brilli, F.; Fares, S.; Ghirardo, A.; de Visser, P.; Calatayud, V.; Muñoz, A.; Annesi-Maesano, I.; Sebastiani, F.; Alivernini, A.; Varriale, V.; et al. Plants for Sustainable Improvement of Indoor Air Quality. Trends Plant Sci. 2018, 23, 507–512. [Google Scholar] [CrossRef] [PubMed]
- Cetin, M.; Sevik, H. Measuring the Impact of Selected Plants on Indoor CO2 Concentrations. Pol. J. Environ. Stud. 2016, 25, 973–979. [Google Scholar] [CrossRef]
- Irga, P.; Torpy, F.; Burchett, M. Can hydroculture be used to enhance the performance of indoor plants for the removal of air pollutants? Atmos. Environ. 2013, 77, 267–271. [Google Scholar] [CrossRef]
- Pegas, P.N.; Alves, C.; Nunes, T.; Bate-Epey, E.F.; Evtyugina, M.; Pio, C. Could Houseplants Improve Indoor air Quality in Schools? J. Toxicol. Environ. Health Part A 2012, 75, 1371–1380. [Google Scholar] [CrossRef] [PubMed]
- Irga, P.J.; Paull, N.; Abdo, P.; Torpy, F. An assessment of the atmospheric particle removal efficiency of an in-room botanical biofilter system. Build. Environ. 2017, 115, 281–290. [Google Scholar] [CrossRef]
- Llewellyn, D.; Dixon, M. 4.26 Can plants really improve indoor air quality. In Comprehensive Biotechnology, 2nd ed.; Academic Press: Burlington, MA, USA, 2011; pp. 331–338. [Google Scholar]
- Jasmin, G.A.; Noorizan, M.; Suhardi, M.; Murad, A.G.; Ina, K. The Use of Plants to Improve Indoor Air Quality in Small Office Space. Pertanika J. Soc. Sci. Humanit. 2012, 20, 493–503. [Google Scholar]
- EPA. Indoor Pollutants and Sources: Basic Information on Pollutants and Sources of Indoor Air Pollution. 2021. Available online: https://www.epa.gov/indoor-air-quality-iaq/indoor-pollutants-and-sources (accessed on 4 April 2021).
- de Gennaro, G.; Dambruoso, P.R.; Loiotile, A.D.; Di Gilio, A.; Giungato, P.; Tutino, M.; Marzocca, A.; Mazzone, A.; Palmisani, J.; Porcelli, F. Indoor air quality in schools. Environ. Chem. Lett. 2014, 12, 467–482. [Google Scholar] [CrossRef]
- Chithra, V.S.; Nagendra, S.S. Indoor air quality investigations in a naturally ventilated school building located close to an urban roadway in Chennai, India. Build. Environ. 2012, 54, 159–167. [Google Scholar] [CrossRef]
- Abouleish, M.Z. Indoor air quality and COVID-19. Public Health 2021, 191, 1–2. [Google Scholar] [CrossRef] [PubMed]
- Angelova, R.A.; Stankov, P.; Markov, D.; Velichkova, R.; Simova, I. Human as a physiological source of deterioration of the air quality and comfort conditions indoors. CBU Int. Conf. Proc. 2019, 7, 875–879. [Google Scholar] [CrossRef] [Green Version]
- Jung, C.-C.; Wu, P.-C.; Tseng, C.-H.; Su, H.-J. Indoor air quality varies with ventilation types and working areas in hospitals. Build. Environ. 2015, 85, 190–195. [Google Scholar] [CrossRef]
- Finell, E.; Haverinen-Shaughnessy, U.; Tolvanen, A.; Laaksonen, S.; Karvonen, S.; Sund, R.; Saaristo, V.; Luopa, P.; Ståhl, T.; Putus, T.; et al. The associations of indoor environment and psychosocial factors on the subjective evaluation of Indoor Air Quality among lower secondary school students: A multilevel analysis. Indoor Air 2017, 27, 329–337. [Google Scholar] [CrossRef]
- ICIEE. The International Center for Indoor Environment and Energy at Technical University of Denmark (DTU). 2021. Available online: https://www.iciee.byg.dtu.dk/ (accessed on 8 April 2021).
- Satish, U.; Mendell, M.J.; Shekhar, K.; Hotchi, T.; Sullivan, D.; Streufert, S.; Fisk, W.J. Is CO2 an Indoor Pollutant? Direct Effects of Low-to-Moderate CO2 Concentrations on Human Decision-Making Performance. Environ. Health Perspect. 2012, 120, 1671–1677. [Google Scholar] [CrossRef] [PubMed] [Green Version]
- Wolverton, B.C.; Nelson, M. Using plants and soil microbes to purify indoor air: Lessons from NASA and Biosphere 2 experiments. Field Actions Sci. Rep. J. Field Actions 2020, 21, 54–59. [Google Scholar]
- Wheeler, R.M. Plants for human life support in space: From Myers to Mars. Gravit. Space Res. 2010, 23, 25–36. [Google Scholar]
- Aydogan, A.; Cerone, R. Review of the effects of plants on indoor environments. Indoor Built Environ. 2021, 30, 442–460. [Google Scholar] [CrossRef]
- Torpy, F.; Zavattaro, M. Bench-Study of Green-Wall Plants for Indoor Air Pollution Reduction. J. Living Arch. 2018, 5, 1–15. [Google Scholar] [CrossRef]
- Su, Y.-M. CO2 Purify Effect on Improvement of Indoor Air Quality (IAQ) Through Indoor Vertical Greening. In Transactions on Engineering Technologies; Springer: Dordrecht, The Netherlands, 2014; pp. 569–580. [Google Scholar]
- Oh, H.-J.; Nam, I.-S.; Yun, H.; Kim, J.; Yang, J.; Sohn, J.-R. Characterization of indoor air quality and efficiency of air purifier in childcare centers, Korea. Build. Environ. 2014, 82, 203–214. [Google Scholar] [CrossRef]
- Sheng, Y.; Fang, L.; Sun, Y. An experimental evaluation on air purification performance of Clean-Air Heat Pump (CAHP) air cleaner. Build. Environ. 2018, 127, 69–76. [Google Scholar] [CrossRef]
- Raanaas, R.K.; Patil, G.G.; Hartig, T. Effects of an Indoor Foliage Plant Intervention on Patient Well-being during a Residential Rehabilitation Program. HortScience 2010, 45, 387–392. [Google Scholar] [CrossRef]
- McArthur, J.; Powell, C. Health and wellness in commercial buildings: Systematic review of sustainable building rating systems and alignment with contemporary research. Build. Environ. 2020, 171, 106635. [Google Scholar] [CrossRef]
- Kim, J.; Cha, S.H.; Koo, C.; Tang, S.-K. The effects of indoor plants and artificial windows in an underground environment. Build. Environ. 2018, 138, 53–62. [Google Scholar] [CrossRef]
- Torpy, F.; Irga, P.; Burchett, M. Profiling indoor plants for the amelioration of high CO2 concentrations. Urban For. Urban Green. 2014, 13, 227–233. [Google Scholar] [CrossRef]
- Gunawardena, K.; Steemers, K. Living walls in indoor environments. Build. Environ. 2019, 148, 478–487. [Google Scholar] [CrossRef]
- Han, K.-T. Influence of passive versus active interaction with indoor plants on the restoration, behaviour and knowledge of students at a junior high school in Taiwan. Indoor Built Environ. 2018, 27, 818–830. [Google Scholar] [CrossRef]
- Ikei, H.; Komatsu, M.; Song, C.; Himoro, E.; Miyazaki, Y. The physiological and psychological relaxing effects of viewing rose flowers in office workers. J. Physiol. Physiol. 2014, 33, 1–5. [Google Scholar] [CrossRef] [Green Version]
- Lee, M.-S.; Lee, J.; Park, B.-J.; Miyazaki, Y. Interaction with indoor plants may reduce psychological and physiological stress by suppressing autonomic nervous system activity in young adults: A randomized crossover study. J. Physiol. Anthr. 2015, 34, 1–6. [Google Scholar] [CrossRef] [PubMed] [Green Version]
- Ikei, H.; Song, C.; Igarashi, M.; Namekawa, T.; Miyazaki, Y. Physiological and psychological relaxing effects of visual stimulation with foliage plants in high school students. Adv. Hortic. Sci. 2014, 28, 111–116. [Google Scholar]
- Qin, J.; Sun, C.; Zhou, X.; Leng, H.; Lian, Z. The effect of indoor plants on human comfort. Indoor Built Environ. 2014, 23, 709–723. [Google Scholar] [CrossRef]
- Park, S.-A.; Song, C.; Choi, J.-Y.; Son, K.-C.; Miyazaki, Y. Foliage Plants Cause Physiological and Psychological Relaxation as Evidenced by Measurements of Prefrontal Cortex Activity and Profile of Mood States. HortScience 2016, 51, 1308–1312. [Google Scholar] [CrossRef]
- Kurazumi, Y.; Kondo, E.; Fukagawa, K.; Hashimoto, R.; Nyilas, A.; Sakoi, T.; Tsuchikawa, T. The Influence of Foliage Plants on Psychological and Physiological Responses. Health 2017, 9, 601. [Google Scholar] [CrossRef] [Green Version]
- Choi, J.-Y.; Park, S.-A.; Jung, S.-J.; Lee, J.-Y.; Son, K.-C.; An, Y.-J.; Lee, S.-W. Physiological and psychological responses of humans to the index of greenness of an interior space. Complement. Ther. Med. 2016, 28, 37–43. [Google Scholar] [CrossRef]
- Bhargava, B.; Malhotra, S.; Chandel, A.; Rakwal, A.; Kashwap, R.R.; Kumar, S. Mitigation of indoor air pollutants using Areca palm potted plants in real-life settings. Environ. Sci. Pollut. Res. 2021, 28, 8898–8906. [Google Scholar] [CrossRef]
- Oh, G.S.; Jung, G.J.; Seo, M.H.; Bin Im, Y. Experimental study on variations of CO2 concentration in the presence of indoor plants and respiration of experimental animals. Hortic. Environ. Biotechnol. 2011, 52, 321–329. [Google Scholar] [CrossRef]
- Sayed, E.L.; Naema, I. Purification of Indoor Air from Pollutants by Areca Palm (Chrysalidocarpus lutescens L.) Treated with some Non-Enzymatic Antioxidants. J. Plant Prod. 2020, 11, 455–463. [Google Scholar]
- Apte, M.G.; Apte, J.S. A Pilot Study of the Effectiveness of Indoor Plants for Removal of Volatile Organic Compounds in Indoor Air in a Seven-Story Office Building (No. LBNL-3368E); Lawrence Berkeley National Lab (LBNL): Berkeley, CA, USA, 2010. [Google Scholar]
- Kulkarni, K.A.; Zambare, M.S. The Impact Study of Houseplants in Purification of Environment Using Wireless Sensor Network. Wirel. Sens. Netw. 2018, 10, 59–69. [Google Scholar] [CrossRef] [Green Version]
- Khansaheb, A. Let’s Not Forget Indoor Air Quality as Well. 2020. Available online: https://gulfnews.com/business/analysis/lets-not-forget-indoor-air-quality-as-well-1.1589873286956#:~:text=The%20Dubai%20Municipality%20standard%20for,of%20continuous%20monitoring%20pre-occupancy (accessed on 12 April 2021).
- DEWA. Green Building Regulations & Specifications. 2021. Available online: https://www.dewa.gov.ae/~/media/Files/Consultants%20and%20Contractors/Green%20Building/Greenbuilding_Eng.ashx (accessed on 4 April 2021).
- Rosbach, J.T.; Vonk, M.; Duijm, F.; Van Ginkel, J.T.; Gehring, U.; Brunekreef, B. A ventilation intervention study in classrooms to improve indoor air quality: The FRESH study. Environ. Health 2013, 12, 1–10. [Google Scholar] [CrossRef] [Green Version]
- Spiegelhalter, D. Introducing The Art of Statistics: How to Learn from Data. Numeracy 2020, 13, 7. [Google Scholar] [CrossRef] [Green Version]
- ASHRAE. Thermal Environment Conditions for Human Occupancy. 2013. Available online: https://www.ashrae.org/File%20Library/Technical%20Resources/Standards%20and%20Guidelines/Standards%20Addenda/55_2010_opq_Final_08012013.pdf (accessed on 4 April 2021).
- GhaffarianHoseini, A.; AlWaer, H.; Omrany, H.; GhaffarianHoseini, A.; Alalouch, C.; Clements-Croome, D.; Tookey, J. Sick building syndrome: Are we doing enough? Arch. Sci. Rev. 2018, 61, 99–121. [Google Scholar] [CrossRef] [Green Version]
- Sarkhosh, M.; Najafpoor, A.A.; Alidadi, H.; Shamsara, J.; Amiri, H.; Andrea, T.; Kariminejad, F. Indoor Air Quality associations with sick building syndrome: An application of decision tree technology. Build. Environ. 2021, 188, 107446. [Google Scholar] [CrossRef]
- Gubb, C.; Blanusa, T.; Griffiths, A.; Pfrang, C. Can houseplants improve indoor air quality by removing CO2 and increasing relative humidity? Air Qual. Atmos. Health 2018, 11, 1191–1201. [Google Scholar] [CrossRef] [Green Version]
- Zhang, X.; Zhao, Z.; Nordquist, T.; Norbäck, D. The prevalence and incidence of sick building syndrome in Chinese pupils in relation to the school environment: A two-year follow-up study. Indoor Air 2011, 21, 462–471. [Google Scholar] [CrossRef] [PubMed]
- Abdo, P.; Huynh, B.P.; Irga, P.; Torpy, F.R. Evaluation of air flow through an active green wall biofilter. Urban For. Urban Green. 2019, 41, 75–84. [Google Scholar] [CrossRef]
- Lee, E. Indoor environmental quality (IEQ) of LEED-certified home: Importance-performance analysis (IPA). Build. Environ. 2019, 149, 571–581. [Google Scholar] [CrossRef]
- Fleck, R.; Gill, R.; Pettit, T.; Irga, P.; Williams, N.; Seymour, J.; Torpy, F. Characterisation of fungal and bacterial dynamics in an active green wall used for indoor air pollutant removal. Build. Environ. 2020, 179, 106987. [Google Scholar] [CrossRef]
- Pettit, T.; Irga, P.; Abdo, P.; Torpy, F. Do the plants in functional green walls contribute to their ability to filter particulate matter? Build. Environ. 2017, 125, 299–307. [Google Scholar] [CrossRef]
- Parsaee, M.; Demers, C.M.; Hébert, M.; Lalonde, J.-F.; Potvin, A. A photobiological approach to biophilic design in extreme climates. Build. Environ. 2019, 154, 211–226. [Google Scholar] [CrossRef]
- Yin, J.; Zhu, S.; MacNaughton, P.; Allen, J.G.; Spengler, J.D. Physiological and cognitive performance of exposure to biophilic indoor environment. Build. Environ. 2018, 132, 255–262. [Google Scholar] [CrossRef]
- Srikanth, P.; Sudharsanam, S.; Steinberg, R. Bio-aerosols in indoor environment: Composition, health effects and analysis. Indian J. Med. Microbiol. 2008, 26, 302. [Google Scholar] [CrossRef]
- Zhang, H.; Yoshino, H. Analysis of indoor humidity environment in Chinese residential buildings. Build. Environ. 2010, 45, 2132–2140. [Google Scholar] [CrossRef]
Figure 1.
J2 Building at Ajman University in the United Arab Emirates.

Figure 2.
The target classrooms in the J2 Building at Ajman University.

Figure 3.
The target plant, the areca palm tree.

Figure 4.
Changes in CO2 with or without plants.

Figure 5.
CO2 concentration with or without plants.

Figure 6.
The perception of freshness according to the CO2 concentration.

Figure 7.
Indoor air quality acceptance according to the CO2 concentration.

Figure 8.
The perception of freshness with or without plant placement.

Figure 9.
Indoor air quality acceptance with or without plant placement.

Figure 10.
The frequency of SBS symptoms according to the CO2 concentration.

Figure 11.
The frequency of SBS symptoms with or without plant placement.

Figure 12.
The frequency of concentration according to the CO2 concentration.

Figure 13.
The frequency of concentration with or without plant placement.

Figure 14.
The distribution of learning concentrations according to plant placement.


Table 1.
O2 and CO2 concentrations for different air purification plants.
| Air Purification Plants | O2 Concentration (%) | CO2 Concentration (ppm) | CO2/O2 of Plants for a Given Fixed Time | ||
|---|---|---|---|---|---|
| T = 0 h | T = 7 h | T = 0 h | T = 7 h | Ratio | |
| Areca Palm | 18.56 | 21.33 | 428 | 419 | 3:1 |
| Tulasi | 18.56 | 22.30 | 429 | 410 | 4:1 |
| Aloevera | 19.12 | 21.07 | 428 | 418 | 5:1 |
| Peace Lily | 19.00 | 20.62 | 428 | 420 | 4:1 |
| Devils Ivy | 19.00 | 21.00 | 428 | 420 | 4:1 |
| Snake Plant | 19.00 | 21.00 | 429 | 419 | 5:1 |
| Orchids | 19.00 | 21.10 | 429 | 421 | 4:1 |
| Lady Palm | 19.00 | 21.32 | 427 | 419 | 3:1 |
| Rubber Plant | 19.00 | 21.24 | 426 | 418 | 3:1 |
| English Ivy | 19.00 | 21.18 | 427 | 419 | 3:1 |
Table 2.
Measurement equipment.
| Measurement Equipment | Measuring Items | Range | Resolution | Type |
|---|---|---|---|---|
| Temperature and Humidity Data Logger (RS PRO RS-172TK) | Temperature (°C) | −60–155 | 0.1 | |
| Humidity (%) | 10–95 | 1 | ||
| Globe Temperature (°C) | −60–155 | 0.1 | ||
| PMV Meter (AM-101) | Air Flow(m/s) | 0–1 1–5 | ±0.1 ±0.5 | |
| Light Meter (DL7040) | Illumination (lx) | 0–10,000 lx | 1 lx | |
| IAQ Analyzer (IQ Analyzer 6400) | CO2 (ppm) | 0–5000 | 1 | NDIR |
Table 3.
Indoor environment in target classrooms (5 min before the end of class).
| CO2 (ppm) | Lux (lx) | Ta (°C) | MRT (°C) | Va (m/s) | RH (%) | OT (°C) | PMV | |
|---|---|---|---|---|---|---|---|---|
| Mean | 2078 | 580 | 24.30 | 24.44 | 0.02 | 44.20 | 24.44 | 0.12 |
| Standard Deviation | 696 | 230 | 1.12 | 1.10 | 0.01 | 18.32 | 1.08 | 0.45 |
Table 4.
Sick building syndrome symptoms and frequencies.
| # | Symptoms | % | # | Symptoms | % |
|---|---|---|---|---|---|
| 1 | Throat Dryness | 14.02 | 15 | Ears: Itchy | 2.24 |
| 2 | Eyes Dryness | 12.65 | 16 | Throat: Mucus | 1.99 |
| 3 | Skin Dryness | 12.06 | 17 | Ears: Hearing Loss | 1.81 |
| 4 | Nerve/Mental: Dozing Off | 9.41 | 18 | Throat: Itchy | 1.41 |
| 5 | Nerve/Mental: Drowsiness | 7.51 | 19 | Throat: Coughing | 1.15 |
| 6 | Nerve/Mental: Tiredness | 6.62 | 20 | Nerve/Mental: Dizziness | 0.91 |
| 7 | Nose: Itchy | 5.11 | 21 | Eyes: Red Eyes | 0.71 |
| 8 | Throat: Stinging | 3.38 | 22 | Nerve/Mental: Nervousness | 0.64 |
| 9 | Nerve/Mental: Less Concentration | 3.08 | 23 | Eyes: Glare | 0.51 |
| 10 | Eyes: Stinging | 2.96 | 24 | Skin: Stinging | 0.32 |
| 11 | Ears: Tinnitus | 2.95 | 25 | Nerve/Mental: Anger | 0.31 |
| 12 | Nose: Sneezing | 2.77 | 26 | Nose: Pungent Smell | 0.27 |
| 13 | Nerve/Mental: Headache | 2.76 | 27 | Nerve/Mental: Absent Mindedness | 0.13 |
| 14 | Skin: Itchy | 2.31 | Total | 100 | |
Publisher’s Note: MDPI stays neutral with regard to jurisdictional claims in published maps and institutional affiliations. |
© 2021 by the authors. Licensee MDPI, Basel, Switzerland. This article is an open access article distributed under the terms and conditions of the Creative Commons Attribution (CC BY) license (https://creativecommons.org/licenses/by/4.0/).
Share and Cite
MDPI and ACS Style
Jung, C.; Awad, J. Improving the IAQ for Learning Efficiency with Indoor Plants in University Classrooms in Ajman, United Arab Emirates. Buildings 2021, 11, 289. https://0-doi-org.brum.beds.ac.uk/10.3390/buildings11070289
AMA Style
Jung C, Awad J. Improving the IAQ for Learning Efficiency with Indoor Plants in University Classrooms in Ajman, United Arab Emirates. Buildings. 2021; 11(7):289. https://0-doi-org.brum.beds.ac.uk/10.3390/buildings11070289
Chicago/Turabian StyleJung, Chuloh, and Jihad Awad. 2021. "Improving the IAQ for Learning Efficiency with Indoor Plants in University Classrooms in Ajman, United Arab Emirates" Buildings 11, no. 7: 289. https://0-doi-org.brum.beds.ac.uk/10.3390/buildings11070289
Note that from the first issue of 2016, this journal uses article numbers instead of page numbers. See further details here.