
Mapping Buildings’ Energy-Related Features at Urban Level toward Energy Planning


Department of Architecture, Built Environment and Construction Engineering (ABC), Politecnico di Milano, 20133 Milano, Italy
*
Author to whom correspondence should be addressed.
Buildings 2021, 11(8), 322; https://0-doi-org.brum.beds.ac.uk/10.3390/buildings11080322
Submission received: 23 June 2021
/
Revised: 21 July 2021
/
Accepted: 23 July 2021
/
Published: 27 July 2021
(This article belongs to the Section Building Energy, Physics, Environment, and Systems)
Abstract
:To boost energy efficiency in the building sector at urban and district scales, the use of a Geographic Information System (GIS) for data collection and energy spatial analysis is relevant. As highlighted in many studies on this topic reported in literature, the correlation among available databases is complex due to the different levels of information. As the first part of a wide research aimed at estimating the energy demand of urban buildings, we present in this article a focus on the details of the GIS-based procedure developed to assess the main energy-related features of existing building stocks. The procedure is based on the elaboration of data from the Italian Topographic Databases, under provision at the national level according to the INSPIRE European Directive and the national General Census of Population and Houses. It enables one to calculate and map the urban built volume characterized by mostly diffuse use categories in an urban context (residential and offices), to which different equipment and building usage patterns can be associated, and by construction periods, featuring different technological solutions. The method has been applied to the city of Milan (Italy). An insight into the outcomes from the overall method of the wider research is also reported.
1. Introduction
Worldwide, cities are expected to increase their population by two-thirds by 2050, hand in hand with their energy demands [1]. To satisfy this growing energy demand, while reducing the related greenhouse gas (GHG) emissions, academic research and policies have been supporting the diffusion of energy strategies for decades. Notably, the existing building sector is responsible for a large share of the energy demand [2], and through the implementation of deep retrofit measures (i.e., retrofit of envelope and thermal systems, renewable sources integration, and district heating/cooling connection), relevant results can be obtained.
However, to evaluate the potential effectiveness of retrofit measures, for an overall urban stock or the buildings of selected urban areas, it is paramount to assess the energy-related features of current buildings. Several attempts to define proper methods [3] and tools [4] for the modeling of urban energy systems have been reported in the literature, although research on this topic is still in progress. In this frame, the use of Geographic Information Systems (GIS) is considered promising, as they allow the assessment of the dimension and spatial distribution of the energy systems, which correlate to efficiency and environmental impacts [5].
Considering the large body of literature on existing GIS-based building energy models, an overview to investigate which data are commonly adopted, alongside their main strengths and limitations, is outlined hereinafter.
The use of GIS is widely considered beneficial in urban planning. It encompasses several functions, ranging from collection, storage, and visualization of georeferenced databases to the correlation of spatial and analytical data, calculation of missed variables, and integration with other tools for exporting/importing data or enhancing the level of detail of the calculations. In the field of energy planning, the use of GIS rather offers an added value, as it can provide insights on the relevant buildings’ features of the assessed built urban area [6].
For instance, in the literature, it is possible to find studies concerning the spatial assessments and/or estimations of the urban energy demand, either at district or urban scales. Applications have been found for Bologna [7], St. Gallen and Zernez (Switzerland) [8], Milan [9], Geneva [10], Ladispoli (Italy) [11], Houston [12], New York [13,14], Lisbon [15], Turin [16], Gleisdorf (Austria) [17], Borlänge (Sweden) [18], London [19], Settimo Torinese (Italy) [20], Busan (Korea) [21], and the Canton Ticino area (Switzerland) [22,23]. Other surveyed studies have also provided to the spatial assessments of the potential energy savings from buildings retrofit, such as in the studies of Caputo and Pasetti [24], applied to the Italian city of Senago; and of Mastrucci et al. [25], applied to Rotterdam city. Others have included the assessment of the potential energy supply from renewable sources, as in the case of [26] whose case study was the city of London, and the integration of smart energy strategies, as in the cases of [6,27], respectively, focused on the building stocks of Oldenburg (Germany) and Zug (Switzerland) cities.
As extensively discussed in the review of Reinhart and Davila [28], to implement an energy model of urban buildings, it is necessary to obtain a large amount of data concerning the definition of climate, orography, and urban texture, and the technological and physical characteristics of buildings. For instance, in the study of Pampuri et al. [23], even thirteen different databases were used for modeling the urban energy demand and identifying areas potentially suitable for district heating networks; in the study of Sarralde [26], eighteen indicators were derived in order to analyze the urban morphology toward investigating the solar energy potential. Given the recent growing diffusion of public spatial data, some of these are already available in several contexts, but there is still an ongoing issue regarding their integration when coming from different sources, due to rare mutual consistency [29] and raw data quality [30]. As an example, in the studies of Caputo et al. [9] and Belussi et al. [7], geometric data were available at the building level, while data on the period of construction were available at the census unit level. Moreover, concerning the building use category information, in these two studies, data at the census unit level and at the building level, respectively, were utilized, thus leading to estimation of the energy performance at different spatial scales. Yeo et al. [21] identified the building block as the proper scale for facing the lack of data at the building level in the urban context and, thus, divided the studied area in square cells of 40,000 m2 toward assessing their energy demand. Likewise, in the study of Mastrucci et al. [25], data about measured natural gas and electricity consumptions were available at the postal code area level, while the availability of building features was at the address level. As such, it was necessary to adopt a statistical method capable of extracting energy use for each dwelling. In the study of Quintana et al. [18], data on the punctual energy consumptions were associated to the related polygonal geometries of buildings, employing a prior harmonization of coordinates and their spatial overlaying. Finally, in the study of Howard et al. [13], data were collected for each property, so they ranged heterogeneously from the single building unit scale to the buildings group scale.
To model the urban/district energy demand, adopted approaches refer to top-down and bottom-up methods. The formers allow the estimation of urban level energy demand based on aggregated input data (e.g., regional/national level energy demand) through econometric or technological correlations. In contrast, the latter was based on subordinated input data (e.g., building-level data) and highly detailed and reliable calculations. Modeling with high detail each building of an urban area is impractical; hence, in the case of bottom-up approaches, to overcome the data availability and computational effort issues, it is quite common to model a set of representative buildings (which could be real samples or archetypes) and associate their energy demands to the other similar buildings in the given area [3]. Such representative buildings are classified based on some energy-related features, although there is no agreement yet on which variables are the least ones to be considered. Ma and Cheng [14] outlined an interesting framework on the major challenges of data processing in urban energy models, including the selection of proper variables, and outlined that the literature ranges from more easily applicable approaches relying on few features to other approaches that are more accurate but, at the same time, more time-consuming. Among the possible energy-related features, the building use category is one of the most adopted ones. Based on that, it is possible to associate different equipment, usage patterns, and related energy behavior to the given buildings [31]. For instance, Howard et al. [13] considered only the buildings use category while following studies that used it in combination with other variables. Another common energy-related feature is the buildings’ construction period, thanks to which it is possible to associate typical construction solutions and, thus, envelope thermophysical performances, generally based on the technical literature or standards [32]. Additionally, the building shape, often accounted through the surface-to-volume ratio, allows one to take into account the magnitude of the dispersing envelope in the thermal energy balance [19]. For instance, in the study of Groppi et al. [11], building archetypes, from the TABULA project Italian database and defined based on use, age, and surface-to-volume ratio, were associated with the buildings under study based on the known construction period; Mutani et al. [16] considered the surface-to-volume ratio, the period of construction, and the heated volume. In other studies, further variables were included: Heiple and Sailor [12] and Nageler [17] considered the period of construction, the use category, and the fuel of installed thermal systems; Fonseca and Schlueter [27] considered the period of construction, the use category, and the thermal systems typology; Saretta et al. [22] based the energy demand estimation of the residential buildings on the floor surface and period of construction while also analyzing other variables for estimating the potential of building-integrated photovoltaics retrofit of façades (e.g., façade surface and incident radiation); Monteiro et al. [15] argued that more variables should be considered at the urban/district level (in particular, they considered the period of construction, the size class, the roof type, and the neighboring). Conversely, de Oliveira et al. [10] compared five different district heating networks in the studied urban area and observed a homogeneous behavior in terms of load curves regardless of the variety in terms of building category and building age. Summarizing, in most of the surveyed studies, buildings were characterized according to three main variables, which allow one to find a balance between accuracy and replicability, considering the widespread lack of data and poor quality: the building shape, often based on the surface-to-volume ratio that is correlated to the quantity of external surfaces area; the building use category, which is correlated to the building internal settings and thermal systems operation; and the building period of construction, which is correlated to the envelope thermal properties.
To better highlight these critical points, Table 1 summarizes the heterogeneous local data sources adopted in the selected literature for characterizing through GIS-based procedures the building stock by the surveyed main features affecting the energy demand of buildings (the building shape, the period of construction, and the use category).
In contrast to the heterogeneity of available data sources, the European Union (EU) is boosting the harmonization of spatial data collection from the Member States toward energy and environmental policies and, to that aim, issued the European Directive 2007/2/EC, laying down general rules to establish the Infrastructure for Spatial Information in the European Community (INSPIRE) [33]. Considering this, a standardized procedure for supporting urban energy planners and researchers in integrating the large amount of big data is necessary.
As a novelty, in this article, a GIS-based procedure is presented to assess the main features of an existing building stock processing information coming from different public databases under the INSPIRE Directive umbrella. In detail, the developed procedure allows the estimation and mapping of the urban built conditioned volume of the residential and offices building uses, which are the categories most diffuse and likely of interest by wide energy plans in urban areas, characterized by different construction periods. Furthermore, the existing literature has focused on the analysis of the energy demand assessment and on the obtained results, just mentioning the data sources initially used for mapping the energy-related features of the buildings, therefore neglecting an in-depth and step-by-step description of the procedure carried out for implementing and integrating data. For instance, Belussi et al. [7] only mentioned the need for correlating the adopted databases through the spatial vector overlaying function, missing the detailed discussion on the whole set of actions. Torabi Moghadam et al. [20] mentioned the main operational steps and the used generic data without giving details on the used GIS automatic functions and precise data. In few surveyed studies, a partial description of some steps of the whole GIS-based procedures was included. For instance, Buffat et al. [8] described in detail the procedures for obtaining the building heights through the difference between the heights from the Digital Surface Model and the Digital Terrain Model, the wall area shared between both buildings through the buffer region option, and the roof slope. Alhamwi et al. [6] described how they obtained the data from Open Street Map (OSM) but neglected most of the description of data filtering and data integration. Summarizing, as emphasized by Monteiro et al. [15], the lack of information about the problems found, the workload involved, and the quality of the input data and sources used to create the urban energy models hampers the potential benefits of data reuse to the research of novel trends, patterns, and relationships and causes a shorter longevity of these models.
The aim of the present article was to develop a method to overcome this lack of information, focusing on the detailed description of the first part of a broader research, where a method was developed for quantifying and mapping the buildings’ energy demand of the urban areas within Italy, referring to the city of Milan as the first application case study, and whose additional details and results are going to be described in a further article.
2. Materials and Methods
The procedure developed to calculate and mapping the urban built volume distribution by construction age and use category is described in detail in the following subsections. It refers to the residential and office buildings being the most diffuse categories in the urban context to which energy retrofit planning can be widely referred. Indeed, according to the national Building Register [34], the residential and office building stock volumes are the highest ones covering 77% of the building stock. The Geo-database has been implemented with the open-source software QGIS 2.18.14 [35], including some routines developed in the embedded Python console 2.7 [36] to accomplish the most complex calculations.
2.1. Pre-Processing
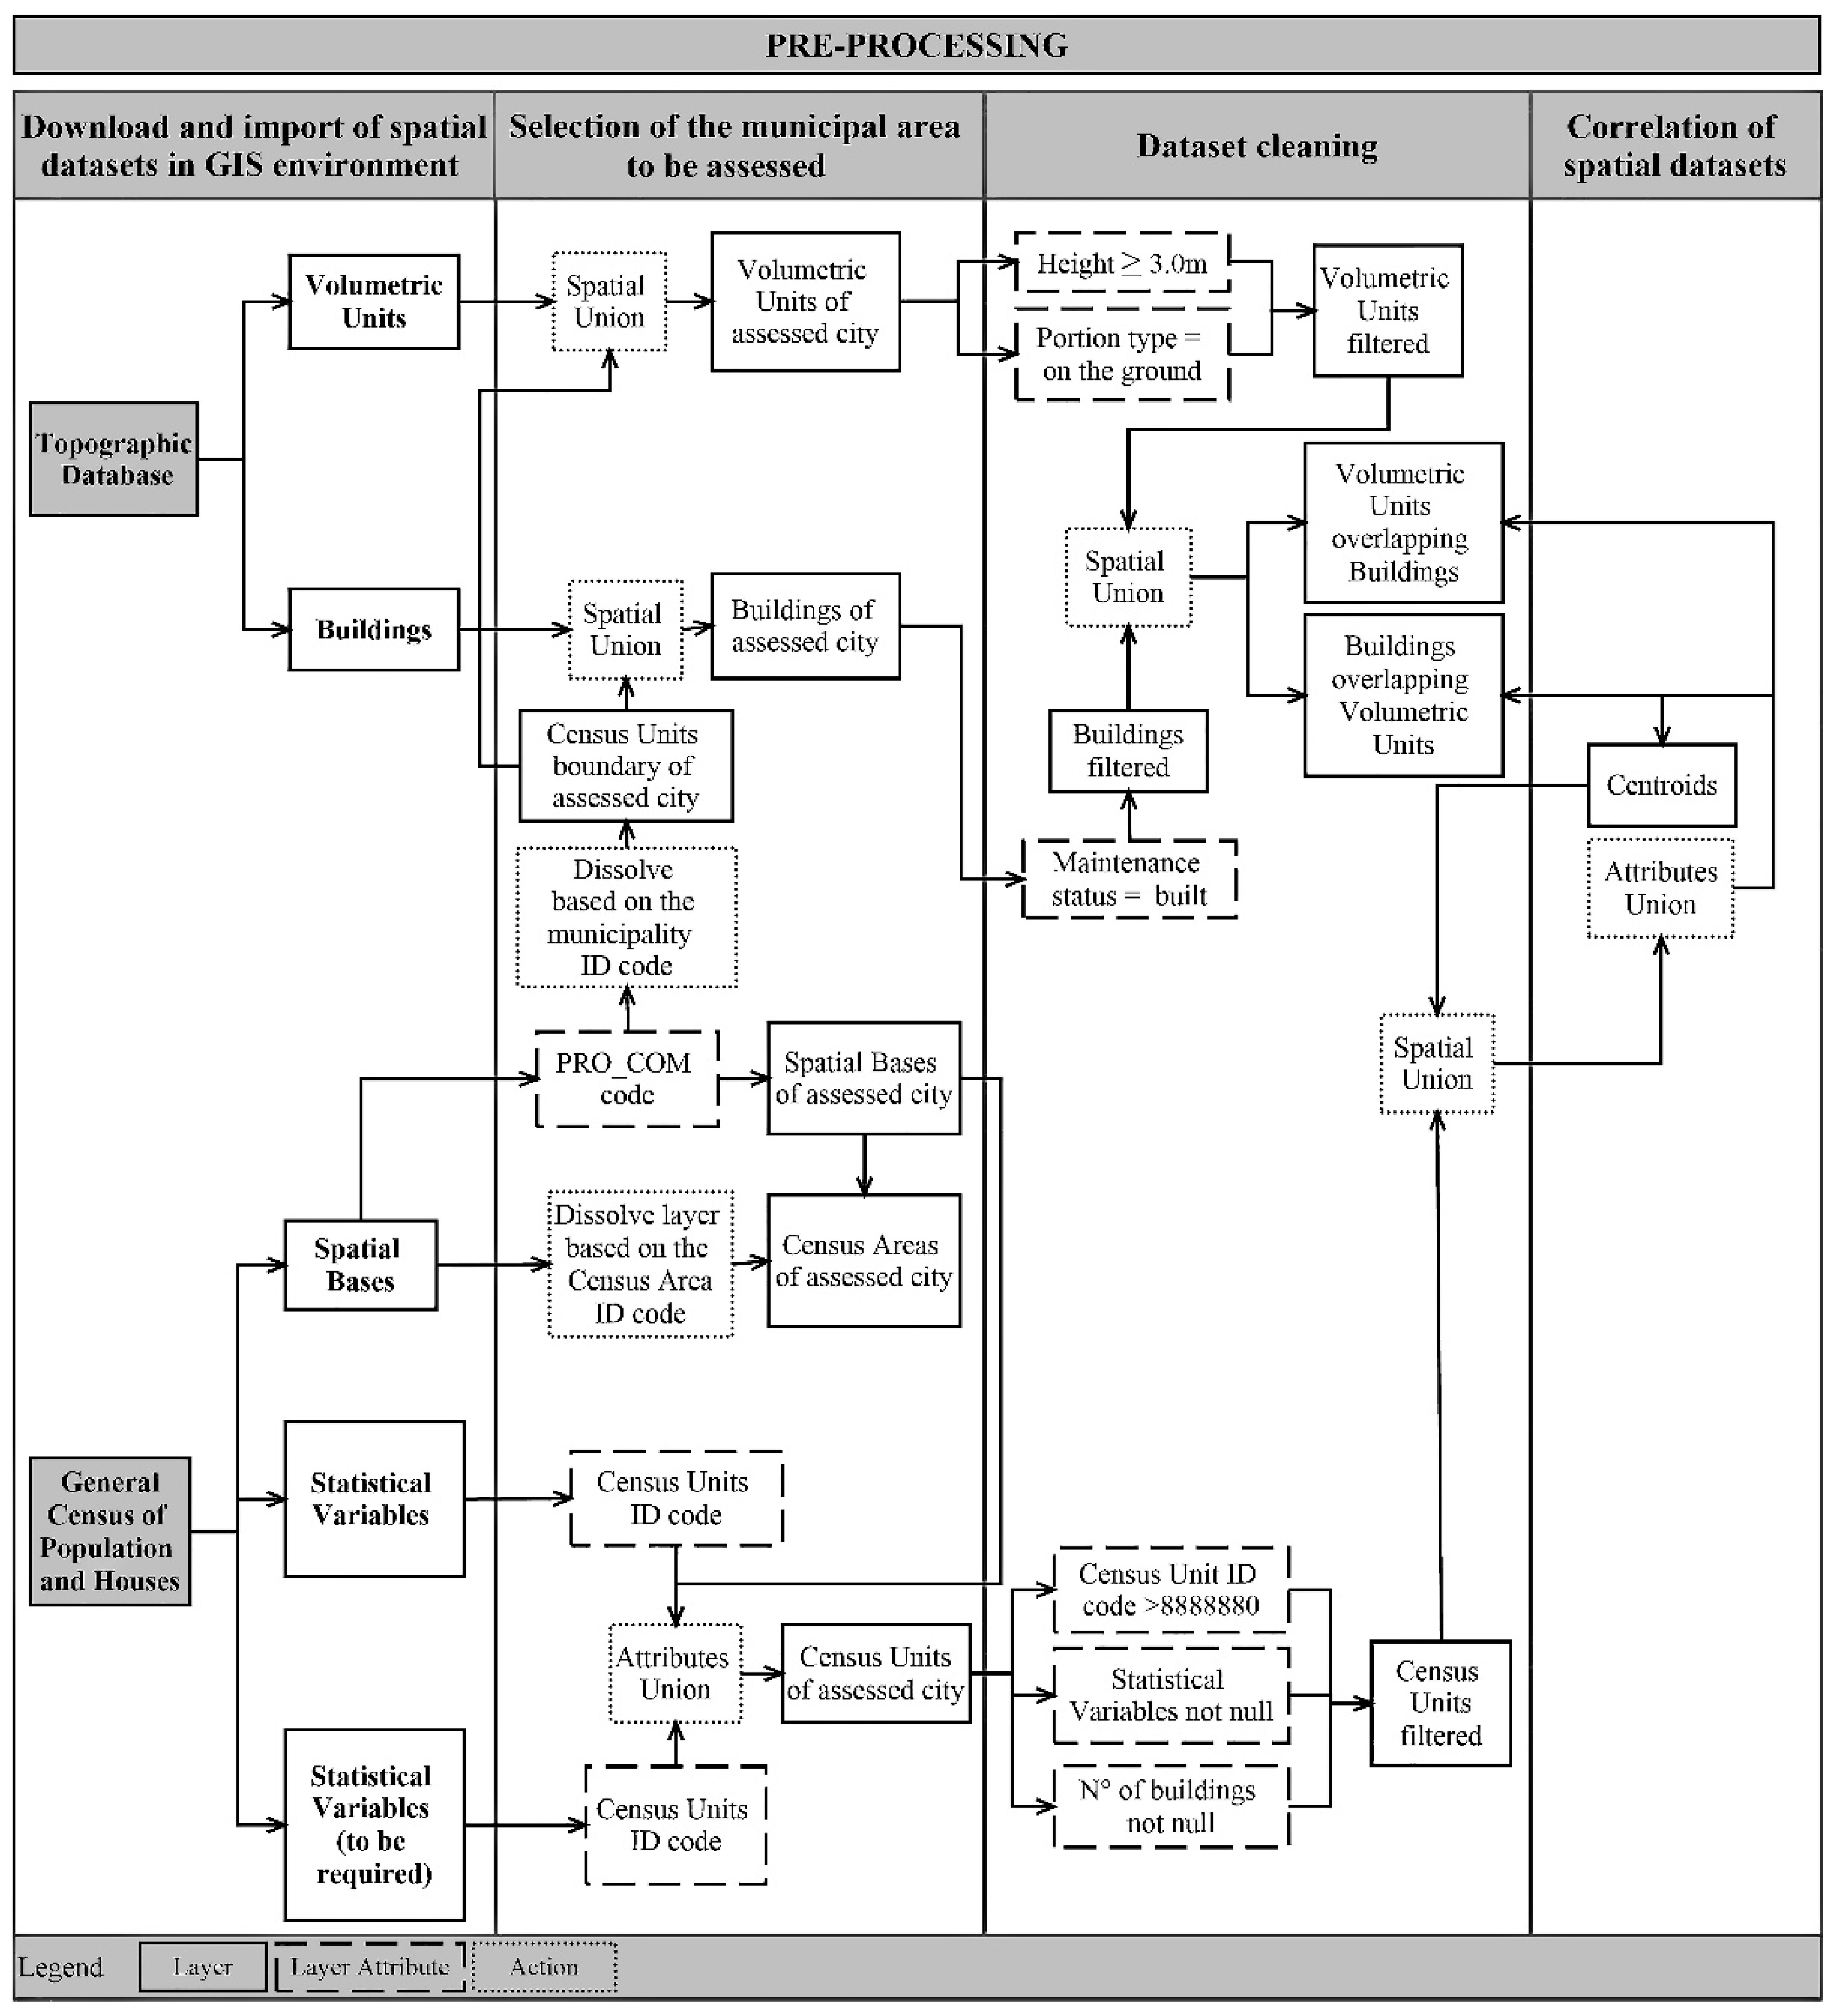
The first step considers some preliminary actions for the data pre-processing, i.e., the download and import of spatial data, the selection of the area under study, the data cleaning, and the spatial correlation. The flowchart of the pre-processing procedure outlined in the following is reported in Figure 1.
2.1.1. Download and Import of Spatial Datasets in GIS Environment
According to the INSPIRE Directive [33], the spatial datasets regarding statistical units (i.e., the units for dissemination or use of statistical information) and buildings are included among those to be implemented by the Member States. Moreover, the document concerning the INSPIRE specifications of the theme “Buildings” [37] includes the physical information (height, number of floors, and elevation) among the core ones, although it offers a flexible approach.
Hence, the so-called Topographic Database (TDb), which was introduced in Italy in 2011 [38] and is currently under standardization according to the specifications reported in [39], has been used in this study for assessing the built volume. The TDb, in fact, is a relational database of georeferenced and continuously updatable data encompassing all fundamental information for describing the built and natural environment. It is based on a hierarchical structure whose mandatory unit is the Class (i.e., a set of geometries associated with topological and informative data, named Attributes). In particular, the Classes adopted for the present study were the Volumetric Units and the Buildings. The former ones are defined as built volumes featured by information on footprint surface and elevation. The latter ones are continuously built volumes, each one featured by a unique typology (e.g., detached house, terraced, and tower), use category, and status of maintenance. Moreover, the Buildings can correspond to the sum of more adjacent Volumetric Units. Among the mentioned attributes, those that have been used for this study are listed in Table 2, where the use categories are not reported, because the TDb considers only offices of the public sector and banks, while it mixes private offices with the residential category.
In order to fill this gap, the present study has relied on data collected by the National Institution of Statistics (Istat) during the 15th General Census of Population and Houses (GCPH) [40]. These data are publicly provided [41] through two sources: the Spatial Bases, which allow georeferencing statistical units at different levels (e.g., building block, district, municipality, and province); and the Statistical Variables, which are a selection of statistical data clustered according to five categories (i.e., population, foreign population, families, dwellings, and buildings) aggregated at each statistical unit level. The data adopted for the present study are listed in Table 3 and described in the following. Two Spatial Bases have been adopted: the Census Units, i.e., the minimum statistical unit, often corresponding to a building block; and the Census Area (ACE), i.e., the aggregation of some contiguous and homogeneous Census Units reaching a total population of 13,000–18,000 inhabitants. Along with these, Statistical Variables, aggregated for each Census Unit, selected from the categories of dwellings and buildings, have been considered. Moreover, as already pointed out in [9], the open data from the GCPH about the age and use of buildings (number of residential buildings by the period of construction and number of nonresidential buildings) do not enable the appreciation of their detailed consistency. Thus, more precise data have been required from Istat to overcome this issue. In detail, concerning the ages of the buildings, it has been possible to obtain the number of building units (either residential or private offices and studios) within residential buildings per each one of the nine defined periods of construction (i.e., <1919, 1919–45, 1945–60, 1961–70, 1971–80, 1981–90, 1991–2000, 2001–05, and >2005). Concerning the uses of the buildings, the open data on the residential units and the number of office buildings (or building complexes) among the nonresidential ones have been used.
2.1.2. Selection of the Municipal Area to Be Assessed
As the whole spatial databases are often available at a larger level than the city level (e.g., provincial and regional), it is necessary to select the specific urban area of interest. Accordingly, as the GCPH Spatial Bases are also identified through a city identification code (i.e., PRO_COM), they have been grouped to define a city boundary. Then, the objects from the TDb data overlapping the city boundary have been selected.
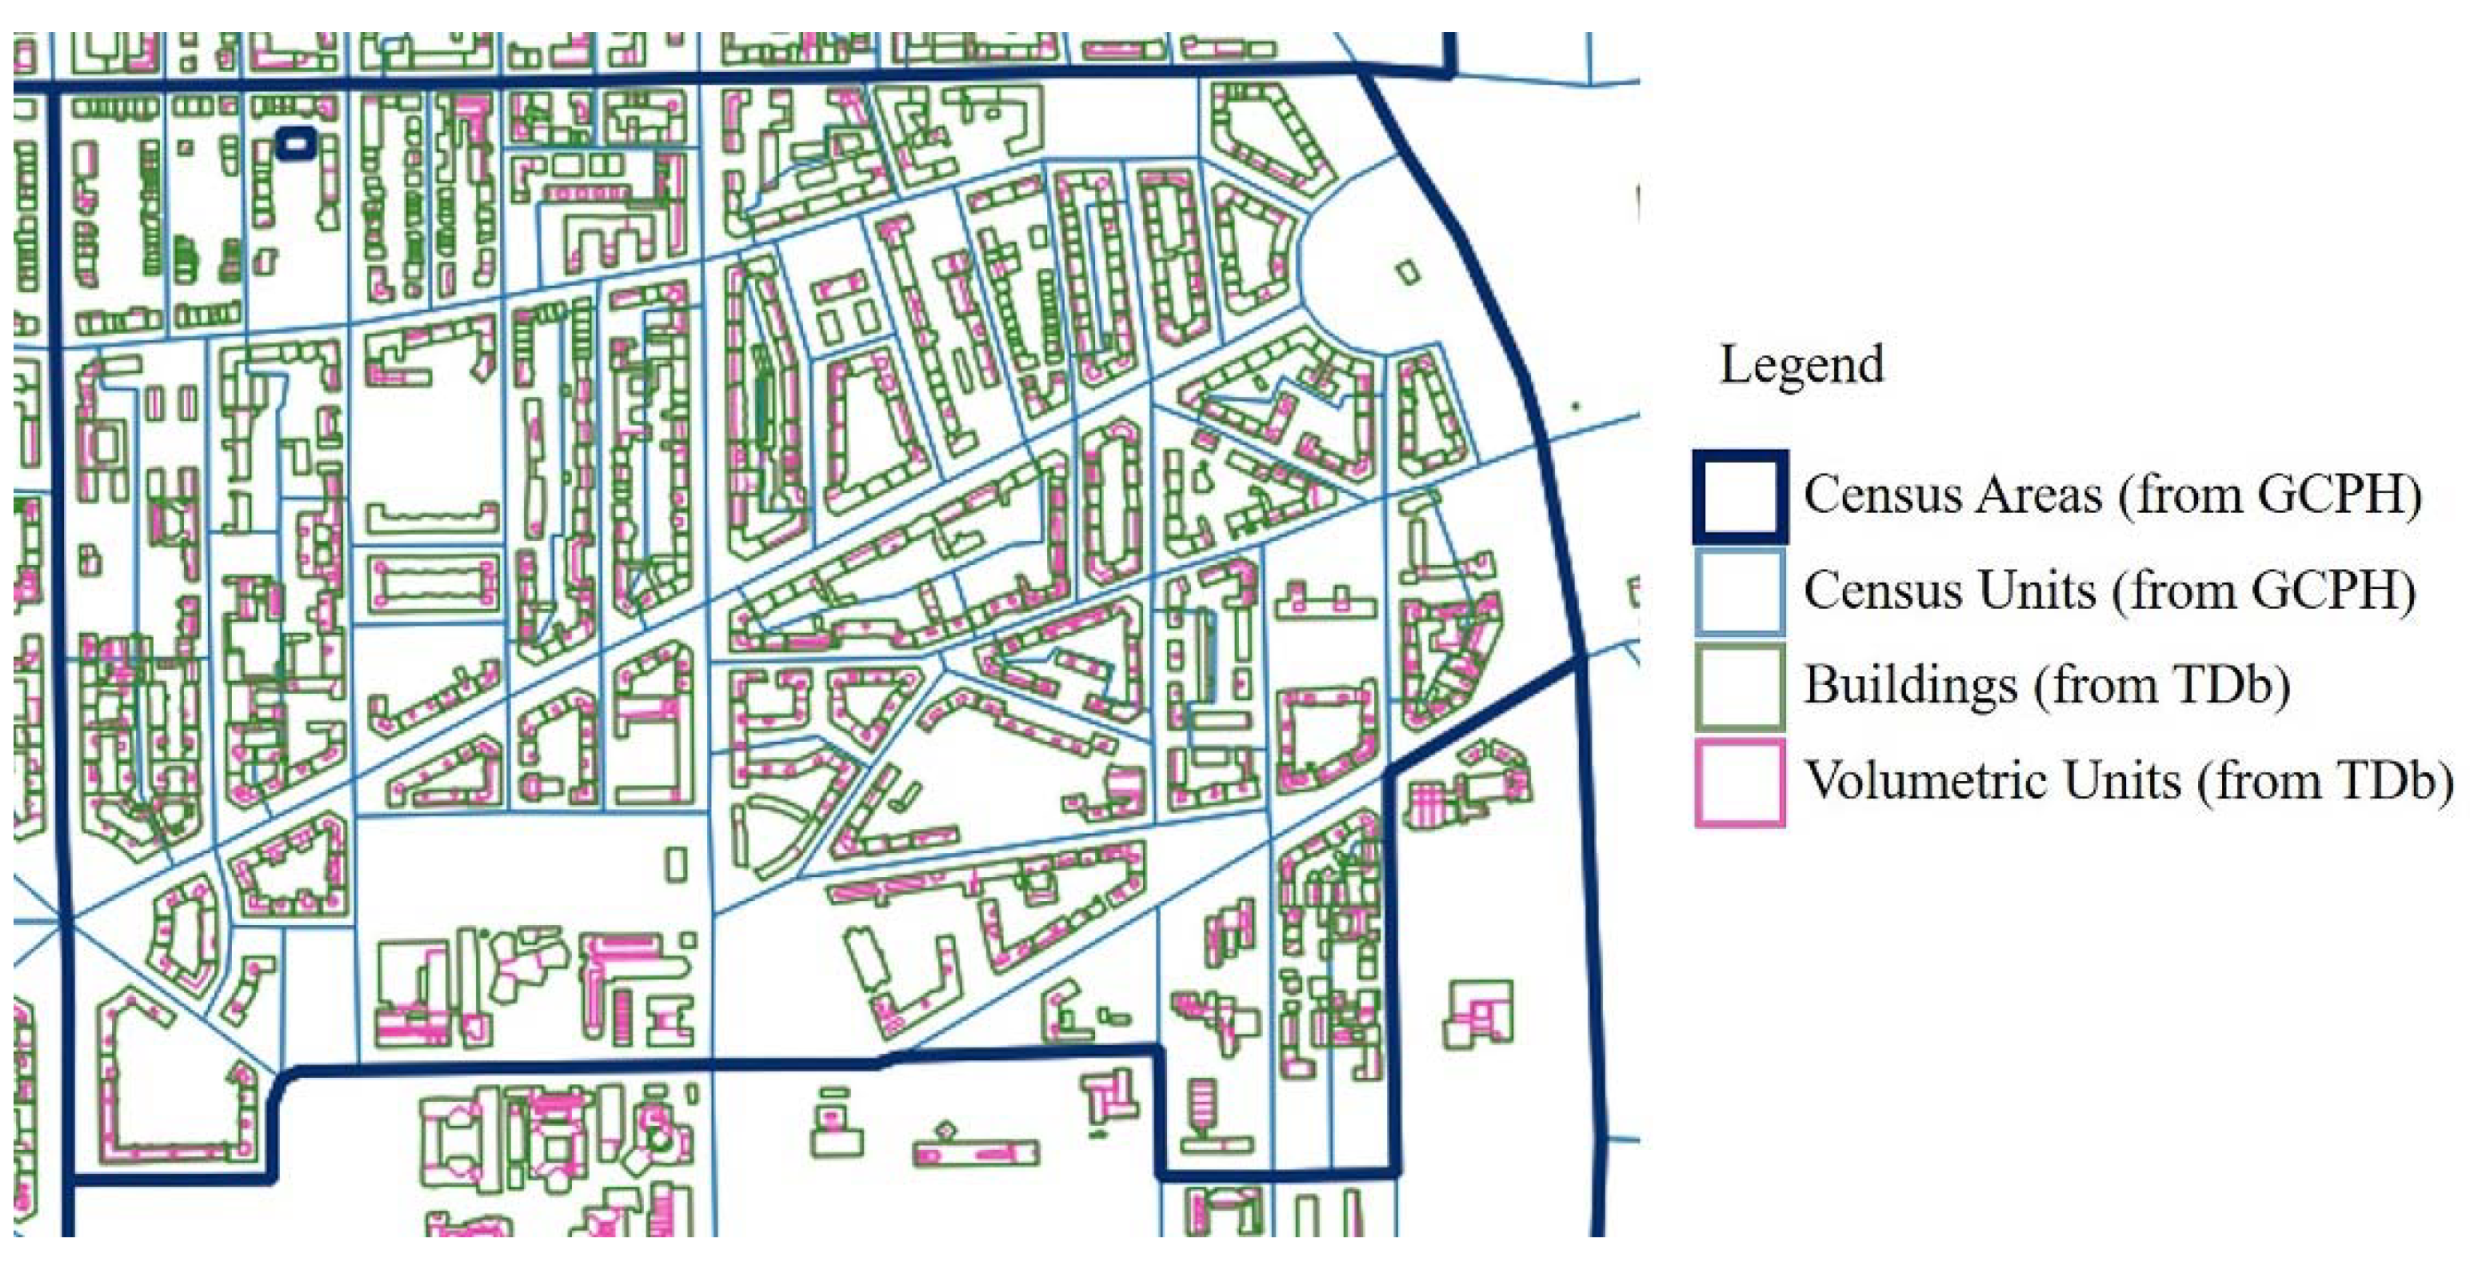
Additionally, the corresponding Statistical Variables have been associated, obtaining a unique dataset (hereafter named Census Units) with all useful spatial and statistical information. Moreover, an auxiliary dataset, referred to as the Census Areas in which Census Units are included, has been created for further calculations. Figure 2 shows the used spatial data in the GIS.
2.1.3. Datasets Cleaning
The used datasets provide several kinds of information on buildings, some of which are not suitable for the buildings’ energy assessment; hence, some filtering actions are necessary.
From TDb, the following Volumetric Units have been removed:
- -
- those whose portion type was different from “on the ground level,” thus referring to not inhabited areas (e.g., balconies, loggias, and underground volumes);
- -
- those having a height below 3 m, set as the minimum one referred to a single-story building (this threshold has been assumed considering that, in Italy, the minimum net floor height is 2.7 m, which generally corresponds to a gross floor height of 3 m, but could be updated based on local peculiarities);
- -
- those not included in any Building.
From TDb, the Buildings whose maintenance status was “ruined” or “under construction” have been removed because, in both cases, they would not be responsible for energy uses.
From GCPH, the following Census Units have been removed:
- -
- those for which Statistical Variables were missing;
- -
- those for which Statistical Variables reported a null number of buildings;
- -
- those having an ID code above 8888880, which refers to fictitious Census Units for locating data of homeless people.
2.1.4. Correlation of Spatial Datasets
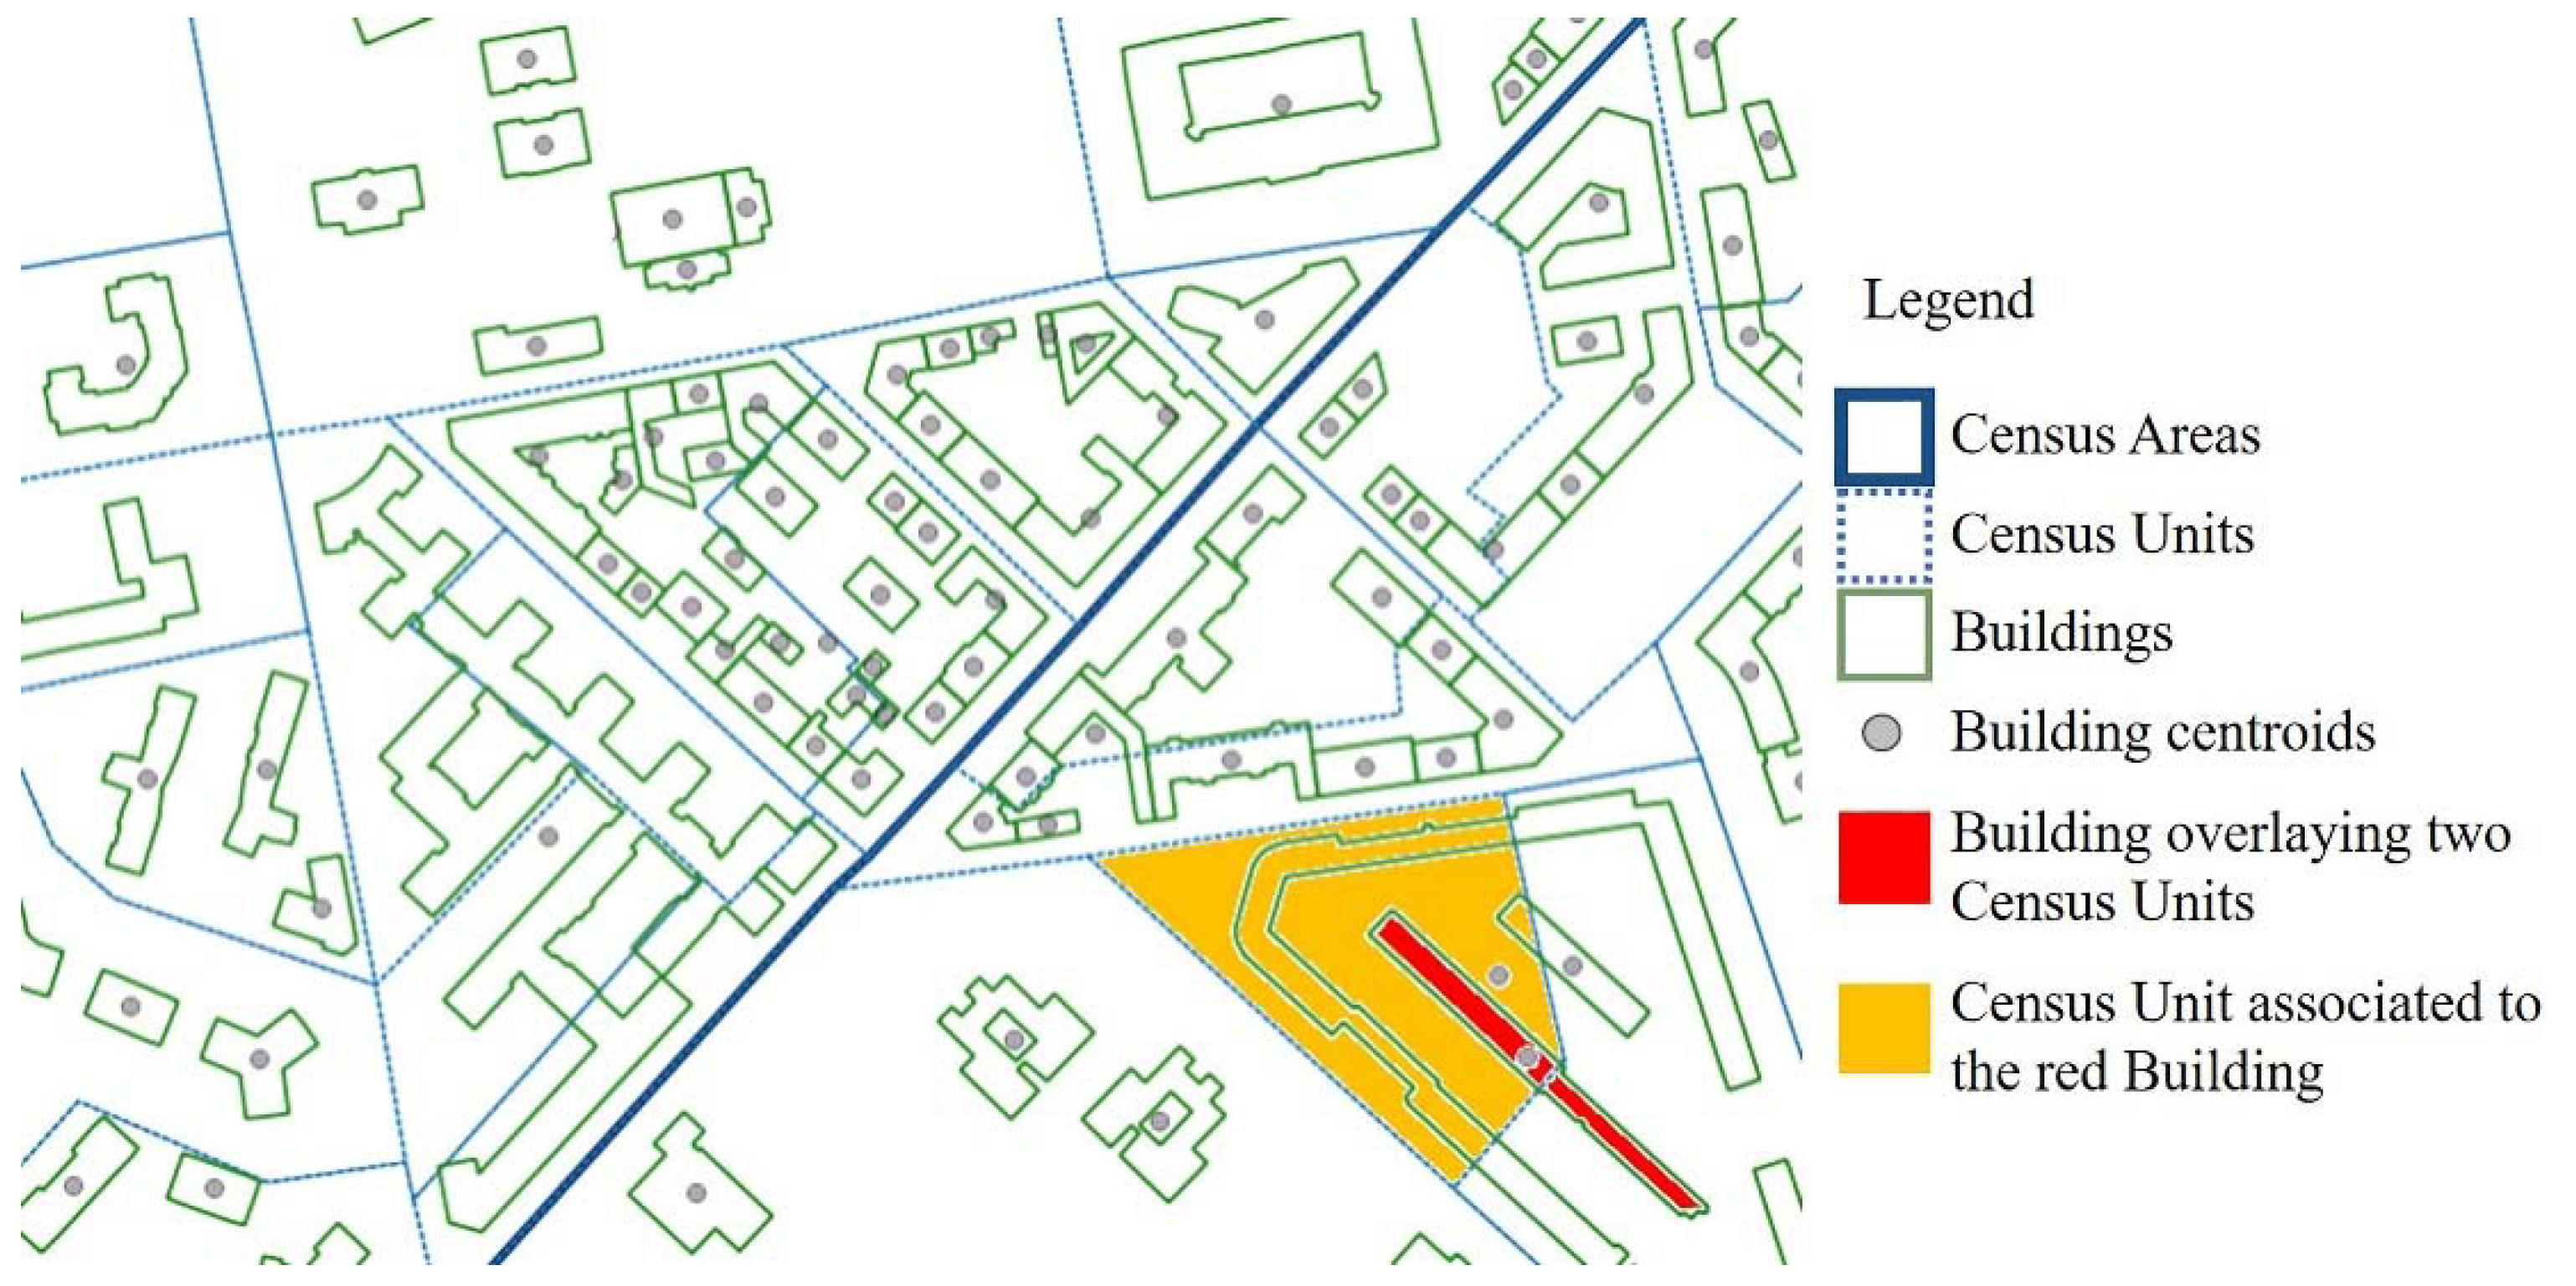
The shapes of the Buildings have been associated with the enclosing Census Units shape for further elaborations. However, some Buildings shapes may overlap more than one Census Unit shape. In this case, the Building’s shape centroid has been determined and the related Building is entirely associated with the Census Unit in which its centroid is laid.
Figure 3 shows the centroids determined for each Building, a Building in red, overlaying two Census Units, and a Census Unit in orange, to which it has been associated.
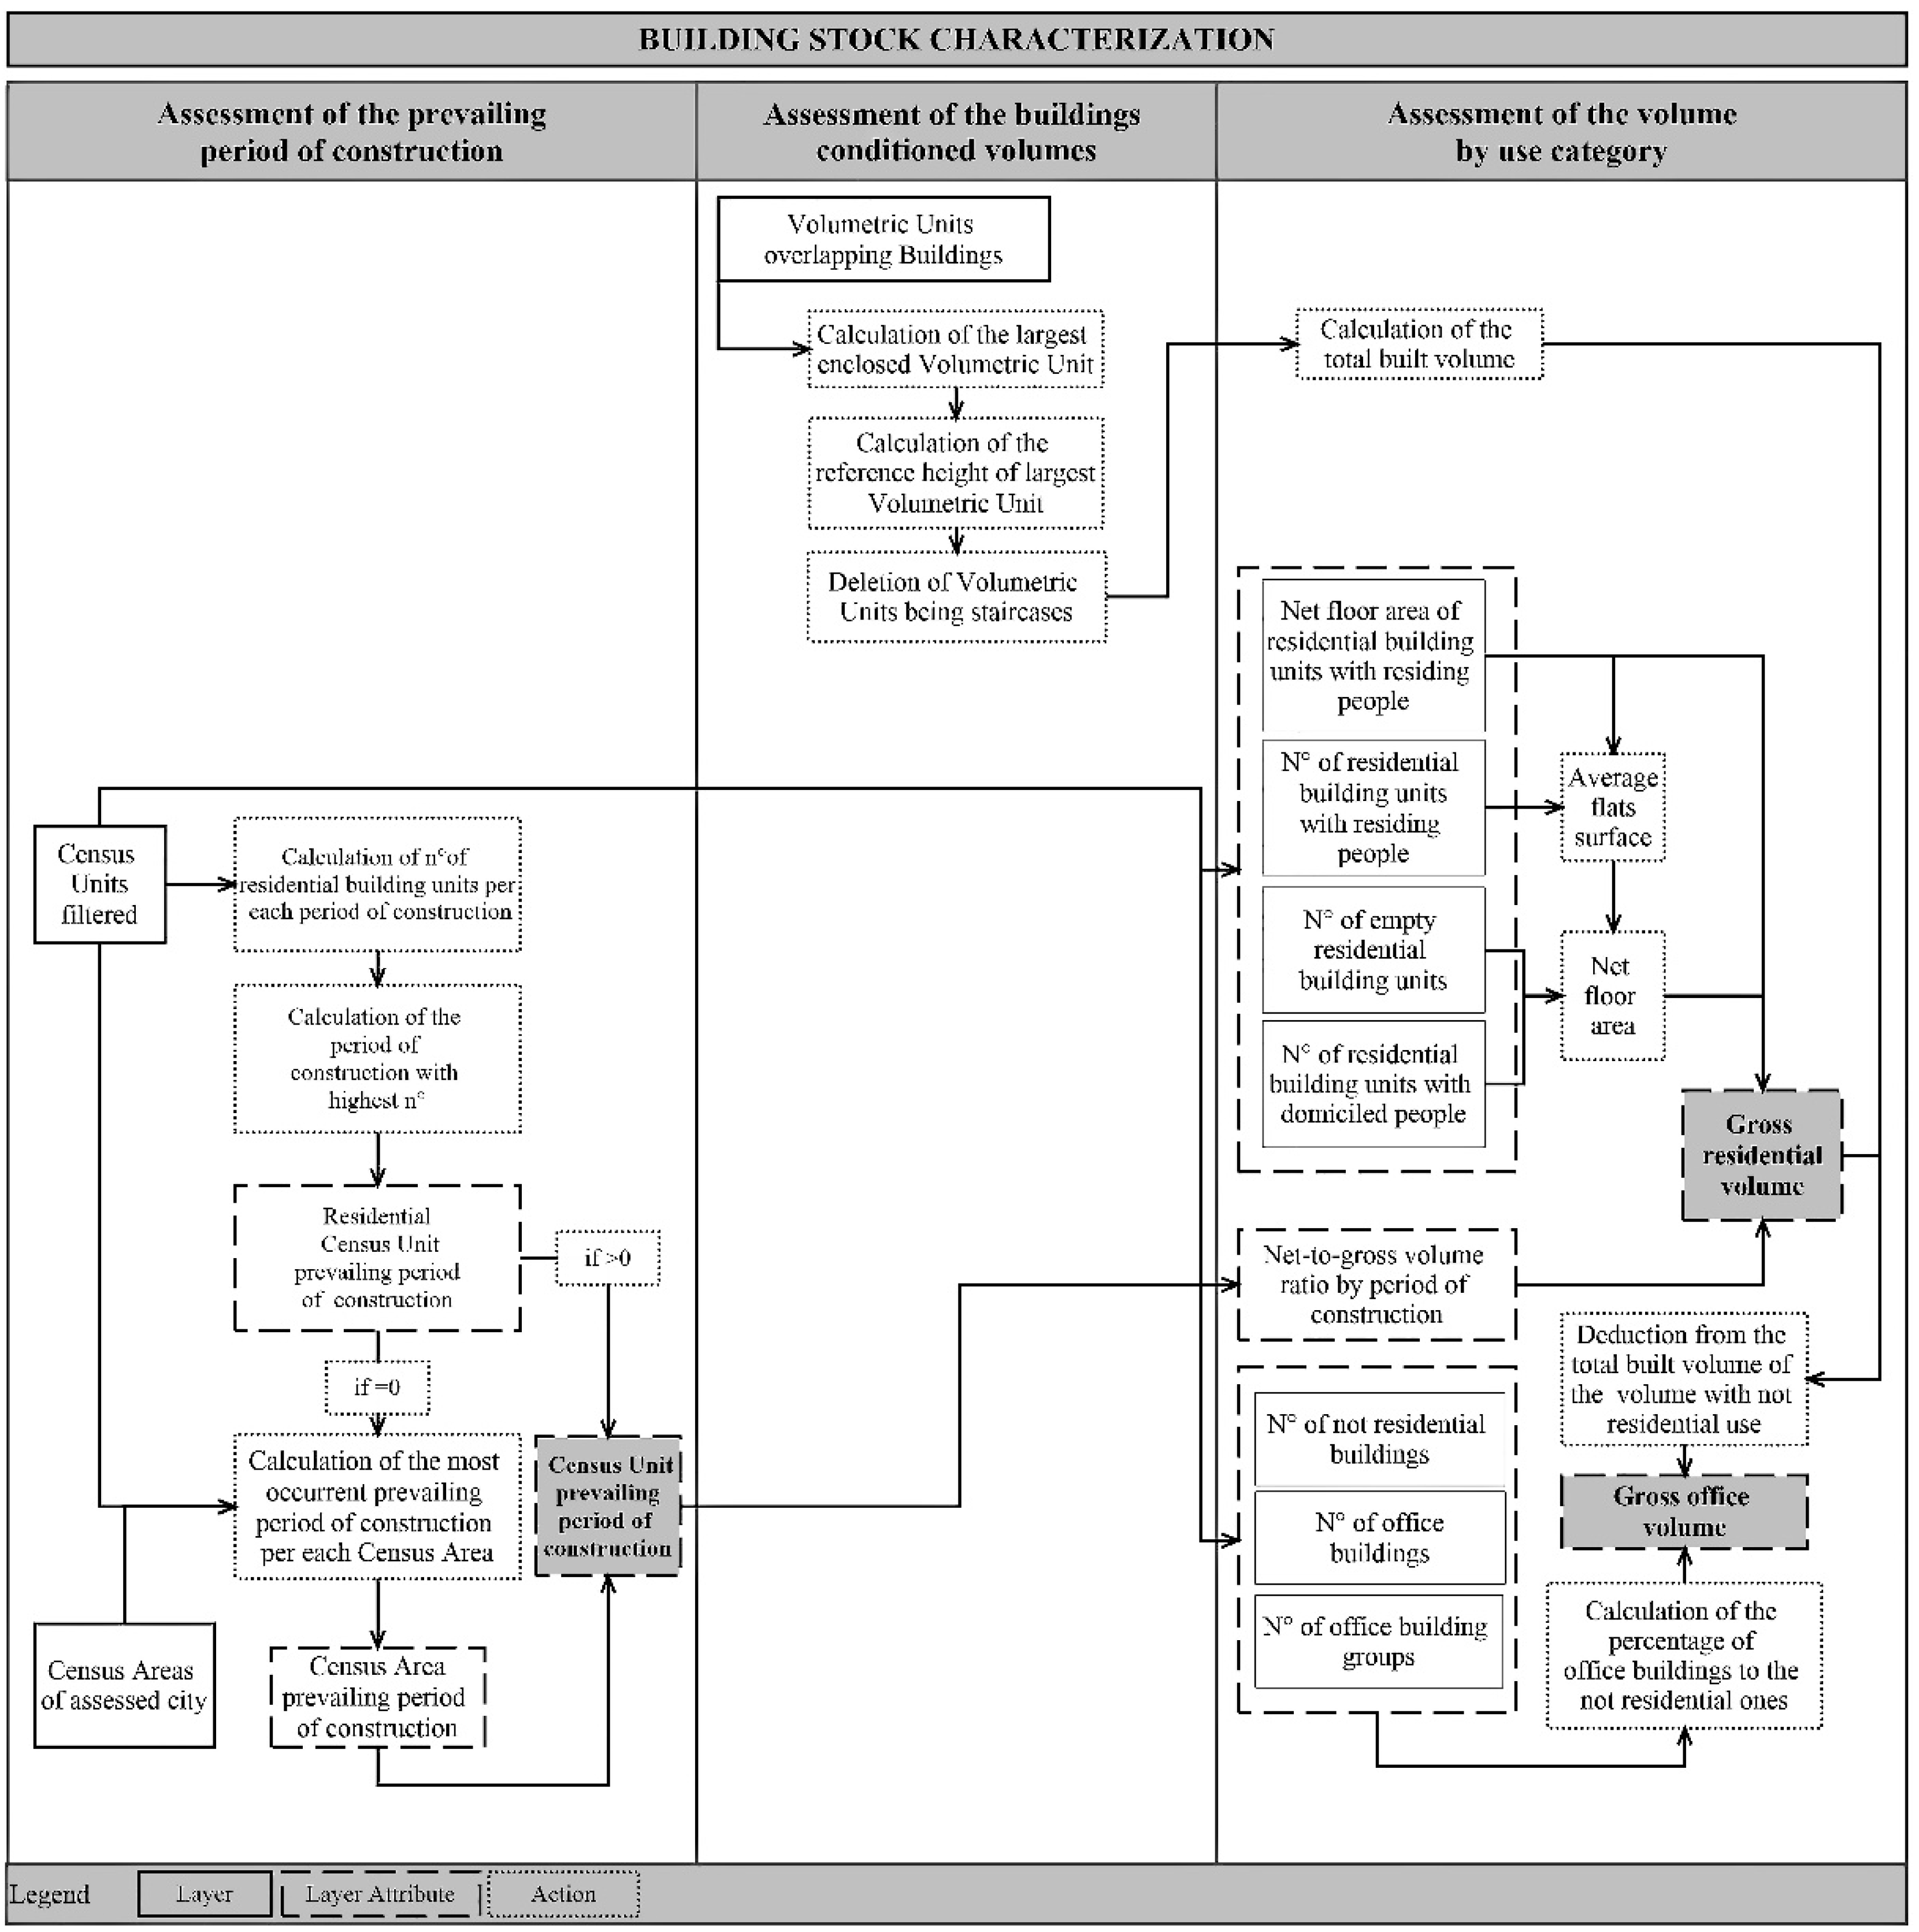
2.2. Building Stock Characterization
After the data pre-processing, the procedure foresees the characterization of the building stock based on age, conditioned volume, and use category, as described in the following subsections and reported in the flowchart of Figure 4.
2.2.1. Assessment of the Prevailing Period of Construction
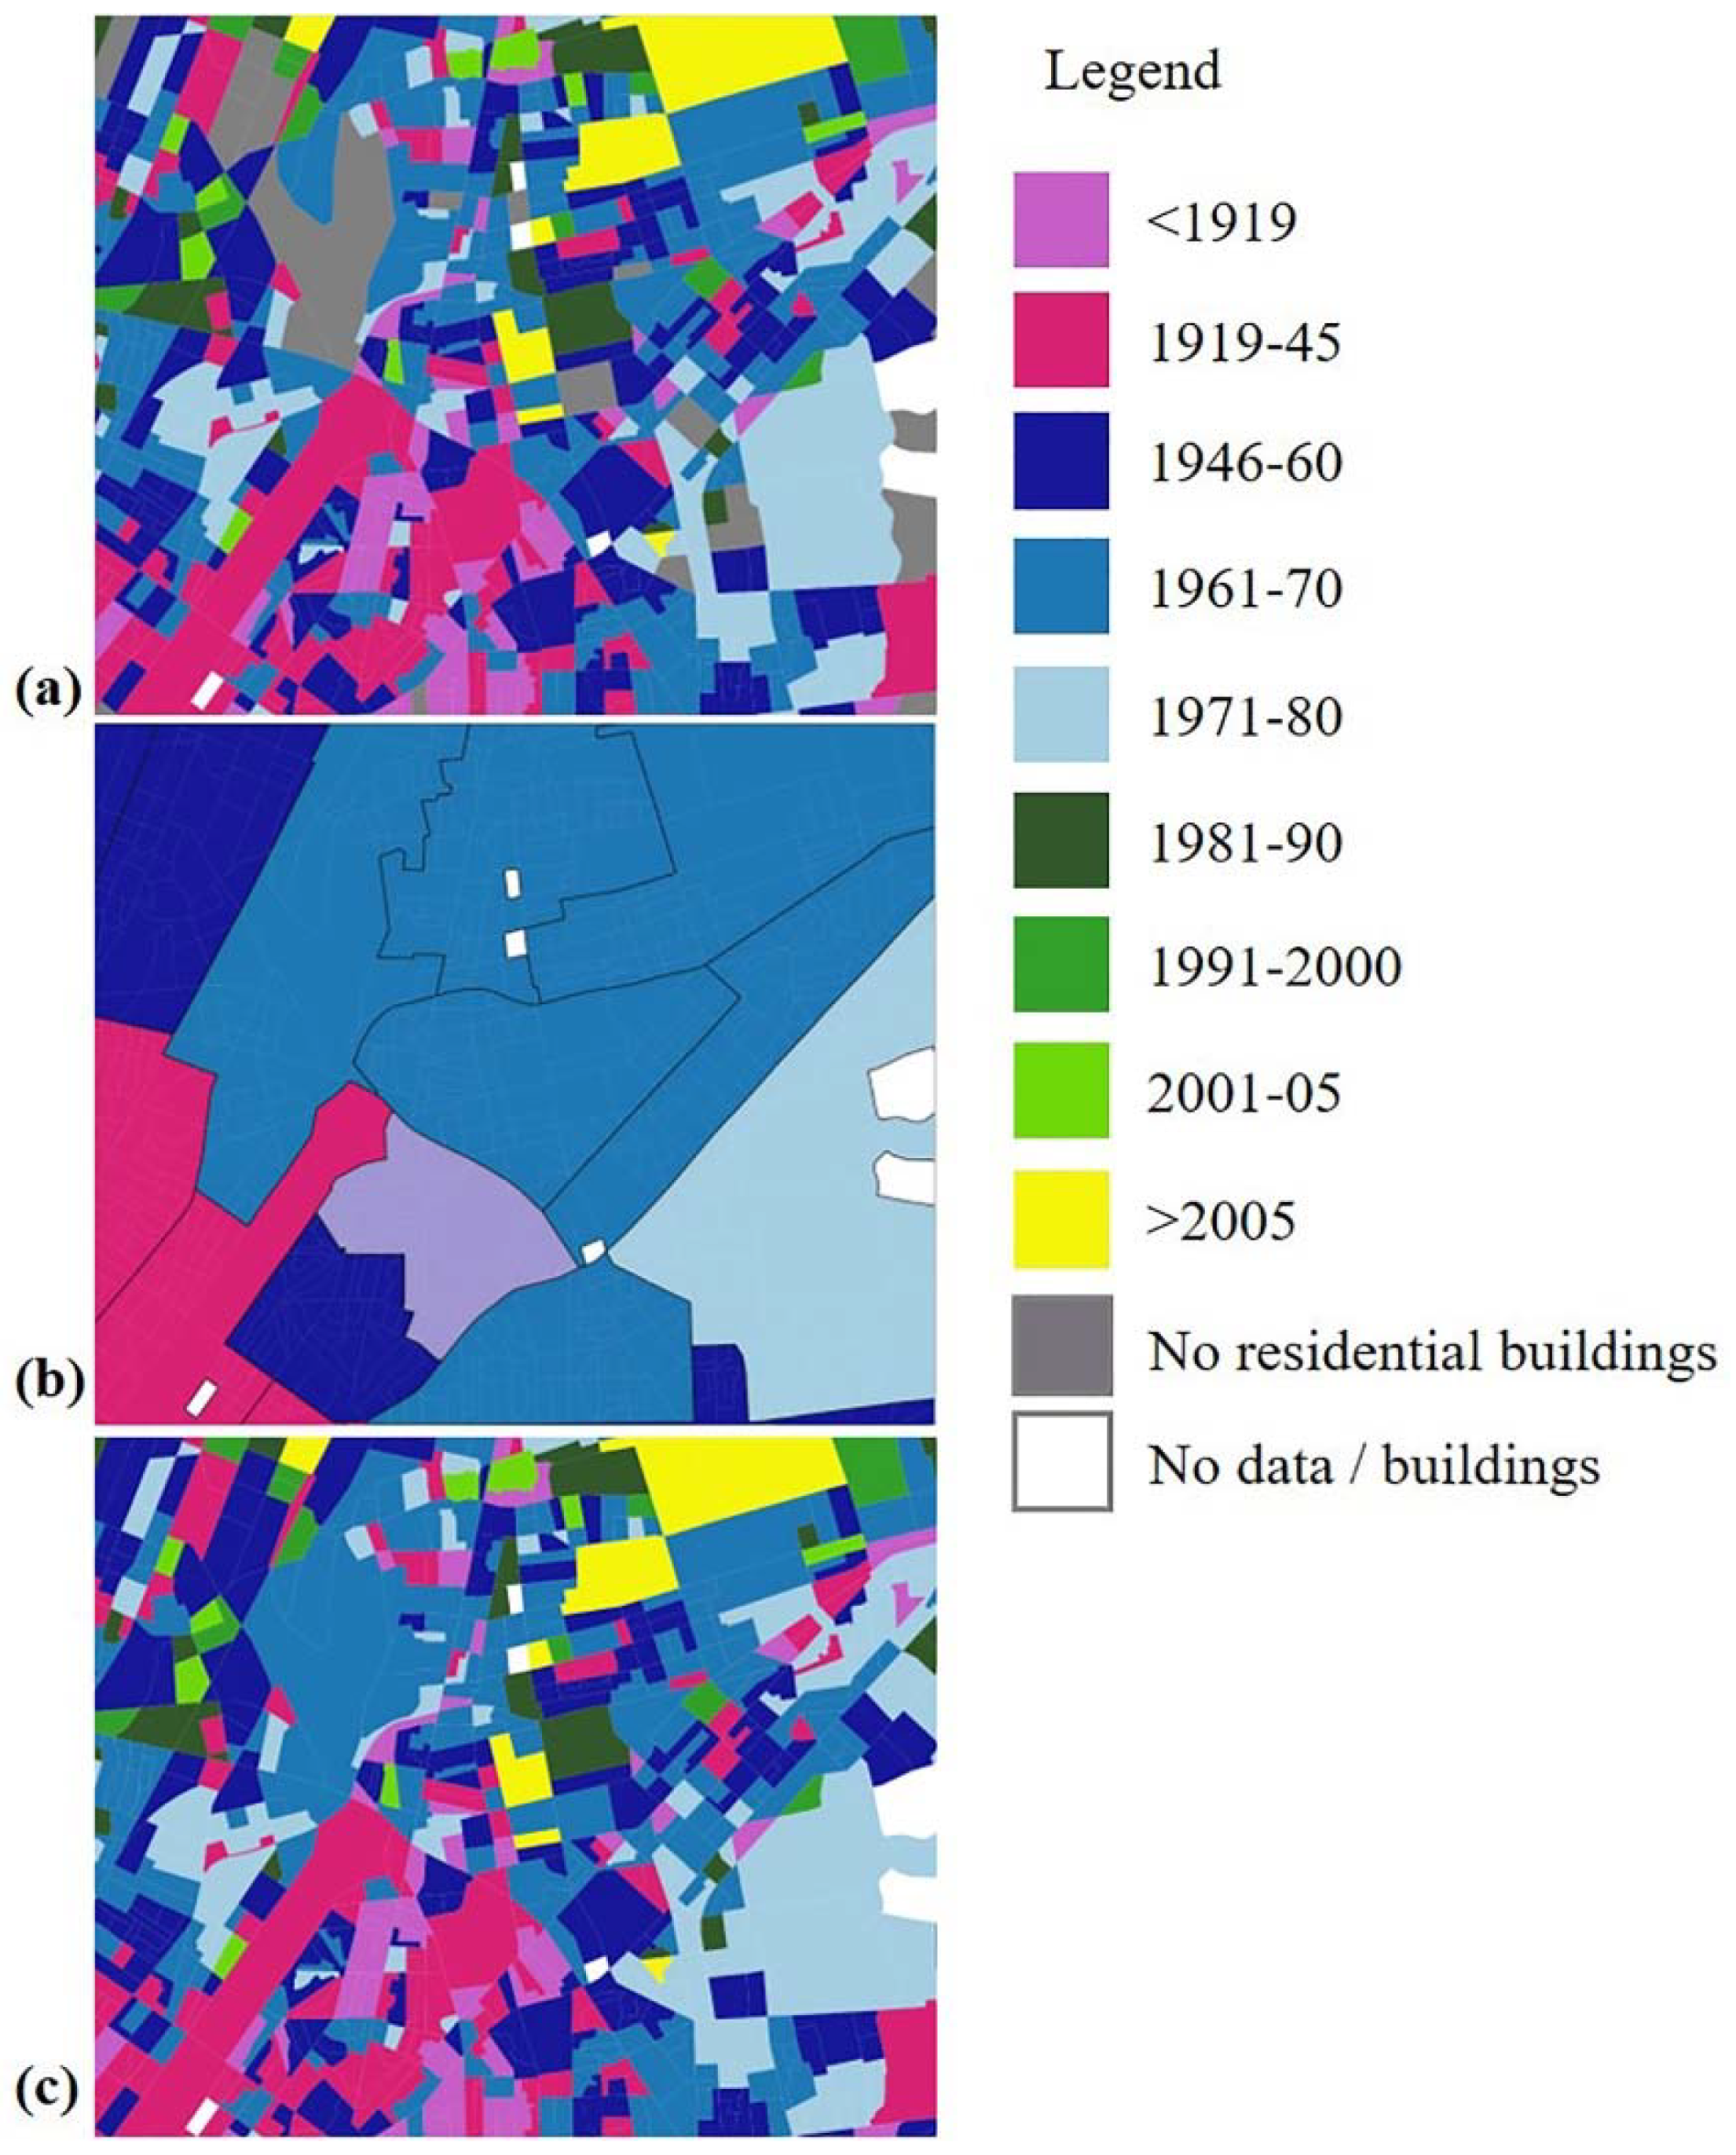
As the construction period refers to the building units and it was not possible to define the age of each single building, the most recurrent period of construction among the former ones has been assumed as the prevailing age of the Census Unit. Additionally, in the case of missing data (i.e., Census Units without residential buildings), the Census Units prevailing period of construction, mostly recurrent within each Census Area, was determined and adopted. Hence, thanks to the previous spatial correlations among datasets, the determined prevailing period of construction has been assigned, with an acceptable approximation for urban scale evaluation, to all the Buildings included in each Census Unit. In Figure 5, an example of the representation of these calculations results is visualized.
2.2.2. Assessment of the Built Conditioned Volumes
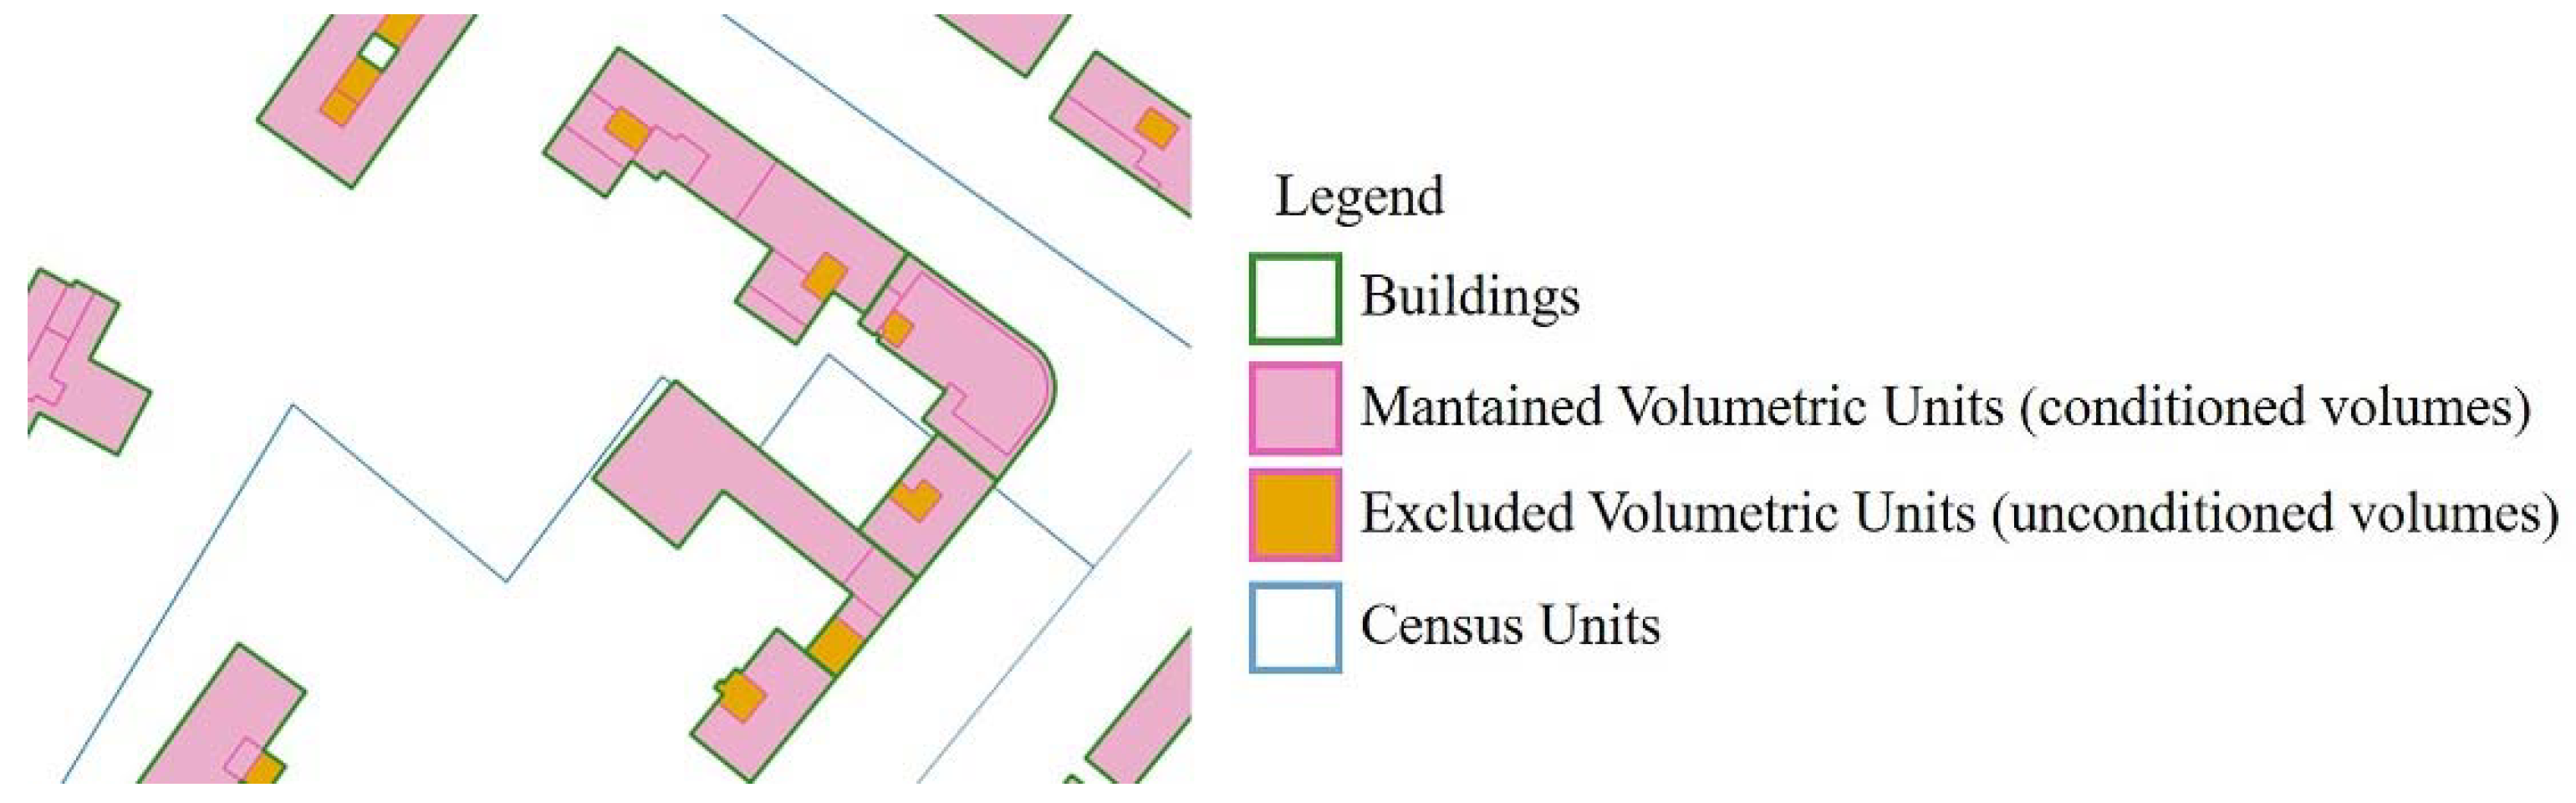
To exclude the unconditioned volumes within Buildings (e.g., stairwells and technical volumes) from the overall assessment, a reference roof height for each Building has been determined. This reference roof height is that associated with the enclosed Volumetric Unit having the largest surface. All small Volumetric Units, having a height greater than the reference one, have been excluded by the process toward final calculations (Figure 6).
Finally, based on the maintained Volumetric Units geometries, the built volume per Census Unit has been determined.
2.2.3. Assessment of the Built Volume by Use Category
In order to determine the built volume distribution by use category, the following calculations have been performed at the Census Unit level.
First, the residential net floor area has been calculated as the sum of the floor areas of the residential buildings’ units with residing people (data surveyed by Istat) and the floor areas of those occupied by domiciled people and unoccupied (i.e., measurements not surveyed by Istat, therefore estimated by assuming the average flat surface of the former type of buildings’ units).
Based on this, the residential net volume has been calculated by accounting for a net average height of 3 m for the building units. To calculate the gross volume, the ratio of net-to-gross volume was assumed as equal to 0.6 and 0.7 in the case of buildings built before or after 1960, respectively [42].
Then, by subtracting the calculated residential gross volume from the total built one, the gross volume of nonresidential use buildings (including office ones) has been derived. Finally, assuming the same proportion between the number of building shares and built volume shares, the ratio of the number of office buildings over the overall number of the nonresidential ones has been multiplied by the nonresidential volume, obtaining the built volume of offices.
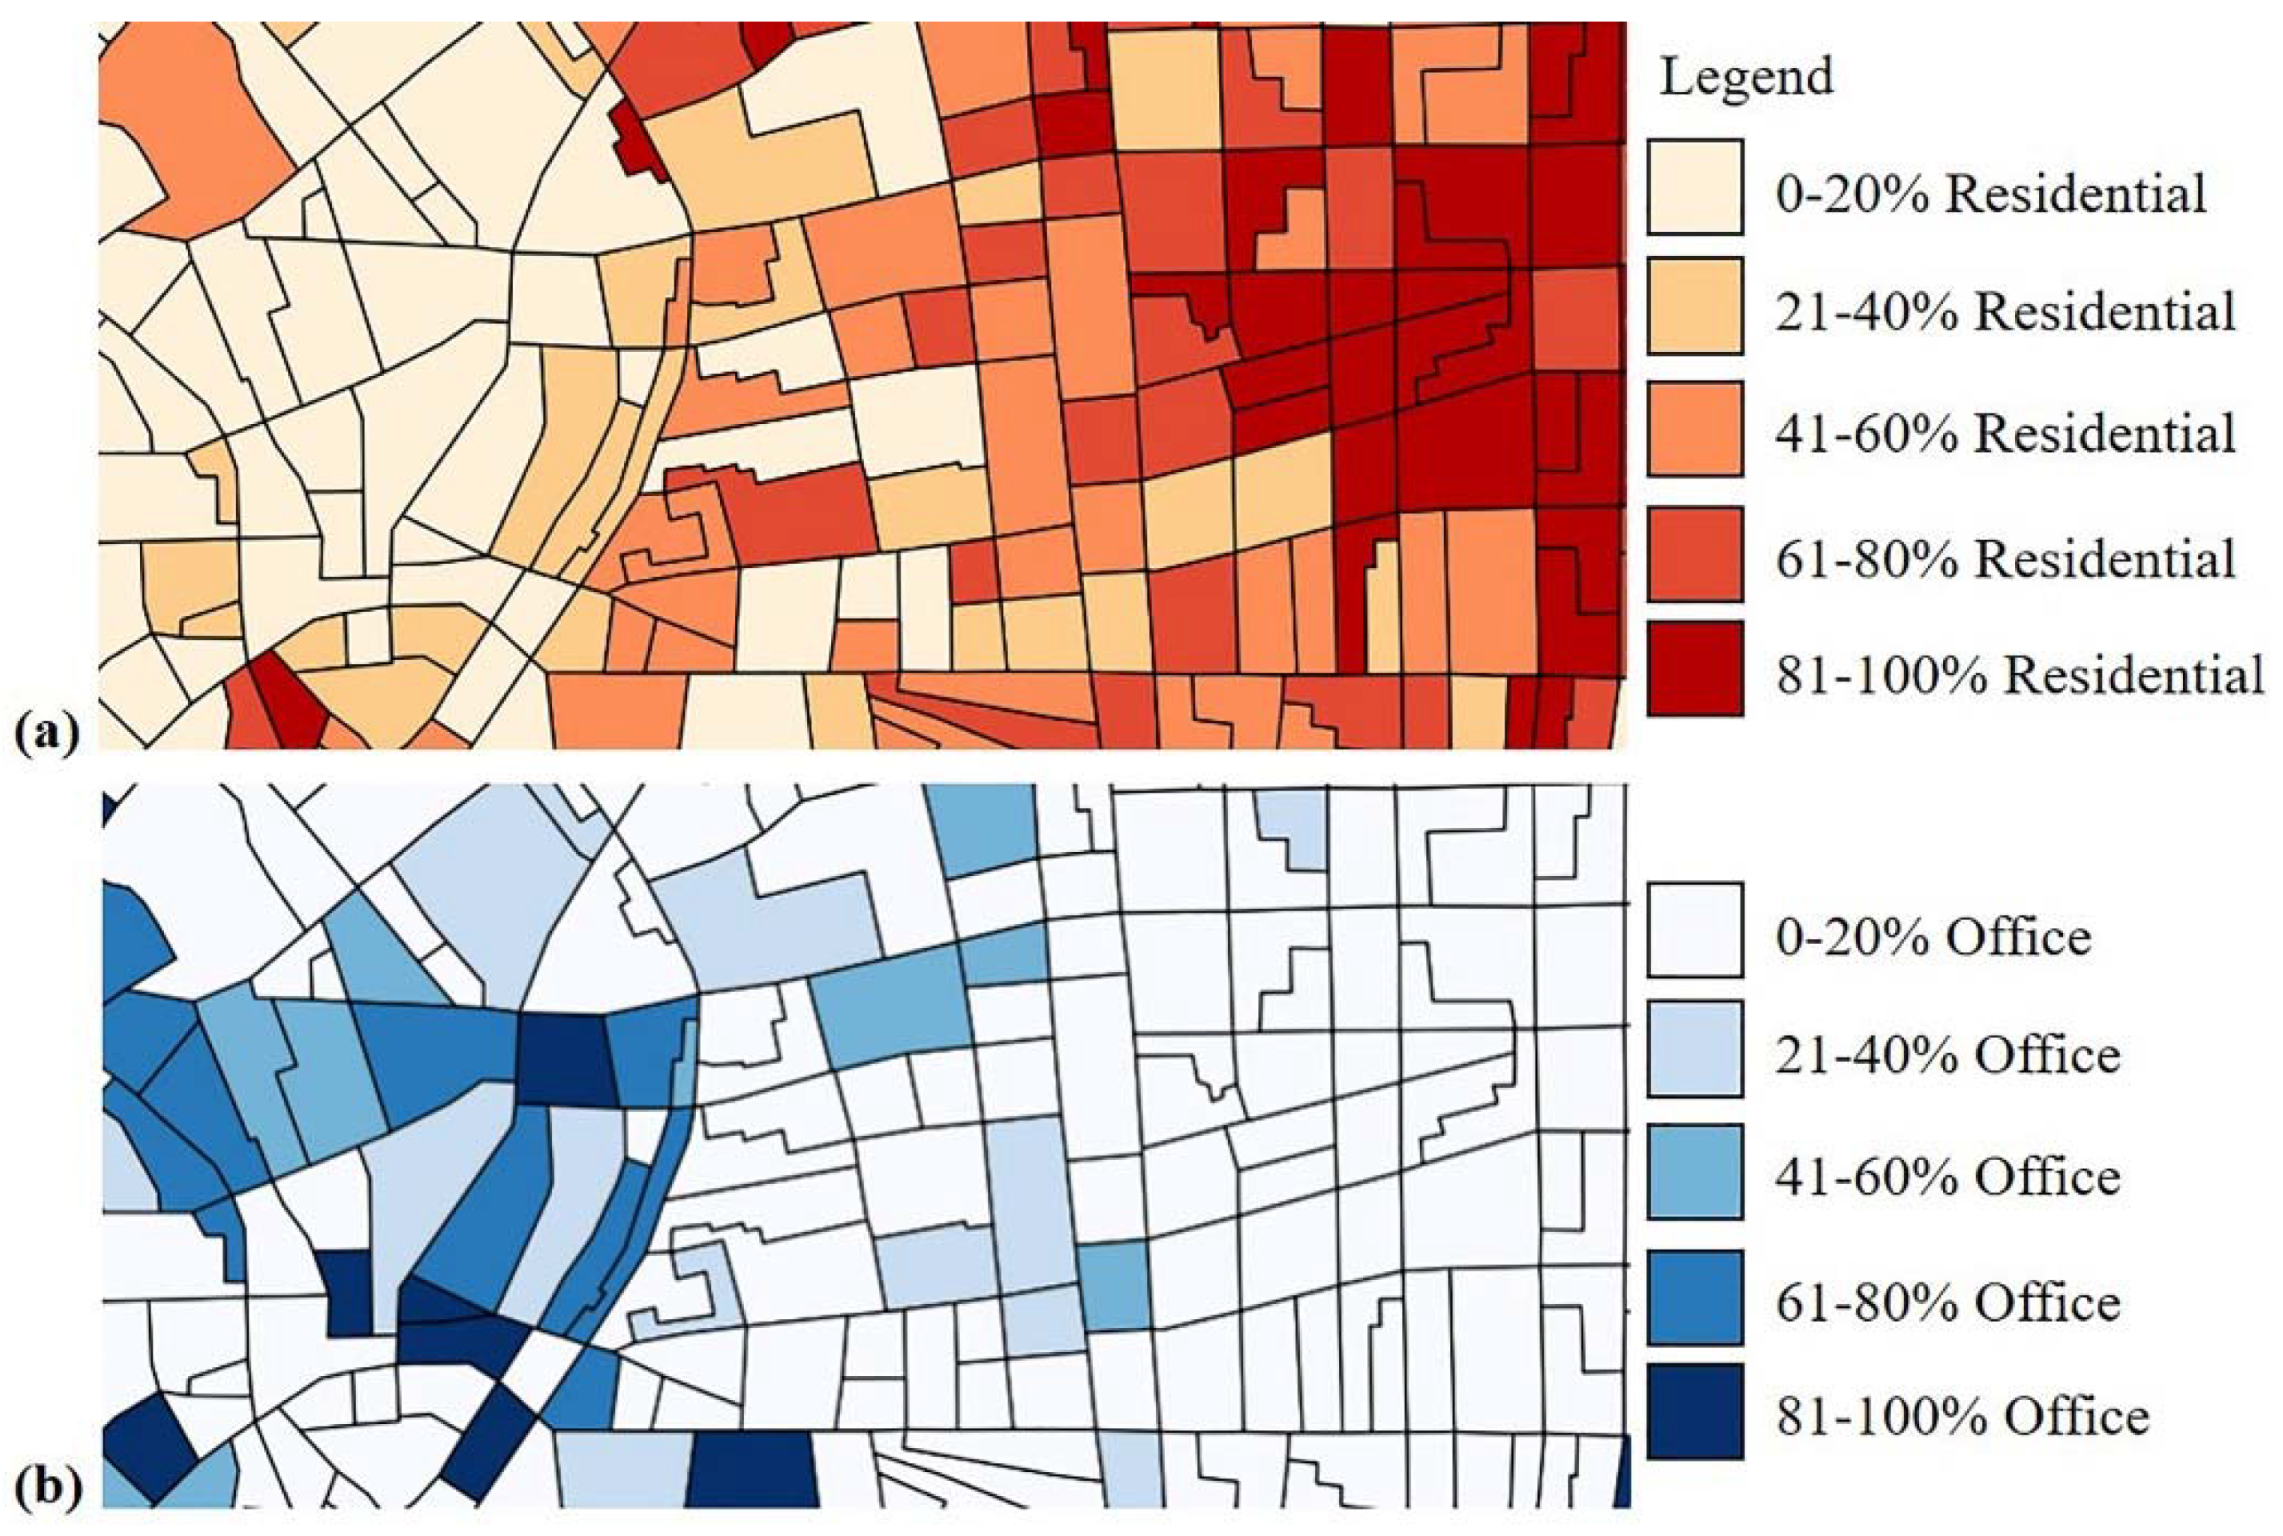
An example of the representation of residential and office built volume is reported in Figure 7 in terms of volume percentages.
3. Results
The city of Milan was the first case study context in which the procedure has been applied, because it can be considered as representative of different urban contexts due to a mixed consistency of buildings and a variable density of buildings (the ratio of built volume-to-land surface per Census Unit ranges from 0.02 to 163 m3/m2). Specifically, data from the Regional Topographic Database [43] have been used for the built conditioned volume assessment. The results of the procedure applied to the case study, its validation, and an anticipation of the outcomes achievable with implementing the overall method for estimating the energy demand of urban buildings are described in the following subsections.
3.1. Procedure Application on the Case Study of Milan
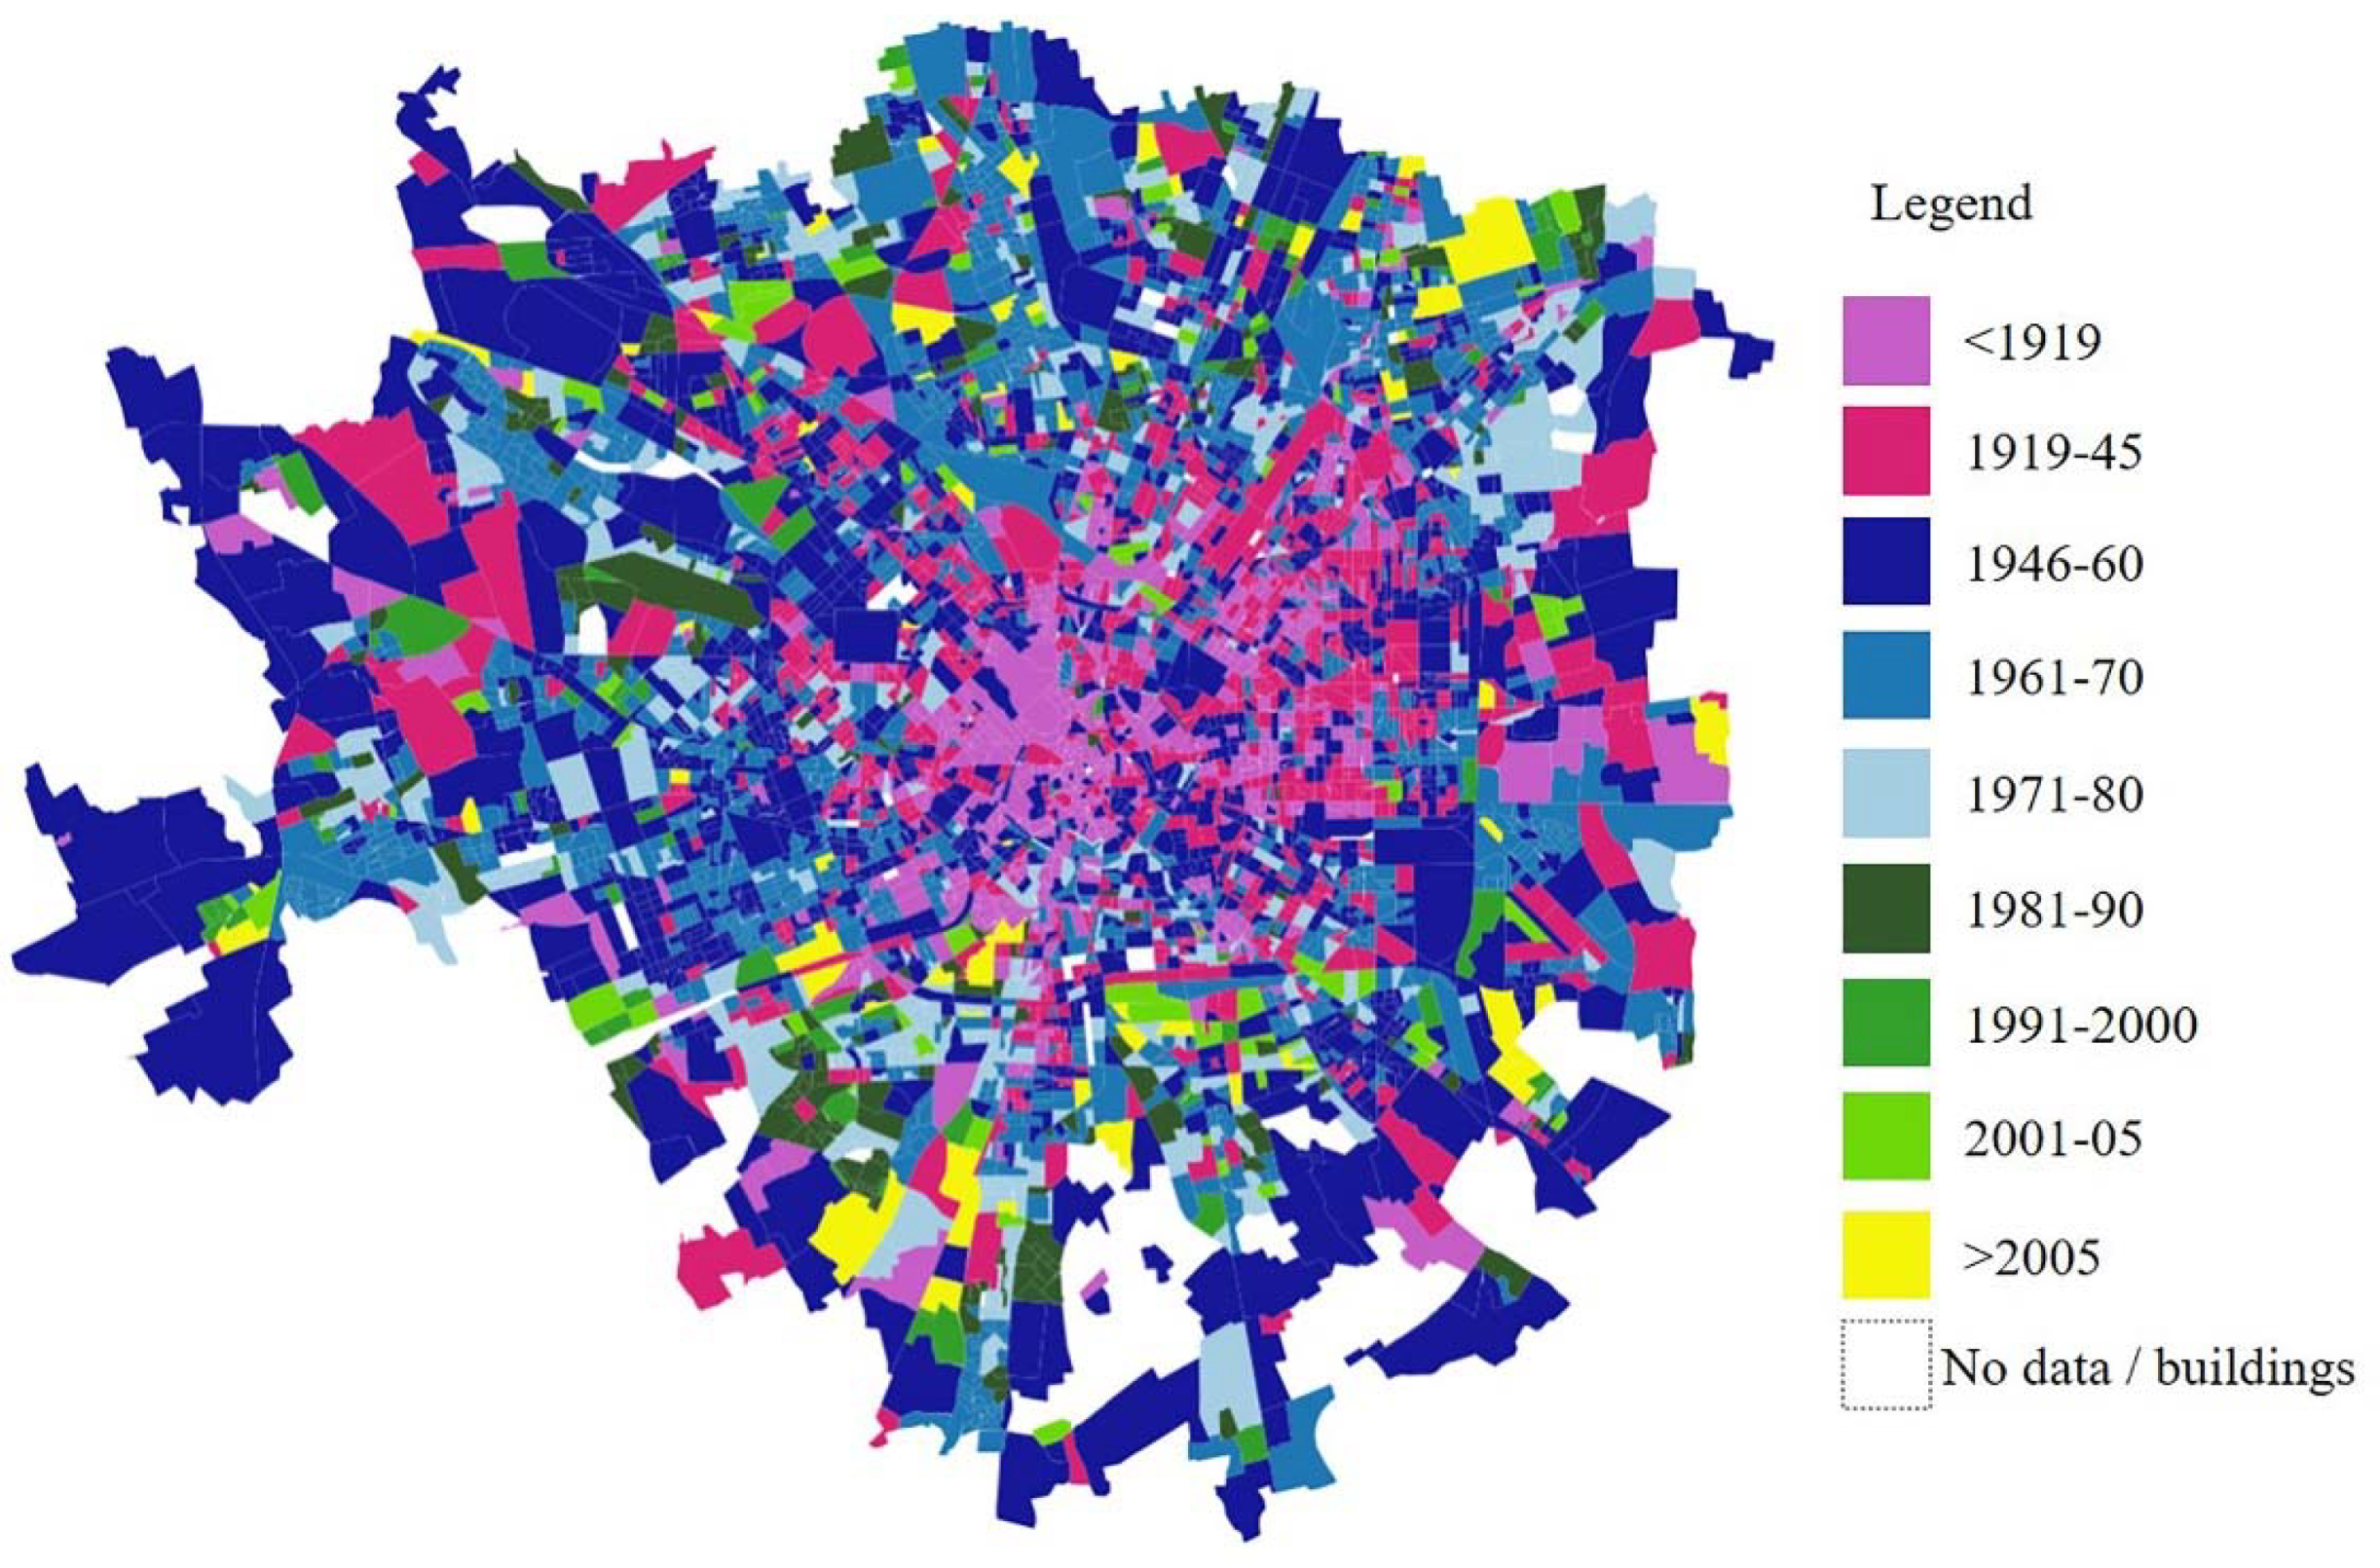
The map of the city of Milan characterized by the prevailing period of construction of each Census Unit is reported in Figure 8. Having a general overview on larger Census Units, or groups of adjacent small Census Units having the same characteristics, it can be noted as follows. The old buildings (from earlier than 1919 until 1945), which are typically made of massive uninsulated structures, are mainly concentrated in the city center and other peripherical areas likely belonging to the old villages later included in the municipality. The buildings from the housing boom (from 1946 to 1980), which are typically made of uninsulated light envelopes, are mainly widespread throughout the urban expansion areas of the period. The buildings that have been built in the following period (from 1981 to 2005), when building envelope insulation became mandatory, are densely located in wide areas that are likely originally industrial/freight transport logistics ones that were abandoned and have been later regenerated. Finally, the buildings built in the most recent period (later than 2005), after the Energy Performance Building Directive (EPBD) implementations, and therefore better performing, are few and scattered throughout the city.
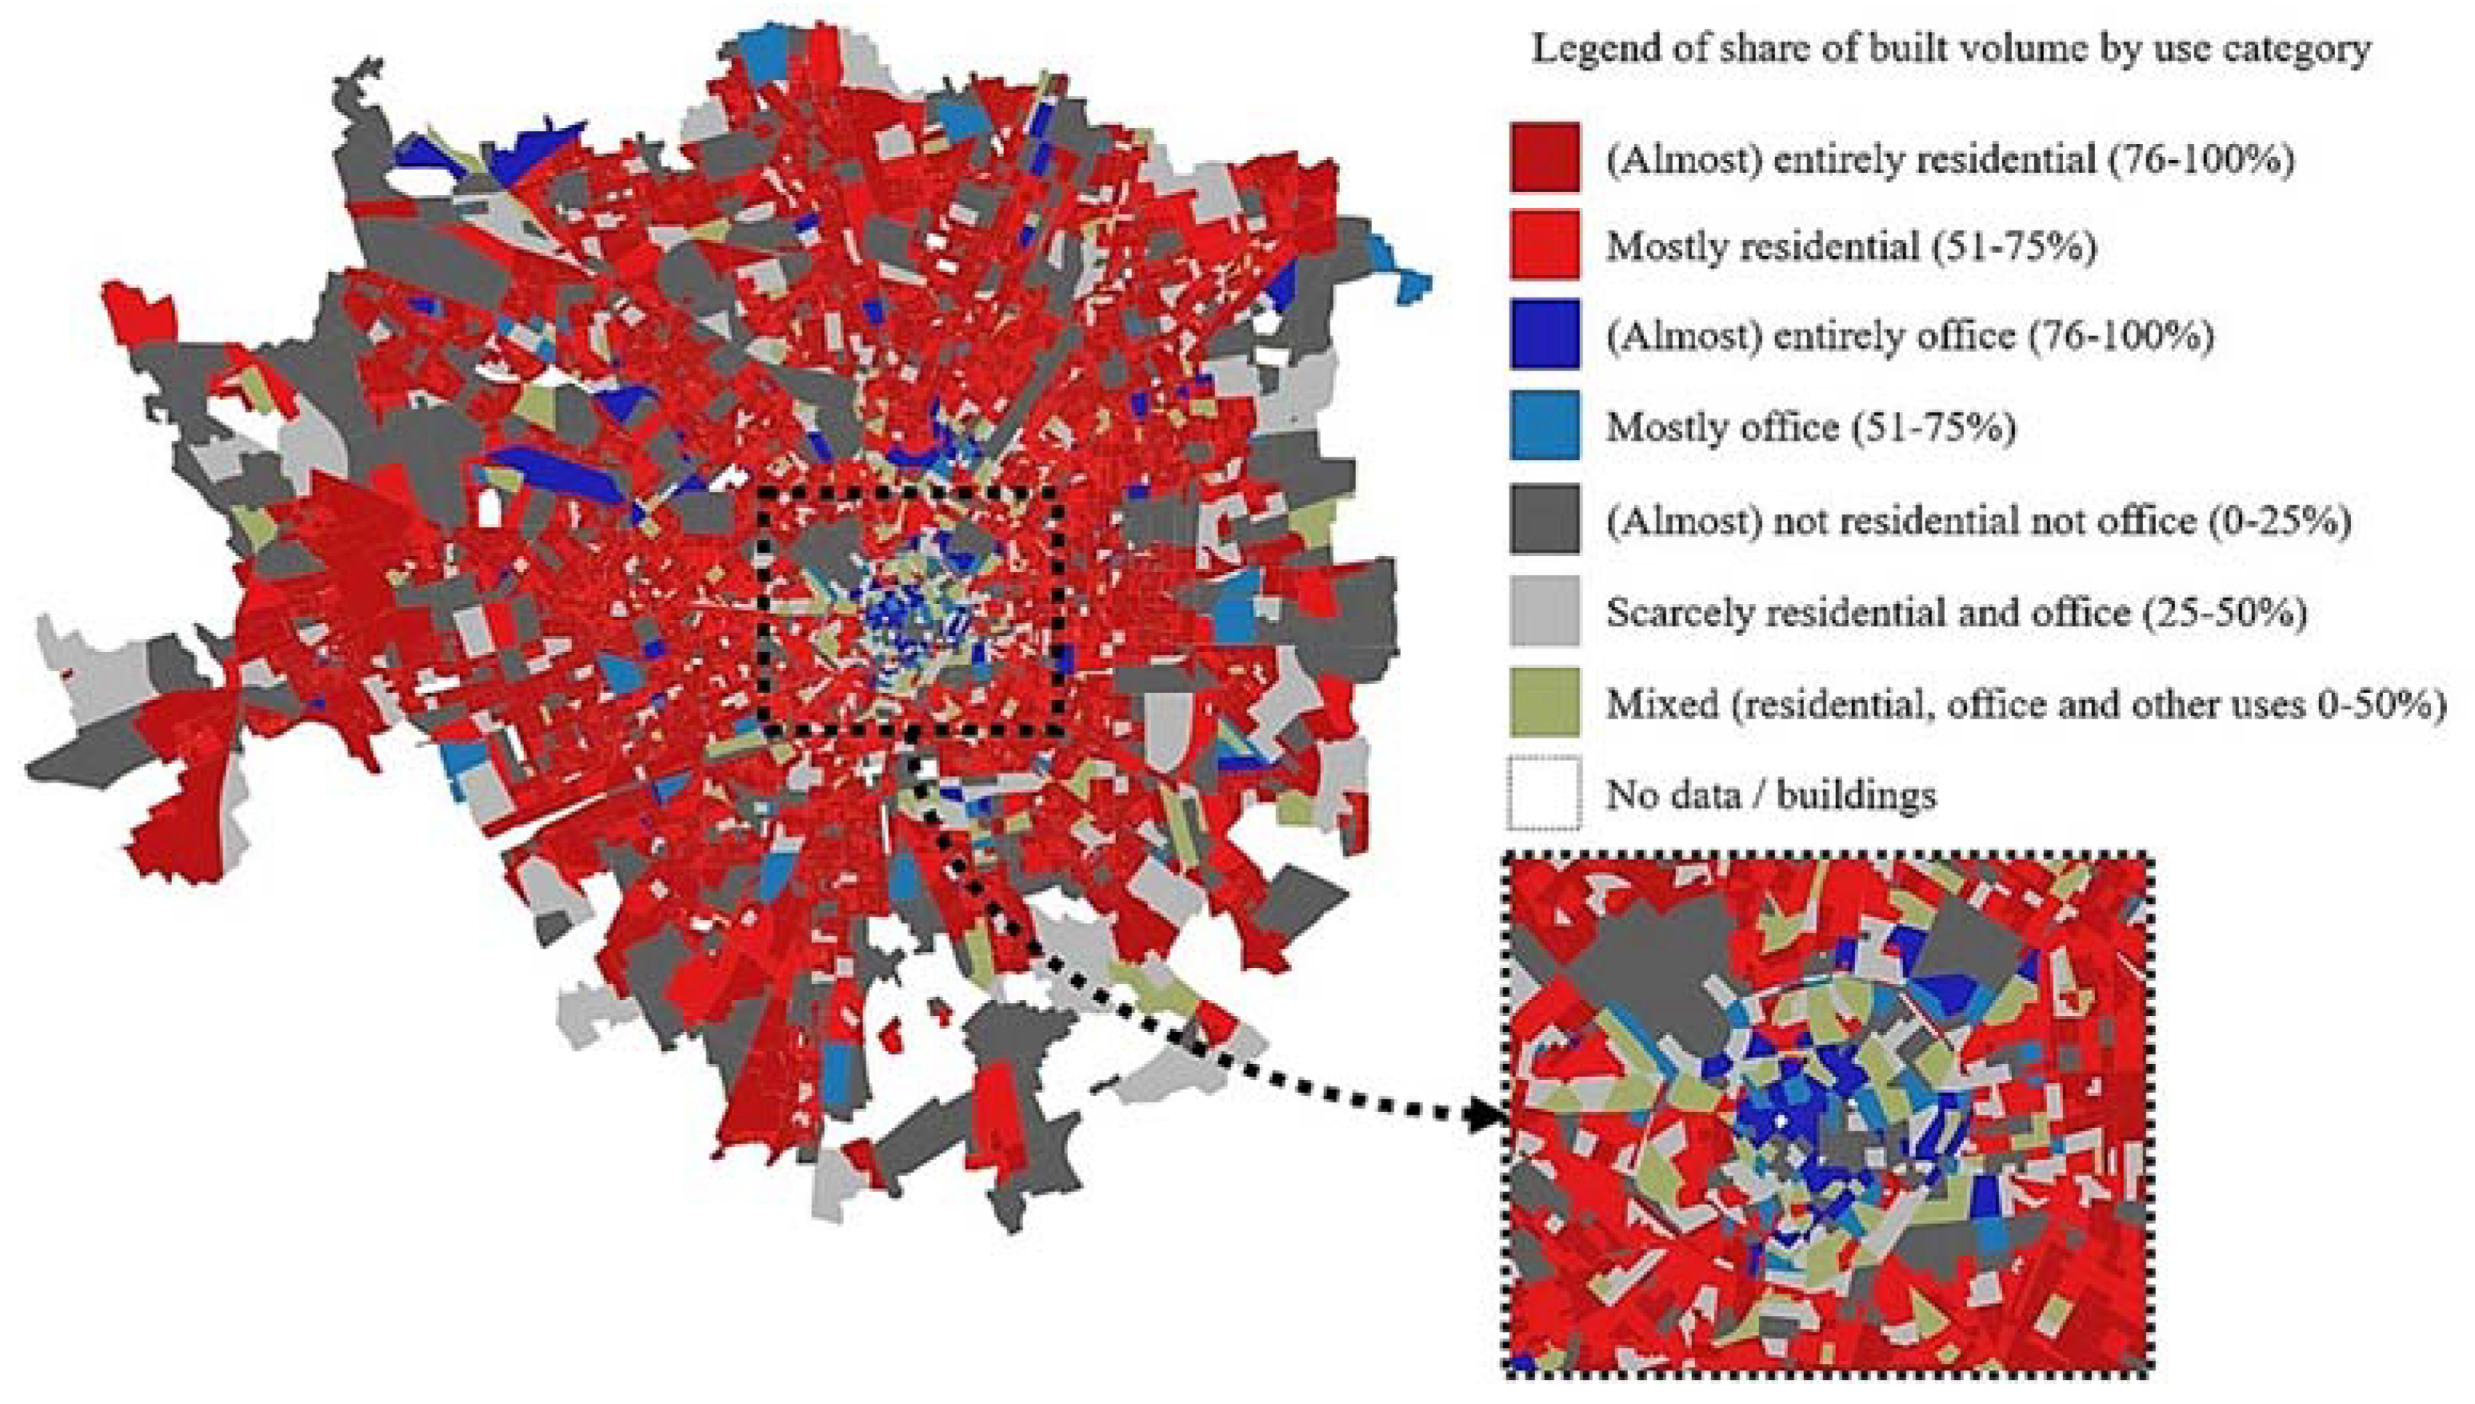
In Figure 9, the prevailing building uses within the Census Units, based on the volume percentages of residential and office building stock with respect to the overall one (i.e., including other categories such as industrial and commercial), which is out of the scope of this study, is mapped. Following the same approach adopted for the previous general overview, it can be noted that the city is largely dominated by the residential use category, while the office buildings are mostly concentrated in the downtown, except for large areas throughout the city likely referred to as directional districts.
3.2. Procedure Validation
The difficulty of validating building stock models is a well-known issue in the literature [8]. In Italy, the current lacking status of buildings data is also a particular challenge. Hence, to validate the developed procedure, the obtained results of the shared built volume have been compared with available data aggregated at the urban level.
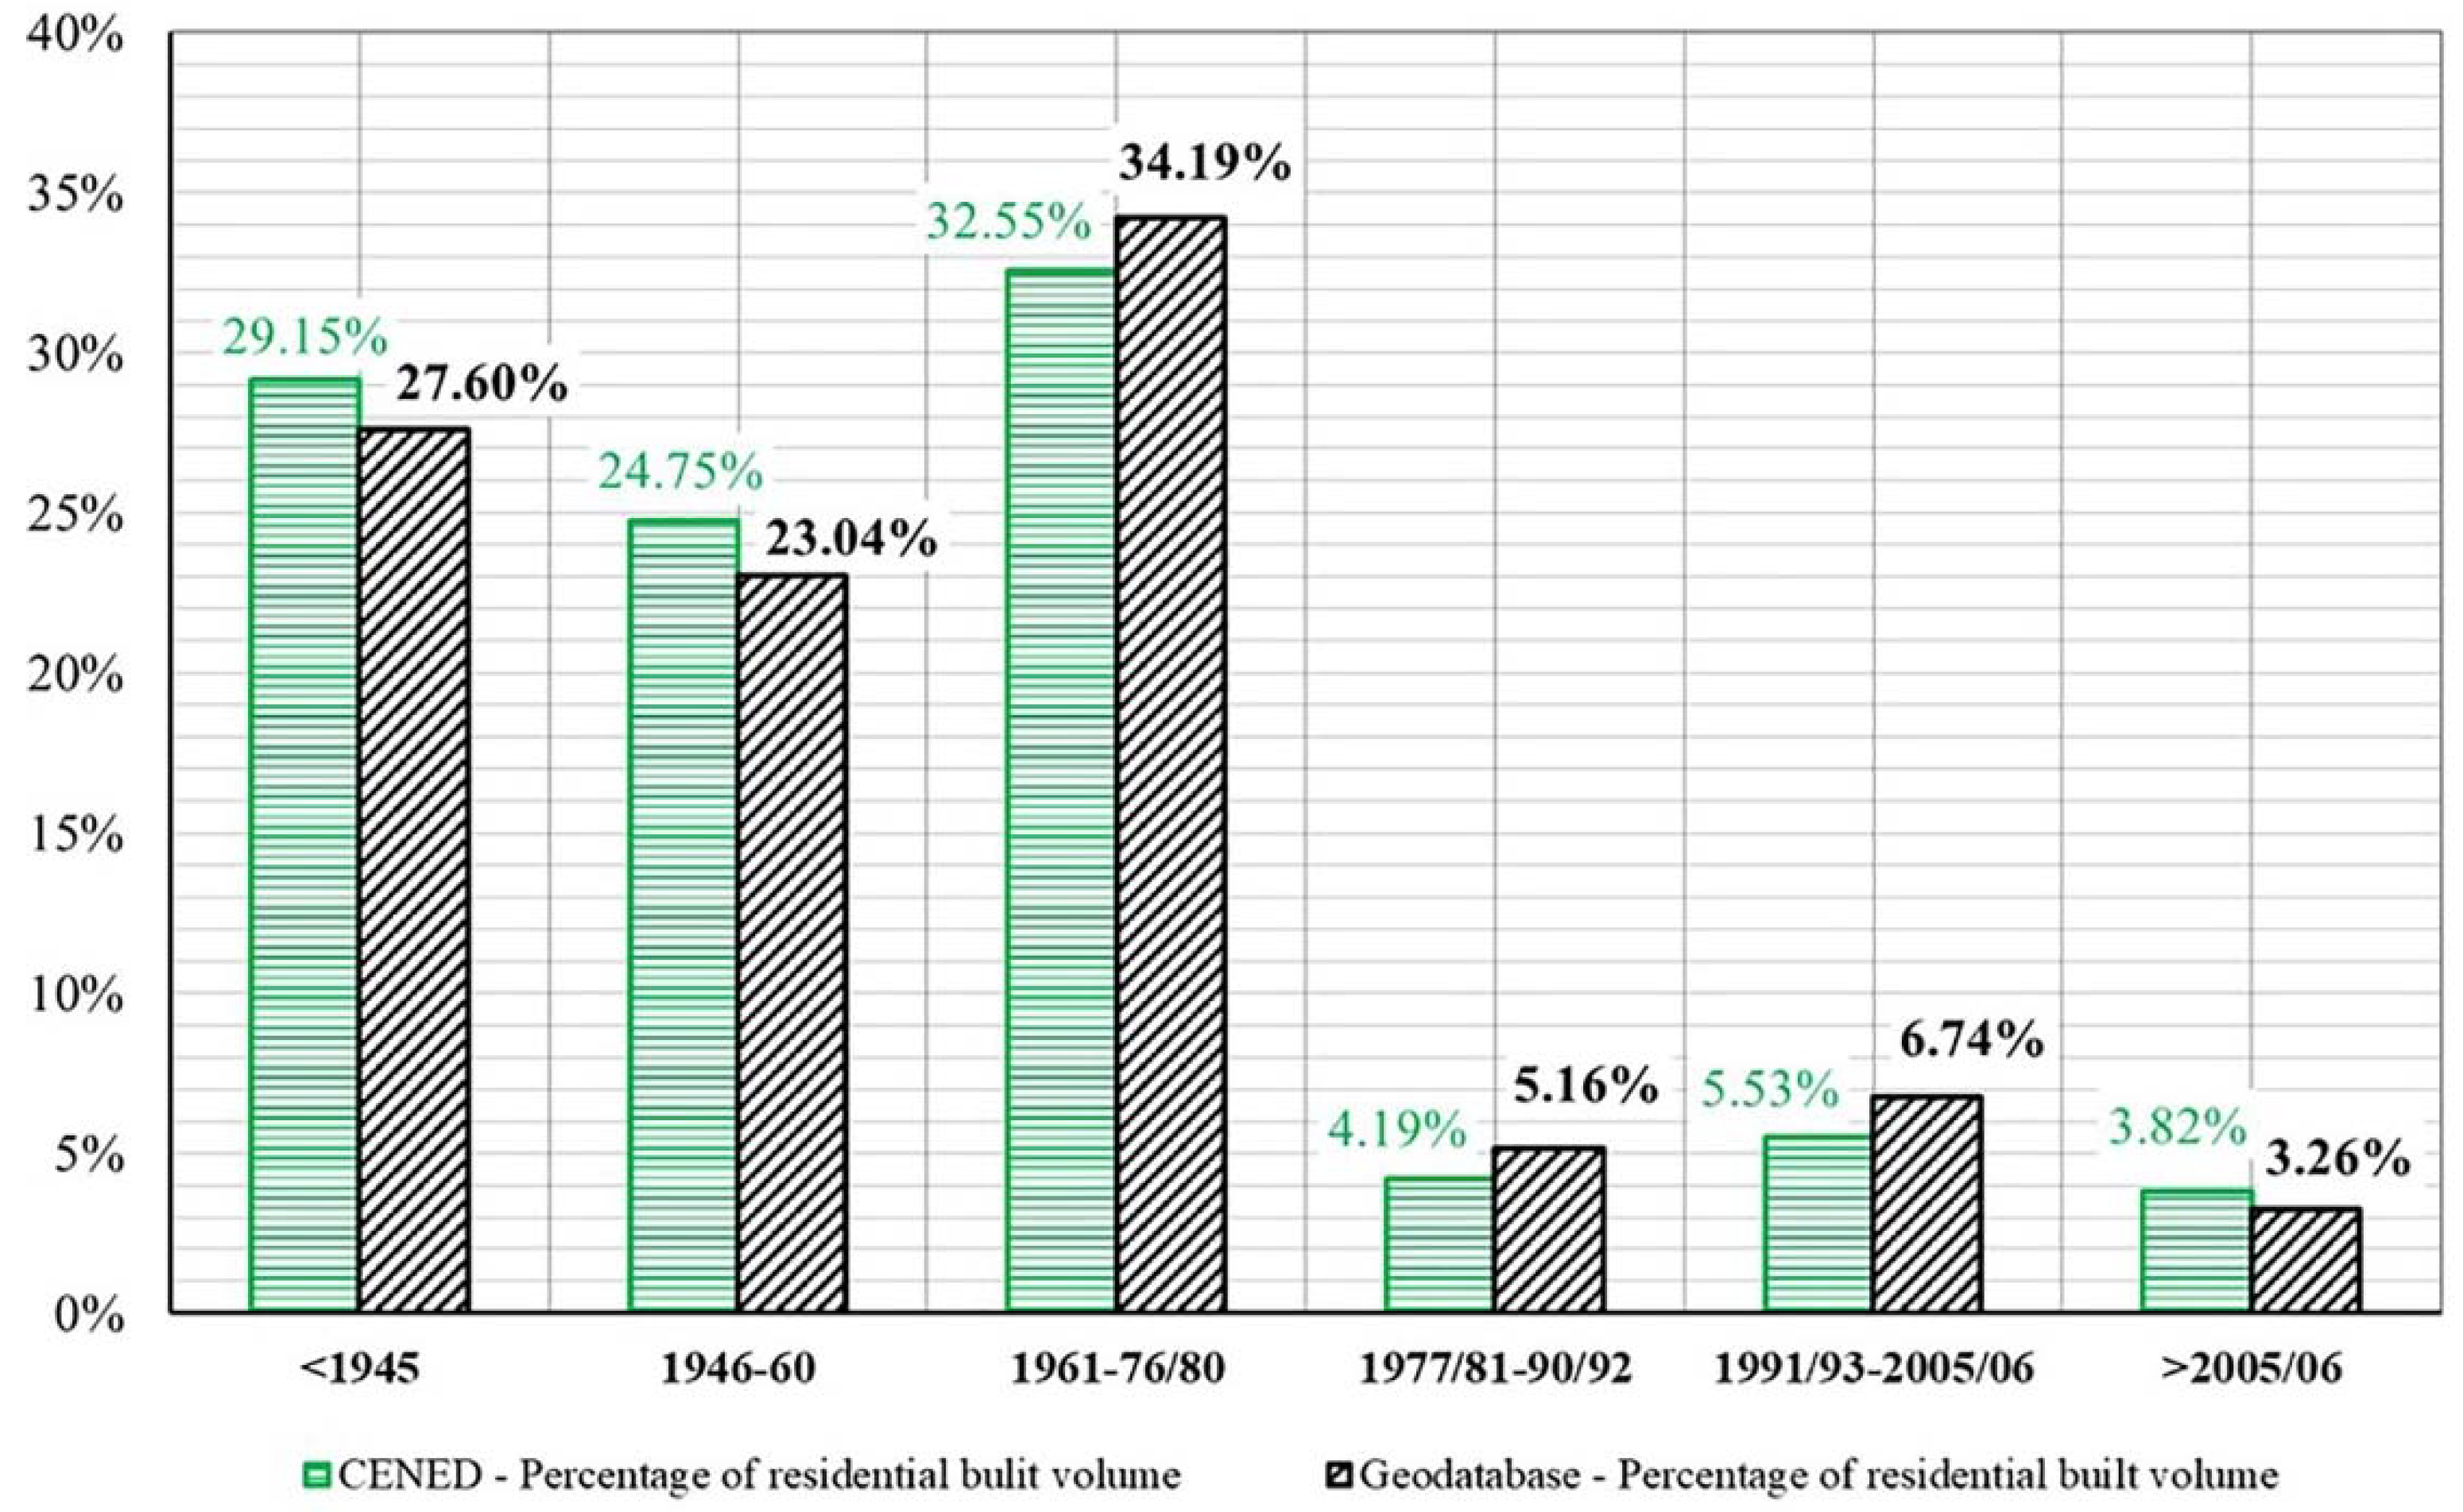
Concerning the period of construction of the buildings, data from the Register of Buildings Energy Performance Certificates (CENED) [44], which concerns more than two-thirds of the existing residential building stock and includes the certified buildings age, has been used. The distribution percentage of the residential built volume by age from the CENED has been compared with those resulting from the procedure, as shown in Figure 10. To that end, the periods of construction considered in the defined procedure have been adjusted to be comparable with the different periods from CENED (<1930, 1930–45, 1946–60, 1961–76, 1977–92, 1993–2006, and >2006).
According to both CENED and the GIS procedure, almost one-third of the building stock is old, and half of the building stock dates back to the housing boom period. In detail, negligible underestimations for the periods <1945, 1946–60, and >2005/06 and negligible overestimations for the periods 1961–76/1980, 1977/81–90/92, and 1991/93–2005/06 resulted from the GIS procedure, therefore confirming a good overall compliance.
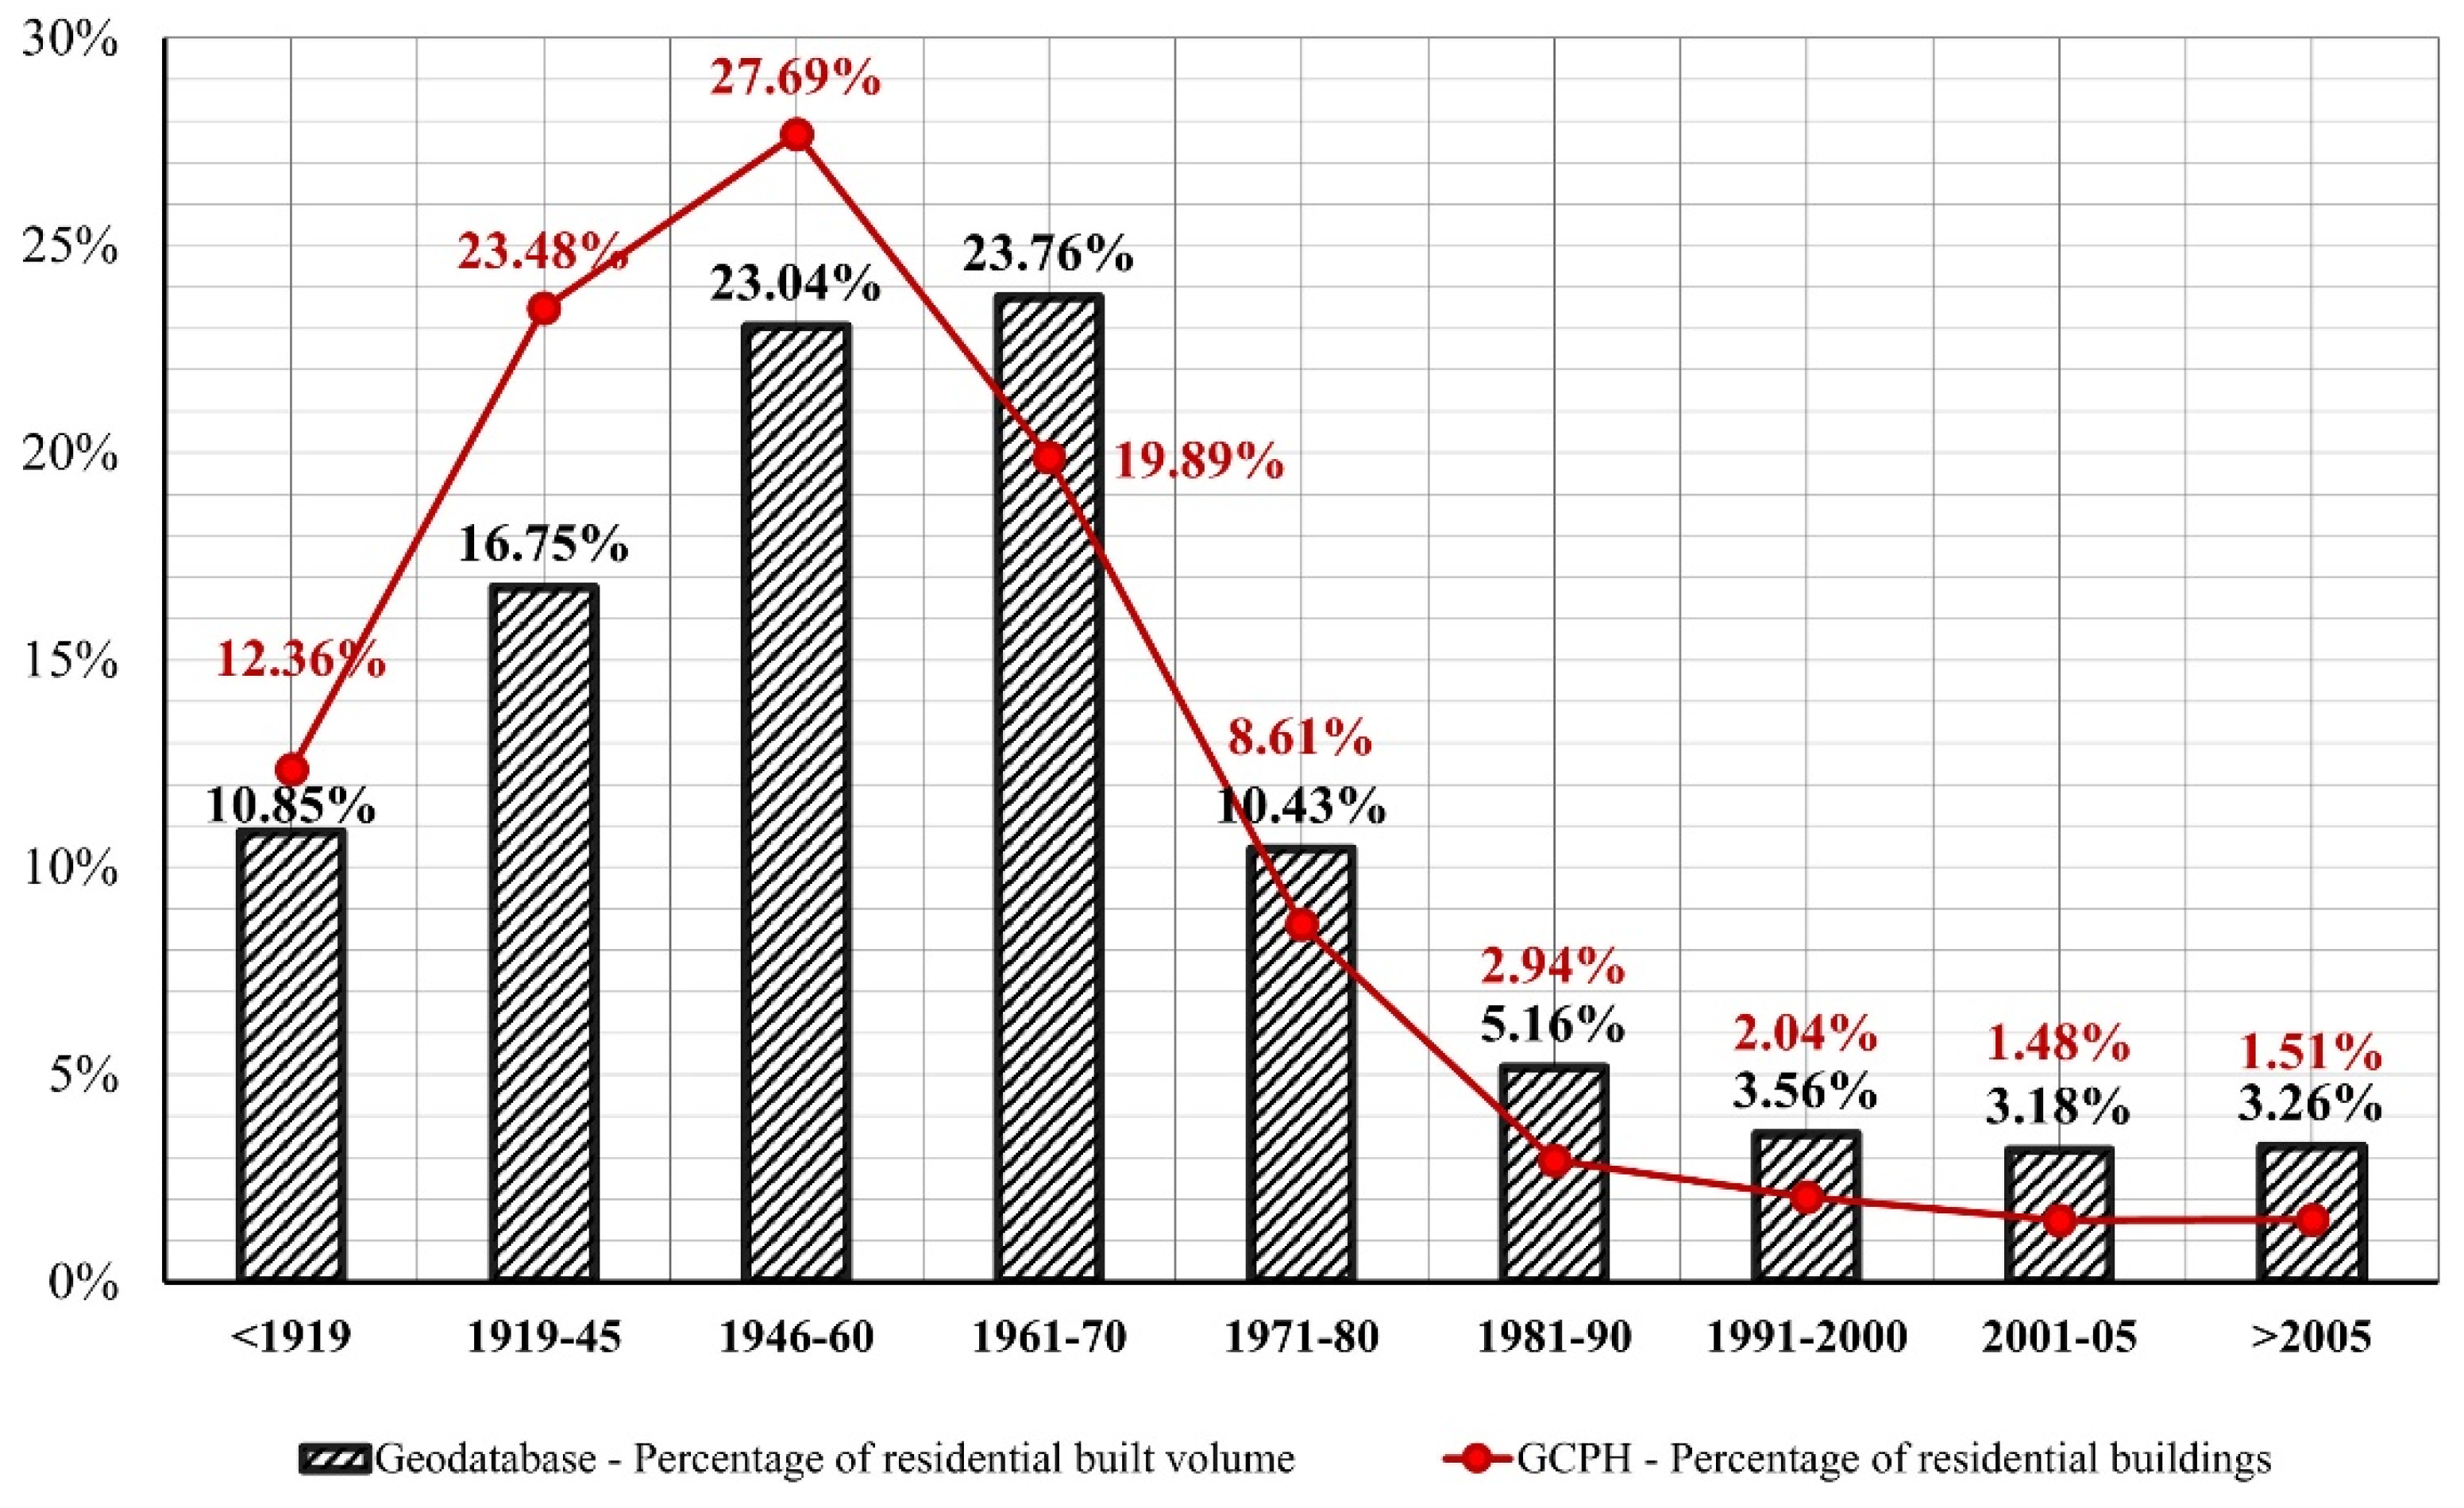
As an addition, the data provided by Istat regarding the number of buildings by age at the municipal level has been compared with the volume by age estimated with the procedure. Hence, a proportional share of volume per building among the different construction periods has been assumed in the first analysis.
According to Figure 11, a similar distribution can be seen, although an underestimation for the three oldest periods (<1919, 1919–45, and 1945–60) and, vice versa, a slight overestimation for the others (1961–70, 1971–80, 1981–90, 1991–2000, 2001–05, and >2005) resulted from the GIS procedure. These discrepancies strengthen the effectiveness of the elaborations as the GIS procedure bases the buildings’ volume age on the number of building units. Considering that reinforced concrete-based buildings are generally wider with respect to the older ones (load-bearing masonry based), a low number of building units is actually allocated in a high number of old buildings.
Concerning the validation of the estimated building stock by use category, three sources of data have been considered.
The first one refers to the national Building Register [34]. Related data are annually published for each Italian city due to income evaluations; hence, buildings are categorized based on use and income. In particular, the data of the residential units and, for the office use, those referring to private offices, studios, and public offices have been used. Data are directly provided as the volume in the public offices’ cases and as floor areas in the residential, private offices/studios. Hence, an average height of 3 m has been assumed for calculating the volume of the latter cases. Therefore, a residential built volume of 208.04 Mm3 and an office built volume of 26.06 Mm3 have been derived. As the Building Register does not include the data of the surface of buildings hosting bank and insurance companies, it has been considered a second source, i.e., the survey on the offices’ real-estate trade in Milan elaborated by CRESME research center [45]. CRESME, which provides information on the construction market to the private sector and public institutions, allows the accounting for commercial buildings’ floor surface, distinguishing the office ones hosting banks and insurance companies. Hence, by assigning an average height of 3 m to the latter, their volume has been estimated and added to the previous one of 26.06 Mm3, obtaining an overall office built volume of 43.24 Mm3.
The third source is Istat, from which, elaborating data aggregated at the municipal level, a residential built volume of 211.12 Mm3 has been derived.
Based on the procedure described in the previous sections and on the implemented Geo-database, an overall residential built volume of 216.97 Mm3 has been calculated, thus returning acceptable gaps (i.e., 4.3% and 2.8% greater than those of Building Register and Istat, respectively). Regarding the offices, through the GIS procedure, the office buildings volume has been determined as 26.29 Mm3. Then, by multiplying the number of nonresidential building units within residential buildings by the average surface of flats with residing people (the only surface available data, as reported in Table 3), an average height of 3 m, and the ratio of net-to-gross volume, the volume of private offices/studios has been determined. This has been summed to the office buildings’ volume, finally obtaining an overall office built volume of 46.42 Mm3, which has an acceptable gap compared to the estimation based on the Building Register integrated with CRESME (+7.3%).
Hence, considering the well-known discrepancies and lack of data of current buildings, the robustness and reliability of the developed procedure have been demonstrated.
3.3. Insights on the Overall Method
As mentioned in the introduction, the present article focuses on the detailed description of the first part of a wider research, which aimed to develop a method for quantifying and mapping the buildings’ energy demand of the urban areas within Italy, as briefly outlined in a recent academic contribution [46].
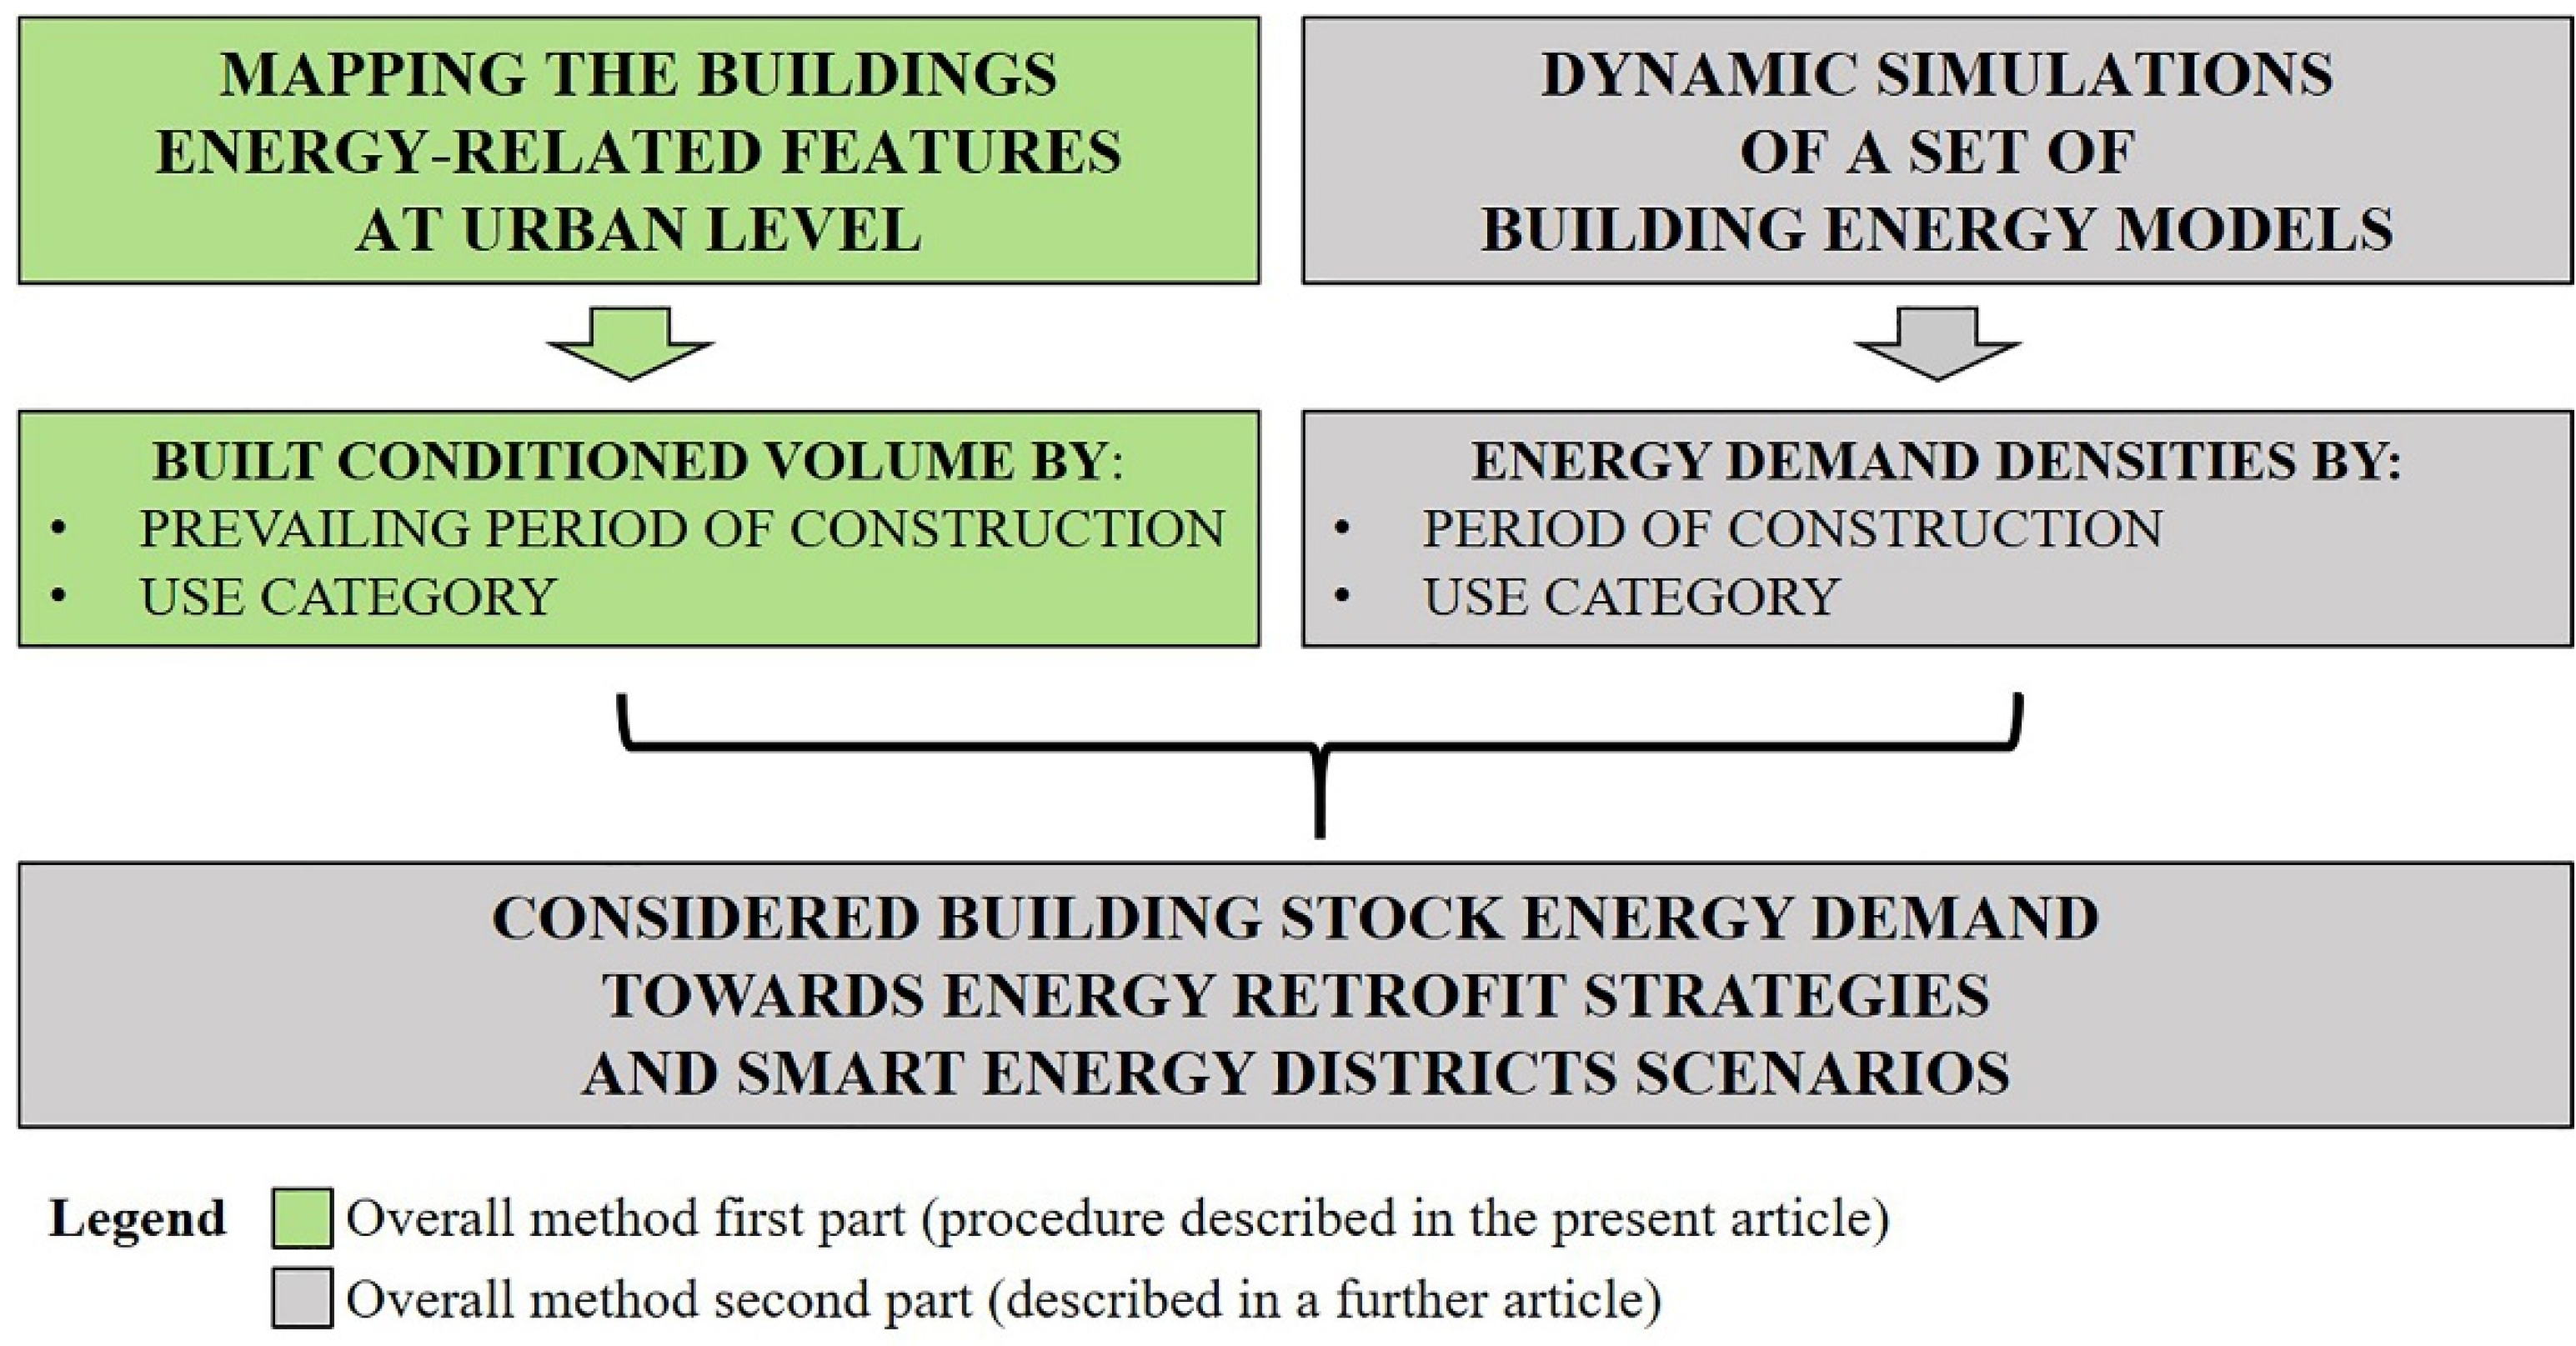
As shown in Figure 12, the second part of the overall method foresees the dynamic simulation of a set of building energy models featured by different technological solutions and main uses. The resulting thermal and electric energy demand densities are then associated to the considered built volume, characterized by construction periods and uses. Therefore, the method allows the mapping of the energy demands of the building stock as a starting point for planning energy retrofit strategies and focusing on the assessment of the energy demand toward Smart Energy Districts scenarios.
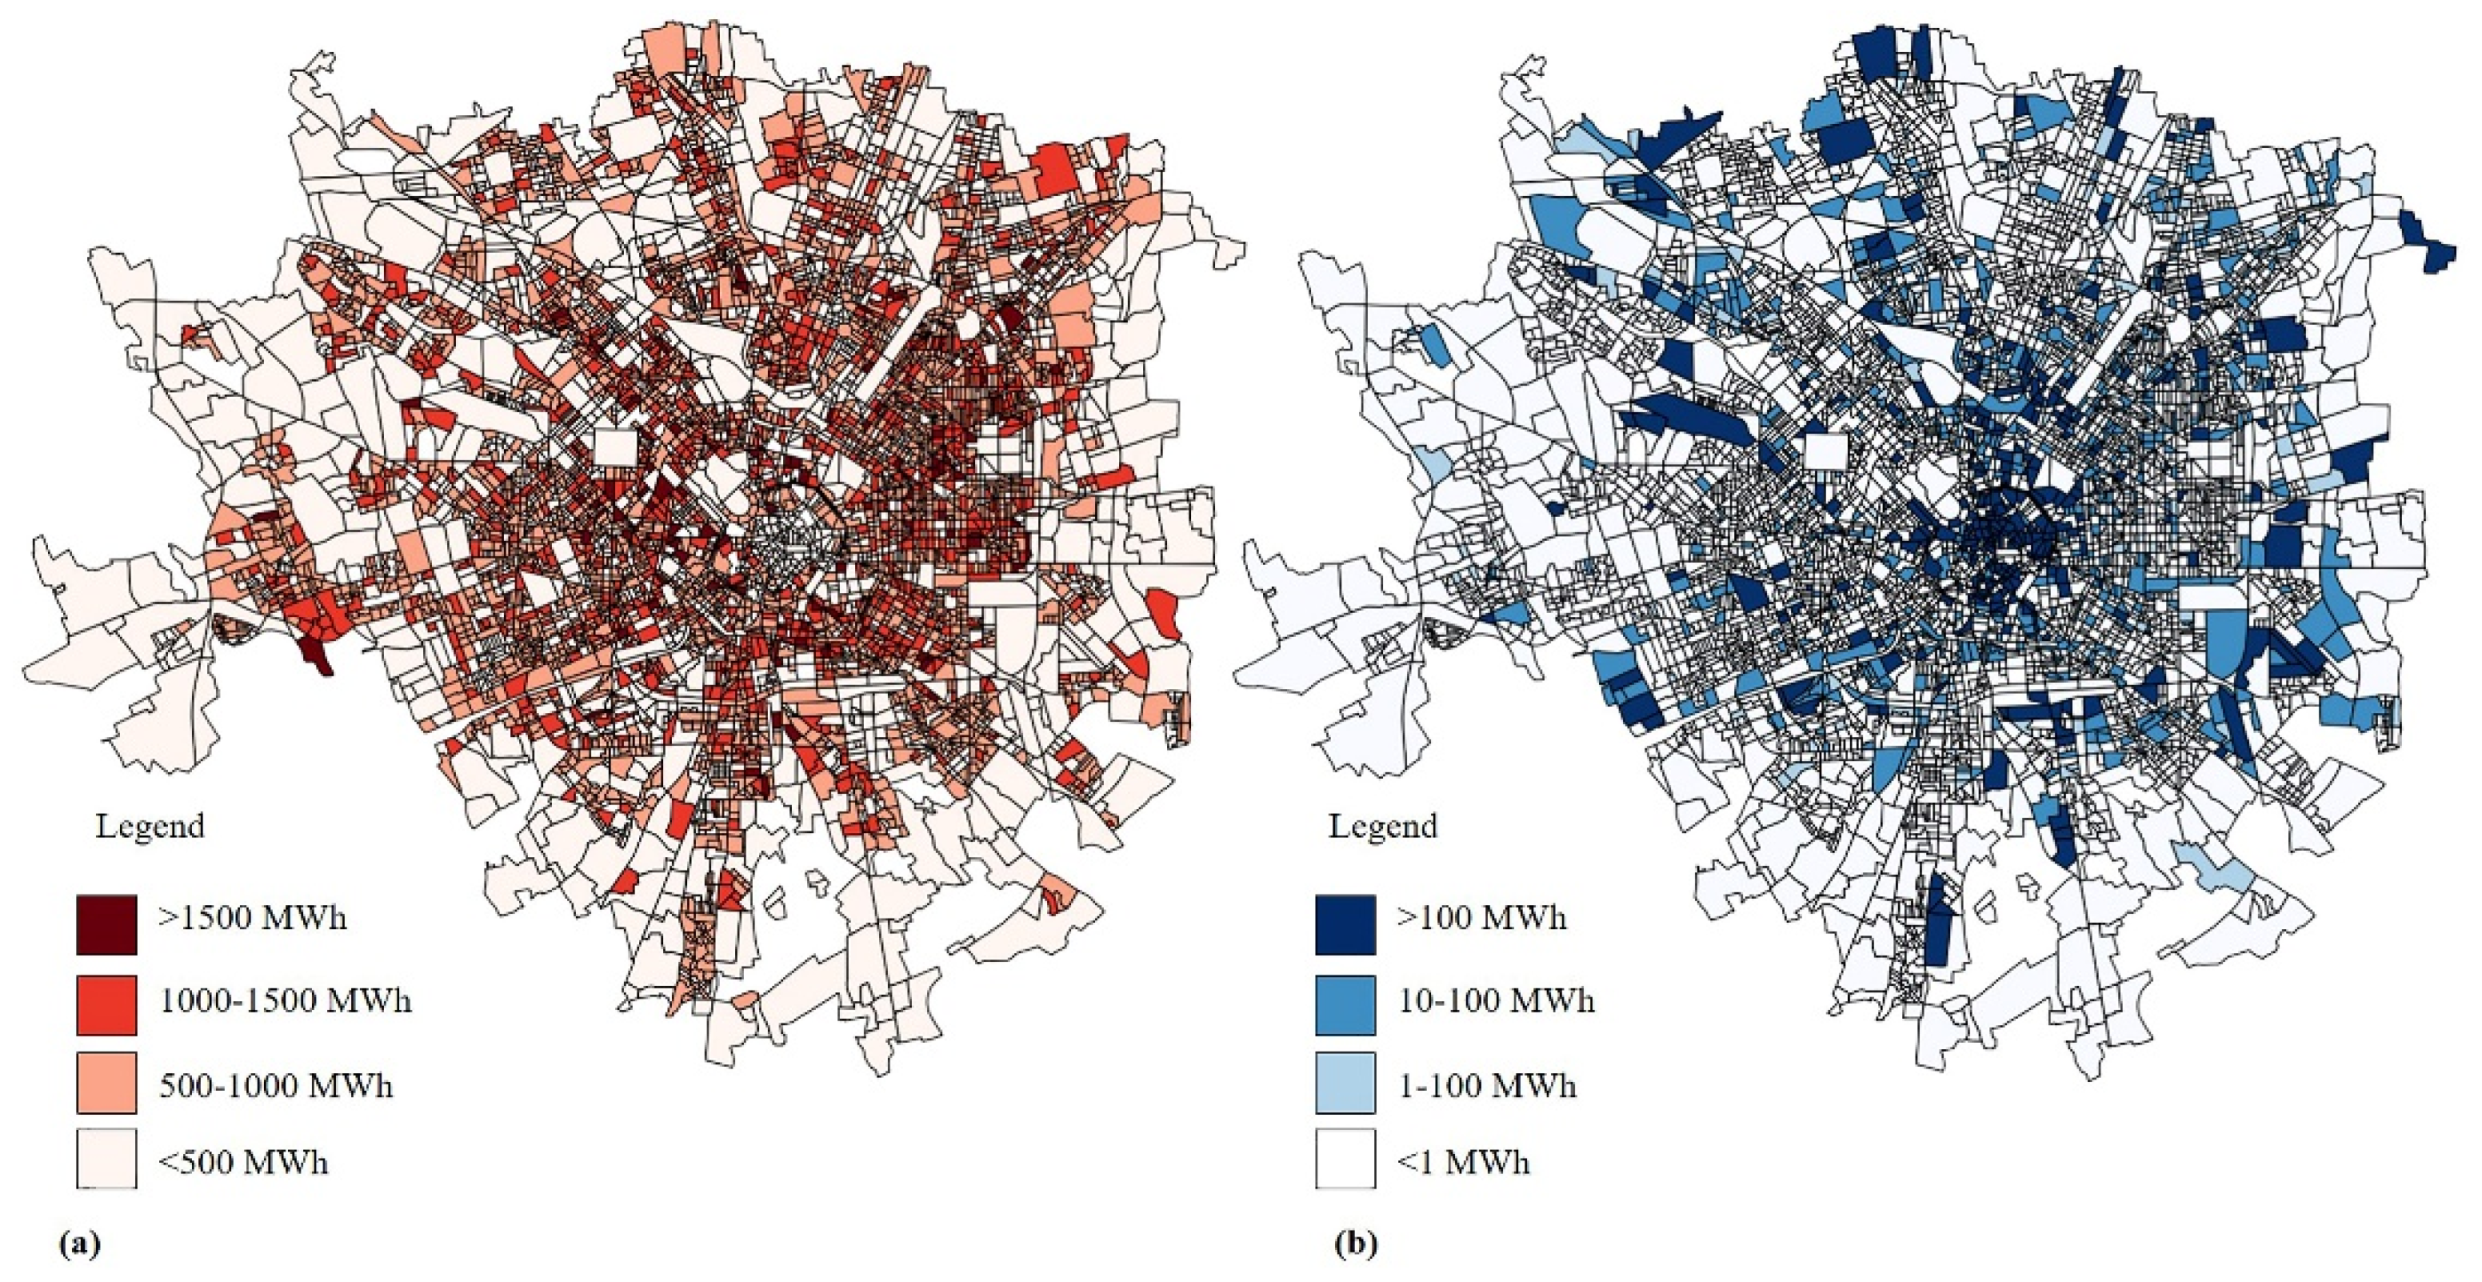
As an example of the results obtained by applying the overall method to the Milan case study, the spatial distribution of energy demands for space heating in residential buildings and energy demands for space cooling in office buildings are visualized in Figure 13.
4. Discussion
For decades, authorities and researchers have been considering the building stock as a key sector for contrasting climate change. In this framework, the accurate estimation of the energy demands of buildings starting from the assessment of energy-related building features is a crucial issue, strongly affected by data availability, quality, and interoperability. Within this study, the details of a procedure to implement a Geo-database for characterizing an existing urban building stock based on data sources that are largely available throughout the Italian territory have been defined. The developed procedure can be useful for researchers and energy planners who have to define the building stock consistency and its spatial distribution toward energy demand assessment and the definition of improving scenarios. As a matter of fact, this article reports the first part of a wider research aimed at developing a method for quantifying and mapping the energy demand of buildings of the urban areas within Italy and whose additional details and results are going to be described in a further article.
The procedure presented here enables the built volume characterization based on two main aspects affecting the energy performance of the buildings. Specifically, by correlating the geometric information with the data from the national census, it is possible to quantify the built volume by periods of construction, featuring different technological solutions, as well as by residential and office uses, the most diffuse categories in the urban context revealing different usage patterns. Hence, it is possible to assign the simulated or metered energy demands of representative buildings having the same age and use category to each built volume in the studied urban area.
The procedure has been applied to the urban context of Milan, one of the Italian cities that has already implemented the Topographic Database according to the national specifications implementing the INSPIRE European Directive, by characterizing the geo-referenced building stock and carrying out related maps. The comparisons between the obtained results and the available data aggregated at the municipal level from the Register of Buildings Energy Performance Certificates, the General Census of Population and Houses, the Building Register, and the CRESME research center revealed similar patterns.
The described procedure refers to the features of the Italian data availability, but a similar approach can be adopted in other contexts by adapting the details to the specific available data. Nevertheless, it is possible to point out that the used data from the national census are among those mandatorily required by Eurostat (the European Statistical Office) aggregated on the municipal scale, which likely means that related surveys are conducted by starting from a higher level of detail. As a matter of fact, it requires Member States to create spatial data on buildings and the collection of georeferenced data regarding the statistical units. The innovation of the described procedure, therefore, is related to the identification of the energy-related features, and their actual evaluation by an accurate, not time-consuming, and replicable bottom-up method in accordance with the indications by the INSPIRE Directive and their geographical representation by GIS maps. Given that, further developments could be aimed at exploring the applications of the method and related adjustments in other European territories.
Author Contributions
Conceptualization, S.F. and P.C.; methodology, S.F.; validation, S.F. and F.Z.; formal analysis, S.F.; investigation, F.Z.; resources, F.Z.; data curation, F.Z.; writing—original draft preparation, F.Z.; writing—review and editing, S.F. and P.C.; visualization, S.F. and F.Z.; supervision, G.D. All authors have read and agreed to the published version of the manuscript.
Funding
This research received no external funding.
Conflicts of Interest
The authors declare no conflict of interest.
Abbreviations
| ACE | Census Area |
| BCen | Buildings Census |
| CadB | Cadastre of buildings |
| Cart | Cartography |
| CENED | Register of Buildings Energy Performance Certificates of Lombardy Region |
| DEM | digital elevation model |
| EC | European Community |
| EPBD | Energy Performance Building Directive |
| EPCR | Energy Performance Certificates Register |
| EU | European Union |
| GCPH | General Census of Population and Houses |
| GHG | Greenhouse gas |
| GIS | Geographic Information Systems |
| INSPIRE | Spatial Information in the European Community |
| Istat | National Institution of Statistics |
| OSM | Open Street Map |
| TDb | Topographic Database |
References
- International Energy Agency (IEA). Energy Technology Perspectives 2016—Towards Sustainable Urban Energy Systems; IEA: Paris, France, 2016. [Google Scholar]
- European Union Parliament and Council. Directive 2018/844 of the European Parliament and of the Council of 30 May 2018 Amending Directive 2010/31/EU on the Energy Performance of Buildings and Directive 2012/27/EU on Energy Efficiency; Official Journal of the European Union: Luxembourg, 2018. [Google Scholar]
- Ferrari, S.; Zagarella, F.; Caputo, P.; D’Amico, A. Results of a literature review on methods for estimating buildings energy demand at district level. Energy 2019, 175, 1130–1137. [Google Scholar] [CrossRef]
- Ferrari, S.; Zagarella, F.; Caputo, P.; Bonomolo, M. Assessment of tools for urban energy planning. Energy 2019, 176, 544–551. [Google Scholar] [CrossRef]
- Li, C. 2.09—GIS for Urban Energy Analysis, Comprehensive Geographic Information Systems. In Reference Module in Earth Systems and Environmental Sciences; Elsevier: Oxford, UK, 2018; pp. 187–195. [Google Scholar]
- Alhamwi, A.; Medjroubi, W.; Vogt, T.; Agert, C. GIS-based urban energy systems models and tools: Introducing a model for the optimisation of flexibilisation technologies in urban areas. Appl. Energy 2017, 191, 1–9. [Google Scholar] [CrossRef]
- Belussi, L.; Danza, L.; Ghellere, M.; Guazzi, G.; Meroni, I.; Salamone, F. Estimation of building energy performance for local energy policy at urban scale. Energy Procedia 2017, 122, 98–103. [Google Scholar] [CrossRef]
- Buffat, R.; Froemelt, A.; Heeren, N.; Raubal, M.; Hellweg, S. Big data GIS analysis for novel approaches in building stock modelling. Appl. Energy 2017, 208, 277–290. [Google Scholar] [CrossRef]
- Caputo, P.; Costa, G.; Ferrari, S. A supporting method for defining energy strategies in the building sector at urban scale. Energy Policy 2013, 55, 261–270. [Google Scholar] [CrossRef]
- de Oliveira, F.; Schneider, S.; Quiquerez, L.; Lachal, B.; Hollmuller, P. Spatial and temporal characterization of energy demand and resources for an existing and dense urban district in Geneva. Energy Procedia 2017, 122, 259–264. [Google Scholar] [CrossRef]
- Groppi, D.; de Santoli, L.; Cumo, F.; Garcia, D.A. A GIS-based model to assess buildings energy consumption and usable solar energy potential in urban areas. Sustain. Cities Soc. 2018, 40, 546–558. [Google Scholar] [CrossRef]
- Heiple, S.; Sailor, D.J. Using building energy simulation and geospatial modeling techniques to determine high resolution building sector energy consumption profiles. Energy Build. 2008, 40, 1426–1436. [Google Scholar] [CrossRef] [Green Version]
- Howard, B.; Parshall, L.; Thompson, J.; Hammer, S.; Dickinson, J.; Modi, V. Spatial distribution of urban building energy consumption by end use. Energy Build. 2012, 45, 141–151. [Google Scholar] [CrossRef]
- Ma, J.; Cheng, J.C. Estimation of the building energy use intensity in the urban scale by integrating GIS and big data technology. Appl. Energy 2016, 183, 182–192. [Google Scholar] [CrossRef]
- Monteiro, C.S.; Costa, C.; Pina, A.; Santos, M.Y.; Ferrão, P. An urban building database (UBD) supporting a smart city information system. Energy Build. 2018, 158, 244–260. [Google Scholar] [CrossRef]
- Mutani, G.; Delmastro, C.; Gargiulo, M.; Corgnati, S.P. Characterization of building thermal energy consumption at the urban scale. Energy Procedia 2016, 101, 384–391. [Google Scholar] [CrossRef] [Green Version]
- Nageler, P.; Zahrer, G.; Heimrath, R.; Mach, T.; Mauthner, F.; Leusbrock, I.; Schranzhofer, H.; Hochenauer, C. Novel validated method for GIS based automated dynamic urban building energy simulations. Energy 2017, 139, 142–154. [Google Scholar] [CrossRef]
- Quintana, S.; Huang, P.; Han, M.; Zhang, X. A Top-Down Digital Mapping of Spatial-Temporal Energy Use for Municipality-Owned Buildings: A Case Study in Borlänge, Sweden. Buildings 2021, 11, 72. [Google Scholar] [CrossRef]
- Ratti, C.; Baker, N.; Steemers, K. Energy consumption and urban texture. Energy Build. 2005, 37, 762–776. [Google Scholar] [CrossRef]
- Torabi Moghadam, S.T.; Toniolo, J.; Mutani, G.; Lombardi, P. A GIS-statistical approach for assessing built environment energy use at urban scale. Sustain. Cities Soc. 2018, 37, 70–84. [Google Scholar] [CrossRef]
- Yeo, I.A.; Yoon, S.H.; Yee, J.J. Development of an urban energy demand forecasting system to support environmentally friendly urban planning. Appl. Energy 2013, 110, 304–317. [Google Scholar] [CrossRef]
- Saretta, E.; Caputo, P.; Frontini, F. An integrated 3D GIS-based method for estimating the urban potential of BIPV retrofit of façades. Sustain. Cities Soc. 2020, 62, 102410. [Google Scholar] [CrossRef]
- Pampuri, L.; Belliardi, M.; Bettini, A.; Cereghetti, N.; Curto, I.; Caputo, P. A method for mapping areas potentially suitable for district heating systems. An application to Canton Ticino (Switzerland). Energy 2019, 189, 116297. [Google Scholar] [CrossRef]
- Caputo, P.; Pasetti, G. Boosting the energy renovation rate of the private building stock in Italy: Policies and innovative GIS-based tools. Sustain. Cities Soc. 2017, 34, 394–404. [Google Scholar] [CrossRef]
- Mastrucci, A.; Baume, O.; Stazi, F.; Leopold, U. Estimating energy savings for the residential building stock of an entire city: A GIS-based statistical downscaling approach applied to Rotterdam. Energy Build. 2014, 75, 358–367. [Google Scholar] [CrossRef]
- Sarralde, J.J.; Quinn, D.J.; Wiesmann, D.; Steemers, K. Solar energy and urban morphology: Scenarios for increasing the renewable energy potential of neighbourhoods in London. Renew. Energy 2015, 73, 10–17. [Google Scholar] [CrossRef] [Green Version]
- Fonseca, J.A.; Schlueter, A. Integrated model for characterization of spatiotemporal building energy consumption patterns in neighborhoods and city districts. Appl. Energy 2015, 142, 247–265. [Google Scholar] [CrossRef]
- Reinhart, C.F.; Davila, C.C. Urban building energy modeling–A review of a nascent field. Build. Environ. 2016, 97, 196–202. [Google Scholar] [CrossRef] [Green Version]
- Caputo, P.; Pasetti, G.; Ferrari, S. Implementation of an urban efficiency index to comprehend post-metropolitan territories—The case of Greater Milan in Italy. Sustain. Cities Soc. 2019, 48, 101565. [Google Scholar] [CrossRef]
- Yang, J.; Tan, K.K.; Santamouris, M.; Lee, S.E. Building energy consumption raw data forecasting using data cleaning and deep recurrent neural networks. Buildings 2019, 9, 204. [Google Scholar] [CrossRef] [Green Version]
- Ferrari, S.; Zanotto, V. Defining representative building energy models. In Building Energy Performance Assessment in Southern Europe; Springer: Cham, Switzerland, 2016; pp. 61–77. [Google Scholar] [CrossRef]
- Ferrari, S.; Zanotto, V. Office buildings cooling need in the Italian climatic context: Assessing the performances of typical envelopes. Energy Procedia 2012, 30, 1099–1109. [Google Scholar] [CrossRef] [Green Version]
- European Union Parliament and Council. Directive 2007/2/EC of the European Parliament and of the Council of 14 March 2007 Establishing an Infrastructure for Spatial Information in the European Community (INSPIRE); Official Journal of the European Union: Luxembourg, 2007. [Google Scholar]
- Agenzia delle Entrate, Osservatorio Del Mercato Immobiliare. Statistiche Catastali 2012—Catasto Edilizio Urbano; Italy, 2013. Available online: https://wwwt.agenziaentrate.gov.it/mt/osservatorio/Tabelle%20statistiche/archivio/StatisticheCatastali2012_29102013.pdf (accessed on 22 July 2021). (In Italian)
- QGIS Development Team. QGIS Geographic Information System. Open Source Geospatial Foundation Project. Available online: http://qgis.osgeo.org (accessed on 16 April 2019).
- Python 2.7. Available online: https://www.python.org/download/releases/2.7 (accessed on 29 January 2021).
- European Commission Joint Research Centre, INSPIRE Thematic Working Group Buildings. D2.8.III.2 INSPIRE Data Specification on Buildings—Technical Guidelines; European Commission Joint Research Centre: Brussels, Belgium.
- Ministero per la Pubblica Amministrazione e l’Innovazione. Decreto 10 Novembre 2011. Regole Tecniche per la Definizione del Contenuto del Repertorio Nazionale dei Dati Territoriali, Nonché delle Modalità di Prima Costituzione e di Aggiornamento dello Stesso (GU n.48 del 27/02/2012—Suppl. Ordinario n.37); Gazzetta Ufficiale della Repubblica Italiana: Italy, 2012. Available online: https://www.gazzettaufficiale.it/eli/id/2012/02/27/12A01801/sg (accessed on 22 July 2021). (In Italian)
- Intesa Stato Regioni Enti Locali Sistemi Informativi Territoriali. Specifiche per la Realizzazione dei Database Topografici di Interesse Generale—Il Catalogo Degli Oggetti—Revisione delle Specifiche di Contenuto 1n 1007_1 e 1n 1007_2; Italy, 2006. Available online: https://geodati.gov.it/geoportale/images/Specifica_GdL2_09-05-2016.pdf (accessed on 22 July 2021). (In Italian)
- Istat. 15° Censimento Generale della Popolazione e delle Abitazioni 2011; Manuale della Rilevazione: Roma, Italy, 2011. (In Italian) [Google Scholar]
- Istat. Available online: https://www.istat.it/it/archivio/104317 (accessed on 16 April 2019).
- Ente Italiano di Normazione (UNI). UNI 10379:1994 Riscaldamento Degli Edifici. Fabbisogno Energetico Convenzionalmente Normalizzato. Metodo di Calcolo e Verifica; UNI: Milano, Italy, 1994; Available online: http://store.uni.com/catalogo/uni-10379-1994 (accessed on 22 July 2021). (In Italian)
- Regional Topographic Database. Available online: http://www.geoportale.regione.lombardia.it/en/home (accessed on 16 April 2019).
- CENED. Available online: http://www.cened.it/ (accessed on 6 May 2020).
- Centro Ricerche Economiche Sociologiche e di Mercato nell’Edilizia (CRESME) Ricerche S.p.A. Osservatorio Sull’offerta di Immobili ad Uso Ufficio a Milano; CRESME: Roma, Italy, 2016; Available online: http://www.aspesi-associazione.it/public/files/uffici_milano_report.pdf (accessed on 22 July 2021). (In Italian)
- Ferrari, S.; Zagarella, F.; Caputo, P. Geo-Referenced Procedure to Estimate the Urban Energy Demand Profiles Towards Smart Energy District Scenarios. In Digital Transformation of the Design, Construction and Management Processes of the Built Environment; Springer: Cham, Switzerland, 2020; pp. 367–377. [Google Scholar] [CrossRef] [Green Version]
Figure 1.
Flowchart of the pre-processing procedure.

Figure 2.
Used spatial data in GIS environment.

Figure 3.
Census Unit association based on Buildings’ centroids.

Figure 4.
Flowchart of the building stock characterization procedure.

Figure 5.
Determination of the prevailing period of construction of each Census Unit having residential building units (a) and of the prevailing period of construction of each Census Area (b) for assigning it to each nonresidential Census Unit (c).
Figure 5.
Determination of the prevailing period of construction of each Census Unit having residential building units (a) and of the prevailing period of construction of each Census Area (b) for assigning it to each nonresidential Census Unit (c).

Figure 6.
Exclusion of unconditioned volumes.

Figure 7.
Characterization of each Census Unit by percentages of (a) residential and (b) office volume.
Figure 7.
Characterization of each Census Unit by percentages of (a) residential and (b) office volume.

Figure 8.
Map of Milan Census Units based on prevailing period of construction.

Figure 9.
Map of Milan Census Units based on buildings prevailing use category.

Figure 10.
Comparison of distribution of residential built volume by period of construction according to the CENED municipal data and the Geo-database elaborations.
Figure 10.
Comparison of distribution of residential built volume by period of construction according to the CENED municipal data and the Geo-database elaborations.

Figure 11.
Comparison of distribution of residential stock by period of construction according to the Istat municipal data and the Geo-database elaborations.
Figure 11.
Comparison of distribution of residential stock by period of construction according to the Istat municipal data and the Geo-database elaborations.

Figure 12.
Diagram of the defined method for estimating urban building stocks’ energy demand.

Figure 13.
Map of Milan Census Units based on annual energy demands for space heating of residential buildings (a) and for space cooling of office buildings (b).
Figure 13.
Map of Milan Census Units based on annual energy demands for space heating of residential buildings (a) and for space cooling of office buildings (b).


Table 1.
Buildings’ data and sources in GIS-based procedures of the selected technical literature.
| Reference | Data on Buildings 1 | ||
|---|---|---|---|
| Shape | Age | Use Category | |
| Alhamwi et al. [6] | OSM | - | OSM |
| Belussi et al. [7] | Cart + GIS | BCen | Masterplan |
| Buffat et al. [8] | BCen + CadB + OSM +Cart | CadB | CadB |
| Caputo et al. [9] | Cart | BCen | BCen |
| Caputo, Pasetti [24] | GIS | BCen | GIS |
| de Oliveira et al. [10] | GIS | GIS | GIS |
| Fonseca, Schlueter [27] | OSM | OSM | OSM |
| Groppi et al. [11] | GIS | GIS | GIS |
| Heiple, Sailor [12] | GIS | GIS | GIS |
| Howard et al. [13] | GIS | - | GIS |
| Ma, Cheng [14] | GIS + CadB | BCen + CadB | BCen + CadB |
| Mastrucci et al. [25] | GIS | GIS | GIS |
| Monteiro et al. [15] | GIS | BCen + EPCR | GIS |
| Mutani et al. [16] | GIS | GIS + BCen | GIS + BCen |
| Nageler et al. [17] | GIS + OSM | energy utility | energy utility |
| Pampuri et al. [23] | GIS | CadB | CadB |
| Quintana et al. [18] | GIS | online phonebook | - |
| Ratti et al. [19] | DEM | - | - |
| Saretta et al. [22] | GIS | CadB | CadB |
| Sarralde et al. [26] | GIS | - | GIS |
| Torabi Moghadam et al. [20] | GIS | BCen | GIS |
| Yeo et al. [21] | GIS + CadB | - | GIS + CadB |
1 Legend. BCen: Buildings Census; CadB: Cadastre of buildings; Cart: Cartography; DEM: digital elevation model (i.e., graphical representation of the altitude values of the terrain surface); EPCR: Energy Performance Certificates Register; GIS: GIS maps; OSM: Open Street Map (i.e., GIS worldwide maps elaborated based on voluntarily collected data—https://www.openstreetmap.org, accessed on 25 July 2021).
Table 2.
Adopted spatial datasets and used Attributes from the Topographic Database.
| Dataset | Attributes | |
|---|---|---|
| Name | Description | |
| Volumetric Units | UUID | ID code |
| 0201 01 02 UN-VOL-AV | height (m) | |
| 0201 01 03 UN-VOL-PORZ | portion type | |
| Buildings | CR_EDF_UUID | ID code |
| 0201 02 04 CR_EDF_ST | maintenance status | |
Table 3.
Adopted spatial datasets and used Attributes from the 15th General Census of Population and Houses.
Table 3.
Adopted spatial datasets and used Attributes from the 15th General Census of Population and Houses.
| Dataset | Attributes | |
|---|---|---|
| Name | Description | |
| Spatial Bases | PRO_COM | City ID code |
| NSEZ | Census Unit ID code | |
| ACE | Census Area ID code | |
| Statistical Variables | A2 | N° of flats with ≥1 residing |
| A6 | N° of empty flats | |
| A7 | N° of flats without residing | |
| A44 | Net floor surface of [A2] | |
| E1 | N° of buildings | |
| E2 | N° of used buildings | |
| E3 | N° of residential buildings | |
| E4 | N° of nonresidential (groups of) buildings | |
| Statistical Variables (to be required) | - | N° of building units per period of construction (<1919, 1919–45, 1946–60, 1961–70, 1971–80, 1981–90, 1991–2000, 2001–05, and >2005) |
| - | N° of office (complexes of) buildings | |
Publisher’s Note: MDPI stays neutral with regard to jurisdictional claims in published maps and institutional affiliations. |
© 2021 by the authors. Licensee MDPI, Basel, Switzerland. This article is an open access article distributed under the terms and conditions of the Creative Commons Attribution (CC BY) license (https://creativecommons.org/licenses/by/4.0/).
Share and Cite
MDPI and ACS Style
Ferrari, S.; Zagarella, F.; Caputo, P.; Dall’O’, G. Mapping Buildings’ Energy-Related Features at Urban Level toward Energy Planning. Buildings 2021, 11, 322. https://0-doi-org.brum.beds.ac.uk/10.3390/buildings11080322
AMA Style
Ferrari S, Zagarella F, Caputo P, Dall’O’ G. Mapping Buildings’ Energy-Related Features at Urban Level toward Energy Planning. Buildings. 2021; 11(8):322. https://0-doi-org.brum.beds.ac.uk/10.3390/buildings11080322
Chicago/Turabian StyleFerrari, Simone, Federica Zagarella, Paola Caputo, and Giuliano Dall’O’. 2021. "Mapping Buildings’ Energy-Related Features at Urban Level toward Energy Planning" Buildings 11, no. 8: 322. https://0-doi-org.brum.beds.ac.uk/10.3390/buildings11080322
Note that from the first issue of 2016, this journal uses article numbers instead of page numbers. See further details here.