
Dynamics and Decoupling Analysis of Carbon Emissions from Construction Industry in China


1
College of Civil Engineering and Architecture, Jiaxing University, Jiaxing 314001, China
2
Su Zhong Draco Intelligent Engineering Co., Ltd., Nanning 530031, China
3
College of Urban and Environmental Science, Northwest University, Xi’an 710127, China
4
School of Architecture, Southeast University, Nanjing 210096, China
5
Department of Landscape and Architectural Engineering, Guangxi Agricultural Vocational University, Nanning 530007, China
*
Author to whom correspondence should be addressed.
Buildings 2022, 12(3), 257; https://0-doi-org.brum.beds.ac.uk/10.3390/buildings12030257
Submission received: 27 December 2021
/
Revised: 18 February 2022
/
Accepted: 18 February 2022
/
Published: 22 February 2022
(This article belongs to the Special Issue Towards a Carbon Neutral Roadmap of the Building Sector by Mid-Century)
Abstract
:The construction industry is the backbone of most countries, but its carbon emissions are huge and growing rapidly, constraining the achievement of global carbon-peaking and carbon-neutrality goals. China’s carbon emissions are the highest in the world, and the construction industry is the largest contributor. Due to significant differences between provinces in pressure, potential, and motivation to reduce emissions, the “one-size-fits-all” emission reduction policy has failed to achieve the desired results. This paper empirically investigates the spatial and temporal evolution of carbon emissions in China’s construction industry and their decoupling relationship with economic growth relying on GIS tools and decoupling model in an attempt to provide a basis for the formulation of differentiated construction emission reduction policies and plans in China. The study shows that, firstly, the changes in carbon emissions and carbon intensity in the provincial construction industry are becoming increasingly complex, with a variety of types emerging, such as declining, “inverted U-shaped”, growing, “U-shaped”, and smooth fluctuating patterns. Secondly, the coefficient of variation is higher than 0.65 for a long time, indicating high spatial heterogeneity. However, spatial agglomeration and correlation are low, with only a few cluster-like agglomerations formed in the Pearl River Delta, Yangtze River Delta, Bohai Bay, Northeast China, and Loess and Yunnan–Guizhou Plateau regions. Thirdly, most provinces have not reached peak carbon emissions from the construction industry, with 25% having reached peak and being in the plateau stage, respectively. Fourthly, the decoupling relationship between carbon emissions from the construction industry and economic growth, as well as their changes, is increasingly diversified, and most provinces are in a strong and weak decoupling state. Moreover, a growing number of provinces that have achieved decoupling are moving backward to re-coupling, due to the impact of economic transformation and the outbreaks of COVID-19, with the degraded regions increasingly concentrated in the northeast and northwest. Fifthly, we classify China’s 30 provinces into Leader, Intermediate, and Laggard policy zones and further propose differentiated response strategies. In conclusion, studying the trends and patterns of carbon-emission changes in the construction industry in different regions, revealing their spatial differentiation and correlation, and developing a classification management strategy for low carbonized development of the construction industry help significantly improve the reliability, efficiency, and self-adaptability of policy design and implementation.
1. Introduction
1.1. Background
To effectively curb global warming, the Paris Agreement proposes that the global average temperature increase in this century should be limited to 2 °C or even 1.5 °C, and, after further calculation, the United Nations Intergovernmental Panel on Climate Change (IPCC) further proposes that the world must achieve zero net emission of carbon dioxide in 2050, that is, achieve carbon neutrality to achieve the aforementioned goals [1]. Many countries and regions around the world have now proposed carbon-neutral targets; for example, the United Kingdom, Chile, Spain, New Zealand, Hungary, Canada, South Korea, South Africa, Japan, Germany, France, and most other countries have set the target to be reached by 2050 and have started to develop and implement regional- and city-level carbon neutral development plans [2]. China surpassed the United States in terms of carbon emissions in 2005, ranking first in the world. China’s carbon emissions are currently huge and still growing, approaching two times those of the United States and reaching one-third of the world’s [3]. Chinese President Xi Jinping announced at the UN General Assembly and Climate Summit in 2020 that China will increase its national determined contributions and introduce stronger policies and measures to peak carbon dioxide emissions by 2030 and achieve carbon neutrality by 2060 [4,5]. China has a major role to play in global climate-change efforts, and research on China’s carbon emissions is crucial for the world to achieve the goals of “carbon peaking” and “carbon neutrality”.
As the building sector is the key to achieve the goals of “carbon peaking” and “carbon neutrality”, it is increasingly important for governments, enterprises, scholars and the public to promote the transition from high to low or even zero carbon emissions in the building sector in the world, especially in China [6,7]. According to the 2020 Buildings GSR Full Report and statistics released by the International Energy Agency (IEA), global CO2 emissions from the building sector continued rising in 2019, accounting for 28% of global total, including 10% from the construction industry [8,9]. The construction industry in emerging economies, especially in the Asia-Pacific region, emits nearly 60% of the global total carbon dioxide, and China is the largest contributor [10,11]. According to the Annual Development Report of China Building Energy Efficiency 2021 issued by the Building Energy Conservation Research Center of Tsinghua University, the carbon emissions of China’s building sector have been in a cycle of decline, accounting for 38% of the total in China, including 16% from the construction industry, far higher than the global average [12]. From a whole life-cycle perspective, the construction process is not the largest part of the carbon emissions of the building sector, but its contributions cannot be ignored because of the large number of projects under construction each year [13].
China is still in the period of rapid industrialization and urbanization, and as its most important leading industry, the construction industry produces huge carbon emissions, and it is typical and representative in the world to study the dynamic characteristics and spatial and temporal evolution of its carbon emissions [14]. Moreover, “carbon peaking” is a key turning point in the process of achieving “carbon neutrality”, and the decoupling of economic growth and carbon dioxide emissions is its premise and foundation. Therefore, carbon reduction and decarbonization development of the construction industry and the building sector are crucial for China to fulfill its commitments [15,16]. It is of great theoretical significance and practical value to analyze the dynamic characteristics and decoupling of carbon emissions from China’s construction industry, identify the change trend and distribution pattern of its time and space dimensions, and put forward the key points of carbon emission reduction policy design for achieving the “carbon peaking” and “carbon neutrality” goals of local and industry [17,18,19].
1.2. Literature Review
The construction industry is under increasing pressure to reduce emissions, and quantitative monitoring and forecasting of carbon emissions is the first step in all research efforts. Lu [20] calculated carbon emissions from China’s construction industry from 1994 to 2012 by using the Logarithmic Mean Divisia Index (LMDI) method, and concluded that most of the short- and medium-term emission reduction targets have been achieved, but there is still uncertainty about whether the long-term targets can be achieved. Jackson [21] argues that the tools for current carbon emissions from the construction industry are quite complex and called for the development of integrated tools. Liu [22] constructed a real-time carbon-emission monitoring system for the whole industrial chain of prefabricated construction that solves the shortcomings of previous studies that only focused on post hoc analysis of carbon emissions. Chen [23] believed that the carbon emissions from the construction industry in China are much higher than those in the United States, and the production structure effect and energy intensity effect are the key factors leading to the increasing difference between China and the United States. Li [24] argued that the spatial correlation network of carbon emissions from the construction industry in China is becoming increasingly stable, and that geographical proximity, energy intensity, and industrial structure differences have a positive impact on the evolution of the spatial network. Abeydeera [25] and Sicignano [26] analyzed strategies to reduce the carbon embodied in buildings; Kang [27], Robati [28], and Oh [29] further discussed the methods to measure embodied carbon and the strategies to reduce costs in building design and construction; Monahan [30], Brooks [31], and Ng [32] evaluated the carbon embodied in buildings from the perspective of life cycle; Bai [33] believed that the carbon embodied in provincial buildings in China had spatial clustering and autocorrelation.
After figuring out the characteristics of carbon emissions in the construction industry, scholars analyzed the factors and mechanisms influencing carbon emissions in the industry based on methods such as regression models, indexes and, structural decomposition to provide a basis for scenario simulation and policy design. Yildirim [34] conducted an analysis through least squares and co-integration regression models and concluded that GDP, energy use, and trade have a positive long-term effect on carbon emissions from the building sector in Turkey. Shi [35] argued that the end demand effect contributes most to the growth of carbon emissions from the construction industry in China, with a significant offsetting effect of energy intensity. Li [36] concluded that floor area and output intensity are the largest drivers of carbon emissions in the construction industry in Jiangsu Province, China, and further suggested accelerating energy efficiency and the use of green building materials. He [37] conducted an analysis using the LMDI (Logarithmic Mean Divisia Index) model and concluded that the level of economic output has the greatest impact on the growth of carbon emissions in the building sector in China, followed by the per capita construction steel stock indicator, and the energy emission factor is the only inhibitory factor. Erdogan [38] argued that technological innovation is a key factor in reducing carbon emissions from the building sector in BRICS countries, and Liu [39] believed that carbon taxes help reduce carbon dioxide emissions from China’s construction industry by about 3%. Du [40] concluded that value creation effect and indirect carbon intensity have a significant negative impact on carbon emissions in China’s construction industry, and the output scale is a major influencing factor of carbon-emission growth. Ma [41,42], Xiang [43,44], and Yang [45] measured and decomposed carbon emissions from the commercial and public building sectors, using a bottom-up measurement model based on Kaya-LMDI and Python-LMDI methods, and further indicated that economic activity is the largest driver and energy intensity is the largest inhibitor.
Multiple scenarios have been conducted to simulate carbon emissions from the construction industry, but differences in research methods and parameter settings have resulted in very different predicted times to peak carbon. Zhou [46] believed that carbon emissions from the building sector in China will peak in 2045, but this could be brought forward to as early as 2030 if the necessary technical and economic measures are taken. Chen [47] believed that the peak will be reached in 2030 under a temperature control of 1.5 °C or less. Shi [48] believed that, with an appropriate level of carbon tax, the carbon emission peak of China’s building sector may be reached in 2025. Li [49] proposed three scenarios for the construction industry in China to achieve carbon emission peak, namely 2045 in the baseline scenario, 2030 in the low-carbon energy-saving scenario, and 2020 in the technology breakthrough scenario. Tan [50] projected China’s carbon emissions from the building sector under business as usual, policy, and synergistic emission reduction scenarios and concluded that they would peak in 2030 in the third scenario. Chen [51] projected the carbon emissions of four sectors in China, namely, industry, construction, transportation, and agriculture, using the LMDI (Logarithmic Mean Divisia Index) model, and concluded that the carbon emission peak in the construction industry will appear in 2035. Chen [52] conducted an empirical study on Hubei Province and concluded that most cities will achieve carbon peaking in the building sector by 2030, or early by 2025 if the strategies of substitution with electricity and renewable energy are adopted. Zhang [53] concluded that the carbon-peaking time in China’s construction sector under the three modes of benchmark business as usual, steady development, and high-speed development is 2040, 2030, and 2025, respectively, and suggested that 2025, 2030, and 2035 should be set as mandatory enforcement years for ultralow-energy buildings, nearly zero energy buildings, and zero-energy buildings, respectively. Zhang [54] believed that building is the “last mile” sector in carbon neutrality transition, he has conducted decomposition and comparative research on carbon emissions of commercial buildings in China and the United States, and put forward the best energy efficiency improvement path and decarbonization development strategy of the two countries.
Studying the decoupling relationship between carbon emissions in the building sector and income level, human development index, and economic development has become an emerging hotspot in recent years, attracting an increasing number of scholars to throw themselves into the research. Many representative exploratory research papers are now available; for example, Chen [55] discussed, for the first time, the decoupling between provincial-level per capita carbon emissions and HDI in Southwest China based on decoupling analysis and index decomposition and concluded that the overall decoupling effect in Southwest China generally increased from 2000 to 2015 and entered a strong decoupling state in 2013–2015. Liang [56] analyzed the decoupling between carbon dioxide emission intensity and income level in the residential-building sector of Chinese megacities and concluded that the decoupling effect was increasingly positive from 2001 to 2016 and was mainly attributed to the implementation of energy conservation and emission reduction strategies. Ma [57] analyzed, for the first time, the decoupling between the carbon-emission intensity of the commercial building sector and the economic development of the service sector in five major urban clusters in China, pointing out that the decoupling in China was weak in 2001–2005 and strong in 2006–2015. Chastas [58] emphasized the importance of carbon embodied in the building sector and analyzed the correlation of embodied carbon shares at different levels of building energy efficiency.
In general, a large number of high-quality academic papers have emerged with a focus on carbon-emission calculation and prediction in the construction industry, carbon-emission influencing factors, carbon peak, and carbon-neutral-target-achievement scenarios, energy efficiency, and emission-reduction policy studies, including a few discussing the carbon footprint of the construction industry from the perspective of carbon embodied in buildings and life cycle [59,60] (Table 1). However, there are some problems that cannot be ignored.
First, the existing papers generally focus on the time dimension and neglect the analysis of the spatial dimension, and there is insufficient research on the differences and linkages of carbon emissions from the construction industry and emission-reduction policies among different regions, and no analysis of spatial spillover benefits and radiation effects. Since the scale and changes of carbon emissions from the construction industry vary greatly between different regions, the “one-size-fits-all” policy has failed to achieve satisfactory management results. What are the spatial differentiation and correlation effects of carbon emissions from the construction industry and what are the regular features of spatial and temporal evolution? The answers to them are a key point in the design of zoning and classification policies, but the existing research does not provide sufficient knowledge. To this end, we conducted an empirical study on the carbon emissions of China’s provincial construction industry in an attempt to give the answers.
Second, studies related to carbon-emission forecasting and scenario simulation in the construction industry focus too much on the analysis of the time point of carbon peaking, while whether carbon emissions can be decoupled from economic development is the key point to achieve carbon peaking, and the existing papers have no in-depth discussions on the decoupling state and its coping strategies. Achieving the peaking of carbon emissions and carbon neutrality in the construction industry will not happen overnight, as it requires a series of key projects and major actions designed in phases. The achievement of this goal must be balanced with economic growth, as the synergistic evolution between the two is a key point for sustainable development. Existing studies have generally neglected the state of economic growth and the analysis of critical time nodes in the process during the same period when analyzing the time points of carbon peaking in the construction industry. Since the decoupling of carbon emissions from economic growth is the premise of achieving carbon peaking, this paper analyzes the decoupling of carbon emissions from economic growth in China’s provincial construction industry based on the decoupling model, trying to provide reference for the design of critical time nodes and economic growth strategies in the process to achieve carbon peaking and carbon neutrality.
Third, HDI and per capita income are comprehensive indicators which depend more on industry and service sectors than building sectors, and the analysis of the decoupling between them and carbon emissions can provide some reference for relevant policy design. However, HDI and per capita income are not common indicators used in policy design, and the research results do not match the practical application. Moreover, HDI is a combination of basic variables, such as life expectancy, education level, and quality of life, while per capita income is the result of industrial and economic development and social distribution, neither directly correlated with carbon emissions of the construction industry, which will affect the precision and relevance of the analysis results and restrict the application of research findings in policy design and development management practice. Therefore, this paper uses three indicators to conduct the empirical study research, that is, gross output value of construction industry, added value of construction industry, and total profit of construction industry, respectively representing the total value, net added value, and operating performance directly created in the process of carbon emissions. They are more closely related to the design of carbon-emission management policies in the construction industry than indicators such as HDI and per capita income.
1.3. Aim and Question
China is currently in a stage where the construction industry is one of the leading and pillar forces in economic development, characterized by strong industrial linkages, high energy consumption and pollution, and high carbon emissions, under great pressure to save energy and reduce emissions. Moreover, China is uneven in regional economic development, as evidenced by the large differences in the scale, efficiency, intensity, and changing trends of carbon emissions from the construction industry between provinces, as well as the different influencing factors and emission reduction potentials, pathways, and policies. Therefore, we conducted an empirical study of 30 Chinese provinces in 2010–2019 based on the decoupling model and GIS spatial analysis, and was committed to analyzing the following issues: (1) What are the regular characteristics of carbon emissions from the provincial construction industry in China in the temporal and spatial dimensions respectively? (2) What is the state of decoupling between the carbon emissions from the construction industry from gross industry product, added value, and profits in each province in China? (3) What are the trends in the evolution of the decoupling relationship between changes in carbon emissions and economic growth in China’s construction industry by province, and how should they be addressed in policy design? By studying the above problems, this paper attempts to analyze the spatial and temporal evolution of the decoupling between carbon emissions and economic benefits in China’s construction industry in order to provide a basis for the central and local governments to scientifically formulate and dynamically adjust emission reduction tasks, policies, and plans for the construction industry; to promote the low-carbon and even zero-carbon transformation of the construction industry; and to improve the reliability, efficiency, and self-adaptability of relevant supporting policies and management systems in China.
2. Research Design
2.1. Study Area: China
This study focused on 30 provinces, autonomous regions, and municipalities directly under the central government of China (Figure 1). Due to the lack of data for the Tibet Autonomous Region and different statistical caliber of Hong Kong, Macau, and Taiwan from that of mainland China, they are not included in the study area after comprehensive consideration of data accessibility, completeness, and comparability.
The total carbon emissions of the study area in 2019 were 69.25 Mt, more than total of many countries, such as Romania, Israel, Oman, Greece and Belarus (ranking among the top 50 in the world according to World Bank data). Carbon emissions from the construction industry in the study area grew rapidly in 2000–2009, with an average annual growth of about 8%, and entered a period of constant fluctuation and relative stability in 2010–2019, with an average annual growth of about 2%, and with negative growth in 2012, 2016, and 2018 (Figure 2).
With great importance to energy conservation and emission reduction in the construction industry, the Chinese government issued the China Act on the Energy Efficiency of Civil Buildings in 2008 [61]. The Ministry of Housing and Urban–Rural Development introduced the Standard for Building Carbon Emission Calculation in 2019, standardizing the carbon-emission calculation method for buildings throughout their life cycle at the national level. The China Building Materials Federation released the Accounting Methodology for Carbon Eioxide Emissions in the Construction Materials Industry and the Initiative to Promote Carbon Peaking and Carbon Neutral Action in the Construction Materials Industry in 2021, laying a foundation for the transformation and development of China’s building sector and construction industry from high- to low- and zero-carbonization.
2.2. Research Methods: Decoupling Model
The decoupling model is mainly used in the fields of economics, environment, resources and transportation, mainly for analyzing the decoupling between economic growth and resource use [62,63], energy consumption [64,65], greenhouse gas emissions [66], and land use [67,68]. The Organization for Economic Cooperation and Development (OECD) applied the concept of decoupling for the first time to environmental protection in 2002, defining decoupling as the breakdown of the coupling between economic growth and environmental impact, that is, the absence of simultaneous changes between the two. The OECD proposed a method for calculating the decoupling index and further classified the types of decoupling into absolute decoupling, relative decoupling, and undecoupling [69]. Tapio proposed a decoupling model based on elasticity coefficients in 2005, overcoming the shortcomings of the OECD model in uncertainty of analytical results and weak guidance for practical application [70,71]. The Tapio decoupling model classifies decoupling types into 8 categories based on the size of the decoupling index and the direction (positive or negative) of the growth of economic output and resource consumption, and it has become an important tool for analyzing the sustainable development of industries and regions [72,73]. This study researched the connection between carbon emissions from the construction industry and economic output based on the Tapio decoupling model, and the results were used to determine whether there are synchronous or asynchronous changes between the two. The decoupling index between carbon emissions and economic output was calculated by using the following equation, where represents the decoupling index, represents the average annual growth of carbon emissions from the construction industry in each province of China, and represent the values of carbon emissions in years and , represents the average annual growth rate of economic output indicators (including gross output value, added value, and profit of the construction industry), and represent the annual values of economic output indicators in years and , and represents the study period.
The concept of “decoupling” emphasizes a long-term trending process, and the determination of decoupling relationship should be consistent with the policies during the study period. China’s central and local governments implement a five-year plan system for urban economic development, and there is policy stability over a five-year period. Therefore, we set n = 5 in this paper based on the five-year plan and control the time period in the courses of “12th Five-Year Plan” (2010–2014) and “13th Five-Year Plan” (2015–2019) based on the length of the time series of available data. We classified the decoupling types into 3 major and 8 minor categories based on relevant research experience [74,75,76] and the positive and negative nature of and , using 0.8 and 1.2 as the classification threshold of (Table 2). It should be noted that decoupling is a prerequisite for low-carbon and zero-carbon development, and negative decoupling indicates that the construction industry is still in a high-carbon development stage.
2.3. Research Steps and Data Sources
This study consisted of three steps. The first step was the collection and processing of raw data. We collected and collated data on four indicators from 30 provinces, autonomous regions, and municipalities directly under the central government of China from 2010 to 2019, that is, carbon emission of construction industry, gross output value of construction industry, added value of construction industry, and total profit of construction industry. Some missing data were obtained by consulting the statistical yearbooks or statistical bulletins of provinces and cities, and a few data that are not available in the yearbooks were estimated by mathematical methods of interpolation; for example, the missing data of added value in 2018 were estimated by averaging the values of two adjacent years, 2017 and 2019. The second step was analysis of the results. First, we presented the current characteristics and changing trends of carbon emissions from the construction industry in 30 provinces and cities, using time-series analysis. Second, we studied the spatial pattern and evolution characteristics of carbon emissions from provincial construction industry by means of GIS cluster analysis and spatial autocorrelation analysis. Third, we analyzed the relationship between carbon-emission changes in the construction industry and economic output growth from three perspectives: gross output value, added value, and total profit. The third step was a discussion and application of the results. On the one hand, we compared and analyzed the main ideas of this paper with the key findings of existing papers to clarify their similarities and differences, and we here summarize the original findings and shortcomings of this paper; on the other hand, based on the main problems and ideas found in the analysis of the results in Section 3, we further propose differentiated response strategies, with a view to providing decision-making for the central and local governments to carry out policy design related to spatial governance and industry management (Figure 3).
The whole life-cycle carbon emission of the building sector includes direct carbon emission, indirect carbon emission, and embodied carbon emission, and the direct carbon emission is subdivided into the carbon emission in stages of building materials’ production, building construction, and building operation. The carbon emission of the construction industry in this paper is produced in the construction stage, which is the direct carbon emission of the building sector. The gross output value of the construction industry refers to the total value of construction products produced or construction services provided by construction enterprises in a year, expressed in the form of money. It represents the total output of construction activities in a certain time and space and is a key index to comprehensively reflect the total production scale of construction industry. The added value of construction industry is the total value of the construction enterprise’s production activities with deduction of the value of material goods and services consumed or transferred in production. It is the new value created and added in the production process of construction companies and is a key index to reflect the contribution of the construction industry to GDP. The total profit of construction industry is the final financial result achieved by the construction enterprise through production and operation activities in a certain time and space, including sales profit and non-operating net income. Total profit is a key index to measure the operating performance of a construction company. A value greater than zero indicates a profit, less than zero indicates a loss, and equal to zero indicates a break-even.
The carbon-emission data in this paper come from the China Emission Accounts and Datasets, a database developed by researchers from China, the UK, the US, and other countries. The China Association of Building Energy Efficiency (CABEE) has published 5 consecutive versions of China Building Energy Consumption Research Report since 2016 (chaired by Professor Cai Weiguang from Chongqing University); since 2007, the Building Energy Conservation Research Center of Tsinghua University has published 15 consecutive versions of Annual Development Report of China Building Energy Efficiency (chaired by Academician Jiang Yi from Tsinghua University), which have calculated and analyzed the carbon emissions of buildings throughout the life cycle in China. However, the time series of data in Professor Cai’s report is short, and the report of Academician Jiang contains no provincial data. Since the Chinese government has not released official carbon-emission statistics for a long time, we chose to use the China Emission Accounts and Datasets in this paper after comparing three data sources in order to ensure data authority, internationalization, and comparability, in line with the timescale and space-scale requirements of data. The economic efficiency indicators of construction industry are mainly from the China Statistical Yearbook and China Statistical Yearbook on Construction, and a few missing data are from provincial and city statistical yearbooks and statistical bulletins. We set the base period of the study in 2010 because, on the one hand, China’s carbon emissions from the construction industry were generally in a new period of stability from 2010 to 2019; on the other hand, 2010 is the year to start another five-year plan, and it can ensure the stability of the policies during the two time periods of the study period and general alignment with the five-year plan.
3. Results
3.1. Dynamic Analysis
3.1.1. Change Trend of Time Series
Changes in carbon emissions from China’s construction industry were at a plateau in general, and the development trend varied greatly between different regions from 2010 to 2019, showing a variety of patterns, such as declining, “inverted U-shaped”, growing, “U-shaped”, and smooth fluctuating (Figure 4). The declining pattern involves Beijing, Liaoning, Jiangsu, and Shandong; especially Beijing has entered the bottleneck period of low-carbon development, and the very slow rate of decline in the late stage requires innovative decarbonization measures in the future. The inverted U-shaped pattern involves Tianjin, Hebei, Jilin, Zhejiang, Hubei, and Xinjiang. It is necessary to maintain the stability of the implementation of existing policies in the future to promote the continuous reduction of carbon emissions. The growing pattern involves the largest number of provinces, including Heilongjiang, Anhui, Fujian, Jiangxi, Henan, Hunan, Guangxi, Hainan, Chongqing, Guizhou, Yunnan, and Qinghai. Carbon emissions in Henan and Hunan are not only growing fast, but are also on a huge scale, making them the top two in 2019 and putting great pressure on their future emission reduction. Shanxi, Gansu, Ningxia, and Guangdong are in the smooth fluctuating type of pattern, while Inner Mongolia, Shanghai, Sichuan, and Shaanxi are in the U-shaped pattern. It is necessary to conduct a detailed analysis of the development history of the construction industry in each province and city to find the reasons for the long-term solidification or re-emergence of positive growth in carbon emissions and to formulate and implement targeted emission-reduction policies.
The analysis of carbon-emission change characteristics of China’s provincial construction industry from 2010 to 2019 shows that 1/4 have reached the peak, 1/4 are already at the plateau, and most provinces have not reached the peak. Carbon peaking refers to the process of a province’s total carbon emissions from the construction industry reaching a historical high and then experiencing a plateau into a continuous decline, which is the historical inflection point where carbon emissions change from growth to decline. Due to the uncertainty, chance, and sudden change of annual carbon-emission data, carbon peaking is only recognized when maintaining a continuous reduction in carbon emissions for many years after the peak year. Based on the experience of the United Nations Environment Programme and the World Resources Institute and the principles of statistics, coupled with the study period and the characteristics of carbon-emission changes in each province, this paper sets the sustained decline time after the peak at 3 years. The construction industry in Beijing, Tianjin, Hebei, Liaoning, Jilin, Jiangsu, Zhejiang, and Shandong has now achieved carbon peaking, and the duration of further decline in carbon emissions after the peak year is 3 years and more. Carbon emissions from the construction industry in Shanxi, Inner Mongolia, Shanghai, Guangdong, Hubei, Gansu, Ningxia, and Xinjiang are at a plateau. Their carbon emissions continue to fluctuate after the peak year but remain stable over the long term. There are still great challenges for them to achieve the goal of carbon peaking. Heilongjiang, Anhui, Fujian, Jiangxi, Henan, Hunan, Guangxi, Hainan, Chongqing, Sichuan, Guizhou, Yunnan, Shaanxi, and Qinghai have not yet reached the peak, and the carbon emissions of the construction industry are still in the stage of rapid growth.
The evolution of carbon-emission intensity of the construction industry in China is dominated by a decline, supplemented by growing, U-shaped, inverted U-shaped, and stable patterns (Figure 5). The carbon-emission intensity in most provinces keeps declining, indicating that the low-carbon development of China’s construction industry is getting better. From the perspective of total output, 77% of the provinces have seen a decrease in carbon-emission intensity, with Jilin, Hainan, and Sichuan remaining stable in constant fluctuations. Moreover, “U-shaped” changes have taken place in Inner Mongolia and Qinghai, and the carbon-emission intensity in Heilongjiang and Henan is getting higher with the construction industry gradually moving toward high-carbon development. From the perspective of added value, 60% of the provinces have seen a decrease in carbon-emission intensity, while Jiangxi remains stable. Inner Mongolia, Shanghai, Anhui, Guangxi, Sichuan, Qinghai, and Ningxia show a “U-shaped” change in the carbon-emission intensity, while Jilin, Henan, and Hunan show an “inverted U-shaped” change. The carbon-emission intensity of Heilongjiang is still increasing, and the added value of carbon emissions of the construction industry needs to be improved. From the perspective of total profit, more than 60% of the provinces have seen a decrease in carbon intensity, while Anhui and Sichuan remain fluctuating. Tianjin, Zhejiang, Qinghai, and Ningxia show a “U-shaped” change; Jilin and Hainan show an “inverted U-shaped” change; and Inner Mongolia, Henan, and Heilongjiang are still in continuous growth, with poor achievement in carbon-emission management and operation performance of the construction industry.
3.1.2. Spatial-Evolution Characteristics
The total amount and intensity of carbon emissions from the construction industry in different provinces of China have been varying widely, and the spatial heterogeneity of total output value and total profit is becoming more significant. According to Guan [77], Zhao [78,79], and Miyamoto [80], a coefficient of variation greater than 0.36 indicates a high degree of dispersion and unevenness among variables. The total carbon emissions and intensity remained above 0.65 from 2010 to 2019, and the coefficient of variation of total output and total profit kept going up and was already higher than 1.2 (Figure 6). We carried out a spatial cluster analysis by using the natural break method of ARCGIS to classify the carbon emissions and carbon intensity of China’s construction industry into three types: high, medium, and low levels. From the perspective of global Moran’s I, there was a significant negative spatial autocorrelation of carbon emissions from the provincial construction industry in China in 2010, and the spatial correlation and agglomeration characteristics of carbon emissions and carbon-emission intensity in the remaining years are not significant and cannot pass the significance test (Table 3). The local spatial-autocorrelation analysis carried out by Geoda software classifies space into four types, namely high–high (HH), high–low (HL), low–high (LH), and low–low (LL) regions, facilitating detection of the spatial association and agglomeration patterns of different geographical local regions and identification of the similarity (positive correlation) or difference (negative correlation) between different provinces and their neighboring provinces.
The spatial cluster analysis of carbon emissions implies that, in 2010, Zhejiang, Hubei and Inner Mongolia were high-level regions, the provinces of medium level were distributed along the junction line between central and western regions in a band, and the rest were low-level provinces and cities that were concentrated in the northeast, northwest, and southwest of China. In 2015, Zhejiang, Hunan and Hubei were high-level regions, and the provinces of low level were mainly concentrated in the northwest, while the medium-level regions expanded greatly, mainly concentrated in North China and extending to the southwest. In 2019, the high-level regions expanded significantly, mainly clustered and distributed along the Yangtze River Economic Belt; the low-level regions were clustered in the northwest and Beijing–Tianjin–Hebei area, and the provinces of the medium level were distributed along the junction line of the central and western regions in a band (Figure 7). From the spatial-correlation analysis of carbon emissions, in 2010, there was no HH region, only Xinjiang and Guangdong were LL and HL regions, and there were a large number of LH regions, including Jiangxi, Jiangsu, Henan, Hebei, Heilongjiang, and Ningxia, characterized by significant negative spatial autocorrelation. In 2015, the HH regions were mainly concentrated in Central China, including Anhui, Henan, Hubei, and Chongqing, and there were a small number of LL, HL, and LH regions. In 2019, LL and HL regions remained unchanged; LH regions changed to Chongqing, Jiangxi, and Shanghai; and Hubei, Anhui, and Shandong were HH regions (Figure 8).
The spatial cluster analysis of carbon-emission intensity from the perspective of gross output value shows that Inner Mongolia has been a high-level region for a long time, and there are a decreasing number of medium-level regions and an increasing number of low- level regions. In 2010, Qinghai, Gansu, Ningxia, Shanxi, Tianjin, Jilin, Hubei, Guizhou, and Yunnan were medium-level regions, concentrated in northwest and southwest; in 2015, Gansu and Hubei changed to low-level regions, and in 2019, only Qinghai, Ningxia, Tianjin, and Jilin were medium-level regions, with a significant shrink of geographical space. The spatial cluster analysis of carbon-emission intensity from the perspective of added value shows that high-level regions were Hubei, Tianjin, and Inner Mongolia in 2010, and they changed to Tianjin, Hubei, and Hunan in 2015. In 2019, the coverage of high-level regions expanded rapidly, mainly concentrated in North China. Medium-level regions were concentrated in the northwest and southwest in 2010, while they were in North China in 2015; their geographical coverage shrank rapidly in 2019, with only two small clusters forming in the southwest and central parts of China. Provinces of the low level were clustered in coastal areas in 2010 in a band, in the Pan-Pearl River Delta and Shandong Peninsula regions in 2015, and in the Pan-Pearl River Delta and Bohai Bay regions in 2019. The spatial clustering analysis of carbon-emission intensity from the perspective of total profit implies that there were a small number of high-level regions from 2010 to 2019, including Inner Mongolia, Qinghai, Guizhou, and Hainan. The medium-level regions in 2010 and 2015 were clustered in Northwest China, and, in 2019, their geographical coverage shrank significantly with a very scattered distribution, including Xinjiang, Ningxia, Shanxi, Tianjin, Hunan, and Jilin. In 2010, provinces of the low level were concentrated in the eastern coastal areas and Western Chengdu–Chongqing urban agglomeration areas; in 2015, they were distributed in the eastern coastal areas, Central Henan and Hubei, and Western Chengdu–Chongqing urban agglomeration areas; and in 2019, they covered most areas of China (Figure 9).
The spatial correlation analysis of carbon-emission intensity from the perspective of gross output value suggests that Gansu and Ningxia have long been HH regions; LL regions are mainly clustered in the eastern coastal areas; LH regions are mainly distributed in northeast and northwest; and HL regions are few in number and are only occasionally found in Hubei, Hunan, Tianjin, and Hainan. The spatial-correlation analysis of carbon-emission intensity from the perspective of added value reveals that Ningxia and Shaanxi were HH regions, Guangdong and Shandong were LL regions, Zhejiang was an HL region, and Heilongjiang and Hebei were LH regions in 2010. In 2015, only Beijing was an LH region, and there were no HH, LL, or HL regions. There were no HH regions in 2019; Shandong and Anhui were LL regions; Hunan was an HL region; and Heilongjiang, Hebei, and Beijing were LH regions. The spatial correlation analysis of carbon-emission intensity from the perspective of total profit indicates that HH regions were mainly distributed in Northwest China from 2010 to 2019, including Gansu, Ningxia, Shanxi, and Xinjiang. LL regions were mainly distributed in the eastern coastal area, but the geographical coverage shrank gradually over time. LH regions gathered in the Chengdu–Chongqing urban agglomeration in 2010, were distributed in the northeast in 2015, and further expanded to the northwest in 2019. Hunan, Hubei, and Tianjin were HL regions in 2010 and 2019, with a small number and scattered spatial distribution (Figure 10).
3.2. Decoupling Analysis
3.2.1. Gross Output Value
Strong decoupling, weak decoupling, expansive coupling, and expansive negative decoupling emerged in 2010–2014, and they accounted for 30%, 50%, 13.33%, and 6.67%, respectively. All eight types appeared in 2015–2019, with 63.33% of provinces in strong and weak decoupling, 13.33% in expansive negative decoupling, and only one or two provinces in the rest decoupling types. Beijing, Hebei, Shandong, Shaanxi, and Gansu have long been in strong decoupling and in the best state; however, Inner Mongolia, Heilongjiang, and Zhejiang have degenerated to the strong and weak negative decoupling state and are at the worst stage of development, evolving into a key problem area limiting the decarbonization of China’s construction industry.
The provinces in strong decoupling were mainly concentrated in Northwest and North China in 2010–2014, and the provinces in weak decoupling were concentrated and continuous in the eastern coastal and southwest areas. The spatial distribution pattern of provinces in strong and weak decoupling in 2015–2019 remained stable, but the geographical coverage shrank moderately. The provinces in strong negative decoupling were concentrated in North China, including Heilongjiang and Inner Mongolia (Figure 11). The global Moran’s I index for 2015–2019 was 0.2 and did not pass the significance test in 2010–2014, indicating that the spatial distribution is positively autocorrelated, agglomerative, and correlated (Table 4). In 2010–2014, HH, LL, and HL regions were only Gansu, Hubei, and Shandong, respectively, while Xinjiang, Qinghai, Ningxia, and Tianjin were LH regions. In 2015–2019, HH and LL provinces were clustered in Central and Northeast China, respectively, and Shanghai was an HL region, while Sichuan and Tianjin were LH regions (Figure 12).
From the perspective of decoupling type changes from 2012 to 2015 and 2016 to 2019, about 1/4 of the provinces were evoluted, including Shanxi, Anhui, Henan, Hubei, and Hunan, mainly concentrated in Central China. There were 36.67% of provinces degenerated, including Tianjin, Inner Mongolia, Liaoning, Jilin, Zhejiang, Guangxi, and Sichuan, concentrated in the northeast, northwest, and Yangtze River Delta regions. There were 36.67% of provinces remaining unchanged, including Beijing, Hebei, Fujian, Shandong, Heilongjiang, Guangdong, Guizhou, Yunnan, Shaanxi, and Ningxia, mainly clustered in the Loess Plateau, the Yunnan–Guizhou Plateau, and the Pearl River Delta regions (Figure 13).
3.2.2. Added Value
In terms of decoupling types, strong decoupling, weak decoupling, expansive coupling, and expansive negative decoupling appeared in 2010–2014, accounting for 30%, 50%, 3.33%, and 16.67%, respectively. All eight types appeared in 2015–2019, with 56.67% of provinces in strong and weak decoupling, 16.67% in expansive negative decoupling, 10% in strong negative decoupling, and only one or two provinces in the rest decoupling types. Beijing, Hebei, Shandong, and Shaanxi have long been in strong decoupling and in the best state; however, Heilongjiang, Shanghai, and Ningxia have degenerated to the strong and weak negative decoupling state, and they are in the worst stage as key problem areas restricting the decarbonization of China’s construction industry.
The provinces in strong decoupling in 2010–2014 were also concentrated in Northwest and North China, the provinces in weak decoupling were concentrated in the east coast and southwest regions, and the provinces in expansive coupling and expansive negative decoupling were concentrated in the central and northwest regions. There was a significant decrease in the number of provinces in strong and weak decoupling from 2015 to 2019, with the former clustered in North and Central China and the latter in South and Southwest China. Heilongjiang, Ningxia, and Gansu are in strong and weak negative decoupling, while the provinces in expansive coupling and expansive negative decoupling are gathering toward the north and west (Figure 11). The global Moran’s I index for 2015–2019 was 0.14 and failed the significance test for 2010–2014, indicating that the spatial distribution is positively autocorrelated, agglomerative, and correlated (Table 3). HH regions were clustered in the northwest in 2010–2014, and in the center in 2015–2019, covering an expanding space. In 2010–2014, only Jiangxi was the LL region, while LL regions changed to Inner Mongolia and Jilin in 2015–2019. In 2010–2014, Hubei, Guangdong, and Fujian were HL regions, and there were no LH regions; in 2015–2019, only Xinjiang and Tianjin were HL and LH regions, respectively (Figure 12).
In terms of decoupling type change in 2012–2015 and 2016–2019, about 30% of provinces were evoluted, including Shanxi, Zhejiang, Anhui, Jiangxi, Henan, Hubei, Chongqing, and Xinjiang, mainly clustered in the central region. About 40% of provinces were degenerated, including Tianjin, Inner Mongolia, Liaoning, Jilin, Heilongjiang, Shanghai, Jiangsu, Guangxi, and Sichuan, concentrated in the northeast and northwest regions. About 30% of the provinces were unchanged, including Beijing, Hebei, Fujian, Shandong, Guangdong, Guizhou, Yunnan, and Shaanxi, mainly concentrated in the Yunnan–Guizhou Plateau, Bohai Bay and Pearl River Delta regions (Figure 13).
3.2.3. Total Profit
Five types of coupling, namely strong decoupling, weak decoupling, expansive coupling, expansive negative decoupling, and strong negative decoupling, appeared in 2010–2014, with the first two accounting for a larger proportion of 26.67% and 60%, respectively, while the rest involved only one province, respectively. There were seven types in 2015–2019, with the emergence of weaker negative decoupling. Different types occupied a balanced share, with 46.67% of the provinces in strong and weak decoupling, while only 3–5 provinces in each of the other decoupling types. Beijing, Shaanxi, and Gansu have long been in strong decoupling and in the best state; however, Inner Mongolia, Heilongjiang, Qinghai, and Ningxia have degenerated to the strong and weak negative decoupling state and are in the worst stage, and they have become the key problem areas restricting the decarbonization of China’s construction industry.
The provinces in strong decoupling in 2010–2014 were mainly concentrated in the Northwest Loess Plateau and Bohai Bay regions, while the provinces in weak decoupling were distributed together in the eastern coastal and southwest areas. Provinces in strong decoupling in 2015–2019 were concentrated in the Northwest Loess Plateau region, with those in weak decoupling state concentrated in the Pan-Pearl River Delta region and those in strong negative decoupling concentrated in Northern China, while Xinjiang, Hebei, Jilin, and Liaoning provinces were in recessive decoupling (Figure 11). The global Moran’s I was 0.15 for 2010–2014 and failed the significance test for 2015–2019, indicating that the spatial distribution was positively autocorrelated, agglomerative, and correlated, but is now insignificant (Table 3). There was only one province in one of the four types in 2010–2014, that is, Tianjin, Heilongjiang, Jilin, and Henan, respectively. LL provinces in 2015–2019 were clustered in the northeast region, while there were only two provinces of HH, HL, and LH types each, with scattered distribution in geography (Figure 12).
In terms of decoupling type change in 2012–2015 and 2016–2019, only 13.33% of provinces were evoluted, including Shanxi, Henan, Hubei, and Hunan, mainly clustered in Central China. Decoupling types were degenerated in half of the provinces, including Tianjin, Hebei, Inner Mongolia, Liaoning, Jilin, Shanghai, Jiangsu, Zhejiang, Guangxi, Sichuan, Chongqing, Qinghai, Ningxia, and Xinjiang, mainly in the northeast and Yangtze River Delta regions. About 36.67% of the provinces remained unchanged, including Beijing, Heilongjiang, Anhui, Fujian, Guangdong, Shandong, Guizhou, Yunnan, Shaanxi, and Gansu, mainly in Bohai Bay, Pearl River Delta, Yunnan–Guizhou, and Loess Plateau regions (Figure 13).
4. Discussion
4.1. Theoretical Enlightenment
Some of the findings of this study are in agreement with the conclusions of existing papers, and they corroborate each other. It was found in our research that provincial carbon emissions are of high spatial heterogeneity, correlation, and agglomeration, and most provinces are in weak decoupling. Shi [81] and Chuai [82] concluded that carbon emissions from the construction industry in China vary greatly between regions, with East and South–Central China facing greater pressure to reduce emissions. According to Jiang [83], the relationship between carbon emissions and economic development in China’s building sector has changed from weak decoupling to expansive negative decoupling. Li [84] found that the carbon-emission intensity of China’s construction industry has spatial agglomeration characteristics, and divided it into four agglomeration areas of high and high, low and high, low and low, and high and low levels. Du [85] pointed out that the economic development of most provinces in China is positively correlated with the carbon emissions of construction industry, the spatial differences in decoupling of provincial construction industry are significant, and the provinces in the same decoupling state show spatial clustering in their geographical distribution. Chi [86] pointed out that the carbon emissions of China’s construction industry show a development trend of increasing first and then decreasing, and most provinces have been in weak decoupling.
However, some of the ideas in this paper are not in full agreement with the conclusions of previous studies, and even some are the exact opposite. Wu [87] concluded that carbon emissions of construction industry were in expansive decoupling with economic growth in most provinces of China in 2005–2015, with Shanghai in the best state, while Guizhou and Fujian were in expansive negative decoupling. Li [88] believed that carbon emissions and output value of construction industry in Jiangsu are in an expansive negative decoupling state. In contrast, this study found that Beijing, Shandong, and Shaanxi are in the best strong decoupling state for a long time, while Heilongjiang, Inner Mongolia, and Ningxia are generally degraded to the worst strong negative decoupling state. Shanghai was in the best strong decoupling state in 2010–2014, but it deteriorated to varying degrees in 2015–2019, and was in a strong and weak negative decoupling state. Fujian and Guizhou have been stable in weak decoupling for a long time, while Jiangsu was in weak decoupling in 2010–2014, but all of them degenerated to expansive negative decoupling in 2015–2019. Du [89,90] argued that provincial carbon-emission intensity shows club convergence and positive spatial autocorrelation; Lu [91] found a significant positive spatial autocorrelation of carbon emissions from the construction industry in China. Different from them, this paper finds that the spatial concentration and correlation of carbon emissions and carbon-emission intensity of provincial construction industry in China are not significant, and the geographical distribution of decoupling types is very unstable, although it has some positive autocorrelation. These differences mainly originate from different decoupling models and data sources. The differences in detail processing methods (different n-values), study period and base period, and carbon-emission data caliber and source of the calculation process of decoupling model led to the uncertainty of determining the decoupling type in the same province. In addition, the decarbonization of China’s provincial construction industry is becoming complicated, as evidenced by more diversified decoupling types and their changes, with a declining number of provinces in strong and weak decoupling. These new findings are among the original conclusions of this paper and constitute a useful addition to the theory of decarbonization in the construction industry.
From a theoretical perspective, the decoupling model can effectively describe the dynamic relationship between the change of carbon emissions in the construction industry and economic growth, timely determine whether the decarbonization of the construction industry is in a reasonable state, and provide a new method for researchers, government policymakers and the public to study the transformation of construction industry to low-carbon development. From a practical perspective, the methods and conclusions of this paper are applicable to China, and also provide valuable references for decision making in the design of policies for decarbonization of construction industry in India, Russia, Iran, Indonesia, Mexico, South Africa, Brazil, Turkey, Thailand, Malaysia, Kazakhstan, Egypt, and Vietnam. These countries have been among the world’s top countries in terms of carbon emissions in recent years (TOP30), and they will be in the stage of rapid industrialization and urbanization for a long time in the future. As construction is their leading industry with huge carbon emissions, they are facing great pressure of decarbonization and emission reduction, similar to China [92].
It should be noted that the relationship between carbon emissions from the construction industry and economic growth is complex and variable, and it is subject to many factors, such as stage of development, income level, production methods, and level of intelligence. The decoupling model helps to make a concise and intuitive determination of the carbon-emission intensity of the construction industry, but it still has the shortcoming that it conveys a mixed message, and it is difficult to analyze the dominant factors affecting the decoupling relationship and their mechanisms of action in depth. Due to the constraints of insufficient data and information, the length of the study, and other conditions, this paper does not explore in depth the influencing factors of the evolution of decoupling and its mechanism of action; this is the shortcoming of this paper, and we will make up for it in the follow-up studies.
4.2. Policy Design Value
The results show that there are great differences in carbon-emission change trend, carbon-peaking state, and decoupling type in construction industry in different provinces of China. The uneven scale of provincial construction carbon emissions and the variability of peak status and decoupling types lead to different pressures, potentials, and driving forces of carbon emissions faced by different provinces. Therefore, these provinces should embark on a differentiated decarbonization and emission-reduction path in the future according to the carbon-peak and carbon-neutral development goals, taking into account their own reality and the problems they face [93,94]. We chose the modal number of three perspectives of gross output value, added value, and total profit as the final result of decoupling type of carbon-emission change and economic growth of construction industry in each province based on the calculation results of decoupling types in 2015–2019. We took the peak state as the first dimension and classified it into three types: no-carbon peak, platform period, and carbon peak. Then we took the scale of carbon emissions as the second dimension and classified it into three levels: high, medium, and low. We took the decoupling state as the third dimension and represented eight decoupling types by colored blocks and boxes. Based on the comprehensive and correlation analysis of these three dimensions, a 3 × 3 matrix was made with the marking of the location of each province, and the design of differentiated policies for construction carbon emissions at the provincial scale could be carried out accordingly. This paper constructed a zoning matrix of decarbonization policies for China’s provincial construction industry based on the analysis results of carbon emissions, peak attainment state, and decoupling types, and further carried out differentiated policy design accordingly (Figure 14).
Beijing, Hebei, Shandong, Gansu, Liaoning, Jilin, Jiangsu, Tianjin, Zhejiang, and Ningxia have been at the forefront of decarbonization in the construction industry nationwide, and they have become leaders in industry development and spatial governance. Beijing, Hebei, and Shandong have achieved carbon peaking in a strong decoupling state with low carbon emissions. As the national development benchmark, they should in the future maintain the stable implementation of current carbon management policies, accelerate the process of electrification and intelligence of construction, promote the application of renewable energy and green energy, and try to achieve the carbon neutrality target early [95]. Moreover, they should fully summarize the historical development experience and take the lead in formulating national- and industry-level low- and zero-carbon development standards for the construction industry to play a leading and demonstration role. Jilin and Liaoning are still in recessive decoupling, although their carbon emissions are not high and they have achieved carbon peaking. The main reason for this phenomenon is that Northeast China is in the stage of shrinking development, and the key to the future emission-reduction policy design lies in how to take advantage of the opportunity given by the state to revitalize Northeast China and promote the decoupling of carbon emissions from construction industry and economic development in order to realize the sustainable development of construction industry and economy early [96,97]. Gansu and Ningxia, with low carbon emissions, are already in the plateau stage, and they should seize the time to develop timetables and roadmaps to achieve carbon peaking and make it a priority to decouple carbon emissions from economic growth.
The decarbonization of construction industry in Shanxi, Xinjiang, Shanghai, Guangdong, Hainan, Jiangxi, Guangxi, Qinghai, Heilongjiang, Jiangsu, Tianjin, and Zhejiang is at the middle level in China. In the future, they should strengthen the special and targeted policy design of low and zero carbonization of the construction industry. Shanxi, Xinjiang, Shanghai, and Guangdong have been in strong and weak decoupling, with their carbon-emission changes in the plateau stage. In the future, they should lower the intensity and improve the efficiency of carbon emissions, as well as continuously reduce total carbon emissions, to achieve carbon peaking at an early date [98,99]. Zhejiang, Tianjin, and Jiangsu have entered the stage of carbon peaking, but they are still in negative decoupling and recessive coupling with huge carbon emissions. The key point of their future policy design is to encourage and support the innovation, application, and popularization of whole-process and whole-life-cycle carbon-reduction technologies to reduce total carbon emissions at an early date, while promoting the decoupling of carbon-emission changes from economic growth to shift the construction industry development from high-carbon to low-carbon. Although Qinghai, Guangxi, Jiangxi, Hainan, and Inner Mongolia have low carbon emissions, they are still in continuous growth and have not yet achieved decoupling. Promoting industrialization and urbanization is the focus of the future modernization in these provinces, and the future development of the construction industry requires integrated planning, comprehensive measures, and tailored policies to solve key points and to prevent restricting the improvement of urban and rural residents’ living standards due to “carbon reduction”. It is necessary to accelerate the setting of carbon peaking targets for the construction industry; carry out actions on carbon peaking and carbon neutrality; promote green buildings, carbon-neutral buildings, and low- and zero-carbon buildings; and evaluate and publish carbon-peaking progress annually [100,101].
Shaanxi, Chongqing, Guizhou, Yunnan, Hubei, Anhui, Fujian, Hunan, Sichuan, Henan, and Inner Mongolia are very lagging behind in the decarbonization of construction industry, and they should strengthen systematic and innovative policy design to achieve the goal of carbon neutrality and carbon peaking. Shaanxi, Chongqing, Guizhou, Yunnan, Anhui, Fujian, Hunan, and Hubei are still in a high carbon development stage and have not yet achieved carbon peaking, although they are in a strong and weak decoupling state. In the future, they should pay attention to both energy saving and emission reduction in new buildings and low-carbon transformation of old buildings in stock; increase the scale promotion and application of low-carbon and zero-carbon buildings; improve financial incentive policies, such as carbon subsidies, carbon taxes, carbon funds, and carbon bonds; and set up carbon financial systems, such as preferential loans, carbon futures and options, carbon securities, and carbon insurance [102,103]. Sichuan, Henan, and Inner Mongolia are still in the state of rapid growth and in expansive coupling and negative decoupling with huge carbon emissions, so they are facing an arduous task of energy conservation and emission reduction. Most of these areas are less developed, and they should develop and implement local policies and action plans for carbon peaking and carbon neutrality; raise awareness of comprehensive carbon-emission reduction; establish responsibility targets for decarbonization and emission reduction; establish carbon trading platforms and constraint mechanisms; award the title of environmentally friendly enterprises; and enhance the synergy of emission reduction actions of government, enterprises, and residents to promote “decarbonization” as a catalyst for future modernization and high-quality development [104]. It is recommended that the course of both the “14th Five-Year Plan” and “15th Five-Year Plan” be set as the critical period for the construction industry to achieve carbon peaking; to accelerate the industrialization, digitalization, and intelligent upgrading of the construction industry; to change the construction patterns; to increase the proportion of low-carbon and zero-carbon buildings and smart buildings; and to install carbon-capture devices to achieve greener and lower carbon in the construction industry [105,106].
5. Conclusions
Global warming and climate change have become a common concern in recent years, and as a leading industry with high energy consumption and high pollution, construction is under great pressure to reduce carbon emissions [107,108]. The construction industry in China and its carbon emissions are on a huge scale, and its low-carbon and zero-carbon transition is critical for China to achieve its carbon-peaking and carbon-neutrality goals, making the country typical and representative of the world [109]. This paper empirically investigated the relationship between changes in carbon emissions from the construction industry in China and its economic growth from 2010 to 2019, using a decoupling model and GIS tools, and reached the following conclusions:
- (1)
- The trends of carbon emissions and carbon intensity in the provincial construction industry are becoming increasingly complex, with a variety of patterns, such as declining, growing, “inverted U-shaped”, “U-shaped”, and smooth fluctuating. Moreover, 1/4 of the provinces are already in the carbon-peaking state, 1/4 are in the plateau stage, and about 50% are still in the state of continuous and rapid growth of carbon emissions, meaning that the achievement of carbon-peaking and carbon-neutrality goals is still faced with great challenges.
- (2)
- Provincial carbon emissions and carbon-emission intensity are highly spatially heterogeneous without significant spatial correlation and agglomeration characteristics. The regions with high carbon emissions are clustered in the Yangtze River Economic Belt; the regions with low carbon emissions are clustered in the northwest, and HH regions are concentrated in the central region; and the HL, LH, and LL regions are small in number and scattered geographically. The regions with high carbon-emission intensity are located in Northern China, and those with low carbon-emission intensity are in the eastern coastal and central areas, with geographical coverage rapidly expanding over time. HH regions are mainly clustered in the northwest, LL regions are mostly clustered in the east coast, and HL and LH regions are small in number and scattered geographically.
- (3)
- The types of decoupling and their changes are increasingly diversified, with most provinces in a strong and weak decoupling state, but their proportions are decreasing over time. Most of the provinces in strong decoupling are clustered in the north, and those in weak decoupling are mainly clustered in the east coast and southwest regions, but the coverage of clusters has shrunk significantly. The provinces in the strong and weak negative decoupling state are mainly clustered in the northeast and northwest regions, and the clustering area is increasingly expanding. HH regions were concentrated in the Northwest Loess Plateau in the early days, but now they are clustered in the central region, with an expanding coverage. There were a small number of LL regions in the early days, and they are now mainly clustered in the northeast region.
- (4)
- The decoupling types of carbon emissions from construction industry and economic growth show evoluted, degenerated, and unchanged changes, and most of them are in the degenerated state. Evoluted regions are clustered in the central part of China; degenerated regions are in the northeast and northwest; and unchanged regions are in Bohai Bay, Pearl River Delta, Loess Plateau, and Yunnan–Guizhou Plateau. Moreover, there are a growing number of provinces in negative decoupling, and in the context of economic transformation and the outbreak of COVID-19, special vigilance should be taken to prevent re-decoupling of the provinces in the decoupling state.
- (5)
- By integrating the characteristics of carbon-emission changes, peak attainment state, and decoupling types, this paper classified the 30 provinces into three policy zones of Leader, Intermediate, and Laggard and proposed differentiated decarbonization recommendations to provide a basis for the government to formulate emission-reduction policies.
With the continuous optimization and wide application of decoupling theory, decoupling has become an important tool to analyze the sustainable development of local and industry. Moreover, it is meaningless to blindly pursue decoupling, as decoupling analysis is phased and policy-oriented. Therefore, it is necessary to take targeted and adaptive policy measures depending on the development stage and policy needs in accordance with the time and local conditions, to build a scientific and efficient decarbonization management and policy system for the construction industry, and to effectively enhance the capacity and level of high-quality low-carbon development of the construction industry.
Author Contributions
Conceptualization, W.L. and P.Z.; methodology, W.L. and K.Z.; software, S.Z. and K.Z.; validation, W.L., J.H. and P.Z.; formal analysis, P.Z. and W.L.; investigation, W.L., J.H. and S.Z.; resources, P.Z., J.H. and H.C.; data curation, K.Z., J.H. and P.Z.; writing—original draft preparation, P.Z, J.H. and W.L.; writing—review and editing, S.Z. and H.C.; visualization, S.Z. and K.Z.; supervision, W.L. and H.C.; project administration, P.Z. and H.C.; funding acquisition, W.L. and H.C. All authors have read and agreed to the published version of the manuscript.
Funding
This study and the related research were financially supported by the National Natural Science Foundation of China (Project Number: 51768029) and National Natural Science Foundation of China (Project Number: 51768030).
Institutional Review Board Statement
Not applicable.
Informed Consent Statement
Not applicable.
Data Availability Statement
Most of the data can be obtained by visiting the following links: https://www.ceads.net.cn/ (20 August 2021), http://www.mohurd.gov.cn/xytj/tjzljsxytjgb/jstjnj/ (13 September 2021), and https://data.cnki.net/yearbook/Single/N2020110007 (17 September 2021).
Conflicts of Interest
The authors declare no conflict of interest.
References
- Huang, M.T.; Zhai, P.M. Achieving Paris Agreement temperature goals requires carbon neutrality by middle century with far-reaching transitions in the whole society. Adv. Clim. Change Res. 2021, 12, 281–286. [Google Scholar] [CrossRef]
- Salvia, M.; Reckien, D.; Pietrapertosa, F.; Eckersley, P.; Spyridaki, N.A.; Krook-Riekkola, A.; Olazabal, M.; Hurtado, S.D.G.; Simoes, S.G.; Geneletti, D. Will climate mitigation ambitions lead to carbon neutrality? An analysis of the local-level plans of 327 cities in the EU. Renew. Sustain. Energy Rev. 2021, 135, 110253. [Google Scholar] [CrossRef]
- Ma, X.J.; Wang, C.X.; Dong, B.Y.; Gu, G.C.; Chen, R.M.; Li, Y.F.; Zou, H.F.; Zhang, W.F.; Li, Q.N. Carbon emissions from energy consumption in China: Its measurement and driving factors. Sci. Total Environ. 2019, 648, 1411–1420. [Google Scholar] [CrossRef] [PubMed]
- Mallapaty, S. How China could be carbon neutral by mid-century. Nature 2020, 586, 482–483. [Google Scholar] [CrossRef]
- Normile, D. China’s bold climate pledge earns praise—But is it feasible? Science 2020, 370, 17. [Google Scholar] [CrossRef]
- Giesekam, J.; Tingley, D.D.; Cotton, I. Aligning carbon targets for construction with (inter)national climate change mitigation commitments. Energy Build. 2018, 165, 106–117. [Google Scholar] [CrossRef]
- Ali, K.A.; Ahmad, M.I.; Yusup, Y. Issues, Impacts, and Mitigations of Carbon Dioxide Emissions in the Building Sector. Sustainability 2020, 12, 7427. [Google Scholar] [CrossRef]
- International Energy Agency. World Energy Statistics and Balance (Database). 2020. Available online: https://www.iea.org/reports/key-world-energy-statistics-2020/energy-balances (accessed on 26 December 2021).
- International Energy Agency. Energy Technology Outlook, Building Model. 2020. Available online: https://www.iea.org/reports/key-world-energy-statistics-2020/outlook (accessed on 26 December 2021).
- Huang, L.Z.; Krigsvoll, G.; Johansen, F.; Liu, Y.P.; Zhang, X.L. Carbon emission of global construction sector. Renew. Sustain. Energy Rev. 2018, 81, 1906–1916. [Google Scholar] [CrossRef] [Green Version]
- Zhang, S.C.; Wang, K.; Xu, W.; Iyer-Raniga, U.; Athienitis, A.; Ge, H.; Cho, D.W.; Feng, W.; Okumiya, M.; Yoon, G. Policy recommendations for the zero-energy building promotion towards carbon neutral in Asia-Pacific Region. Energy Policy 2021, 159, 112661. [Google Scholar] [CrossRef]
- Building Energy Efficiency Research Center of Tsinghua University. China Building Energy Efficiency Annual Development Research Report 2020; China Construction Industry Press: Beijing, China, 2020. [Google Scholar]
- Zhang, X.C.; Wang, F.L. Hybrid input-output analysis for life-cycle energy consumption and carbon emissions of China’s building sector. Build. Environ. 2016, 104, 188–197. [Google Scholar] [CrossRef]
- Li, K.; Ma, M.D.; Xiang, X.W.; Feng, W.; Ma, Z.L.; Cai, W.G.; Ma, X. Carbon reduction in commercial building operations: A provincial retrospection in China. Appl. Energy 2021, 306, 118098. [Google Scholar] [CrossRef]
- Sun, Z.; Ma, Z.; Ma, M.; Cai, W.; Xiang, X.; Zhang, S.; Chen, M.; Chen, L. Carbon Peak and Carbon Neutrality in the Building Sector: A Bibliometric Review. Buildings 2022, 12, 128. [Google Scholar] [CrossRef]
- Chen, M.X.; Ma, M.D.; Lin, Y.C.; Ma, Z.L.; Li, K. Carbon Kuznets curve in China’s building operations: Retrospective and prospective trajectories. Sci. Total Environ. 2021, 803, 150104. [Google Scholar] [CrossRef] [PubMed]
- Ma, M.; Ma, X.; Cai, W.; Cai, W. Low carbon roadmap of residential building sector in China: Historical mitigation and prospective peak. Appl. Energy 2020, 273, 115247. [Google Scholar] [CrossRef]
- Onat, N.C.; Kucukvar, M. Carbon footprint of construction industry: A global review and supply chain analysis. Renew. Sustain. Energy Rev. 2020, 124, 109783. [Google Scholar] [CrossRef]
- Shi, Q.W.; Ren, H.; Cai, W.G.; Gao, J.X. How to Set the Proper CO2 Reduction Targets for the Provincial Building Sector of China? Sustainability 2020, 12, 10432. [Google Scholar] [CrossRef]
- Lu, Y.J.; Cui, P.; Li, D.Z. Carbon emissions and policies in China’s building and construction industry: Evidence from 1994 to 2012. Build. Environ. 2016, 95, 94–103. [Google Scholar] [CrossRef]
- Jackson, D.J.; Kaesehage, K. Addressing the challenges of integrating carbon calculation tools in the construction industry. Bus. Strategy Environ. 2020, 29, 2973–2983. [Google Scholar] [CrossRef]
- Liu, G.W.; Chen, R.D.; Xu, P.P.; Fu, Y.; Mao, C.; Hong, J.K. Real-time carbon emission monitoring in prefabricated construction. Autom. Constr. 2020, 110, 102945. [Google Scholar] [CrossRef]
- Chen, J.D.; Shi, Q.; Shen, L.Y.; Huang, Y.; Wu, Y. What makes the difference in construction carbon emissions between China and USA? Sustain. Cities Soc. 2019, 44, 604–613. [Google Scholar] [CrossRef]
- Li, S.Y.; Wu, Q.S.; Zheng, Y.; Sun, Q. Study on the Spatial Association and Influencing Factors of Carbon Emissions from the Chinese Construction Industry. Sustainability 2021, 13, 1728. [Google Scholar] [CrossRef]
- Abeydeera, L.H.U.W.; Mesthrige, J.W.; Samarasinghalage, T.I. Perception of Embodied Carbon Mitigation Strategies: The Case of Sri Lankan Construction Industry. Sustainability 2019, 11, 3030. [Google Scholar] [CrossRef] [Green Version]
- Sicignano, E.; Di Ruocco, G.; Melella, R. Mitigation Strategies for Reduction of Embodied Energy and Carbon, in the Construction Systems of Contemporary Quality Architecture. Sustainability 2019, 11, 3806. [Google Scholar] [CrossRef] [Green Version]
- Kang, G.; Kim, T.; Kim, Y.W.; Cho, H.; Kang, K.I. Statistical analysis of embodied carbon emission for building construction. Energy Build. 2015, 105, 326–333. [Google Scholar] [CrossRef]
- Robati, M.; Oldfield, P.; Nezhad, A.A.; Carmichael, D.G.; Kuru, A. Carbon value engineering: A framework for integrating embodied carbon and cost reduction strategies in building design. Build. Environ. 2021, 192, 107620. [Google Scholar] [CrossRef]
- Oh, B.K.; Glisic, B.; Lee, S.H.; Cho, T.; Park, H.S. Comprehensive investigation of embodied carbon emissions, costs, design parameters, and serviceability in optimum green construction of two-way slabs in buildings. J. Clean. Prod. 2019, 222, 111–128. [Google Scholar] [CrossRef]
- Monahan, J.; Powell, J.C. An embodied carbon and energy analysis of modern methods of construction in housing A case study using a lifecycle assessment framework. Energy Build. 2011, 43, 179–188. [Google Scholar] [CrossRef]
- Brooks, M.; Abdellatif, M.; Alkhaddar, R. Application of life cycle carbon assessment for a sustainable building design: A case study in the UK. Int. J. Green Energy 2021, 18, 351–362. [Google Scholar] [CrossRef]
- Ng, S.T.; Wong, J.M.W.; Skitmore, S.; Veronika, A. Carbon dioxide reduction in the building life cycle: A critical review. Proc. Inst. Civ. Eng.-Eng. Sustain. 2012, 165, 281–292. [Google Scholar] [CrossRef] [Green Version]
- Bai, J.; Qu, J.S. Investigating the spatiotemporal variability and driving factors of China’s building embodied carbon emissions. Environ. Sci. Pollut. Res. 2021, 28, 19186–19201. [Google Scholar] [CrossRef]
- Yildirim, A.E.; Yildirim, M.O. Revisiting the determinants of carbon emissions for Turkey: The role of construction sector. Environ. Sci. Pollut. Res. 2021, 28, 42325–42338. [Google Scholar] [CrossRef] [PubMed]
- Shi, Q.; Chen, J.D.; Shen, L.Y. Driving factors of the changes in the carbon emissions in the Chinese construction industry. J. Clean. Prod. 2017, 166, 615–627. [Google Scholar] [CrossRef]
- Li, D.Z.; Huang, G.Y.; Zhang, G.M.; Wang, J.B. Driving factors of total carbon emissions from the construction industry in Jiangsu Province, China. J. Clean. Prod. 2020, 276, 123179. [Google Scholar] [CrossRef]
- He, J.H.; Yue, Q.; Li, Y.; Zhao, F.; Wang, H.M. Driving force analysis of carbon emissions in China’s building industry: 2000–2015. Sustain. Cities Soc. 2020, 60, 102268. [Google Scholar] [CrossRef]
- Erdogan, S. Dynamic Nexus between Technological Innovation and Building Sector Carbon Emissions in the BRICS Countries. J. Environ. Manag. 2021, 293, 112780. [Google Scholar] [CrossRef]
- Liu, H.X.; Lin, B.Q. Energy substitution, efficiency, and the effects of carbon taxation: Evidence from China’s building construction industry. J. Clean. Prod. 2017, 141, 1134–1144. [Google Scholar] [CrossRef]
- Du, Q.; Lu, X.R.; Li, Y.; Wu, M.; Bai, L.B.; Yu, M. Carbon Emissions in China’s Construction Industry: Calculations, Factors and Regions. Int. J. Environ. Res. Public Health 2018, 15, 1220. [Google Scholar] [CrossRef] [Green Version]
- Ma, M.; Cai, W.; Cai, W. Carbon abatement in China’s commercial building sector: A bottom-up measurement model based on Kaya-LMDI methods. Energy 2018, 165, 350–368. [Google Scholar] [CrossRef]
- Ma, M.D.; Shen, L.Y.; Ren, H.; Cai, W.G.; Ma, Z.L. How to Measure Carbon Emission Reduction in China’s Public Building Sector: Retrospective Decomposition Analysis Based on STIRPAT Model in 2000–2015. Sustainability 2017, 9, 1744. [Google Scholar] [CrossRef] [Green Version]
- Xiang, X.; Ma, X.; Ma, Z.; Ma, M.; Cai, W. Python-LMDI: A Tool for Index Decomposition Analysis of Building Carbon Emissions. Buildings 2022, 12, 83. [Google Scholar] [CrossRef]
- Xiang, X.; Ma, X.; Ma, Z.; Ma, M. Operational Carbon Change in Commercial Buildings under the Carbon Neutral Goal: A LASSO–WOA Approach. Buildings 2022, 12, 54. [Google Scholar] [CrossRef]
- Yang, J.; Cai, W.; Ma, M.D.; Li, L.; Liu, C.H.; Ma, X.; Li, L.L.; Chen, X.Z. Driving forces of China’s CO2 emissions from energy consumption based on Kaya-LMDI methods. Sci. Total Environ. 2020, 711, 134569. [Google Scholar] [CrossRef] [PubMed]
- Zhou, N.; Khanna, N.; Feng, W.; Ke, J.; Levine, M. Scenarios of energy efficiency and CO 2 emissions reduction potential in the buildings sector in China to year 2050. Nat. Energy 2018, 3, 978–984. [Google Scholar] [CrossRef]
- Chen, H.; Wang, L.N.; Chen, W.Y. Modeling on building sector’s carbon mitigation in China to achieve the 1.5 degrees C climate target. Energy Effic. 2019, 12, 483–496. [Google Scholar] [CrossRef]
- Shi, Q.W.; Ren, H.; Cai, W.G.; Gao, J.X. How to set the proper level of carbon tax in the context of Chinese construction sector? A CGE analysis. J. Clean. Prod. 2019, 240, 117955. [Google Scholar] [CrossRef]
- Li, B.; Han, S.W.; Wang, Y.F.; Li, J.Y.; Wang, Y. Feasibility assessment of the carbon emissions peak in China’s construction industry: Factor decomposition and peak forecast. Sci. Total Environ. 2020, 706, 135716. [Google Scholar] [CrossRef]
- Tan, X.C.; Lai, H.P.; Gu, B.H.; Zeng, Y.; Li, H. Carbon emission and abatement potential outlook in China’s building sector through 2050. Energy Policy 2018, 118, 429–439. [Google Scholar] [CrossRef]
- Chen, X.; Shuai, C.Y.; Wu, Y.; Zhang, Y. Analysis on the carbon emission peaks of China’s industrial, building, transport, and agricultural sectors. Sci. Total Environ. 2020, 709, 135768. [Google Scholar] [CrossRef]
- Chen, H.; Chen, W.Y. Carbon mitigation of China’s building sector on city-level: Pathway and policy implications by a low-carbon province case study. J. Clean. Prod. 2019, 224, 207–217. [Google Scholar] [CrossRef]
- Zhang, S.C.; Yang, X.Y.; Xu, W.; Fu, Y.J. Contribution of nearly-zero energy buildings standards enforcement to achieve carbon neutral in urban area by 2060. Adv. Clim. Change Res. 2021, 12, 734–743. [Google Scholar] [CrossRef]
- Zhang, S.F.; Ma, M.D.; Kai, L.; Ma, Z.L.; Feng, W.; Cai, W.G. Historical carbon abatement in the commercial building operation: China versus the US. Energy Econ. 2021, 105, 105712. [Google Scholar] [CrossRef]
- Chen, L.; Cai, W.G.; Ma, M.D. Decoupling or delusion? Mapping carbon emission per capita based on the human development index in Southwest China. Sci. Total Environ. 2020, 741, 138722. [Google Scholar] [CrossRef] [PubMed]
- Liang, Y.; Cai, W.G.; Ma, M.D. Carbon dioxide intensity and income level in the Chinese megacities’ residential building sector: Decomposition and decoupling analyses. Sci. Total Environ. 2019, 677, 315–327. [Google Scholar] [CrossRef] [PubMed]
- Ma, M.D.; Cai, W.; Cai, W.G.; Dong, L. Whether carbon intensity in the commercial building sector decouples from economic development in the service industry? Empirical evidence from the top five urban agglomerations in China. J. Clean. Prod. 2019, 222, 193–205. [Google Scholar] [CrossRef]
- Chastas, P.; Theodosiou, T.; Kontoleon, K.J.; Bikas, D. Normalising and assessing carbon emissions in the building sector: A review on the embodied CO2 emissions of residential buildings. Build. Environ. 2018, 130, 212–226. [Google Scholar] [CrossRef]
- Mata, E.; Korpal, A.K.; Cheng, S.H.; Navarro, J.P.J.; Filippidou, F.; Reyna, J.; Wang, R. A map of roadmaps for zero and low energy and carbon buildings worldwide. Environ. Res. Lett. 2020, 15, 113003. [Google Scholar] [CrossRef]
- Raza, M.S.; Khahro, S.H.; Memon, S.A.; Ali, T.H.; Memon, N.A. Global trends in research on carbon footprint of buildings during 1971–2021: A bibliometric investigation. Environ. Sci. Pollut. Res. 2021, 28, 63227–63236. [Google Scholar] [CrossRef]
- Ma, M.; Cai, W.; Wu, Y. China Act on the Energy Efficiency of Civil Buildings (2008): A decade review. Sci. Total Environ. 2019, 651, 42–60. [Google Scholar] [CrossRef]
- Wiedenhofer, D.; Virag, D.; Kalt, G.; Plank, B.; Streeck, J.; Pichler, M.; Mayer, A.; Krausmann, F.; Brockway, P.; Schaffartzik, A. A Systematic Review of the Evidence on Decoupling of GDP, Resource Use and GHG Emissions, Part I: Bibliometric and Conceptual Mapping. Environ. Res. Lett. 2020, 15, 063002. [Google Scholar] [CrossRef]
- Haberl, H.; Wiedenhofer, D.; Virag, D.; Kalt, G.; Plank, B.; Brockway, P.; Fishman, T.; Hausknost, D.; Krausmann, F.; Leon-Gruchalski, B. A Systematic Review of the Evidence on Decoupling of GDP, Resource Use and GHG Emissions, Part II: Synthesizing the Insights. Environ. Res. Lett. 2020, 15, 065003. [Google Scholar] [CrossRef]
- Frodyma, K.; Papiez, M.; Smiech, S. Decoupling Economic Growth from Fossil Fuel Use-Evidence from 141 Countries in the 25-Year Perspective. Energies 2020, 13, 6671. [Google Scholar] [CrossRef]
- Yasmeen, H.; Tan, Q.M. Assessing Pakistan’s energy use, environmental degradation, and economic progress based on Tapio decoupling model. Environ. Sci. Pollut. Res. 2021, 28, 68364–68378. [Google Scholar] [CrossRef] [PubMed]
- Mikayilov, J.I.; Hasanov, F.J.; Galeotti, M. Decoupling of CO2 emissions and GDP: A time-varying cointegration approach. Ecol. Indic. 2018, 95, 615–628. [Google Scholar] [CrossRef]
- Li, Y.N.; Cai, M.M.; Wu, K.Y.; Wei, J.C. Decoupling analysis of carbon emission from construction land in Shanghai. J. Clean. Prod. 2019, 210, 25–34. [Google Scholar] [CrossRef]
- Guo, S.S.; Wang, Y.H.; Huang, J.; Dong, J.H.; Zhang, J. Decoupling and Decomposition Analysis of Land Natural Capital Utilization and Economic Growth: A Case Study in Ningxia Hui Autonomous Region, China. Int. J. Environ. Res. Public Health 2021, 18, 646. [Google Scholar] [CrossRef] [PubMed]
- Organization for Economic Cooperation and Development. Indicators to Measure Decoupling of Environmental Pressure and Economic Growth; OECD: Paris, Franch, 2002. [Google Scholar]
- Casadio Tarabusi, E.; Guarini, G. An axiomatic approach to decoupling indicators for green growth. Ecol. Indic. 2018, 84, 515–524. [Google Scholar] [CrossRef]
- Pesce, A. The Decoupling of Emerging Economies: Theoretical and Empirical Puzzle. J. Econ. Surv. 2017, 31, 602–631. [Google Scholar] [CrossRef]
- Tapio, P. Towards a theory of decoupling: Degrees of decoupling in the EU and the case of road traffic in Finland between 1970 and 2001. Transp. Policy 2005, 12, 137–151. [Google Scholar] [CrossRef] [Green Version]
- Longhofer, W.; Jorgenson, A. Decoupling reconsidered: Does world society integration influence the relationship between the environment and economic development? Soc. Sci. Res. 2017, 65, 17–29. [Google Scholar] [CrossRef]
- Song, Y.; Sun, J.J.; Zhang, M.; Su, B. Using the Tapio-Z decoupling model to evaluate the decoupling status of China’s CO2 emissions at provincial level and its dynamic trend. Struct. Change Econ. Dyn. 2020, 52, 120–129. [Google Scholar] [CrossRef]
- Lu, Z.W.; Wang, H.M.; Yue, Q. Decoupling Analysis of the Environmental Mountainwith Case Studies from China. J. Ind. Ecol. 2015, 19, 1082–1090. [Google Scholar] [CrossRef]
- Wang, H.; Xia, S.; Zhang, Q.; Zhang, P. Has China’s Construction Waste Change Been Decoupled from Economic Growth? Buildings 2022, 12, 147. [Google Scholar] [CrossRef]
- Guan, X.Y.; Wang, S.L.; Gao, Z.Y.; Lv, Y.; Fu, X.J. Spatio-temporal variability of soil salinity and its relationship with the depth to groundwater in salinization irrigation district. Acta Ecol. Sin. 2012, 32, 198–206. [Google Scholar]
- Zhao, S.; Yan, Y.; Han, J. Industrial Land Change in Chinese Silk Road Cities and Its Influence on Environments. Land 2021, 10, 806. [Google Scholar] [CrossRef]
- Zhao, S.; Li, W.; Zhao, K.; Zhang, P. Change Characteristics and Multilevel Influencing Factors of Real Estate Inventory—Case Studies from 35 Key Cities in China. Land 2021, 10, 928. [Google Scholar] [CrossRef]
- Miyamoto, S.; Chacon, A.; Hossain, M.; Martinez, L. Soil salinity of urban turf areas irrigated with saline water I. Spatial variability. Landsc. Urban Plan. 2005, 71, 233–241. [Google Scholar]
- Shi, Q.W.; Gao, J.X.; Wang, X.; Ren, H.; Cai, W.G.; Wei, H.F. Temporal and Spatial Variability of Carbon Emission Intensity of Urban Residential Buildings: Testing the Effect of Economics and Geographic Location in China. Sustainability 2020, 12, 2695. [Google Scholar] [CrossRef] [Green Version]
- Chuai, X.W.; Huang, X.J.; Lu, Q.L.; Zhang, M.; Zhao, R.Q.; Lu, J.Y. Spatiotemporal Changes of Built-Up Land Expansion and Carbon Emissions Caused by the Chinese Construction Industry. Environ. Sci. Technol. 2015, 49, 13021–13030. [Google Scholar] [CrossRef]
- Jiang, R.; Li, R.R. Decomposition and Decoupling Analysis of Life-Cycle Carbon Emission in China’s Building Sector. Sustainability 2017, 9, 793. [Google Scholar] [CrossRef] [Green Version]
- Li, W.; Sun, W.; Li, G.M.; Cui, P.F.; Wu, W.; Jin, B.H. Temporal and spatial heterogeneity of carbon intensity in China’s construction industry. Resour. Conserv. Recycl. 2017, 126, 162–173. [Google Scholar] [CrossRef]
- Du, Q.; Zhou, J.; Pan, T.; Sun, Q.; Wu, M. Relationship of carbon emissions and economic growth in China’s construction industry. J. Clean. Prod. 2019, 2020, 99–109. [Google Scholar] [CrossRef]
- Chi, Y.Y.; Liu, Z.R.; Wang, X.; Zhang, Y.Y.; Wei, F. Provincial CO2 Emission Measurement and Analysis of the Construction Industry under China’s Carbon Neutrality Target. Sustainability 2021, 13, 1876. [Google Scholar] [CrossRef]
- Wu, Y.; Chau, K.W.; Lu, W.S.; Shen, L.Y.; Shuai, C.Y.; Chen, J.D. Decoupling relationship between economic output and carbon emission in the Chinese construction industry. Environ. Impact Assess. Rev. 2018, 71, 60–69. [Google Scholar] [CrossRef]
- Li, R.R.; Jiang, R. Moving Low-Carbon Construction Industry in Jiangsu Province: Evidence from Decomposition and Decoupling Models. Sustainability 2017, 9, 1013. [Google Scholar] [CrossRef] [Green Version]
- Du, Q.; Wu, M.; Xu, Y.D.; Lu, X.R.; Bai, L.B.; Yu, M. Club convergence and spatial distribution dynamics of carbon intensity in China’s construction industry. Nat. Hazards 2018, 94, 519–536. [Google Scholar] [CrossRef]
- Du, Q.; Wu, M.; Wang, N.; Bai, L.B. Spatiotemporal Characteristics and Influencing Factors of China’s Construction Industry Carbon Intensity. Pol. J. Environ. Stud. 2017, 26, 2507–2521. [Google Scholar] [CrossRef] [Green Version]
- Lu, N.; Feng, S.Y.; Liu, Z.M.; Wang, W.D.; Lu, H.L.; Wang, M. The Determinants of Carbon Emissions in the Chinese Construction Industry: A Spatial Analysis. Sustainability 2020, 12, 1428. [Google Scholar] [CrossRef] [Green Version]
- Schreyer, F.; Luderer, G.; Rodrigues, R.; Pietzcker, R.C.; Baumstark, L.; Sugiyama, M.; Brecha, R.J.; Ueckerdt, F. Common but differentiated leadership: Strategies and challenges for carbon neutrality by 2050 across industrialized economies. Environ. Res. Lett. 2020, 15, 114016. [Google Scholar] [CrossRef]
- Wu, P.; Song, Y.Z.; Zhu, J.B.; Chang, R.D. Analyzing the influence factors of the carbon emissions from China’s building and construction industry from 2000 to 2015. J. Clean. Prod. 2019, 221, 552–566. [Google Scholar] [CrossRef]
- You, K.R.; Yu, Y.H.; Li, Y.L.; Cai, W.G.; Shi, Q.W. Spatiotemporal decomposition analysis of carbon emissions on Chinese residential central heating. Energy Build. 2021, 253, 111485. [Google Scholar] [CrossRef]
- Wang, H.; Chen, W.; Shi, J. Low carbon transition of global building sector under 2- and 1.5-degree targets. Appl. Energy 2018, 222, 148–157. [Google Scholar] [CrossRef]
- Wang, Y.; Zhao, J.Y.; Li, Z.X.; Liu, X.R.; Zhou, J. Study on decoupling effect and driving factors of carbon emission and economic growth in northeast China. Environ. Sci. Technol. 2019, 42, 190–197. [Google Scholar]
- Zang, H.K.; Zhang, L.R.; Xu, Y.; Li, W. Dynamic Input-Output Analysis of a Carbon Emission System at the Aggregated and Disaggregated Levels: A Case Study in the Northeast Industrial District. Sustainability 2020, 12, 2708. [Google Scholar] [CrossRef] [Green Version]
- Zhou, W.Z.; Yu, W.H. Regional Variation in the Carbon Dioxide Emission Efficiency of Construction Industry in China: Based on the Three-Stage DEA Model. Discret. Dyn. Nat. Soc. 2021, 2021, 4021947. [Google Scholar] [CrossRef]
- Zhang, M.N.; Li, L.S.; Cheng, Z.H. Research on carbon emission efficiency in the Chinese construction industry based on three-stage DEA-Tobit model. Environ. Sci. Pollut. Res. 2021, 28, 51120–51136. [Google Scholar] [CrossRef]
- Pan, W.; Ning, Y. A socio-technical framework of zero-carbon building policies. Build. Res. Inf. 2015, 43, 94–110. [Google Scholar] [CrossRef]
- Zuo, J.; Read, B.; Pullen, S.; Shi, Q. Achieving carbon neutrality in commercial building developments—Perceptions of the construction industry. Habitat Int. 2012, 36, 278–286. [Google Scholar] [CrossRef]
- Blazquez, J.; Martin-Moreno, J.M.; Perez, R.; Ruiz, J. Aiming for Carbon Neutrality: Which Environmental Taxes Does Spain Need by 2030? Econ. Energy Environ. Policy 2021, 10, 215–227. [Google Scholar] [CrossRef]
- Du, Q.; Yan, Y.Q.; Huang, Y.D.; Hao, C.C.; Wu, J. Evolutionary Games of Low-Carbon Behaviors of Construction Stakeholders under Carbon Taxes. Int. J. Environ. Res. Public Health 2021, 18, 508. [Google Scholar] [CrossRef]
- Willson, R.W.; Brown, K.D. Carbon Neutrality at the Local Level: Achievable Goal or Fantasy? J. Am. Plan. Assoc. 2008, 74, 497–504. [Google Scholar] [CrossRef]
- Zhao, S.; Zhang, P.; Li, W. A Study on Evaluation of Influencing Factors for Sustainable Development of Smart Construction Enterprises: Case Study from China. Buildings 2021, 11, 221. [Google Scholar] [CrossRef]
- Pokhrel, S.R.; Hewage, K.; Chhipi-Shrestha, G.; Karunathilake, H.; Sadiq, R. Carbon capturing for emissions reduction at building level: A market assessment from a building management perspective. J. Clean. Prod. 2021, 294, 126323. [Google Scholar] [CrossRef]
- Zhang, L.; Liu, B.; Du, J.; Liu, C.L.; Li, H.X.; Wang, S. Internationalization trends of carbon emission linkages: A case study on the construction sector. J. Clean. Prod. 2020, 270, 122433. [Google Scholar] [CrossRef]
- Fenner, A.E.; Kibert, C.J.; Woo, J.; Morque, S.; Razkenari, M.; Hakim, H.; Lu, X.S. The carbon footprint of buildings: A review of methodologies and applications. Renew. Sustain. Energy Rev. 2018, 94, 1142–1152. [Google Scholar] [CrossRef]
- Zhang, S.; Xiang, X.; Ma, Z.; Ma, M.; Zou, C. Carbon Neutral Roadmap of Commercial Building Operations by Mid-Century: Lessons from China. Buildings 2021, 11, 510. [Google Scholar] [CrossRef]
Figure 1.
Study area.

Figure 2.
Change analysis of carbon emission from construction industry in study area.

Figure 3.
Research steps.

Figure 4.
Analysis on the change of carbon emission.

Figure 5.
Analysis on the change of carbon emission per unit economic output.

Figure 6.
Analysis on the change trend of carbon emission.

Figure 7.
Analysis on spatial clustering of carbon emission.

Figure 8.
Analysis on spatial association of carbon emission.

Figure 9.
Analysis on spatial clustering of carbon-emission intensity.

Figure 10.
Analysis on spatial correlation of carbon-emission intensity.

Figure 11.
Analysis on spatial pattern of decoupling type.

Figure 12.
Analysis on spatial autocorrelation of decoupling type.

Figure 13.
Analysis on change of decoupling type.

Figure 14.
Policy zoning of decarbonization development.


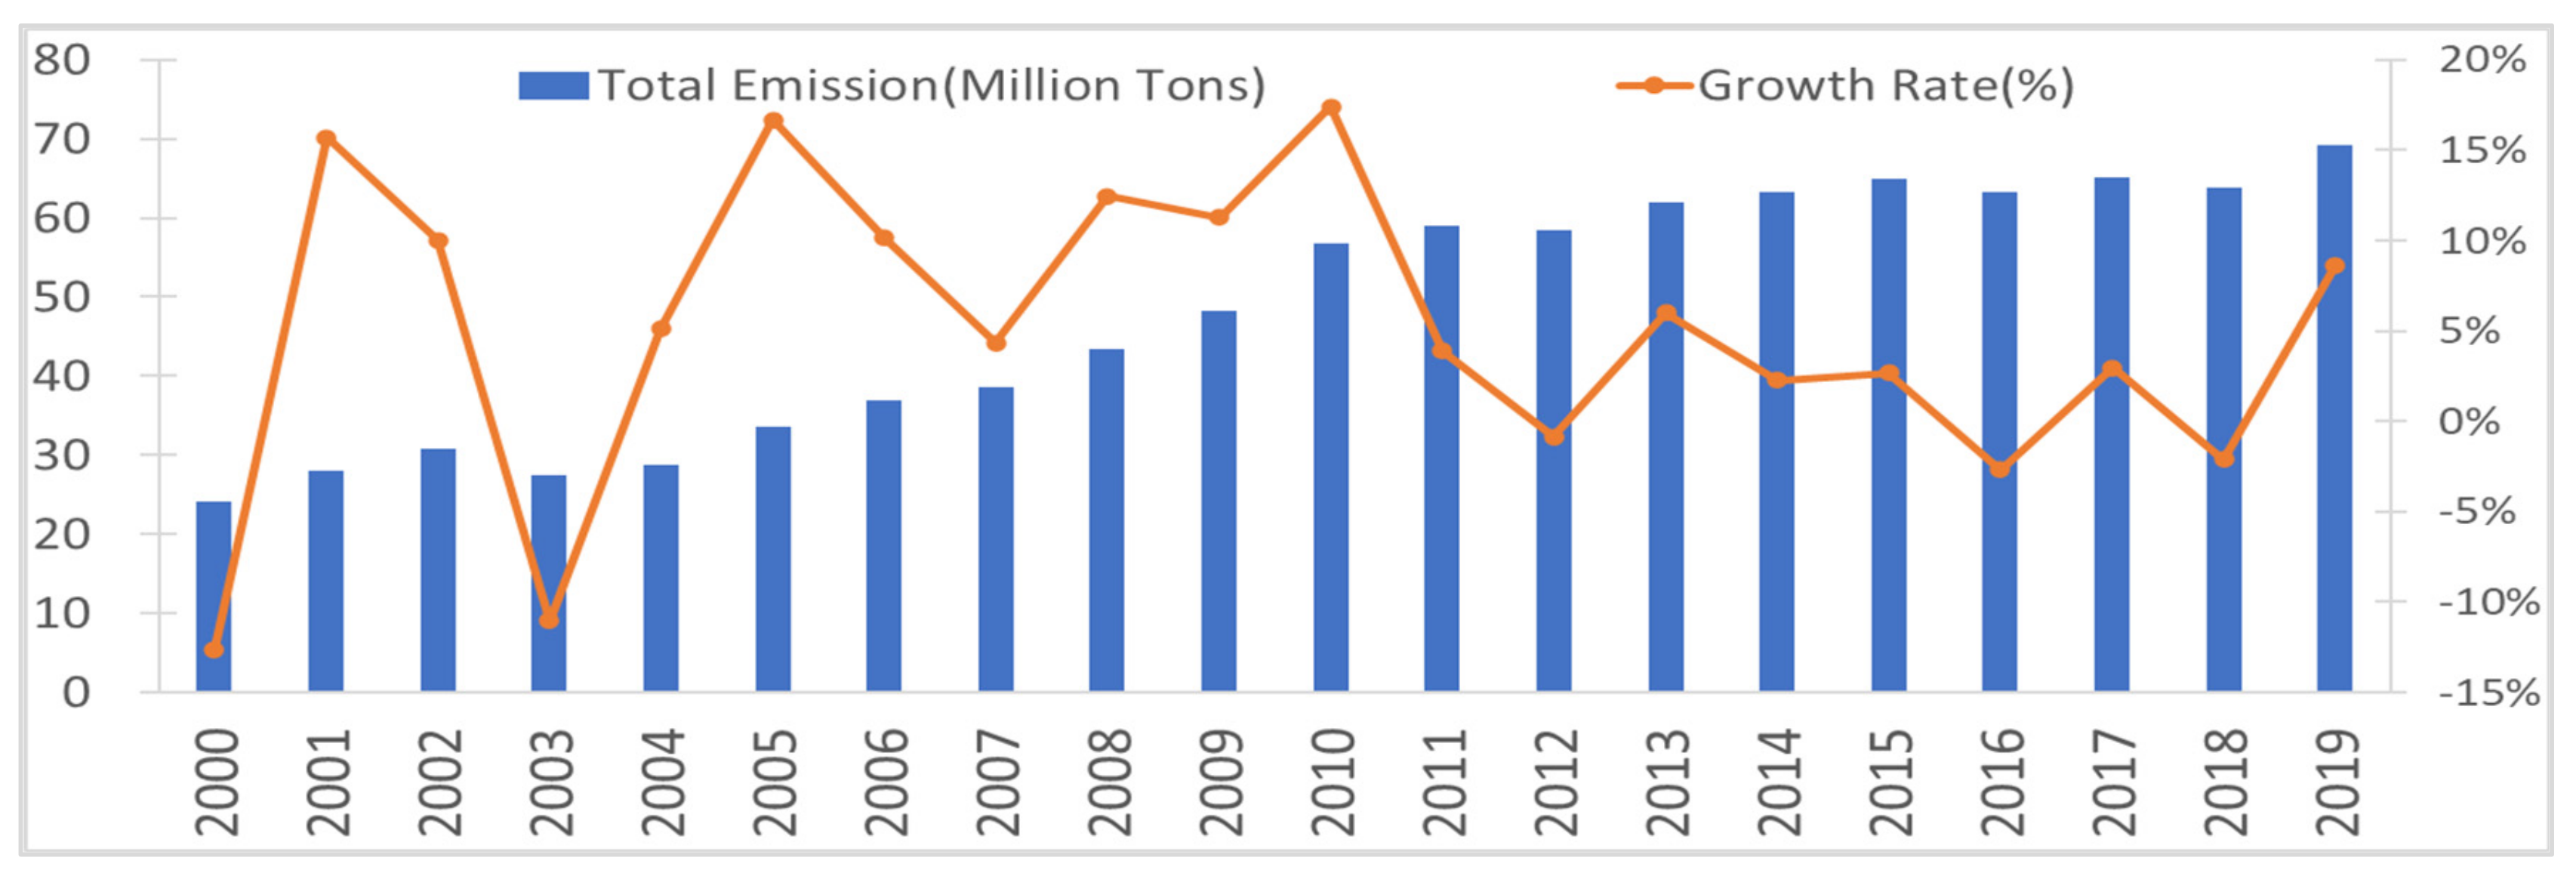
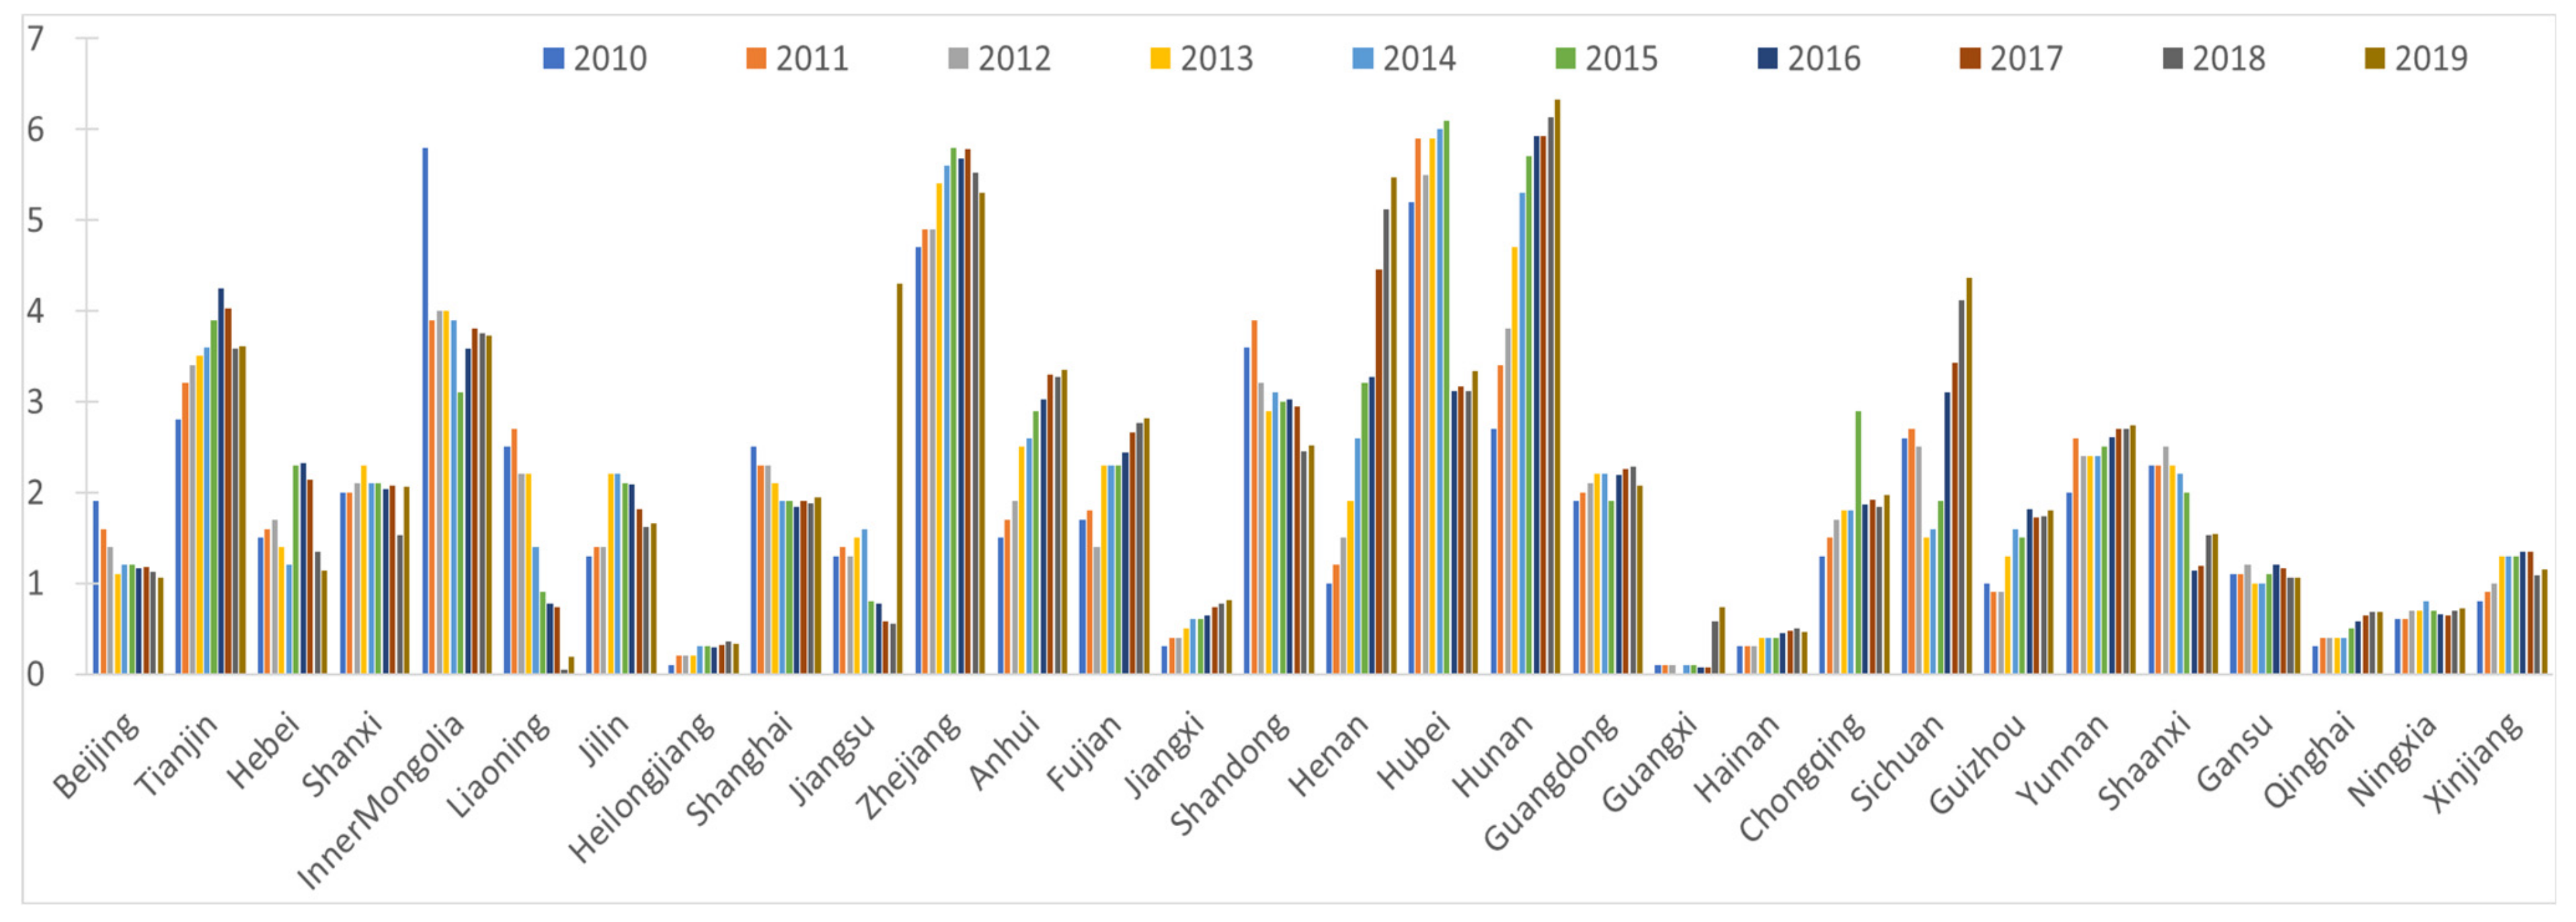
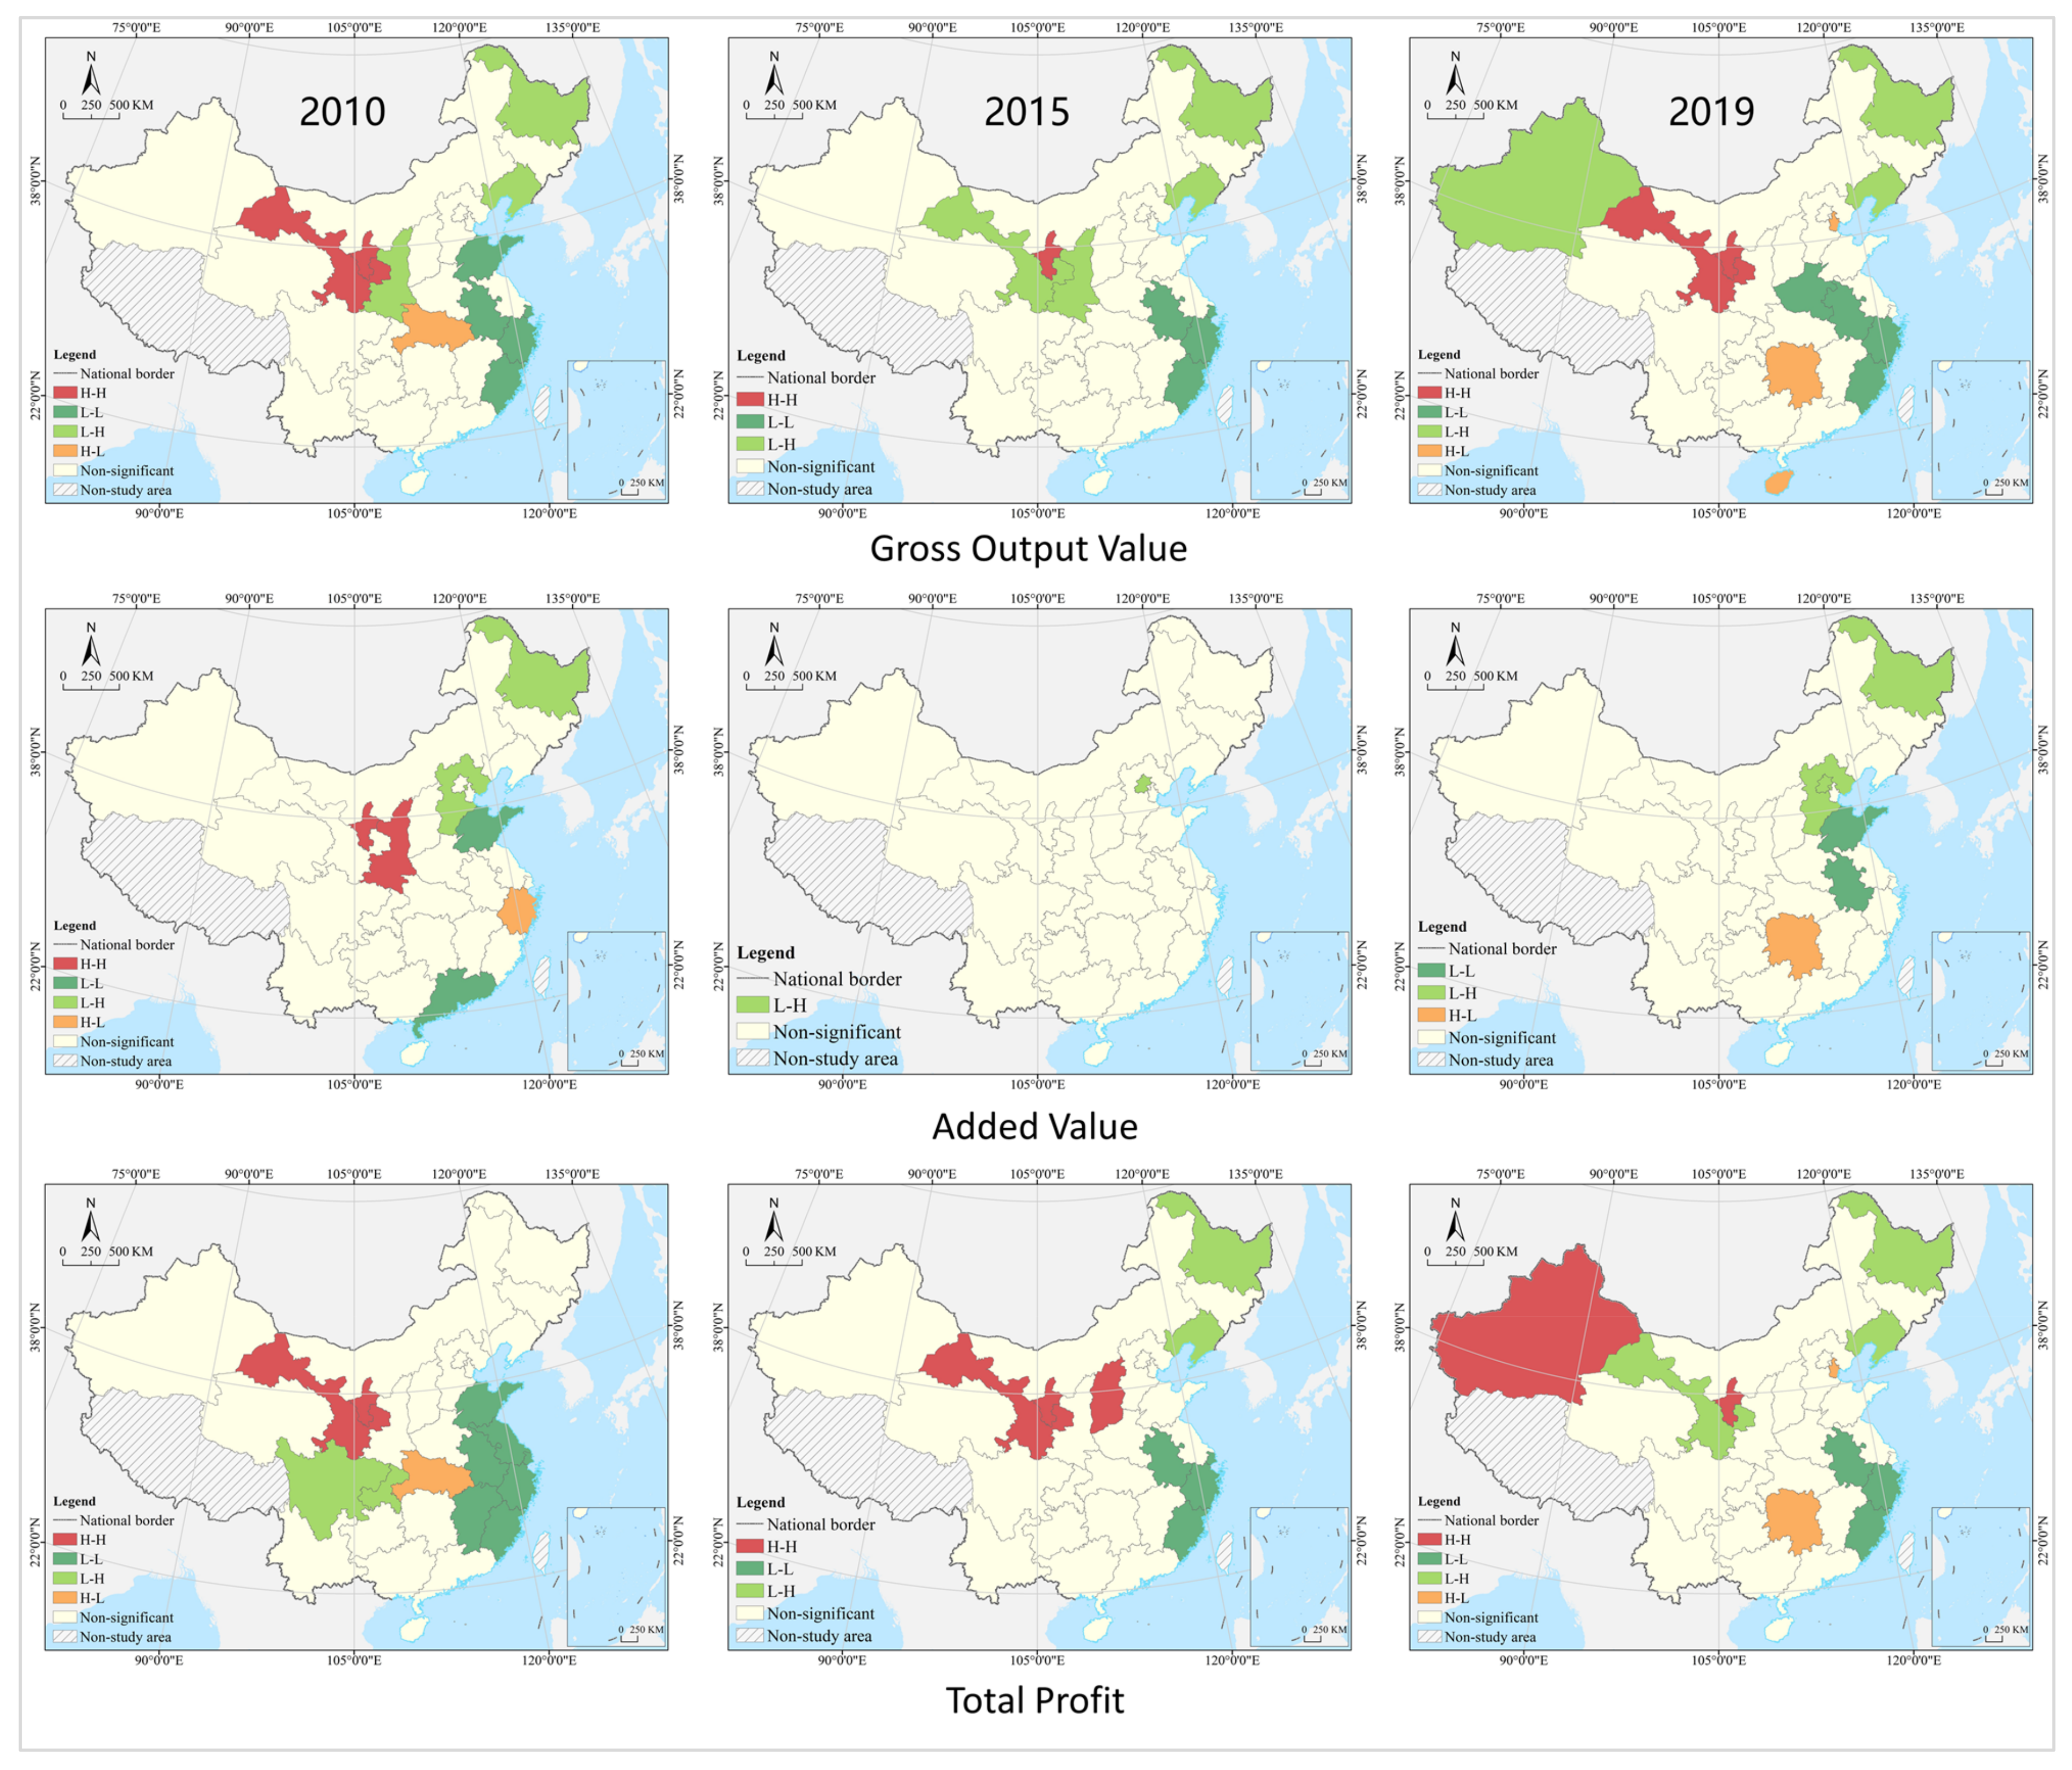
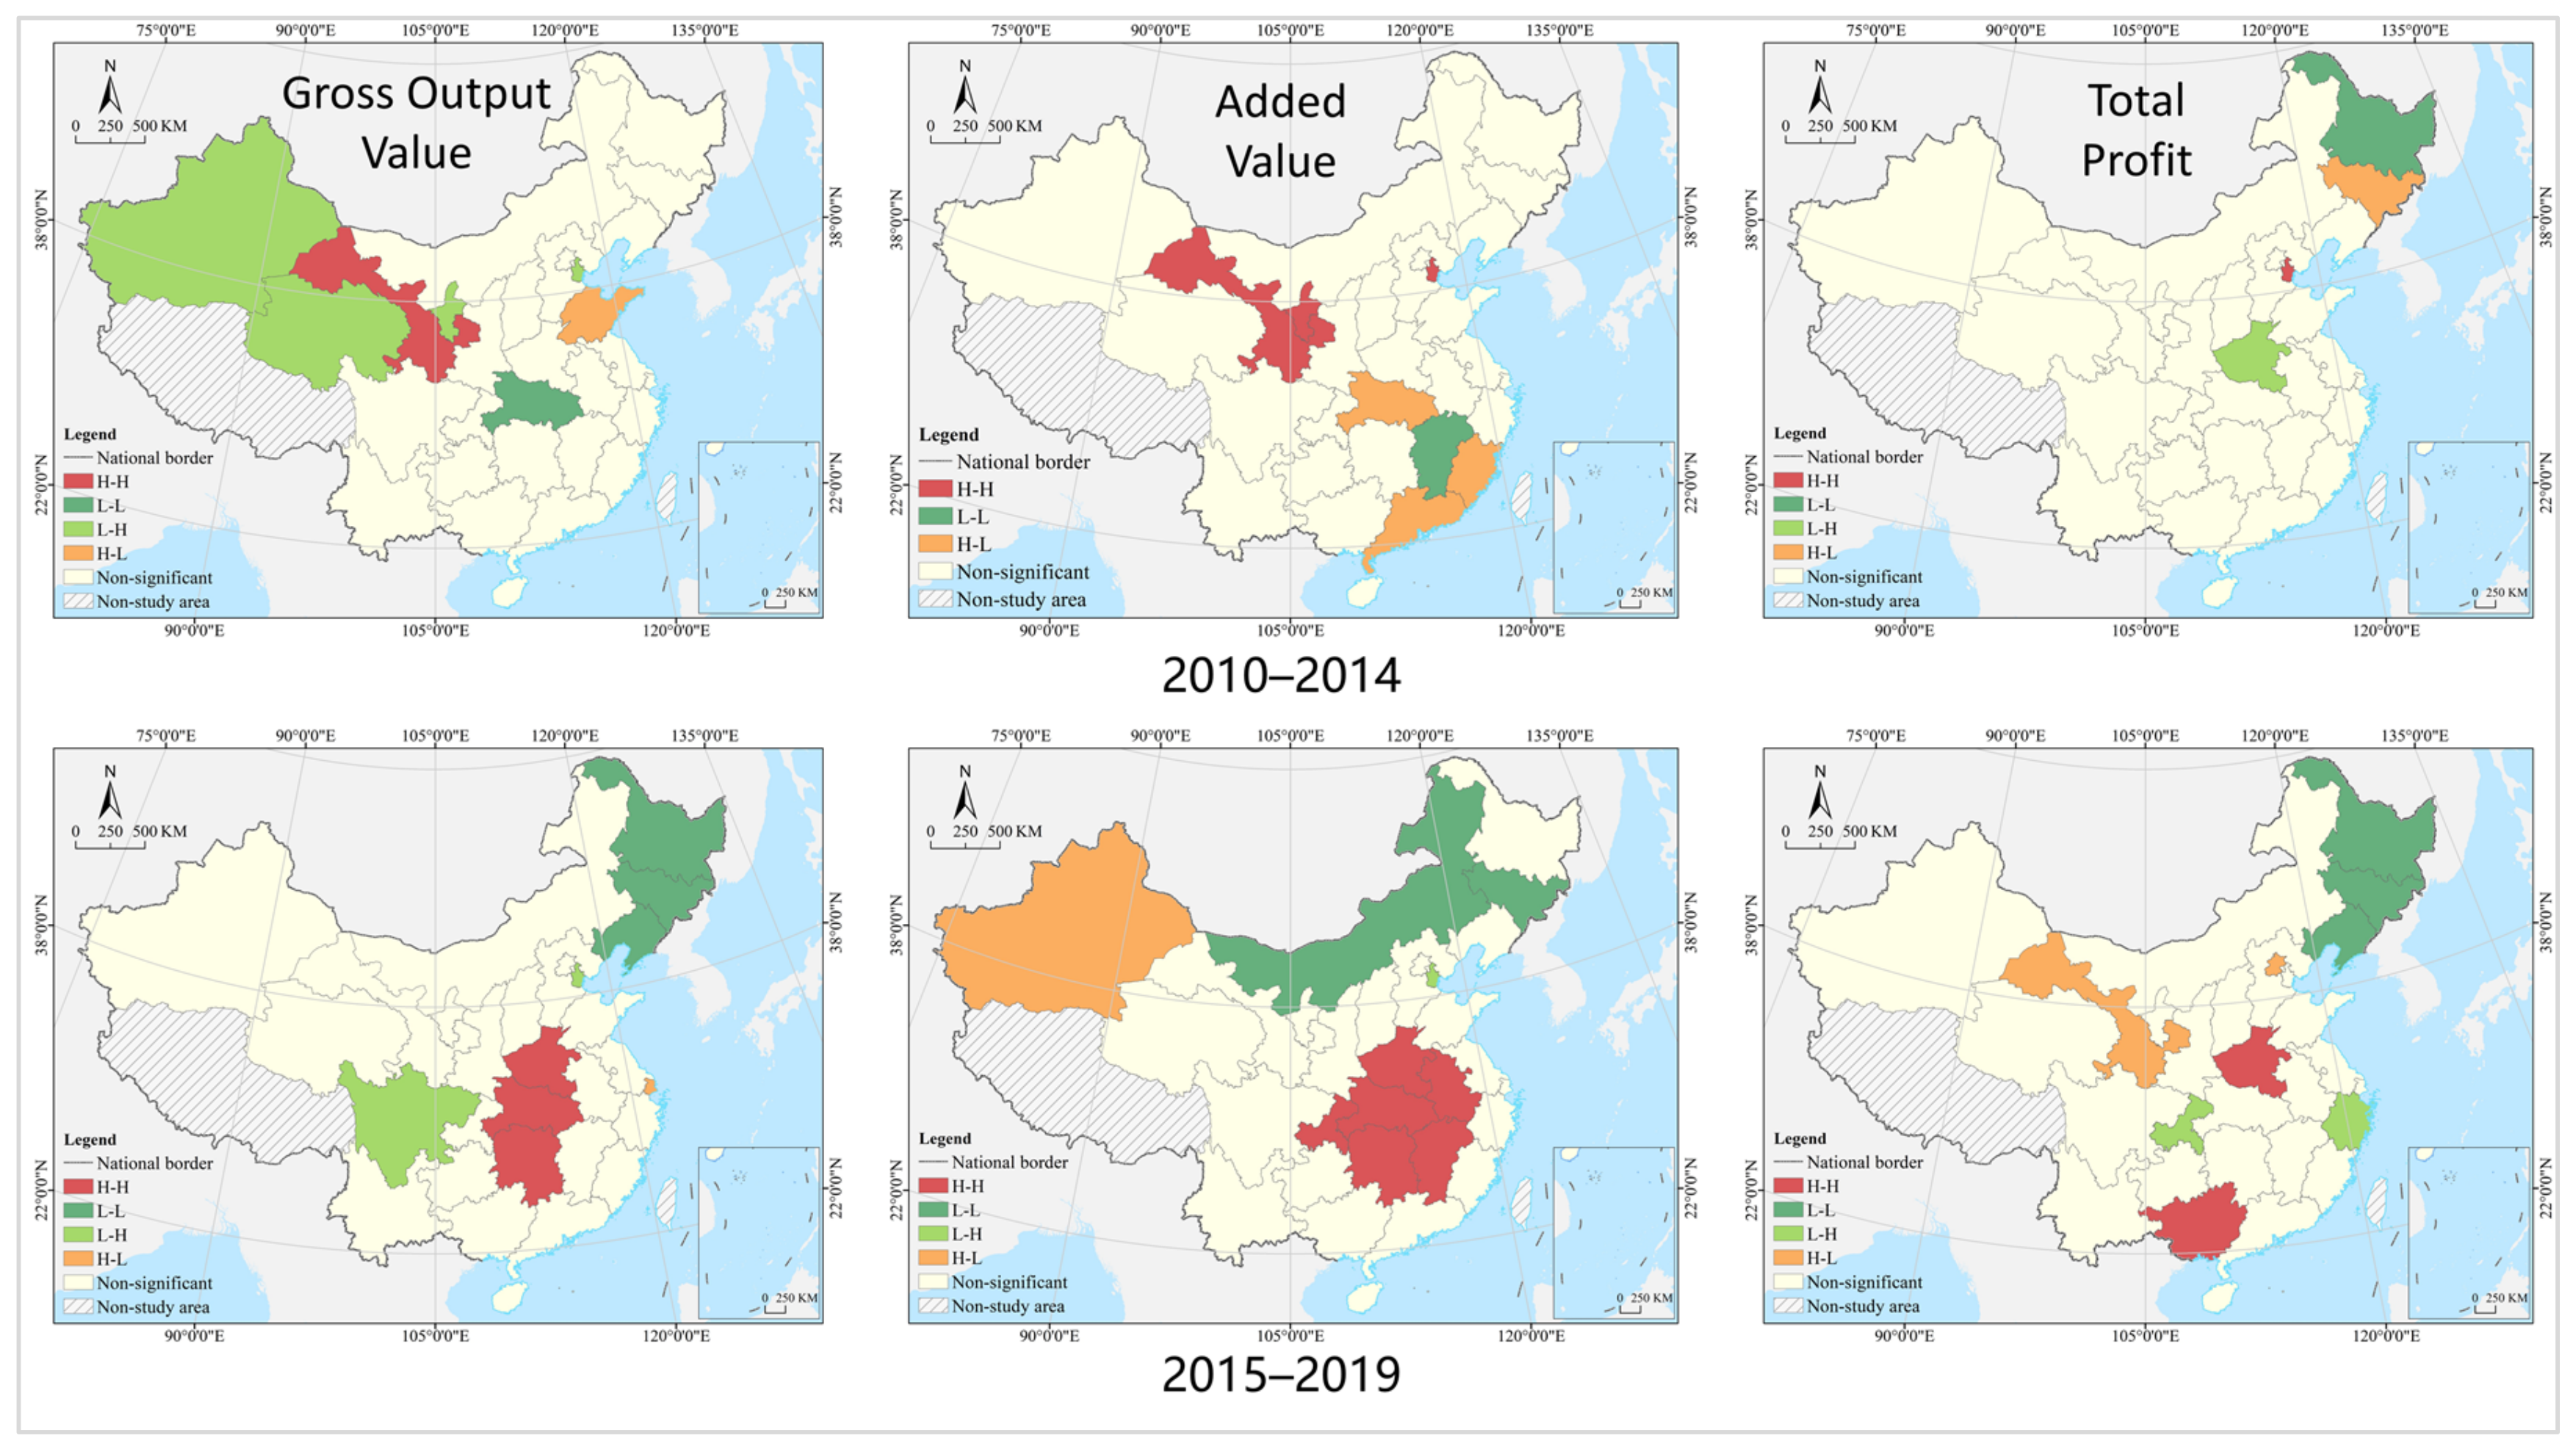
Table 1.
Literature analysis and review.
| Field | Typical View | Representative Author |
|---|---|---|
| Monitoring and Prediction | Insufficient construction carbon-emission statistics and complex detection systems and estimation tools constrain the calculation and prediction of construction carbon emissions, promoting the whole-industry chain and life-cycle construction carbon emissions; construction implied carbon-emission prediction to be a new research trend. | Monahan (2011), Ng (2012), Kang (2015), Chastas (2017), Oh (2019), Jackson (2020), Liu (2020), Robati (2021), Brooks (2021), etc. |
| Driving Mechanism | Carbon-emission changes in the construction industry are the result of the combined effects and interactions of multiple factors, and the use of regression models, indexes, and structural decomposition to analyze the driving mechanism has become a key research area. | Shi (2017), He (2020), Yang (2020), Erdogan (2021), Yildirim (2021), Zhang (2021), Xiang (2022), etc. |
| Scenario simulation | Focus is placed on the prediction and analysis of carbon-peaking and carbon-neutralization time nodes in the construction industry, with a strong emphasis on the simulation and modeling of carbon emissions and their trends in the construction industry in various situations. | Zhou (2018), Tan (2018), Che (2019), Shi (2019), Li (2020), Chen (2020), Huo (2021), Zhang (2021), etc. |
| Decoupling relationship | Research on the decoupling relationship between carbon emissions from the construction industry and income level, human development index (HDI), and economic development has become an emerging research hotspot, but not sufficient in depth and breadth. | Liang (2019), Ma (2019), Huo (2020), Chen (2020), etc. |
Table 2.
Decoupling type and decoupling indicator range.
| Decoupling Type | Policy Enlightenment | ||||
|---|---|---|---|---|---|
| Decoupling | Strong | ≤0 | ≥0 | ≤0 | Best, with economic growth accompanied by reduced carbon emissions |
| Weak | >0 | >0 | (0, 0.8] | Second best, with economic growth greater than carbon emissions’ growth | |
| Recessive | <0 | <0 | (1.2, +∞) | In negative growth, with carbon-emission deceleration greater than economic deceleration | |
| Coupling | Expansive | >0 | >0 | (0.8, 1.2] | Carbon emissions are growing largely in step with the economy |
| Recessive | <0 | <0 | (0.8, 1.2] | Carbon emissions are declining largely in step with the economy | |
| Negative Decoupling | Strong | >0 | <0 | <0 | Worst, with economic slowdown accompanied by increased carbon emissions |
| Weak | <0 | <0 | (0, 0.8] | Second worst, with economic slowdown greater than carbon emissions’ slowdown | |
| Expansive | >0 | >0 | (1.2, +∞) | Economic growth is less than carbon-emission growth | |
Table 3.
Analysis on global Moran’s I of carbon emission and its intensity.
| 2010 | 2015 | 2019 | ||
|---|---|---|---|---|
| Carbon Emission | −0.20 | −0.04 ※ | −0.06 ※ | |
| Carbon-Emission Intensity | Gross Output Value | −0.01 ※ | −0.03 ※ | −0.01 ※ |
| Added Value | −0.07 ※ | −0.14 ※ | −0.10 ※ | |
| Total Profit | 0.06 ※ | 0.01 ※ | 0.01 ※ | |
Note: ※ stands for p > 0.1.
Table 4.
Analysis on global Moran’s I of decoupling type.
| 2010–2014 | 2015–2019 | |
|---|---|---|
| Gross Output Value | 0.05 ※ | 0.20 |
| Added Value | 0.13 ※ | 0.14 |
| Total Profit | 0.15 | 0.08 ※ |
Note: ※ stands for p > 0.1.
Publisher’s Note: MDPI stays neutral with regard to jurisdictional claims in published maps and institutional affiliations. |
© 2022 by the authors. Licensee MDPI, Basel, Switzerland. This article is an open access article distributed under the terms and conditions of the Creative Commons Attribution (CC BY) license (https://creativecommons.org/licenses/by/4.0/).
Share and Cite
MDPI and ACS Style
Zhang, P.; Hu, J.; Zhao, K.; Chen, H.; Zhao, S.; Li, W. Dynamics and Decoupling Analysis of Carbon Emissions from Construction Industry in China. Buildings 2022, 12, 257. https://0-doi-org.brum.beds.ac.uk/10.3390/buildings12030257
AMA Style
Zhang P, Hu J, Zhao K, Chen H, Zhao S, Li W. Dynamics and Decoupling Analysis of Carbon Emissions from Construction Industry in China. Buildings. 2022; 12(3):257. https://0-doi-org.brum.beds.ac.uk/10.3390/buildings12030257
Chicago/Turabian StyleZhang, Ping, Jing Hu, Kaixu Zhao, Hua Chen, Sidong Zhao, and Weiwei Li. 2022. "Dynamics and Decoupling Analysis of Carbon Emissions from Construction Industry in China" Buildings 12, no. 3: 257. https://0-doi-org.brum.beds.ac.uk/10.3390/buildings12030257
Note that from the first issue of 2016, this journal uses article numbers instead of page numbers. See further details here.