Article

Development of a Mix Design Method for Multiplexed Powder Self-Compacting Concrete Based on the Multiscale Rheological Threshold Theory

1
State Key Laboratory of Hydroscience and Engineering, Tsinghua University, Beijing 100084, China
2
College of Civil and Transportation Engineering, Hohai University, Nanjing 210098, China
3
Huaneng Tibet Hydropower Safety Engineering Technology Research Center, China Huaneng Group Co., Ltd., Beijing 100031, China
*
Author to whom correspondence should be addressed.
Submission received: 14 September 2022 / Revised: 24 September 2022 / Accepted: 26 September 2022 / Published: 12 October 2022
(This article belongs to the Special Issue Multiscale Calculation of Structural Concrete)

Abstract

:
The multiscale rheological threshold theory can guide the mix design of self-compacting concrete (SCC) from a trans-scale view. Through the paste thresholds calculated by the mini-slump flow test results, the workability of SCC can be predicted. However, this method shows insufficient prediction accuracy when handling multiplexed powder. In the existing threshold calculation formula, the characteristics of powder materials were described through empirical values, without considering the specific properties of various powders. This paper focuses on the application of the multiscale rheological threshold theory to multiplexed powder SCCs. Through the research on the characteristics of powder materials, especially D50 and Span, the effect of the powder properties on paste thresholds was carried out. The prediction accuracies were confirmed by four sets of self-compacting mixtures at paste and concrete scales and were verified with another set of tests. There are a total of 45 paste and 45 SCC test results with multiplexed powders, including cement, fly ash, and limestone powder. The predicting accuracies are expressed as the relative accuracy ε and the accuracy index ε′, calculated by the comparison of self-compacting zones at paste and SCC scales. The calculation results showed that ε and ε′ of the modified method increased. This modified method can be efficient for the mix design of SCC containing multiplexed powders.

1. Introduction

Self-compacting concrete (SCC), discovered by Okamura [1] in 1988, has high flowability and segregation resistance in the fresh state. No vibration is necessary for SCC to flow through the gaps of reinforcements and inaccessible parts in construction formwork on account of its excellent self-compacting performance [2,3]. Relying on these advantages, the application of SCC reduces construction time, noise pollution, and labor costs [3]. Thus, it has become a kind of high-performance concrete used widely worldwide. Except for the benefits, the performance is susceptible to material changes in composition and dosage, causing difficulties in the mix design.
Researchers put efforts into the mix design, aiming at the simplified and accurate methods, such as the empirical method, strength-related method, and aggregate packing-related method [4]. Okamura [5] invented an empirical mix design method. The initial mix proportion was selected by empirical dosage and adjusted through the SCC tests, until the performance of the SCC became satisfactory. Su [6,7] related the packing properties of aggregates to SCC performance and developed a corresponding mix design method. Domone [8] reported a mix design method based on the empirical relationship between gravel content and SCC performance; the mix proportion needed to be determined by the SCC test results. Bouziani [9] investigated a statistical data-related method for mix design. After establishing the statistical relationship between the SCC test results and its component parameters based on large amounts of data, the performance of a certain mix proportion could be predicted. All the mix design methods introduced above involve the macroscopic SCC test as an essential step, several or many times. It might require lots of experiments and waste of material to obtain the SCC mix proportion with satisfying performance.
To simplify the process of mix design, some researchers were concerned with the multiscale rheology between paste and SCC. Based on the rheometer test, Saak [10,11] related the segregation of SCC with the rheological parameters of SCC, and proposed the yield stress calculation method from the slump flow (SF) test results. Bui [12] set up a rheological model of paste based on the test results from the rheometer tests, providing quantitative rheological relationships between paste and SCC. Wu [13] set up the multiscale rheological threshold theory based on the relationship between the mini-SF test results and the rheological properties of the paste. The test results from the SF tests can be more consistent than rheometers. Through the yield stress and plastic viscosity criteria in Wu’s theory, the performance of SCC can be predicted based on the paste rheological properties. Thus, the SCC mix design can be completed by the mini-SF test of the paste, achieving a trans-scale prediction. Nie [14] and Zhang [15] proposed the self-compacting zones at the paste and SCC scales with the bilinear interpolation method, visualizing the mix design calculation. The zones displayed the trend of the paste rheological properties when the mix parameters varied. Further studies of the improvement of this mix design method were proposed. Concerning the aggregates, Zhang [15,16,17,18,19] studied the influences caused by the size, content, and shape of sand [16] and gravel [15]. Except for aggregates, the powder material had large proportions of concrete. SCC consists of a higher percentage of cementitious materials than traditional concrete [3], which leads to higher costs and environmental impact. The minimization of the carbon footprint and the utilization of natural resources are focus issues worldwide, and substitutes for cementitious materials are an especially important concern in the application of SCC [17]. To increase the applicability of substitutable powder, Zhang studied the impact of fly ash (FA) and limestone powder (LP) [18,19,20] from the viewpoint of empirical coefficients and equivalence models. Li [21,22,23] reported the quantifiable impact that the packing properties of the mortar caused and proposed the equivalent mortar film thickness. However, the only factor deciding the powder parameters was the powder type. The original parameters reported by Wu were based on research by Toutou [24] and Banfill [25], two cement constants. Then, Zhang [17,19] studied the equivalent and empirical coefficients of FA and LP. In the above studies, each type of powder shared the same parameters, neglecting the diversities between powders within the same type. Turkel [26] demonstrated that mineral additives contributed more to fresh properties than aggregates. Up to now, a lot of qualitative research about the powder’s influence on the fresh properties of SCC has been proposed. Some researchers [27,28] reported that the spherical geometry and smooth surface caused FA particles to reduce the water requirement for achieving good flowability. Gritsada [29] also found the above trend in LP particles; the smooth surface and spherical shape have effects on the workability of SCC mixtures. However, Zhu [30] proposed a diverse conclusion that LP from mechanical grinding might show irregular and angular features. Thus, the studies of the quantitative impacts that powder causes should be considered in the threshold theory.
This paper aims to increase the applicability of multiscale threshold theory on substitutable powders, including FA and LP, reducing time, cost, and utilization of cement in SCC mix design in civil, hydraulic, and other engineering applications. The influences caused by the multiplexed powders on the fresh SCC properties were studied. Thus, the quantification of the impacts on the paste thresholds was achieved, and the theory was modified. The modification was verified by five series of tests containing up to 90 self-compacting performance tests at the paste and SCC scales. Based on the modified multiscale rheological threshold theory, a mix design method for multiplexed powder SCC is proposed.

2. SCC Mix Design Method Based on Multiscale Rheological Threshold Theory

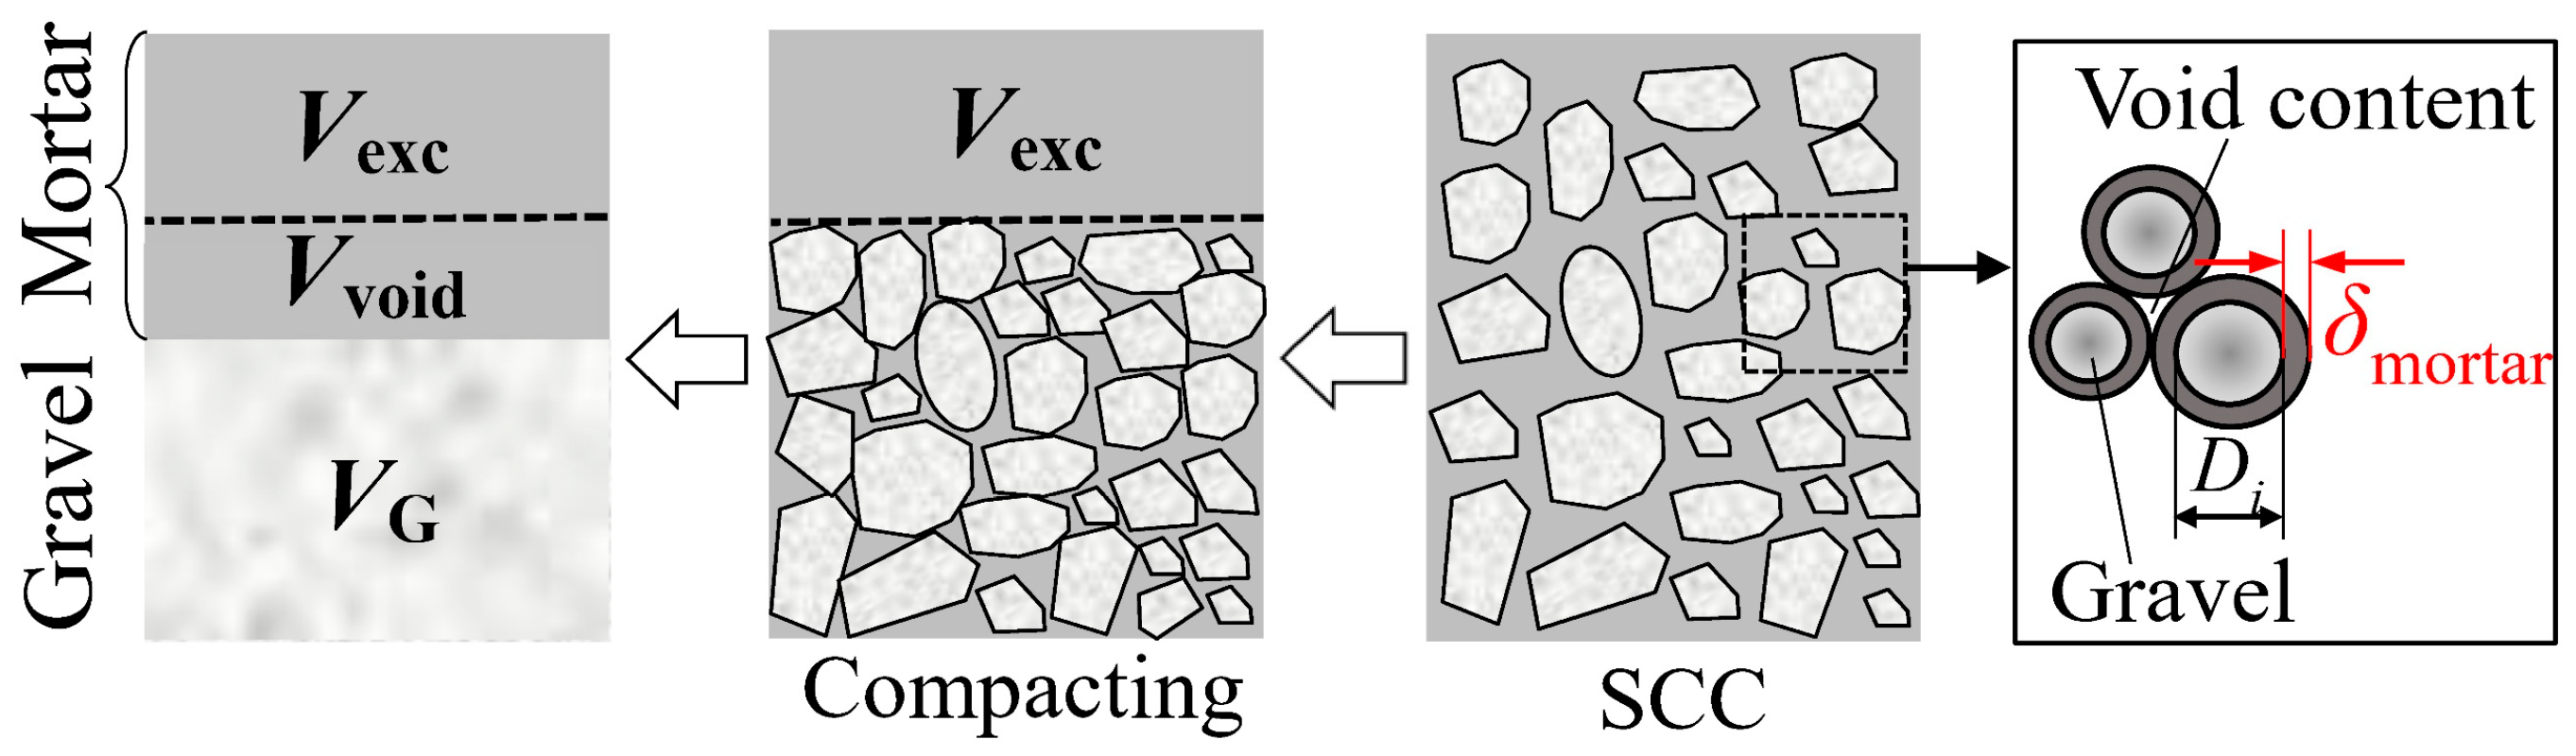
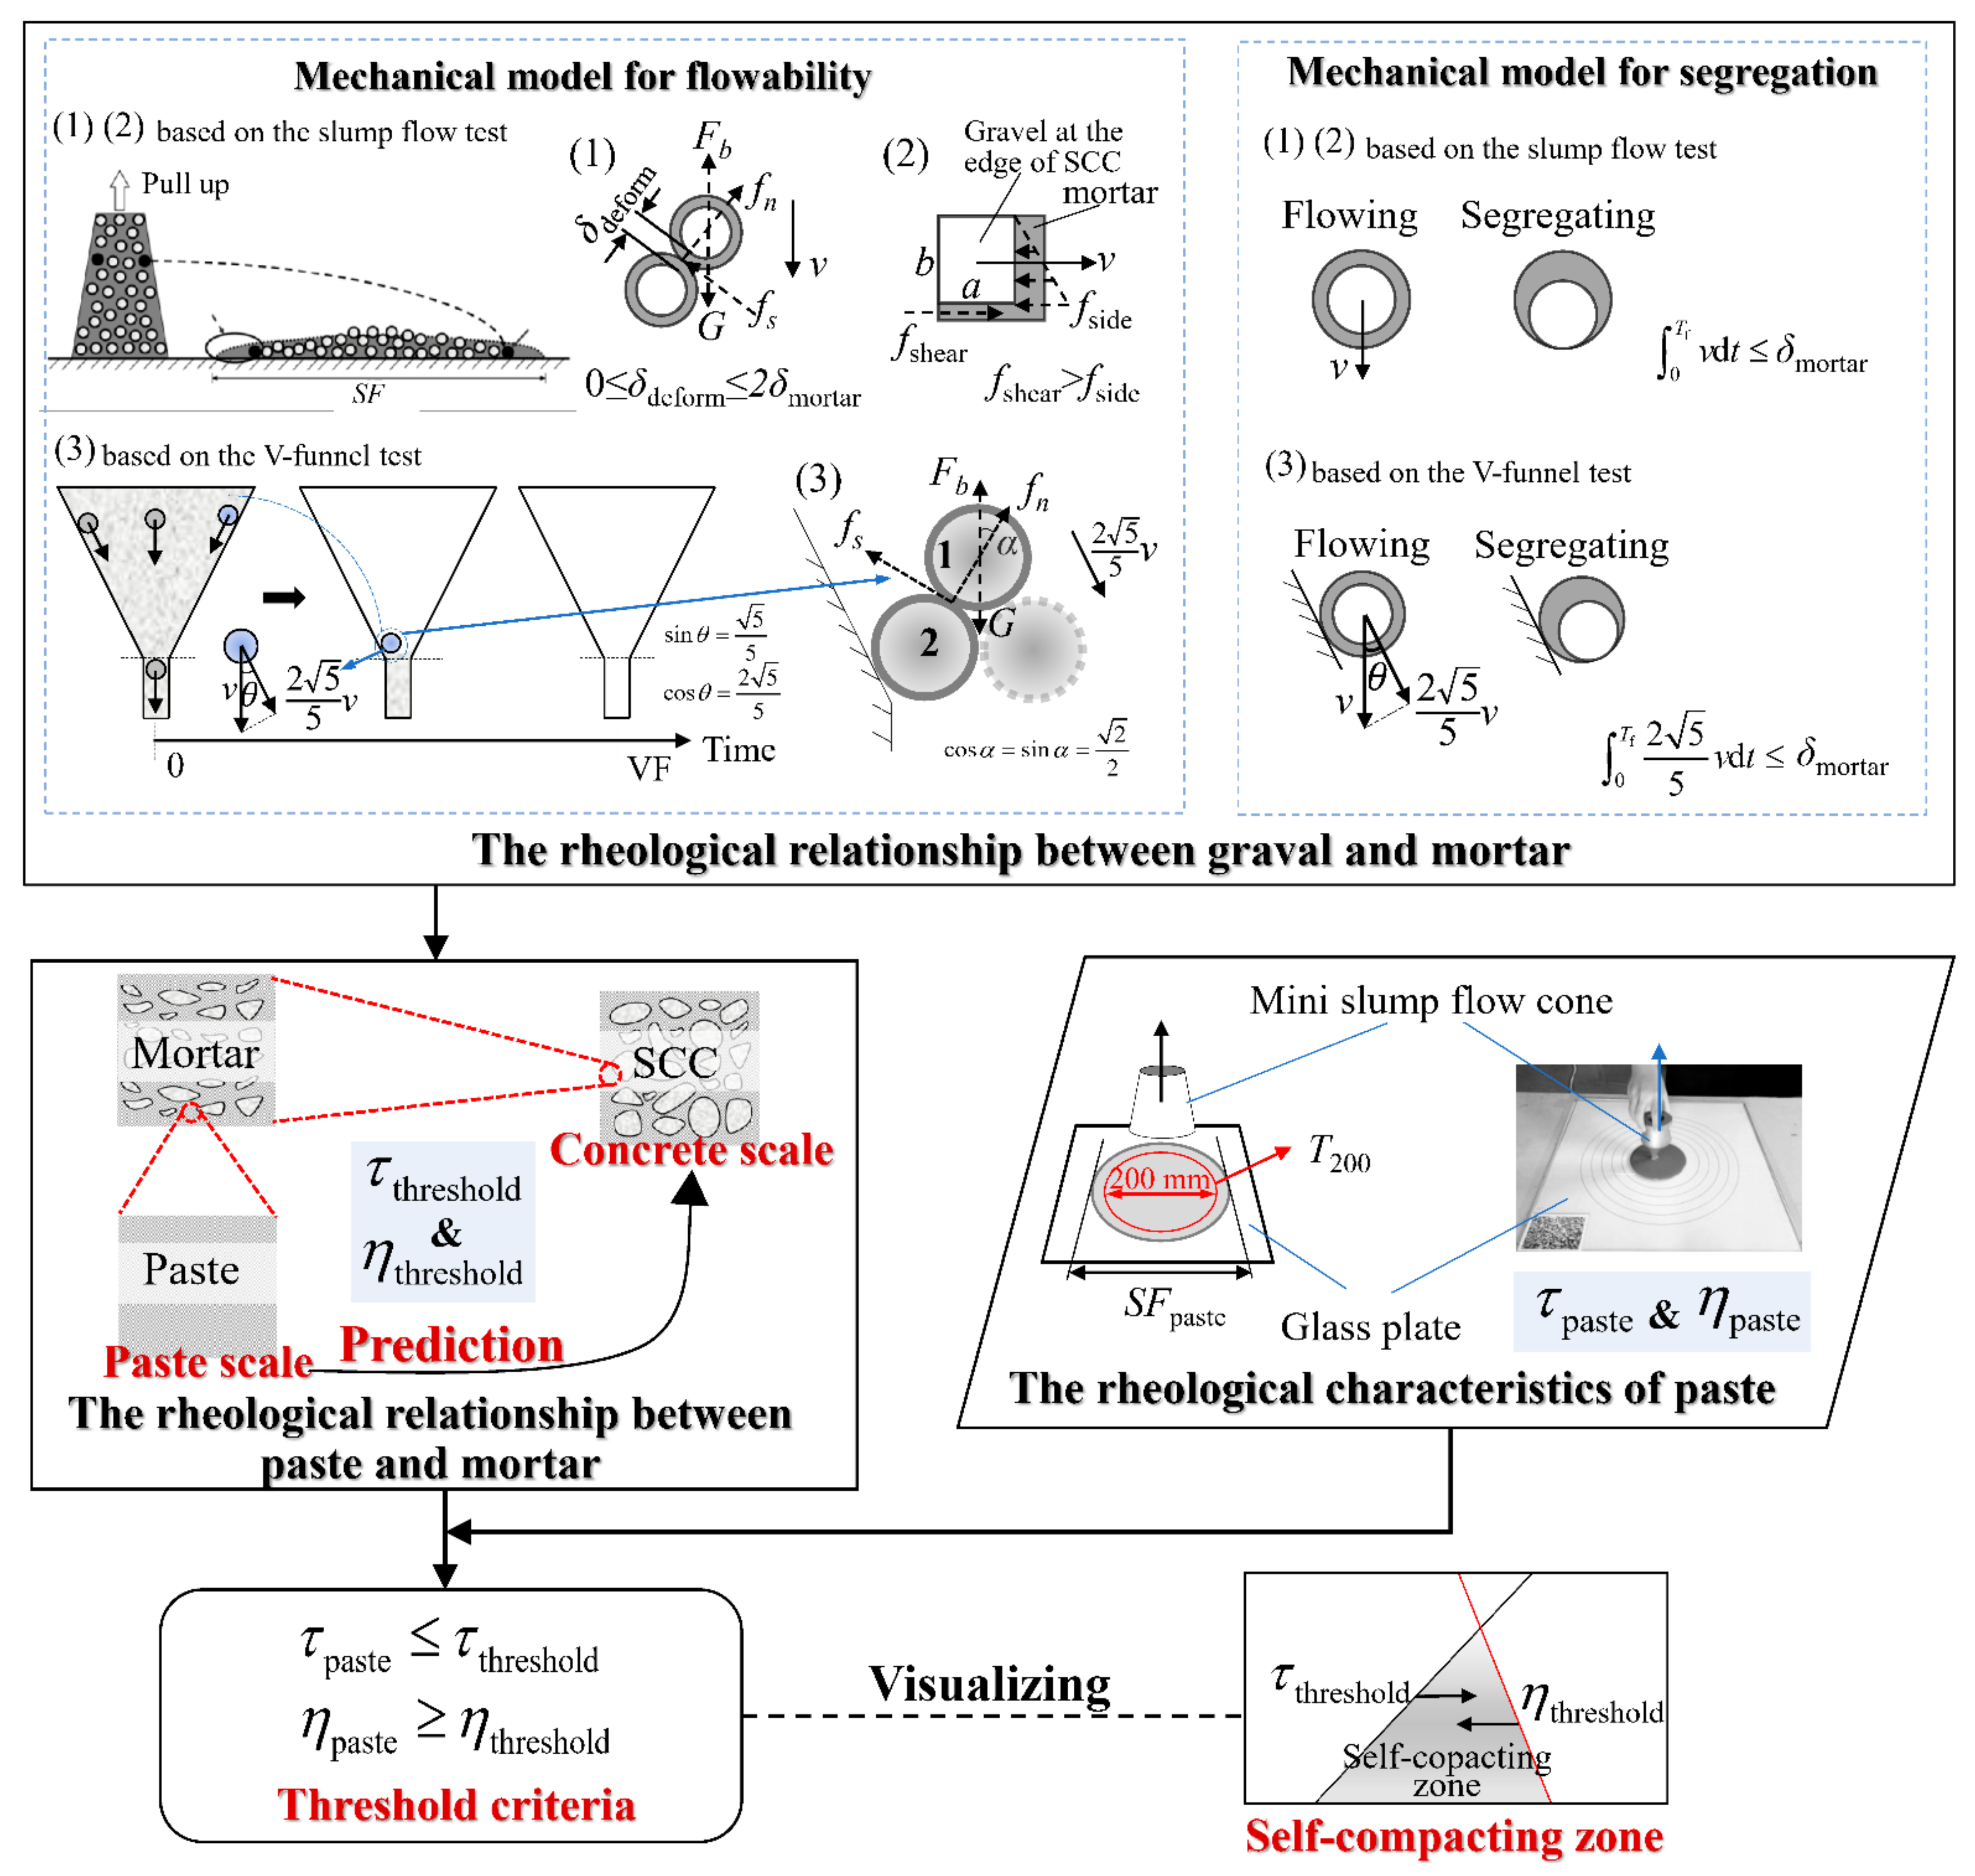
2.1. Multiscale Rheological Threshold Theory

The excess thickness theory [12,31] provides the foundation of the rheological threshold theory. The basic assumption is that the mortar acts as a film, filling the voids between gravel particles and the excess part of the mortar, wrapping the gravel particles evenly. As shown in Figure 1.
Vexc, Vvoid, and VG denote the volume of the excess mortar, the voids among the gravel and the gravel. Di refers to the sieving particle size of gravel fraction i and δmortar is the mortar film thickness. The calculation method is shown as Equation (1).
V G × a i % 1 6 π D i 3 × 1 6 π ( D i + 2 δ mortar ) 3 D i 3 = V exc
where ai% means the percentage of gravel mass retained between the upper and lower sieve sizes in fraction i, r means the average radius of the gravel; the detailed calculation method is in [9].
The threshold theory was established and modified in three phases, as shown in Figure 2. The initial threshold theory was set up by Wu based on the SF test, consisting of the yield stress threshold and the plastic viscosity threshold. The flowability and segregation resistance were considered to be relative to the yield stress and plastic viscosity, respectively. The schematic diagram of Wu’s model is shown as case (1) in Figure 2.
The rheological relationship between the mortar and the gravel was obtained as the basis, and then the relationship between the mortar and paste was proposed. Based on that, the limit values of the rheological parameters were obtained as the paste thresholds, expressed in Equations (2) and (3).
τ paste τ threshold = 2 Δ ρ g r 2 3 δ mortar ( 1 ϕ / ϕ max ) n
η paste η threshold = 20 Δ ρ g r 2 9 δ mortar ( 1 ϕ / ϕ max ) η φ max
where τpaste and ηpaste refer to the yield stress and plastic viscosity of the paste, respectively. τthreshold and ηthreshold denote the yield stress and plastic viscosity thresholds of the paste, respectively. Δρ is the density differences between the gravel and mortar, and ρpaste is the density of the paste. g is the acceleration of gravity, 9.8 m/s2. n denotes the powder fitting coefficient, obtained as 4.2 in [24]. [η] denotes the intrinsic viscosity, determined to be 2.5 in [25]. ϕ and ϕmax are the actual and maximum sand-mortar ratios. ϕmax can be calculated by Equation (4):
ϕ max = 1 0.45 d min / d max 0.19
where dmin and dmax are the smallest and largest sand diameters, respectively.
As we can see from the above threshold formula, the thresholds were determined by the calculated parameters of the given SCC mix and materials. Additionally, the real rheological parameters τpaste and ηpaste can be calculated by the mini-SF tests. Roussel [32] reported the calculated method of yield stress from the final SF value, presented as Equation (5).
τ paste = 225 ρ paste g V paste 2 128 π 2 ( S F paste / 2 ) 5 λ ( S F paste / 2 ) 2 V paste
where Vpaste and hcone mean the volume and height of the mini-SF cone, respectively. SFpaste represents the final SF value. λ is a function of both the tested fluid surface tension and the contact angle. A detailed study can be found in [32].
Chidiac [33] found the relationship between the plastic viscosity and the flow time when SFpaste reached a certain value (200 mm in this research). The relationship can be expressed as Equation (6):
η paste = 2 ρ paste g h cone V paste 3 π × S L pres × S F pres 2 T 200
where SFpres and SLpres represent the prescribed spread (200 mm) and its slump. T200 is the time cost when SFpaste reaches 200 mm.
Thus, through the comparison of the real paste rheological parameters and the thresholds, the performance of SCC can be predicted.
However, when the gravel content changed, Zhang [15] found that Wu’s models were not enough to describe all the flow situations. He set up new mechanical models according to the gravel particles at the edge of the SCC when the flow was about to stop in the SF test. Case (2) in Figure 2 shows the schematic diagram of Zhang’s model. The improved threshold criteria are expressed as below:
τ paste τ threshold = ρ mortar g ( b + 2 δ mortar ) 2 ( a + 2 δ mortar ) 2 ( 1 ϕ / ϕ max ) n
η paste η threshold = 2 Δ ρ g r 2 δ mortar ( 1 ϕ / ϕ max ) [ η ] ϕ max
where a and b denote the width and the height of the gravel particle, equaling to 2r and 0.9r, respectively.
The above models were established based on the SF test, which led to unsatisfied predictions in some situations. Compared with the SF test, the V-funnel test provides a more complicated flow circumstance for SCC. Considering the pressure of gravel particles on the paste, the following threshold models were set up based on the V-funnel test. Case (3) in Figure 2 presents the schematic diagram of this model, and it can be expressed by Equations (9) and (10).
τ paste τ threshold = 13 2 Δ ρ g r 2 48 δ mortar ( 1 ϕ / ϕ max ) n
η paste η threshold = 28 Δ ρ g r 2 45 δ mortar ( 1 ϕ / ϕ max ) η φ max
Based on the threshold criteria, the flowability of SCC can be predicted. Thus, the mix proportion satisfying self-compacting performance requirements is obtained. To discover the trend clearly and intuitively, the visualized self-compacting zone is proposed, which will be introduced in Section 2.2.

2.2. Self-Compacting Zones

An area in a two-dimensional graphic that can show all the mix design points that lead to self-compacting mixtures is the self-compacting zone. There are different kinds of self-compacting zones at different scales, such as the paste and concrete scales. These zones are the visualization of the threshold theory.
The self-compacting paste zone (SCP zone) was proposed by Nie [14]. According to research, the rheological parameters and thresholds are obtained based on the mini-SF test results. Thus, the bilinear interpolation method can guide the confirmation of an area consistent with the threshold criteria, with the Vw/Vp (the volume ratio of water and powder) and SP% (the mass percentage of superplasticizer to powder) as the axis. The boundaries of the zone represent the threshold criteria. All the points in the area correspond to SCC mix proportions with applicable flowability.
The self-compacting concrete zone (SCC zone) was developed by Zhang [15]. Similar to the boundaries of the SCP zone related to paste thresholds, the boundaries of the SCC zone are connected to the self-compacting criteria for SCC. It includes the SF and V-funnel time (VF) obtained from the SF test and the V-funnel test, respectively. Equations (11) and (12) show the criteria.
600   mm S F   800   mm
4   s V F   25   s
When evaluating the accuracy of the threshold theory, we regard the SCP zone as a prediction zone for the SCC zone. The prediction accuracy was obtained by the comparison of the two zones.

2.3. Limitation of Existing Research

The existing threshold theory was established for certain kinds of powder materials. The initial test consisted of only a single kind of powder [13], of which n and [η] were 4.2 and 2.5, respectively. Then Zhang [17,18,19,20] researched the equivalence model for binary or ternary powder based on the test results, where the powders of the same type had the same parameters. According to his research, n and [η] of FA were 6.5, while those of LP were 7.0. However, different powders perform differently, even if they are of the same type. The particles may have different sizes, shapes, or spans, and show different rheological characteristics. The type is not the only factor that affects its properties.
Research on the properties of aggregates was carried out, such as particle size, packing properties, and shape. The properties of materials affect the rheology of the paste and SCC a lot, effects caused by the powder should not be neglected. It should be noted that the particle size and shape of powder are all potential factors that can affect the performance of paste and SCC.

3. Modification of Multi-Scale Threshold Theory

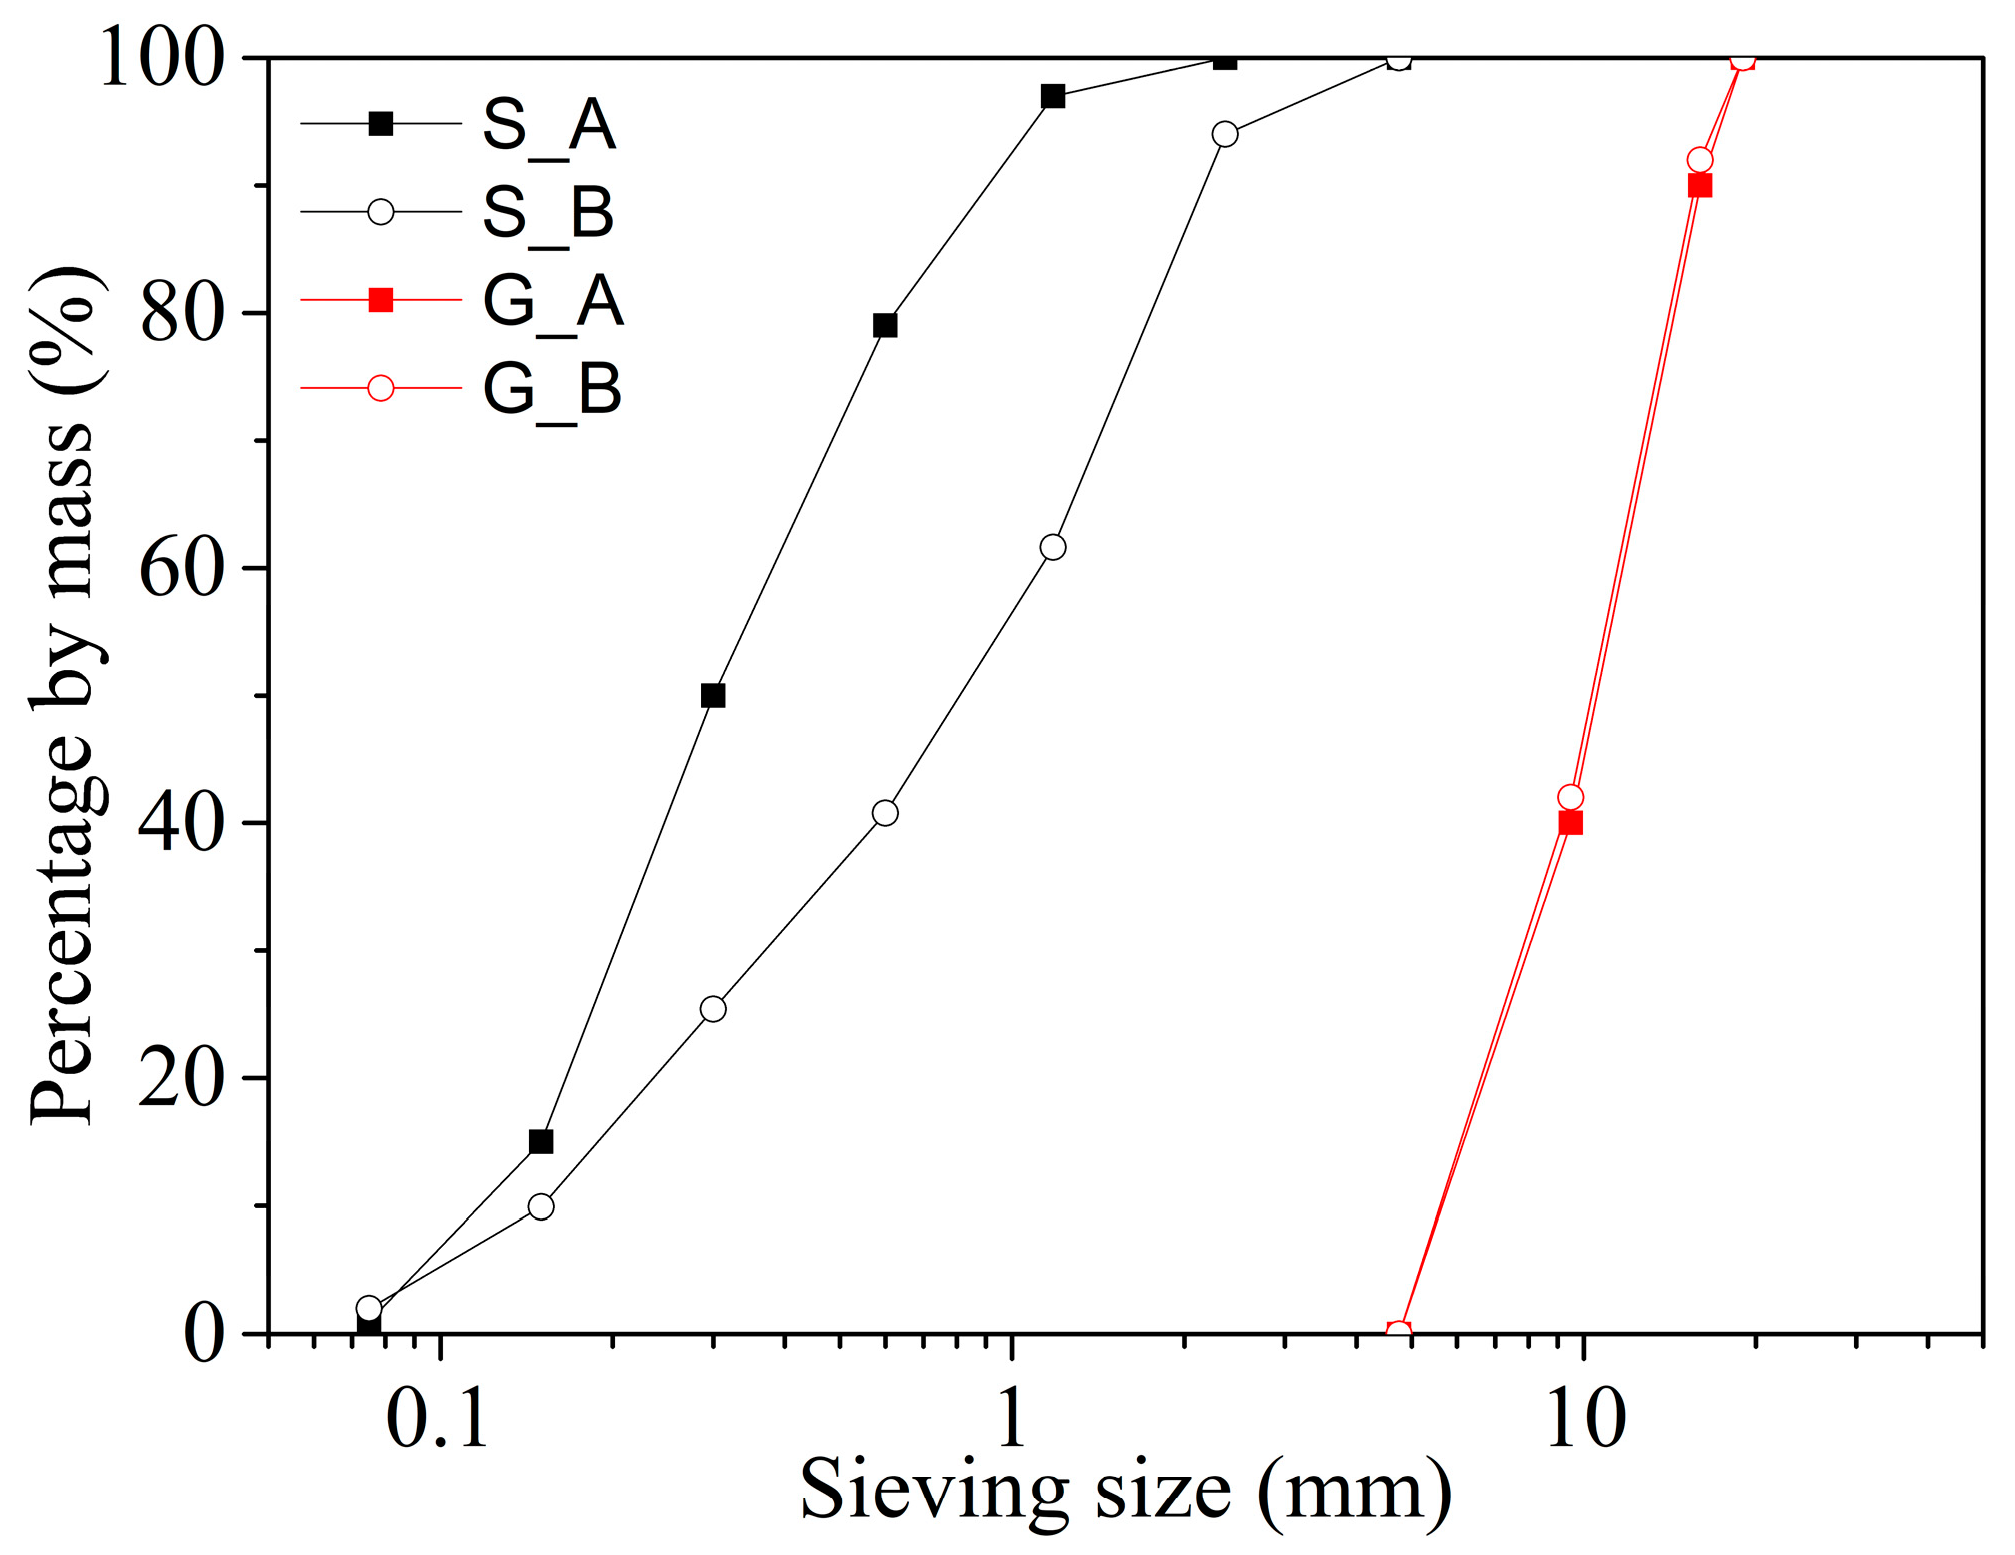
3.1. Materials, Test Design, and Test Method

Two types of 42.5 Portland cement (marked as C_A and C_B), fly ash (FA), and limestone powder (LP) were selected as powder materials. The densities of those powders were measured with a pycnometer [34], which were 3.08, 3.15, 2.50, and 2.50 g/cm3, respectively. The particle size parameter D50 of the above four powders are 20.30, 20.39, 17.82, and 19.28 μm, while the particle distribution parameters Span are 2.26, 2.27, 3.54, and 3.46 μm. The particle size distribution curves of the powders are shown in Figure 3.
Two kinds of crushed limestone gravel were used, marked as G_A and G_B. The densities of G_A and G_B are 2.70 g/cm3 and 2.80 g/cm3, respectively. The packing densities of the above two gravels are 1.36 g/cm3 and 1.47 g/cm3. There are two types of sand. The quartz sand is marked as S_A, with a density of 2.64 g/cm3. The machine-made sand is marked as S_B, with a density of 2.65 g/cm3. Figure 4 shows the particle size distribution curves of aggregates obtained by the sieving tests. The properties of the aggregates were all tested according to Chinese standard JGJ/52 2006 [35]. A polycarboxylate-based superplasticizer (SP) was used.
As introduced above, the comparison of self-compacting zones at paste and SCC scales is the basic method for this research. To obtain a self-compacting zone, nine mix points were necessary. Thus, the nine paste tests and nine related SCC tests constitute a series of tests. To study the effect of the powder characteristics on paste thresholds, we designed five series of experiments, as shown in Table 1. Serials 1–4 were basic modifications. According to the test results of Serials 1–4, we modified the parameters relevant to powder materials in the threshold formulas. Thus, the mix design method based on the threshold theory could be modified, making it more applicable to multiplexed powder. To confirm the applicability of the modified method to multiplexed powder, the fifth series of paste and SCC tests were carried out. The test design details are shown as Serial 5 in Table 1. In the table, C%, FA%, and LP% are the volume percentages of cement, FA, and LP to powder, respectively. G% is the gravel ratio to the whole mixture by volume. S% is the volume ratio of sand to mortar.
The test includes two steps at different scales.
The first step is on the paste scale. For each mix point, a total of 0.4 L of paste was mixed with an NJ-160-type paste mixer. Firstly, the weighed powders were put into the mixer. Then, the mixer was turned on, which could control the mixing process by itself. There were three steps in mixing, a low-speed mixing for 120 s, a break for 15 s, and a high-speed mixing for 120 s. During the first 30 s of mixing, the weighed water and SP were added to the mixer uniformly. Finally, we sampled the fresh paste to propose a mini-SF test and obtain SFpaste and T200.
The second step is on the SCC scale. For each mix point, a total of 20 L of SCC was mixed by a single-shaft mixer. At first, the weighed dry materials were put into the mixer in the order of gravel, sand, and powder. After premixing for 30 s, the water and SP weighed were poured into the mixer, and a mixing phase for 180 s was conducted. When the mixing was performed, we sampled the fresh concrete and proposed the SF test and the V-funnel test to obtain SF and VF. The test standard for SCC was the Chinese standard CECS 203-2006 [36].

3.2. Modification of Powder Parameters
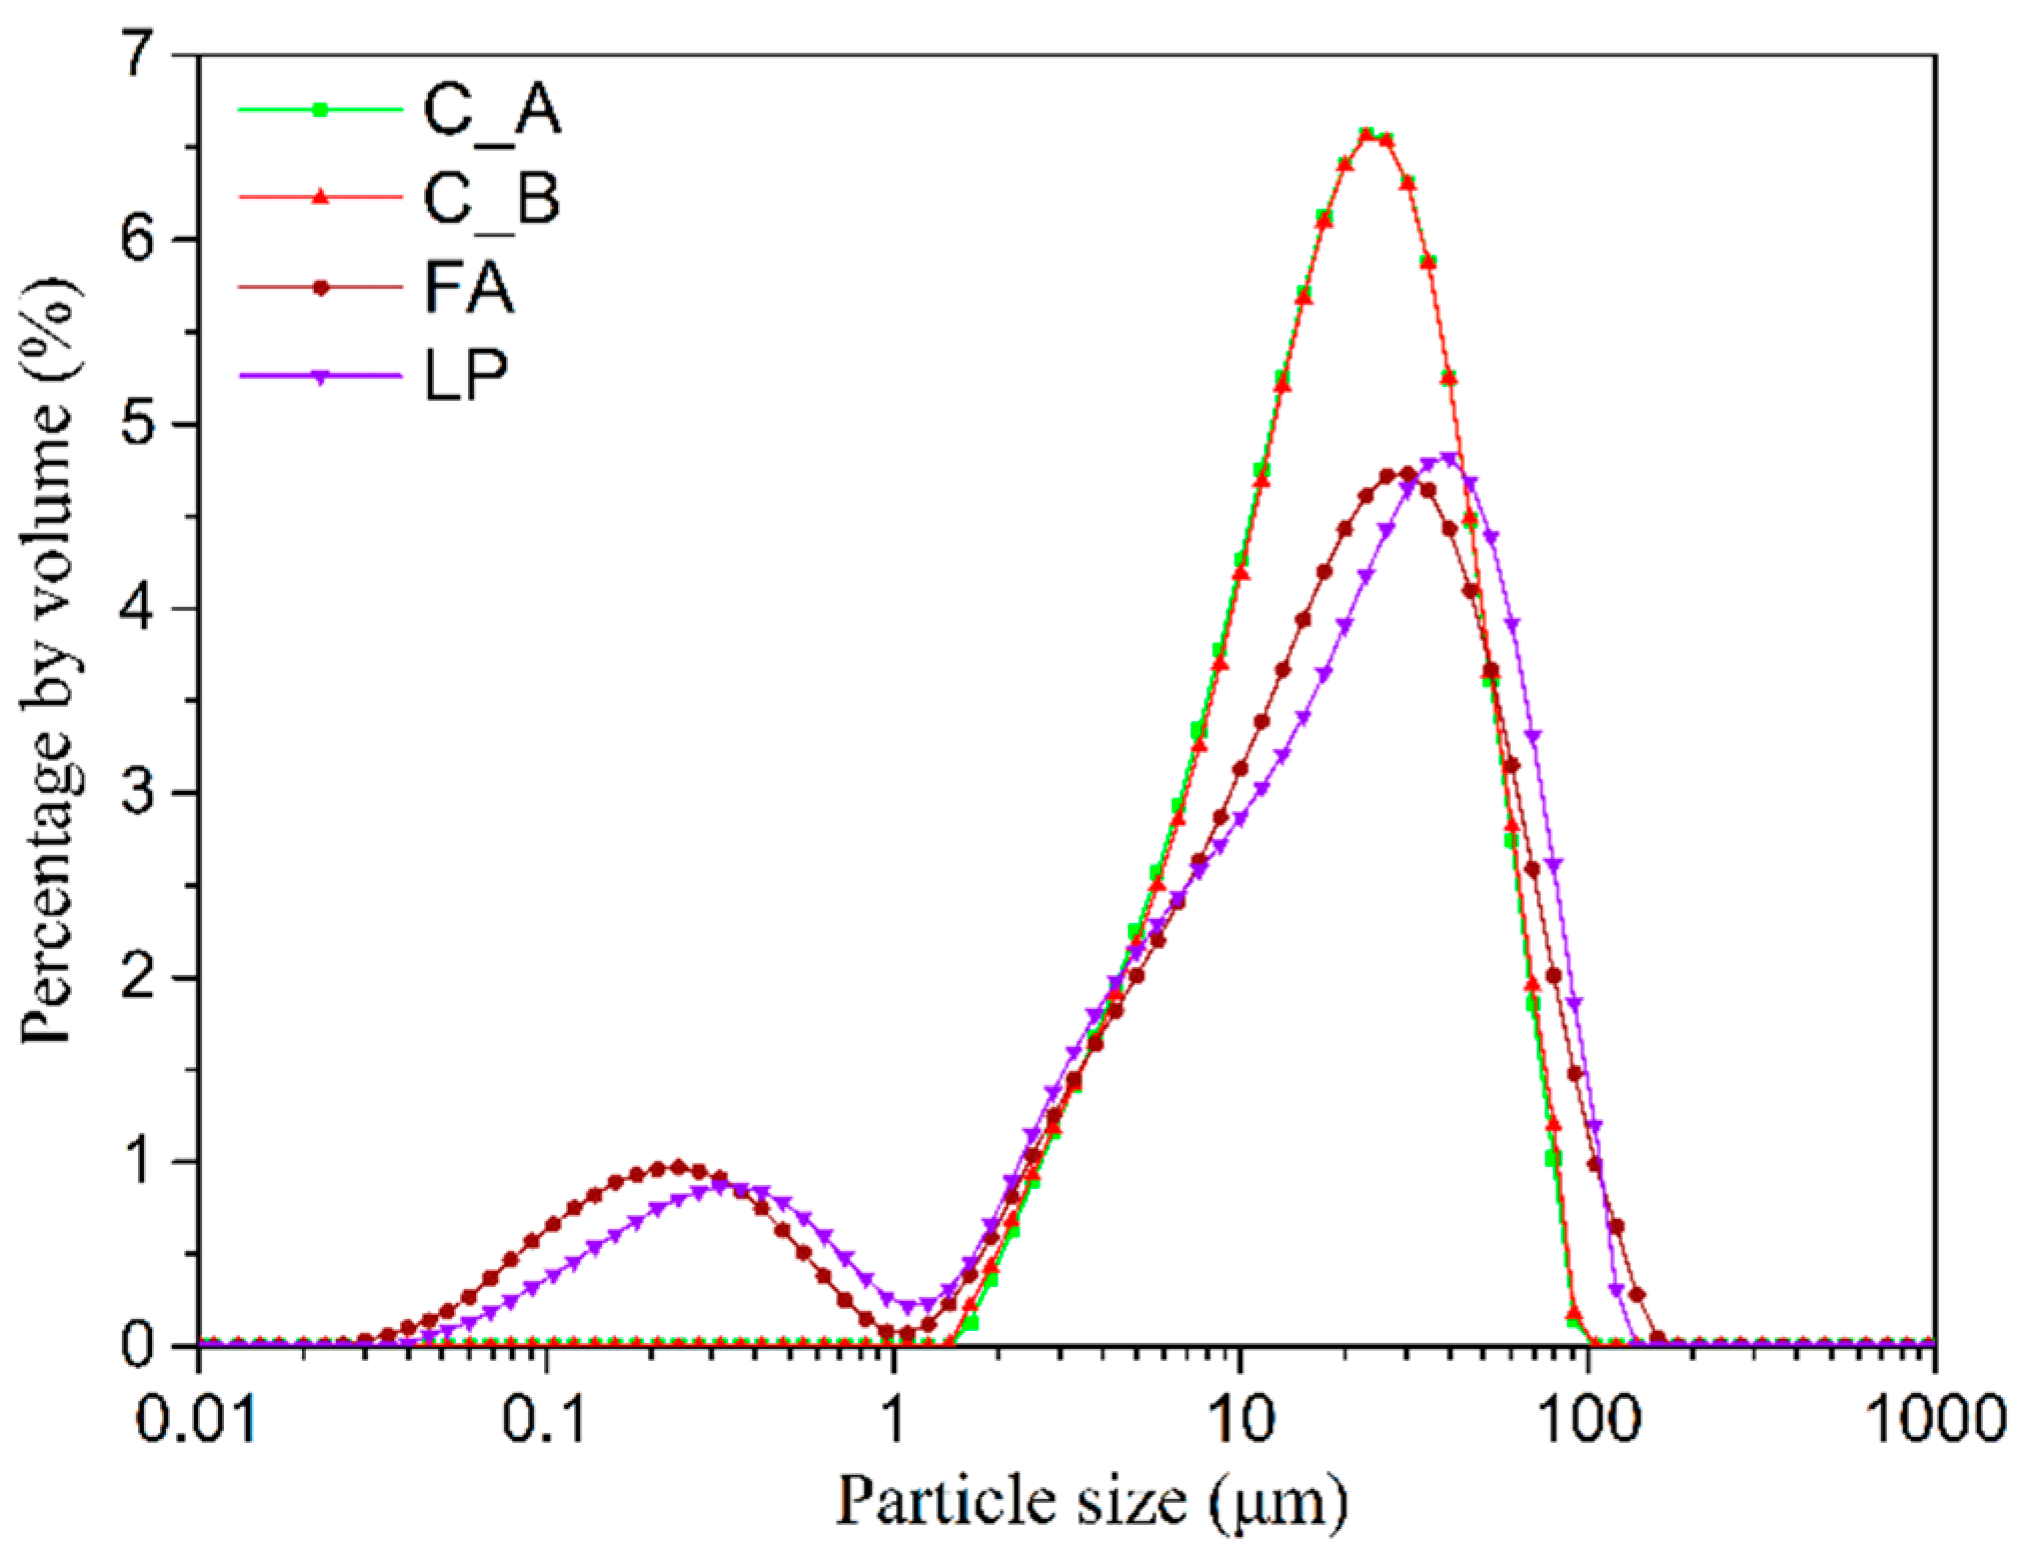
3.2.1. D50 and Span

Additionally, density, particle size, and distribution of particles are critical. Among various methods, laser diffraction methods are nowadays widely used for particle size analysis. When particles were packing and moving, their rheology was concerned with the packing style. To describe the pacing, properties, size, and distribution of the particles were essential.
Many parameters could be obtained through laser diffraction methods, such as D50 and Span. D50, describing the particle size, is the median particle diameter. Specifically, 50% of the volume of the particles is smaller than this size, and the other 50% is larger. Span is a parameter that can describe the distribution width of particles, it can be calculated by Equation (13):
S p a n = D 90 D 10 / D 50
where D90 and D10 represent the diameters that have 90% and 10% by volume particles larger than these sizes, respectively.
The above two parameters can represent the properties of powder particles in a more comprehensive way than the average particle size.

3.2.2. Modification of the Powder Fitting Coefficient n

In Equation (9), the powder fitting coefficient n was obtained as 4.20 in Toutou’s and Roussel’s study [24]. This value is a fitted parameter for cement. When the cement type changes or uses other powders as filler, n may also change, which is neglected in the existing threshold theory. Zhang [19] modified the yield stress threshold with a total fitting parameter method. Different powders had different values of n, and it was a certain value for a type of powder. The fitting coefficients of powder materials are weighted based on their volume fraction; their sum is the total fitting parameter. However, type is the only factor that affects the value of n, ignoring the specific properties of the powder.
Based on the comparison of the paste and SCC rheological test results of Series 1–4, we found that:
  • On the occasion that D50 was similar, the bigger span, τthreshold was calculated to be lower than its real value. The powder fitting coefficient n seemed smaller.
  • On the occasion that the span was similar, the bigger D50, τthreshold was calculated to be lower than its real value. The powder fitting coefficient n seemed smaller.
In the first case, the powder particles with a similar size, when the distribution width increased, it seemed that the mixture needed to overcome greater yield strength to flow. The second case was the same as the first case, when the distribution width was similar, the bigger the particle size was, the more difficult it was for the particles to flow.
According to the test results of Series 1–4, we found the relationship between the powder fitting coefficient and powder size and distribution parameters. Thus, the modified powder fitting coefficient can be expressed as Equation (14):
n p = 0.54 D 50 S p a n / 50 + 1.54 n exp
where np denotes the modified value of n.
The coefficient is relative to the product of the two parameters. To validate the accuracy of the modification, series 5 was carried out as a validation set. Table 2 shows the original and modified values of the powder fitting coefficient n and yield stress threshold. nexp denotes the original empiric value of n. τthreshold,o referred to the thresholds calculated by the Zhang’s method, obtained by Equations (7) and (8). τthreshold,m denoted the thresholds calculated by the modified method, obtained by Equations (9) and (10).

3.2.3. Modification of the Intrinsic Viscosity [η]

In Equation (10), the intrinsic viscosity [η] was obtained as 2.5 according to Banfill’s research [25]. That is an approximation for sphere particles. In the threshold theory, the powder particles are regarded as spheres of equal size. However, the powder particles are not real spheres. The sizes and shapes of the powder particles are diverse. Thus, a single value is deficient for multiplexed powder.
Similar to the powder fitting coefficient n, Zhang [19] proposed a weighed fitting parameter method by the powders’ volume fraction. For a certain type of powder, [η] was the same, which did not take the specific characteristics of powders into consideration
Based on the comparison between the paste and SCC rheological test results of Series 1–4, it can be found that:
  • The smaller D50 was, ηthreshold calculated was lesser than its real value. The intrinsic viscosity [η] seemed bigger.
  • The bigger D50 was, ηthreshold calculated was bigger than its real value. The intrinsic viscosity [η] seemed smaller.
D50 represents the particle size of powder, showing the effects on the intrinsic viscosity [η] and plastic viscosity threshold. Using the existing calculation formula of plastic viscosity, the powder with bigger particle sizes has greater plastic viscosity thresholds. Conversely, the powders with smaller particle sizes possess smaller plastic viscosity thresholds.
The intrinsic viscosity is relative to D50. The fitting relationship between the intrinsic viscosity [η] and D50 can be expressed as Equation (15):
[ η ] P = 4.65 D 50 / 20 3.63 [ η ] exp
where [η]p denotes the modified value of [η].
To prove the accuracy of the modification, series 5 was carried out as a validation set. Table 3 shows calculation values of the original and modified intrinsic viscosity [η] and plastic viscosity threshold. [η]exp denotes the original empiric value of [η]. τthreshold,o referred to the thresholds calculated by the Zhang’s method, obtained by Equations (7) and (8). τthreshold,m denoted the thresholds calculated by the modified method, obtained by Equations (9) and (10).

3.3. Applicability of Modified Multiscale Thresholds and Verification

3.3.1. Verification with Single Powder, Cement

As introduced above, even when the powder type was the same as cement, the previous thresholds presented insufficient. To verify the accuracy of the modified method, five series of tests were carried out. In this section, the SCP zones are obtained by the V-funnel test-based model. The original method uses nexp and [η]exp to calculate the thresholds, while the modified method uses np and [η]p.
Series 1 used single powder, cement. The type of the powder was C_A. The gravel used was G_A with a content of 300 L/m3. The sand used was S_A with a ratio of 45%. Table 4 shows the mix and test results of pastes, inside which τpaste and ηpaste are the calculation values of the rheological parameters obtained by Equations (5) and (6). Table 5 shows the mix and test results of SCCs. Cement, water, gravel, and sand are marked as C, W, G, and S in the tables, respectively.
To compare and verify the accuracy of the original and modified methods, the SCC zone and SCP zones were obtained, as shown in Figure 5. The black dashed line notes the original SCP zone, while the black solid line presents the modified SCP zone. They are regarded as the predicted zone. The red short dashed line notes the SCC zone, which is regarded as the real zone.
In Figure 5, the original SCP zone is to the left of the SCC zone, showing excessive prediction. Its left boundaries are distant from the SCC zone. Thus, the original method has a higher chance of obtaining a lower Vw/Vp, which leads to lower flowability. The modified SCP zone has similar boundaries to the SCC zone, almost the same. It indicates that there is a much higher probability of obtaining SCCs with good workability through the modified SCP zone.

3.3.2. Verification with Binary Powder, Cement Substituted by 20% FA

Series 2 contains binary powder, cement and FA. The substitution rate of FA was 20% by volume, and the cement type was C_A. G_A and S_A were used as aggregates, with a gravel content of 300 L/m3 and a sand ratio of 45%. The mix and test results of the pastes are shown in Table 6. τpaste and ηpaste were calculated with Equations (5) and (6). Table 7 shows the mix and test results of the SCCs.
Based on the test results, the original and modified SCP zones were obtained, as shown in the black dashed and solid lines in Figure 6. The SCC zone is shown as the red short dashed line in Figure 6.
In Figure 6, the original SCP zone is a little wider than the modified one, and their boundaries are similar. Additionally, they both contain the SCC zone, allowing the possibility to obtain predictions with insufficient self-compacting performance. However, the boundaries of the modified SCP zone are slightly closer to the SCC zone, indicating a little more advancement in the prediction accuracy.

3.3.3. Verification with Binary Powder, Cement Substituted by 30% FA

Series 3 contains the same types of powder as series 2, cement and FA. The substitution rate of FA was 30% by volume. The cement, gravel, and sand types were C_A, G_A, and S_A, respectively. The gravel content was 300 L/m3, and the sand ratio was 45%. The detailed mix and test results of pastes and SCCs are shown in Table 8 and Table 9. τpaste and ηpaste in Table 8 were calculated by Equations (5) and (6).
According to the test results, SCP zones obtained by the original and modified methods were proposed, as shown in the black dashed and solid lines in Figure 7. The SCC zone is shown as the red short dashed line in Figure 7.
As Figure 7 indicates, the original SCP zone is located to the right of the SCC zone, while the modified SCP zone is located between the original SCP zone and the SCC zone. The boundaries of the modified SCP zone are near those of the SCC zone. It is found that the original zone possibly leads to a higher Vw/Vp and lower flowability. The modified one is less likely to obtain incorrect mix predictions.

3.3.4. Verification with Binary Powder, Cement Substituted by 20% LP

Series 4 contains binary powders, cement (C_B), and LP. The substitution rate of LP was 20% by volume. The gravel and sand types were G_B and S_B, respectively, with a gravel content of 280 L/m3 and a sand ratio of 38.5%. It should be noted that the provenance of LP was the machine-made sand S_B. The detailed mix and test results of the paste SCC are shown in Table 10 and Table 11. τpaste and ηpaste in Table 10 were calculated by Equations (5) and (6).
The SCP zones and SCC zones were obtained based on the test results, as shown in Figure 8. The black dashed and solid lines represent the original and modified SCP zones, respectively, while the red short dashed line refers to the SCC zone.
In Figure 8, the left boundaries of the original and modified SCP zones are approximately parallel, and both overlap with the left boundary of the SCC zone. Compared with the right boundary of the original SCP zone, the right boundary of the modified SCP zone is closer to the right boundary of the SCC zone. The two SCP zones seem comparable; further analysis of the prediction accuracy is required.

3.3.5. Verification with Ternary Powder, Cement Substituted by 16% FA and 21% LP

Series 5 used ternary powder, cement (C_B), FA, and LP. The substitution rate of LP was 20% by volume. The gravel and sand types were G_B and S_B, respectively, with a gravel content of 280 L/m3 and a sand ratio of 38.5%. The detailed mix and test results of paste SCC are shown in Table 12 and Table 13. τpaste and ηpaste in Table 12 were calculated by Equations (5) and (6).
The SCP zones and SCC zones are shown in Figure 9. The original and modified SCP zones are shown with the black dash and solid lines, respectively, and the SCC zone is shown with the red short dash line.
As shown in Figure 9, the original SCP zone is inside the SCC zone, showing a conservative prediction. As for the modified method, the left boundary of the modified SCP zone overlaps with that of the SCC zone. Through the modified method, the overlapped area between the SCP and SCC zone increases.

3.4. Prediction Accuracy Evaluation

To validate the accuracy of the self-compacting zones accurately, the estimation results were represented by two accuracy parameters, the relative accuracy ε and the accuracy index ε′. The SCC zone and the real zone were marked as Zone A, the real zone. The SCP zone and the predicted zone were marked as Zone B. The overlapping area of the two zones can be evaluated by ε, as shown in Equation (16).
ε = S A B / S A
where SA denotes the area of the SCC zone, SA∩B denotes the intersection area of the SCC and SCP zones.
The relative position of the two zones can be evaluated by ε′. There are two cases for the calculation, as shown in Equations (17) and (18).
when S A B / S B < 1 ,
ε = S A B / S B
when S A B / S B = 1 ,
ε = S A / S B
where SB denotes the area of the SCP zone.
ε is always no more than 1. The closer it is to 1, the more the SCP zone is consistent with the SCC zone. The description of ε′ is multiplex:
  • When ε′ < 1, the partial SCP zone is consistent with the SCC zone, and shows excessive prediction.
  • When ε′ = 1, the predicted zone is the same as the real zone, and the SCP and SCC zones are exactly equal to the SCC zone.
  • When ε′ > 1, the predicted zone is conservative, and the SCC zone contains the SCP zone.
The graphic presentation, formula, and value range of each case are shown in Table 14.
According to the calculation method of predicting accuracy introduced in Section 4.1, the first step was the calculation of the areas of zones and their intersecting parts. For each serial paste or concrete test, the nine mix points set up a region, including three Vw/Vp levels and three SP% levels. Through the bilinear interpolation method, this region was divided into 441 grid units, each measuring 0.01 Vw/Vp by 0.01% SP. Thus, the number of units could denote the area, as shown in Table 15.
For each series of paste or concrete tests, nine mixing points established an area, including three Vw/Vp levels and three SP% levels. The self-compacting zone contained nine mix points, with three Vw/Vp levels and three SP% levels. By the bilinear interpolation method, each self-compacting zone was divided into 441 cells. These cells were all the same size. Thus, the number of cells can represent the zone’s area. The areas of all the zones and their intersections are shown in Table 15.
According to the results, SA∩B/SB of each serial is less than one, showing excessive prediction. Based on the areas calculated, the prediction accuracies were obtained by Equations (16) and (17). Table 16 and Figure 10 show the prediction accuracies of the original and modified methods.
The red lines in Figure 10 represent the accuracies of the modified method. Most of the red lines were above the black lines, representing the original method. In the case of ε, the minimum increased to 0.88 in the modified method, while it was 0.77 in the original method. The value of ε′ calculated with the original method is between 0.54 and 0.98. The modified method improved the minimum to 0.75, which is much higher than before. It should be noticed that ε′ of serial 4 calculated with the modified method was less than when it was calculated with the original method. However, ε of the modified SCP zone still increased, showing more accuracy than the original one.
Moreover, obvious fluctuations could be seen in the original method. That indicated that the original method was more likely to cause a misprediction. The prediction results of the modified method were more stable. The modified method shows more accuracy in guiding the mix design.

4. The Mix Design Method for Multiplexed Powder SCC

4.1. The Definition and Basic Steps

Based on the modified paste thresholds, the performance of SCC can be predicted based on paste tests and material property parameters simply. Thus, the mix design process can be simplified. The flowability of SCC can be forecasted through the mini-SF test of the pastes, thus, the mix design of SCC can be completed without the SCC performance test.
Additionally, the performance prediction, the economic cost, and the compressive strength can also be evaluated. As mentioned above, the SCP zone is a set of SCC mix points with good self-compacting performance. The X-axis is Vw/Vp, while the Y-axis is SP%. The evaluation that can be achieved by the SCP zone has three aspects:
  • In the SCP zone, the mix point with lower Vw/Vp uses more powder and has higher compressive strength, but the economic cost increases.
  • For the mix points with the same Vw/Vp in the SCP zone, the smaller the SP% is, the lower the economic cost.
  • It also should be noted that the mix points near the boundaries have less robustness in prediction than those far from the boundaries.
The SCP zone can help the mix design in many aspects, conducive to the achievement of the mix with satisfying performance, compressive strength, and cost. The evaluation trends are shown in Figure 11.
Thus, the mix design method for multiplexed powder SCC is proposed, the design process is shown in Figure 12.
The basic steps of this method are summarized below:
  • The material properties tests. The required parameters include the densities of all the materials and the size and distribution of the powder particles.
  • The mixes of the tests are preset. Vw/Vp is determined by the compressive strength requirement, while SP%, G%, and S% refer to the empirical dosage and can be adjusted if the flowability is insufficient.
  • The paste mini-SF tests are proposed. There are a total of nine tests, with three levels at SP% and Vw/Vp, respectively. The relevant rheological properties from Equations (5) and (6) are calculated.
  • The threshold calculations are performed with Equations (9) and (10).
  • Through the threshold criteria, the SCP zone is obtained by the bilinear interpolation method.
  • The compressive strength, robustness, and cost analysis can be evaluated by the SCP zone. Thus, the mix proportion of SCC is confirmed.

4.2. Application Cases

Using series 3 as an application example for the mix design method, the details of the test results are shown in Section 3.3.3. The cost can be accounted for by referring to the local market price. Cement, FA, sand, gravel, and SP are 396, 380, 110, 97, and 3080 CNY per ton. There are two cases of the application, the performance-based design and the strength-based design. In this section, the mix proportion is designed by the proposed method using the SCP zone and rechecked by the SCC zone.

4.2.1. Performance-Based Mix Design

For the mix design targeting performance, the SCP zone indicates all the mix points satisfying the performance requirement. The cost and robustness can be analyzed first, then the compressive strength can be evaluated by Vw/Vp.
As for series 3, the SCP zone is obtained based on the material and paste tests, as shown in Figure 13. It suggests that Mix A costs the least and Mix B costs the most.
If cost is the only factor to determine a mix design, then apparently Mix A is the best choice. However, considering the robustness, the mix point at the zone boundary shows a little insecurity. Thus, Mix C with a little less Vw/Vp and more SP% seems to be a better choice than Mix A. Finally, the compressive strength of this mix proportion can be evaluated by Vw/Vp, which is obtained as approximately C40 according to [37]. The mix proportions and their costs are shown in Table 17.
The cost of Mix C is 382.28 CNY/m3, a reduction of 3.88% from Mix B, and it is also steadier than Mix A. To recheck the SCC zone, Mix C shows an appropriate performance of SCC.

4.2.2. Strength-Based Mix Design

For a strength-based design, Vw/Vp can be confirmed first. Then, the cost and robustness analyses can be conducted through the SCP zone. Finally, an optimized mix proportion is obtained.
Here is a case of a mix design of C45. The SCP zone can be obtained through the material and paste test results. Vw/Vp is confirmed based on the compressive strength requirement first, which was determined to be 1.03 according to [37]. The vertical blue dashed line intersecting with the SCP zone consists of all the mix proportions satisfying both the compressive strength and flowability requirements, as shown in Figure 14.
Then, the cost and robustness analyses are carried out. Mix D and E are the limit mix proportions, as the SCP zone indicates. Mix D costs the most, while Mix E costs the least. Considering the robustness, Mix F, with the same Vw/Vp and more SP% than Mix E, is supposed to be the better choice. The mix proportions and prices are shown in Table 18.
The cost of Mix F is 391.25 CNY/m3, a reduction of 0.63% compared to Mix D. It is also steadier than Mix E. Rechecked by the SCC zone, Mix F is also in the SCC zone and qualified on the SCC test.

5. Conclusions

This paper studies a mix design method for SCC with multiplexed powders from a multiscale rheological view. The powder parameters in the multiscale threshold theory were modified with test results, using D50 and Span to describe the properties of specific powders. The main conclusions are as follows:
  • The existing threshold theory lacks consideration of the characteristics of the specific powder. It was found that D50 and Span can describe the properties of the powder. The powder parameters in the threshold formula, the powder fitting coefficient n, and the intrinsic viscosity [η], were modified by the impacts that the powder properties caused.
  • There were 90 groups of self-compacting performance tests in total, including 45 groups of pastes and 45 groups of SCCs. Based on the test results, self-compacting zones were obtained. Through the comparison of the predicted zone, the SCP zone, the real zone, and the SCC zone, the prediction accuracies were evaluated. It was confirmed that this improved method is applicable to the multipowder SCC with cement, FA, and LP.
  • The modified method increased the prediction accuracy of the threshold theory. According to the increment of ε, up to 20.78%, the overlapping area of the modified SCP zone and SCC zone becomes larger. In the case of ε′, its increment reaches 62.96%, and the relative position of the predicted and real zones increases noticeably through the modified method. Overall, the holistic prediction accuracy of the modified method increases.
  • A mix design method for SCC with multiplexed powder was proposed, considering the flowability, economic cost, and strength comprehensively. Through this method, the performance of SCC can be predicted based on the test results of the pastes and the properties of the materials. Thus, the mix design of SCC can be conducted without SCC tests, which is much easier than previous methods.
However, this research is limited to three types of powders. Further research should be proposed to prove or expand the applicability of this theory to more kinds of powders. More powder materials can be considered, such as silica fume and slag, targeting to set up a general mix design method that can handle various materials.

Author Contributions

Conceptualization, M.L., A.J. and X.A.; methodology, M.L. and A.J.; validation, M.L., A.J. and H.B.; formal analysis, H.B.; investigation, A.J. and H.B.; resources, X.A. and K.S.; data curation, M.L., J.Z. and X.A.; writing—original draft preparation, M.L.; writing—review and editing, A.J. and X.A.; visualization, M.L.; supervision, X.A.; project administration, J.Z. and K.S.; funding acquisition, X.A., J.Z. and K.S. All authors have read and agreed to the published version of the manuscript.

Funding

This research was funded by the National Natural Science Foundation of China (no. 52109153), the Jiangsu Planned Projects for Postdoctoral Research Funds (2021K055A), and the Foundation of China Huaneng Research Project (grant no. HNKJ19-H13).

Data Availability Statement

The data presented in this study are available on request from the corresponding author.

Conflicts of Interest

The authors declare no conflict of interest.

References

  1. Okamura, H.; Ouchi, M. Self-compacting concrete. J. Adv. Concr. Technol. 2003, 1, 5–15. [Google Scholar] [CrossRef]
  2. An, X.; Wu, Q.; Jin, F.; Huang, M.; Zhou, H.; Chen, C.; Liu, C. Rock-filled concrete, the new norm of SCC in hydraulic engineering in China. Cem. Concr. Compos. 2014, 54, 89–99. [Google Scholar] [CrossRef]
  3. An, X.; Huang, M.; Ouchi, M.; Jin, F. Technical Manual of Self-Compacting Concrete; China Water & Power Press: Beijing, China, 2008. [Google Scholar]
  4. Shi, C.; Wu, Z.; Lv, K.; Wu, L. A review on mixture design methods for self-compacting concrete. Constr. Build. Mater. 2015, 84, 387–398. [Google Scholar] [CrossRef]
  5. Okamura, H.; Ozawa, K. Mix design for self-compacting concrete. Concr. Lib. Jpn. Soc. Civ. Eng. 1995, 25, 107–120. [Google Scholar]
  6. Su, N.; Hsu, K.; Chai, H. A simple mix design method for self-compacting concrete. Cem. Concr. Res. 2001, 31, 1799–1807. [Google Scholar] [CrossRef]
  7. Su, N.; Miao, B. A new method for the mix design of medium strength flowing concrete with low cement content. Cem. Concr. Compos. 2003, 25, 215–222. [Google Scholar] [CrossRef]
  8. Domone, P. Mortar tests for material selection and mix design of SCC. Concr. Int. 2006, 28, 39–45. [Google Scholar]
  9. Bouziani, T. Assessment of fresh properties and compressive strength of self-compacting concrete made with different sand types by mixture design modelling approach. Constr. Build. Mater. 2013, 49, 308–314. [Google Scholar] [CrossRef]
  10. Saak, A.; Jennings, H.; Shah, S. New methodology for designing self-compacting concrete. ACI Mater. J. 2001, 98, 429–439. [Google Scholar]
  11. Saak, A.; Jennings, H.; Shah, S. A generalized approach for the determination of yield stress by slump and slump flow. Cem. Concr. Res. 2004, 34, 363–371. [Google Scholar] [CrossRef]
  12. Bui, V.; Akkaya, Y.; Shah, S. Rheological model for self-consolidating concrete. ACI Mater. J. 2002, 99, 549–559. [Google Scholar]
  13. Wu, Q.; An, X. Development of a mix design method for SCC based on the rheological characteristics of paste. Constr. Build. Mater. 2014, 53, 642–651. [Google Scholar] [CrossRef]
  14. Nie, D.; An, X. Optimization of SCC mix at paste level by using numerical method based on a paste rheological threshold theory. Constr. Build. Mater. 2016, 102, 428–434. [Google Scholar] [CrossRef]
  15. Zhang, J.; An, X.; Yu, Y.; Nie, D. Effects of coarse aggregate content on the paste rheological thresholds of fresh self-compacting concrete. Constr. Build. Mater. 2019, 208, 564–576. [Google Scholar] [CrossRef]
  16. Zhang, J.; An, X.; Nie, D. Effect of fine aggregate characteristics on the thresholds of self-compacting paste rheological properties. Constr. Build. Mater. 2016, 116, 355–365. [Google Scholar] [CrossRef]
  17. Zhang, J.; Xu, P.; Gao, X. Multi-scale particles optimization for some rheological properties of Eco-SCC: Modelling and experimental study. Constr. Build. Mater. 2021, 308, 125151. [Google Scholar] [CrossRef]
  18. Yang, S.; Zhang, J.; An, X.; Qi, B.; Li, W.; Shen, D.; Li, P.; Lv, M. The effect of sand type on the rheological properties of self-compacting mortar. Buildings 2021, 11, 441. [Google Scholar] [CrossRef]
  19. Yang, S.; Zhang, J.; An, X.; Qi, B.; Shen, D.; Lv, M. Effects of fly ash and limestone powder on the paste rheological thresholds of self-compacting concrete. Constr. Build. Mater. 2021, 281, 122560. [Google Scholar] [CrossRef]
  20. Zhang, J.; Lv, M.; An, X.; Shen, D.; He, X.; Nie, D. Improved powder equivalence model for the mix design of self-compacting concrete with fly ash and limestone powder. Adv. Mater. Sci. Eng. 2021, 2021, 4966062. [Google Scholar] [CrossRef]
  21. Li, P.; Zhang, T.; An, X.; Zhang, J. An enhanced mix design method of self-compacting concrete with fly ash content based on paste rheological threshold theory and material packing characteristics. Constr. Build. Mater. 2020, 234, 117380. [Google Scholar] [CrossRef]
  22. Li, P.; Ran, J.; Nie, D.; Zhang, W. Improvement of mix design method based on paste rheological threshold theory for self-compacting concrete using different mineral additions in ternary blends of powders. Constr. Build. Mater. 2021, 276, 122194. [Google Scholar] [CrossRef]
  23. Li, P.; Ran, J.; An, X.; Bai, H.; Nie, D.; Zhang, J.; Shao, K. An enhanced mix-design method for self-compacting concrete based on paste rheological threshold theory and equivalent mortar film thickness theories. Constr. Build. Mater. 2022, 347, 128573. [Google Scholar] [CrossRef]
  24. Toutou, Z.; Roussel, N. Multi scale experimental study of concrete rheology: From water scale to gravel scale. Mater. Struct. 2006, 39, 189–199. [Google Scholar] [CrossRef]
  25. Banfill, P. The rheology of fresh cement and concrete-a review. In Proceedings of the 11th International Cement Chemistry Congress, Durban, South Africa, 11–16 May 2003. [Google Scholar]
  26. Türkel, S.; Kandemir, A. Fresh and hardened properties of SCC made with different aggregate and mineral admixtures. J. Mater Civ. Eng. 2010, 22, 1025–1032. [Google Scholar] [CrossRef]
  27. Sahmaran, M.; Yaman, O.; Tokyay, M. Development of high-volume low-lime and high-lime fly ash incorporated self-consolidating concrete. Cem. Concr. Compos. 2007, 31, 97–106. [Google Scholar] [CrossRef]
  28. Promsawat, P.; Chatveera, B.; Sua-iam, G.; Makul, N. Properties of self-compacting concrete prepared with ternary Portland cement-high volume fly ash-calcium carbonate blends. Case Stud. Constr. Mater. 2020, 13, e00426. [Google Scholar] [CrossRef]
  29. Gritsada, S.; Prakasit, S.; Natt, M. Novel ternary blends of Type 1 Portland cement, residual rice husk ash, and limestone powder to improve the properties of self-compacting concrete. Constr. Build. Mater. 2016, 125, 1028–1034. [Google Scholar] [CrossRef]
  30. Zhu, W.; Gibbs, J. Use of different limestone and chalk powders in self-compacting concrete. Cem. Con. Res. 2005, 35, 1457–1462. [Google Scholar] [CrossRef]
  31. Miyake, J.; Matsushita, H. Evaluation method for consistencies of mortars with various mixture proportions. J. Adv. Concr. Technol. 2007, 5, 87–97. [Google Scholar] [CrossRef]
  32. Roussel, N.; Stefani, C.; Leroy, R. From mini-cone test to Abrams cone test: Measurement of cement-based materials yield stress using slump tests. Cem. Concr. Res. 2005, 35, 817–822. [Google Scholar] [CrossRef]
  33. Chidiac, S.; Maadani, O.; Razaqpur, A.; Mailvaganam, N. Controlling the quality of fresh concrete-a new approach. Mag. Concr. Res. 2000, 52, 353–363. [Google Scholar] [CrossRef] [Green Version]
  34. GB/T 208-2014; Test Method for Determining Cement Density. Standards Press of China: Beijing, China, 2006.
  35. JGJ 52-2006; Standard for Technical Requirements and Test Method of Sand and Crushed Stone (or Gravel) for Ordinary Concrete. China Architecture & Building Press: Beijing, China, 2006.
  36. CECS 203-2006; Technical Specifications for Self-Compacting Concrete Application. China Plan Press: Beijing, China, 2006.
  37. JGJ 55-2011; Specification for Mix Proportion Design of Ordinary Concrete. China Architecture & Building Press: Beijing, China, 2011.
Figure 1. Schematic diagram of the mortar film thickness.
Buildings 12 01663 g001
Figure 2. Schematic diagram of the multiscale rheological threshold theory.
Buildings 12 01663 g002
Figure 3. Particle size distribution curves of powders.
Buildings 12 01663 g003
Figure 4. Particle size distribution curves of aggregates.
Buildings 12 01663 g004
Figure 5. Self-compacting zones of series 1, cement.
Buildings 12 01663 g005
Figure 6. Self-compacting zones of series 2, cement substituted by 20% FA.
Buildings 12 01663 g006
Figure 7. Self-compacting zones of series 3, cement substituted by 30% FA.
Buildings 12 01663 g007
Figure 8. Self-compacting zones of series 4, cement substituted by 20% LP.
Buildings 12 01663 g008
Figure 9. Self-compacting zones of series 5, cement substituted by 16% FA and 21% LP.
Buildings 12 01663 g009
Figure 10. The prediction accuracies of the original and modified methods.
Buildings 12 01663 g010
Figure 11. The evaluation trends in the SCP zone.
Buildings 12 01663 g011
Figure 12. The mix design method for multiplexed powder SCC.
Buildings 12 01663 g012
Figure 13. The performance-based mix design of series 3.
Buildings 12 01663 g013
Figure 14. The strength-based mix design of series 3.
Buildings 12 01663 g014
Table 1. Test design.
Serial No.C%FA%LP%Cement TypeGravel TypeSand TypeG%S%
1100%--C_AG_AS_A30%45.0%
280%20%-
370%30%-
480%-20%C_BG_BS_B27%38.5%
563%16%21%
Table 2. The modified powder fitting coefficient n and yield stress threshold.
Serial No.D50 (μm)Span (μm)nexpτthreshold,o (Pa)npτthreshold,m (Pa)
120.302.264.200.834.390.76
219.802.514.200.824.210.82
319.562.644.200.824.130.85
420.072.534.200.894.160.90
519.682.734.200.904.040.97
Table 3. The modified intrinsic viscosity [η] and plastic viscosity threshold.
Serial No.D50 (μm)[η]expηthreshold,o (Pa·s)[η]pηthreshold,m (Pa·s)
120.302.510.762.7213.63
219.802.510.902.449.27
319.562.511.822.2911.35
420.072.510.762.5911.06
519.682.510.802.3611.90
Table 4. Mix proportions and test results of paste in series 1.
Vw/VpSP%Mix Proportion (kg/m3)SFpaste
(mm)
T200
(s)
τpaste
(Pa)
ηpaste
(Pa·s)
CWSP
1.000.801536.2488.912.292374.301.8953.81
1.000.901535.7487.613.822553.871.2948.41
1.001.001535.3486.215.352593.251.2040.67
1.100.801463.2513.211.712612.151.1226.18
1.100.901462.8511.913.172761.890.8523.07
1.101.001462.4510.614.622851.700.7320.80
1.200.801396.9535.311.182841.030.7112.24
1.200.901396.5534.012.573091.020.4612.01
1.201.001396.1532.813.963130.850.4310.13
Table 5. Mix proportions and test results of SCC in series 1.
Vw/VpSP%Mix Proportion (kg/m3)SF
(mm)
VF
(s)
CSGWSP
1.000.80576.0808810183.34.612374.30
1.000.90576.0808810182.95.182553.87
1.001.00576.0808810182.45.762593.25
1.100.80548.5808810192.44.392612.15
1.100.90548.5808810192.04.942761.89
1.101.00548.5808810191.55.492851.70
1.200.80523.6808810200.74.192841.03
1.200.90523.6808810200.24.713091.02
1.201.00523.6808810199.85.243130.85
Table 6. Mix proportions and test results of paste in series 2.
Vw/VpSP%Mix Proportion (kg/m3)SFpaste
(mm)
T200
(s)
τpaste
(Pa)
ηpaste
(Pa·s)
CFAWSP
1.000.801229.1249.4489.411.832582.471.1830.03
1.000.901228.7249.3488.013.302852.380.7228.89
1.001.001228.4249.3486.714.783151.670.4320.34
1.100.801170.7237.6513.611.272842.080.7224.69
1.100.901170.4237.5512.412.672991.530.5518.18
1.101.001170.0237.4511.114.073301.210.3314.32
1.200.801117.6226.8535.710.763251.000.3511.64
1.200.901117.3226.7534.512.103500.500.235.76
1.201.001117.0226.7533.213.443630.470.195.10
Table 7. Mix proportions and test results of SCC in series 2.
Vw/VpSP%Mix Proportion (kg/m3)SF
(mm)
VF
(s)
CFASGWSP
1.000.80460.895.4808810183.44.455558.00
1.000.90460.895.4808810183.05.005907.86
1.001.00460.895.4808810182.65.566109.06
1.100.80438.890.8808810192.54.245805.51
1.100.90438.890.8808810192.14.776635.20
1.101.00438.890.8808810191.75.306705.00
1.200.80418.986.7808810200.84.046655.00
1.200.90418.986.7808810200.44.556704.70
1.201.00418.986.7808810200.05.066854.60
Table 8. Mix proportions and test results of paste in series 3.
Vw/VpSP%Mix Proportion (kg/m3)SFpaste
(mm)
T200
(s)
τpaste
(Pa)
ηpaste
(Pa·s)
CFAWSP
1.000.801075.5374.1489.611.602692.440.9529.26
1.000.901075.2374.0488.313.042772.520.8130.13
1.001.001074.9373.9487.014.492921.790.6221.48
1.100.801024.4356.4513.811.052831.530.7117.91
1.100.901024.1356.3512.512.423031.310.5115.36
1.101.001023.8356.3511.313.803231.090.3612.77
1.200.80977.9340.3535.910.543140.360.414.09
1.200.90977.7340.1534.711.863270.370.333.85
1.201.00977.4340.0533.513.173380.340.283.93
Table 9. Mix proportions and test results of SCC in series 3.
Vw/VpSP%Mix Proportion (kg/m3)SF
(mm)
VF
(s)
CFASGWSP
1.000.80403.2140.3808810183.34.355607.01
1.000.90403.2140.3808810183.14.896406.30
1.001.00403.2140.3808810182.75.437005.35
1.100.80384.0133.6808810192.64.147005.20
1.100.90384.0133.6808810192.24.667155.10
1.101.00384.0133.6808810191.85.187184.90
1.200.80366.5127.5808810200.83.957004.22
1.200.90366.5127.5808810200.44.457104.63
1.201.00366.5127.5808810200.14.947304.46
Table 10. Mix proportions and test results of paste in series 4.
Vw/VpSP%Mix Proportion (kg/m3)SFpaste
(mm)
T200
(s)
τpaste
(Pa)
ηpaste
(Pa·s)
CLPWSP
0.850.411316.5312.1450.66.682054.243.9654.24
0.850.491316.1312.0449.47.982693.101.0139.68
0.850.571315.8311.9448.39.282832.900.7837.14
0.920.411268.3300.7470.76.432602.881.1836.16
0.920.491267.9300.6469.67.692742.150.9027.01
0.920.571267.6300.5468.48.943051.220.5215.33
0.990.411223.6290.0489.46.212752.060.8725.42
0.990.491223.3289.9488.37.412871.740.7021.48
0.990.571222.9289.8487.28.623100.880.4710.87
Table 11. Mix proportions and test results of SCC in series 4.
Vw/VpSP%Mix Proportion (kg/m3)SF
(mm)
VF
(s)
CLPSGWSP
0.850.41579.0131.9687776199.42.8945538.12
0.850.49579.0131.9687776198.93.4761022.43
0.850.57579.0131.9687776198.44.0567016.69
0.920.40552.6131.9687776207.82.7655021.40
0.920.48552.6131.9687776207.43.317009.75
0.910.57552.6131.9687776206.93.8770010.46
0.990.40528.6131.9687776215.52.6465015.76
0.980.48528.6131.9687776215.13.177008.12
0.980.57528.6131.9687776214.73.7073045.50
Table 12. Mix proportions and test results of paste in series 5.
Vw/VpSP%Mix Proportion (kg/m3)SFpaste
(mm)
T200
(s)
τpaste
(Pa)
ηpaste
(Pa·s)
CFALPWSP
0.790.41449.192.4121.2175.62.702153.723.0446.37
0.780.49449.192.4121.2175.23.252472.841.5135.42
0.780.57449.192.4121.2174.73.792781.750.8321.84
0.850.40427.788.0121.2184.22.562482.341.4628.64
0.850.48427.788.0121.2183.83.082851.710.7320.94
0.850.56427.788.0121.2183.33.583071.240.5015.19
0.920.40408.384.0121.2192.02.442721.960.9123.59
0.920.48408.384.0121.2191.62.932901.340.6516.14
0.920.56408.384.0121.2191.23.423131.080.4513.01
Table 13. Mix proportions and test results of SCC in series 5.
Vw/VpSP%Mix Proportion (kg/m3)SF
(mm)
VF
(s)
CFALPSGWSP
0.780.41486.396.7131.9687776190.22.9146545.25
0.780.49486.396.7131.9687776189.73.4955028.78
0.780.57486.396.7131.9687776189.24.0863010.22
0.850.40463.292.1131.9687776199.52.7852529.12
0.850.48463.292.1131.9687776199.03.336308.27
0.850.57463.292.1131.9687776198.63.896955.57
0.920.40442.187.9131.9687776207.92.6560511.45
0.920.48442.187.9131.9687776207.53.186604.79
0.920.56442.187.9131.9687776207.03.717253.82
Table 14. Calculation method of the relative accuracy ε and the accuracy index ε′.
No.Graphic PresentationεSA∩B/SBSA/SBε
(1)Buildings 12 01663 i001≤1<1uncertain<1
(2)Buildings 12 01663 i002<1<1
(3)Buildings 12 01663 i003=1=1=1
(4)Buildings 12 01663 i004=1>1>1
Table 15. Areas of SCP zone, SCC zone, and their intersected parts.
Serial No.MethodSASBSA∩BSA∩B/SB
1Original method111112980.88
Modified method111181970.54
2Original method2342982240.75
Modified method2343082250.73
3Original method2332452230.91
Modified method2332562100.82
4Original method2322182080.95
Modified method2321991960.98
5Original method2702592530.98
Modified method2702202090.95
Table 16. The prediction accuracies of the original and modified methods.
Original MethodModified MethodΔOriginal MethodModified MethodΔ
0.870.881.15%0.540.8862.96%
0.960.960.00%0.730.752.74%
0.900.966.67%0.820.9110.98%
0.840.905.95%0.980.95−3.06%
0.770.9420.78%0.950.983.16%
Table 17. The mix proportions and costs of different mix points in performance-based mix design.
Mix No. Mix Proportion (kg/m3) Cost
(CNY/m3)
CFASGWSP
Mix A378.6131.7808810195.14.08379.96
Mix B403.2140.3808810182.75.43397.12
Mix C382.2132.9808810193.44.22382.28
Table 18. The mix proportions and costs of different mix points in strength-based mix design.
Mix No.Mix Proportion (kg/m3)Cost
(CNY/m3)
CFASGWSP
Mix A378.6131.7808810195.14.08379.96
Mix B403.2140.3808810182.75.43397.12
Mix C382.2132.9808810193.44.22382.28
Publisher’s Note: MDPI stays neutral with regard to jurisdictional claims in published maps and institutional affiliations.

