
Experimental Study on Influence of Initial Relative Dry Density on K0 of Coarse-Grained Soil

1
College of Civil Engineering and Architecture, Guangxi University, Nanning 530004, China
2
Key Laboratory of Ministry of Education for Geomechanics and Embankment Engineering, Hohai University, Nanjing 210098, China
3
Key Laboratory of Failure Mechanism and Safety Control Techniques of Earth-Rockfill Dam, Ministry of Water Resources, Nanjing Hydraulic Research Institute, Nanjing 210029, China
*
Author to whom correspondence should be addressed.
Buildings 2023, 13(4), 1059; https://0-doi-org.brum.beds.ac.uk/10.3390/buildings13041059
Submission received: 9 March 2023
/
Revised: 4 April 2023
/
Accepted: 12 April 2023
/
Published: 17 April 2023
(This article belongs to the Collection Innovation of Materials and Technologies in Civil Construction)
Abstract
:The coefficient of earth pressure at rest, K0, is a significant mechanical parameter, and the investigation of the K0 of coarse-grained soil has important theoretical significance and applicational value in geotechnical engineering. However, there are few studies on the influence of the initial dry density (ρd) on the K0 of coarse-grained soil due to the limitations of the related test instruments or methods. A series of K0 tests for two types of coarse-grained soils (rockfill soil and sandy-gravel soil) were conducted based on a newly developed large-scale apparatus to reveal the relationship between the K0 and ρd of coarse-grained soil. The test results showed that the K0 of coarse-grained soil decreases with an increase in vertical stress, and this trend tends to be gentle with respect to the increase in vertical stress. The results also implied that there was a negative linear relationship between the K0 of coarse-grained soil and ρd. Furthermore, a comparative analysis between rockfill soil and sandy-gravel soil indicated that the relative equation proposed by the authors was appropriate for any type of coarse-grained soil with any ρd. Moreover, an empirical equation that can accurately describe the effective relationship of σv and ρd with the K0 for coarse-grained soil was proposed, and the accuracy of the empirical equations were verified by the K0 test results concerning sand-gravel soil. Finally, based on the published research findings, the empirical equations’ applicability to any coarse-grained soil was verified.
1. Introduction
The coefficient of earth pressure at rest K0 is a significant mechanical parameter of soil and is defined as the ratio of the effective horizontal stress σ′h to the effective vertical stress σ′v in the soil under conditions of no lateral strain [1]. The study of the K0 has important theoretical significance and applicational value for practical geotechnical engineering projects, e.g., those related to slopes [2,3], foundation pits [4,5,6,7], and retaining walls [8,9,10,11]. However, this measure is not accurate enough for engineering purposes, especially with respect to coarse-grained soils, which are mainly defined as soil and rock mixtures with a particle size of 0.075 mm to 60 mm and a particle content of more than 50% [12]. In fact, using the existing test instruments, it is difficult to accurately measure the K0 of coarse-grained soil due to its large particle size, and there are few research achievements in this regard [4]. Therefore, few studies on the K0 of coarse-grained soil have been reported.
Unfortunately, it is necessary to accurately obtain the K0 of coarse-grained soil in many geotechnical engineering applications. For example, coarse-grained soil is often used as a subgrade filling material in heavy haul railways, and its K0 value plays a prominent role in predicting the deformation of roadbeds and the earth pressure of a structure. The investigation of the K0 of coarse-grained soil has important theoretical significance and applicational value in practical geotechnical engineering.
According to the research of Li et al. [13], the initial dry density ρd of soil has a significant influence on the effective internal friction angle (φ′) of coarse-grained soil. With the increasing ρd, the φ′ of coarse-grained soil increased linearly. Through testing, Gao et al. [14] found that remolded loess has a linear positive correlation with φ′ and proposed an empirical formula for it. Li et al. [15] investigated the effect of ρd on the shear strength of coal gangue through experiments and found that the φ′ of coal gangue also increased with ρd.
Previous studies have highlighted the fact that the φ′ of soil increases linearly with an increase in ρd. Many scholars have focused on the relationship between the φ′ and K0 [16,17,18], and it has been determined that there is a negative correlation between soil φ′ and K0. Therefore, with an increase in ρd, the K0 of soil may decrease. However, some researchers have reported that the K0 of sand and clay decreased with an increase in ρd [19,20,21]. Currently, the majority of studies about the relationship between ρd and K0 have focused on the soil type of sand or clay [22], but still provided ambiguous results about the relationship between the ρd and K0 for coarse-grained soil.
According to the research of Zhu et al. [23], stress state has a significant effect on the K0 of coarse-grained soil. Moreover, the formula modelling the relationship between the K0 of coarse-grained soil and its stress state was developed based on experimental results (refer to Equation (1)). However, Equation (1) was obtained on the basis of the test data of loose samples, thus raising the question of whether the equation is applicable for compacted coarse-grained soil. Additionally, the influence mechanism of stress state on the K0 of coarse-grained soil also needs to be explored further.
In the equation above, pa is standard atmospheric pressure; K0max and K0min are material parameters, i.e., the K0 values corresponding to the situation when the σ′v is 0 and tends to ∞, respectively; and σ′c is the pre-consolidation pressure.
In addition, research [24,25] has shown that different soil types lead to the alteration of K0, even for different clays [26]. Many scholars have conducted a number of studies on the particle size of coarse-grained soils. Marachi used the rejection method to reduce the maximum particle size of all three coarse grains to 151, 51, and 12 mm, and ensured that all the specimens had the same initial dry density [27]. Ahad used the rejection method and a similar grading method to reduce the size of coarse grains and carried out large triaxial tests on the reduced-size specimens. However, most scholars have studied the shear expansion of particle size, the angle of internal friction, and shear expansion, while focusing to a lesser degree on analyzing the static pressure coefficient to determine the scaling effect [28]. Therefore, further studies on the influence of soil type on the K0 of coarse-grained soil are particularly significant.
In this paper, to reveal the relationship between K0 and ρd for coarse-grained soil, a series of K0 tests for two types of soil (rockfill and sandy gravel) were conducted using a newly developed large-scale apparatus. Based on the experimental results of regarding gravel, a formula for the relationship between K0 and Dr0 and vertical stress σc was developed and then validated via the experimental results of the rockfill. Moreover, the influence of coarse-grained soil type was studied by comparing the experimental data of rockfill and sandy-gravel soil with the same initial conditions.
2. K0 Experiment for Coarse-Grained Soil
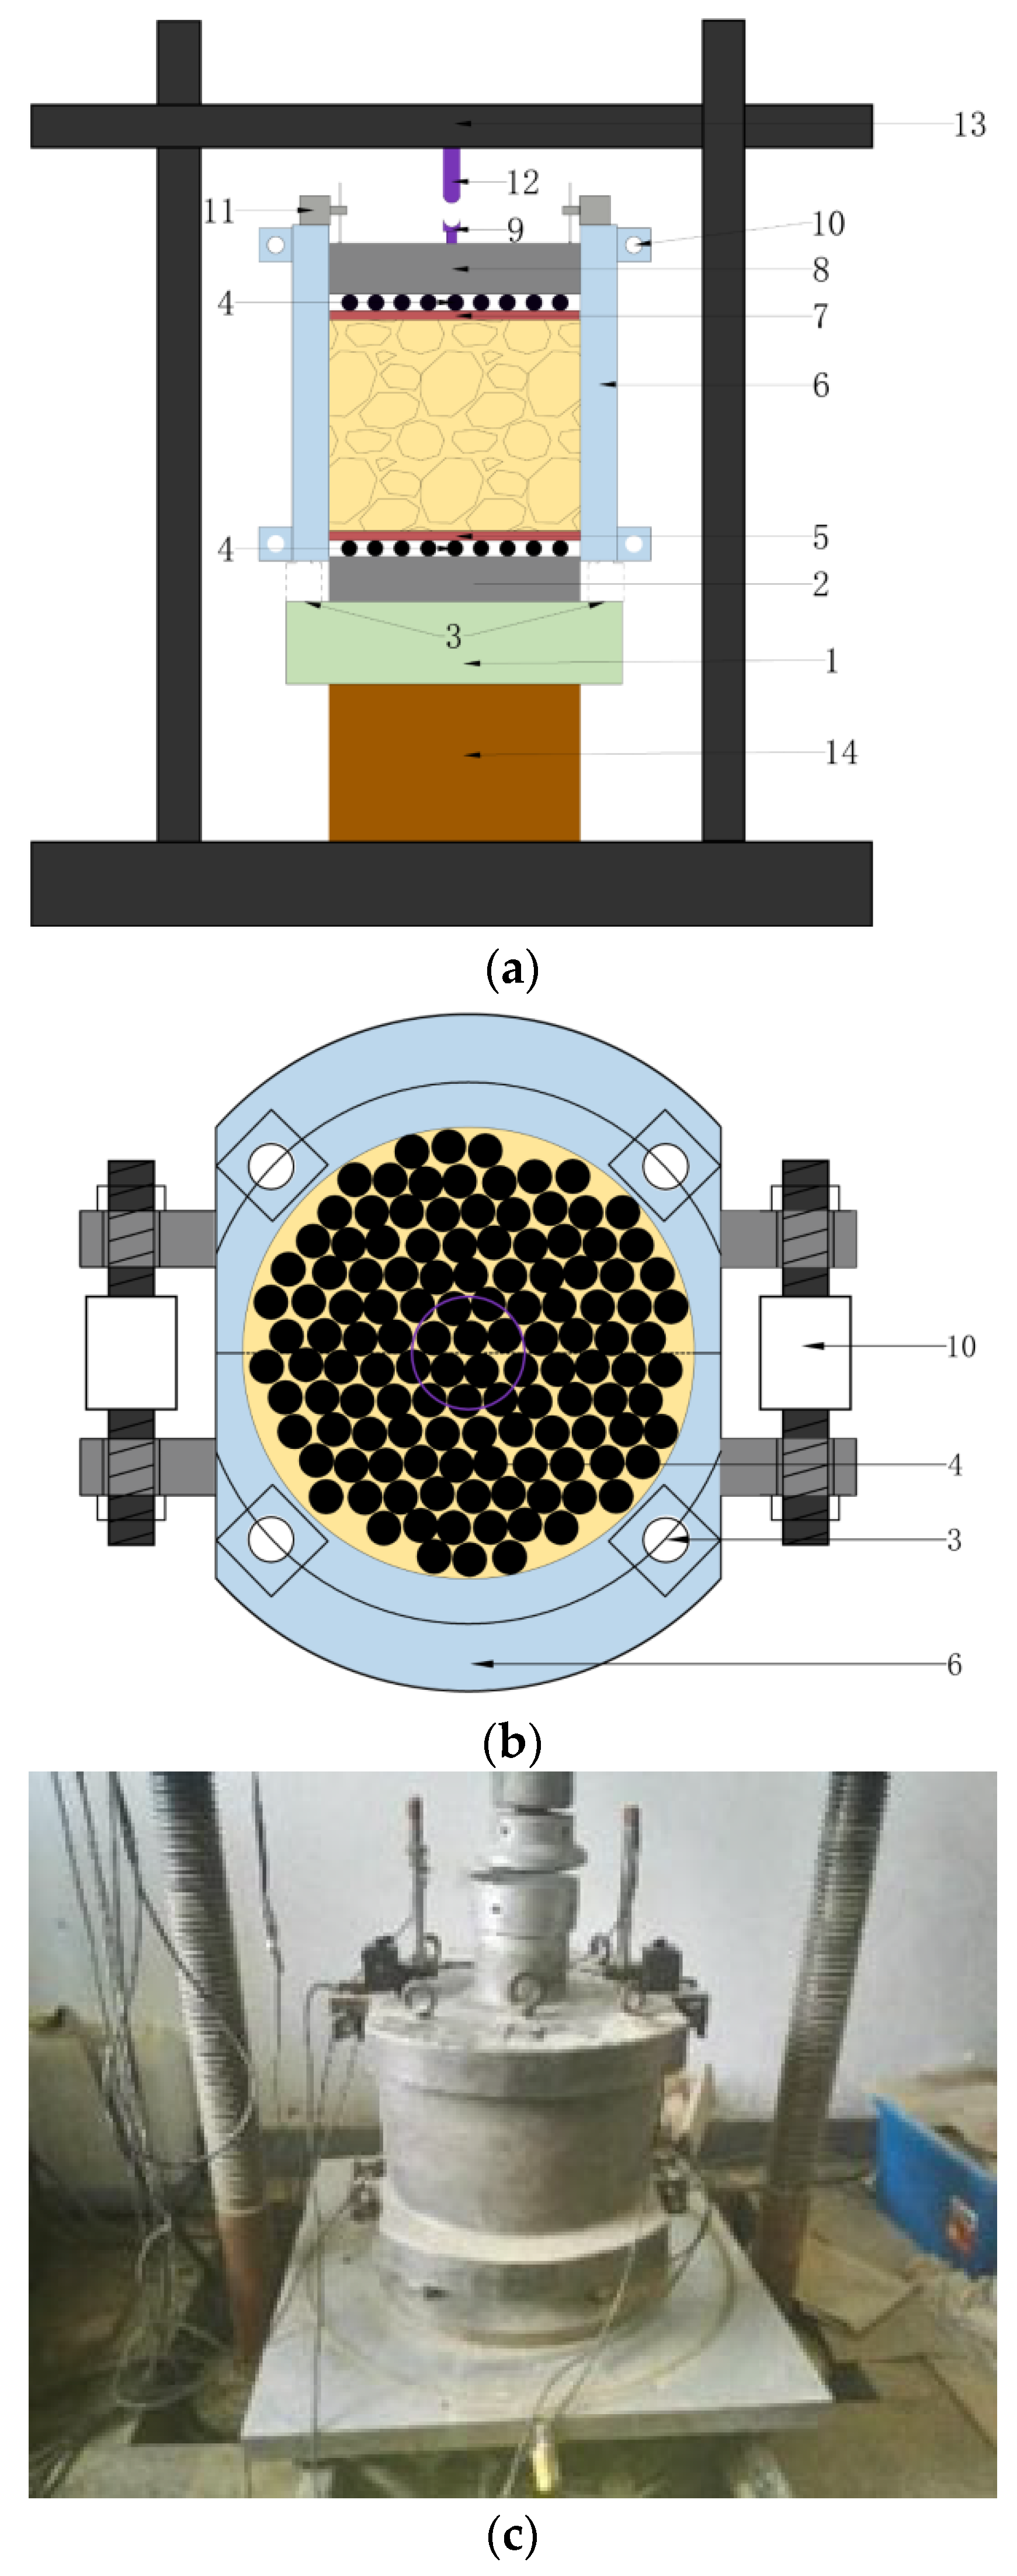
A large-scale K0-test device developed by Hohai University was used in this study (Figure 1). Compression tests can be conducted on various types of soil (e.g., coarse-grained soil) under a high stress state. The employed test equipment mainly consists of a pressure chamber, a loading system, and a measurement control system. The loading system consists of a loading frame provided by the top beam and a loading cylinder, which is connected to the base of the pressure chamber, with the pump pressure providing the jacking force from the bottom of the specimen through the piston. The testing system mainly consists of four Schein pull sensors (10), one load sensor, two displacement sensors (11), and weight sensors (12). The working principle of this device is as follows: The specimen in the barrel will adopt a lateral deformation tendency under the vertical compressive stress; thus, the semi-circular rigid barrel is squeezed. At this time, the normal stress acting on the AB section is equal to the lateral stress acting on the specimen, and the combined force of the normal stress on this section, which is the total pressure in the specimen along the direction of the diameter of the cross section, can be measured using a tensile force transducer. Accordingly, the lateral stress in the specimen can be obtained as
where (h − Δh)d is the area of the AB section, wherein h and d are the initial height and diameter of the specimen, respectively. Δh is the compression of the specimen after loading, measured by the displacement sensor. nh is the total pressure in the specimen along the cross section in the direction of the diameter, which is measured by the tensile sensor.
During the test, as the soil tends to move downwards relative to the sidewall when vertically compressed, it is bound to generate a frictional force with respect to the sidewall. This friction gradually reduces the vertical stress on the specimen along the height of the specimen, resulting in the Nv measured by the vertical load cell not being equal to the actual vertical stress acting inside the specimen. It is, therefore, necessary to eliminate the effect of friction on the side walls and obtain test data that better reflect the actual stresses on the specimen.
To attenuate the effect of sidewall friction, in this study, we used the arithmetic mean of the vertical forces at the bottom and top of the specimen as the vertical force applied to the specimen to calculate the K0. During the test, four pressure weight sensors are arranged at the bottom of the specimen barrel, and the sensors are zeroed before loading to exclude the effect of the barrel with regard to the specimen’s own weight, thereby allowing the sidewall friction force f to be measured during the test. Thus, the vertical pressure on the top surface of the specimen is Nv/A (A is the area of the specimen), and the vertical pressure on the bottom surface is (Nv − f)/A. Assuming that friction is uniformly distributed along the side walls, the average vertical stress in the specimen is as in Equation (3).
Therefore, the static lateral coefficient of pressure, K0, corrected for the effect of friction, can be calculated using Equation (4).
Two types of coarse-grained soil from the Dashixia concrete face dam and the Rumei rockfill dam were tested. Then, the sandy-gravel soil materials were denoted as S1–S4, while the rockfill materials were denoted as R1–R4. The shares of each grain group of grades 60~40, 40~20, 20~10, 10~5, and <5 mm are 17.22%, 25.04%, 17.75%, 13.38%, and 26.6%, respectively. The particle size distribution of the sandy-gravel soil, which is the same as that for the rockfill, is depicted in Figure 2.
The diameter and height of all specimens are 40 cm and 30 cm, respectively. The specimens of coarse-grained soil were produced as follows: first, specimens were air-dried and divided into three equal parts by weight, which were then filled into a pressure chamber. Then, specimens of each layer were compacted using a vibrating compactor to obtain the designed initial dry density, ρd. The ρd of every specimen is shown in Table 1.
3. Test Results and Discussion
3.1. Relationship between K0 and σ′v for Coarse-Grained Soil
Based on the experimental results, the relationship between K0 and vertical stress σ′v for S1–S4 is illustrated in Figure 3. It can be observed that σ′v has a significant influence on the K0 of coarse-grained soil and that K0 decreases as σ′v increases. Elsewhere, similar results were found in the test results for loose coarse-grained soil [26], sand [29,30], municipal solid waste, and sand gravel [31]. Hence, it is of great theoretical importance to obtain a formula that describes the relationship between K0 and σ′v. According to the K0 test of coarse-grained soil, Zhu et al. [26] determined a relationship between K0–σ′v, as shown in Equation (1). However, Equation (1) was obtained based on loose specimens. Therefore, further studies are required to determine whether it is applicable for dense coarse-grained soil.
To verify the applicability of Equation (1) for dense coarse-grained soil, Equation (1) was adapted to fit the test results of S1~S4, for which the fitting parameters are listed in Table 2, while the fitting curves are given in Figure 4. Figure 4 shows that the fitting curve and experimental results are in good agreement. Specifically, compared to the corresponding test data, the average error of the fitting data for Equation (1) is less than 5%, while the maximum error is less than 14%. As discussed above, it is clear that Equation (1) can also be adopted to describe the K0 behavior of compacted coarse-grained soil.
3.2. Influence of Initial Dry Density (ρd) on K0
To analyze the effect of the initial dry density (ρd) on the K0 for coarse-grained soil, the test results of different values of ρd are given in Figure 3a,b. From Figure 3a,b, it can be seen that there are evident differences in the K0 of different ρd under the same σ′v. More specifically, the K0 of the specimens tend to decrease with an increasing ρd. A similar variation law of K0 was reported in the study of silt-bearing sand [19], pure sand [22], and muddy sand [23]. Obviously, there is important theoretical significance to obtaining a formula that can describe the relationship between K0 and ρd.
To study the influence law of ρd on K0, the K0 values of rockfill at different ρd values corresponding to σ′v at 0.1 to 4 MPa during loading and at 3.5 to 1.1 MPa during unloading were obtained using the results of S1–S4, as shown in Figure 3. K0 and ρd are approximately linearly negatively correlated under the same σ′v.
In the above equation, a and b are material parameters. The rockfill parameters a and b and the determination coefficient R2 obtained via fitting under each vertical stress during loading and unloading are listed in Table 3, and the fitting curve is depicted in Figure 4.
It can be seen from Figure 4 that the fitting curve of Equation (5) agrees well with the test data. More specifically, the error of prediction value in Equation (5) is small, the maximum error is less than 10.2%, and the minimum value of determination coefficient R2 is 0.83. Obviously, under the same σ′v, the relationship between the K0 and the initial dry density (ρd) of rockfill can be approximately expressed by a linear equation. In Equation (1), K0max and K0min represent the K0 of soil when σ′v → ∞ and σ′v = 0, respectively; thus, K0max and K0min may have a linear relationship with ρd.
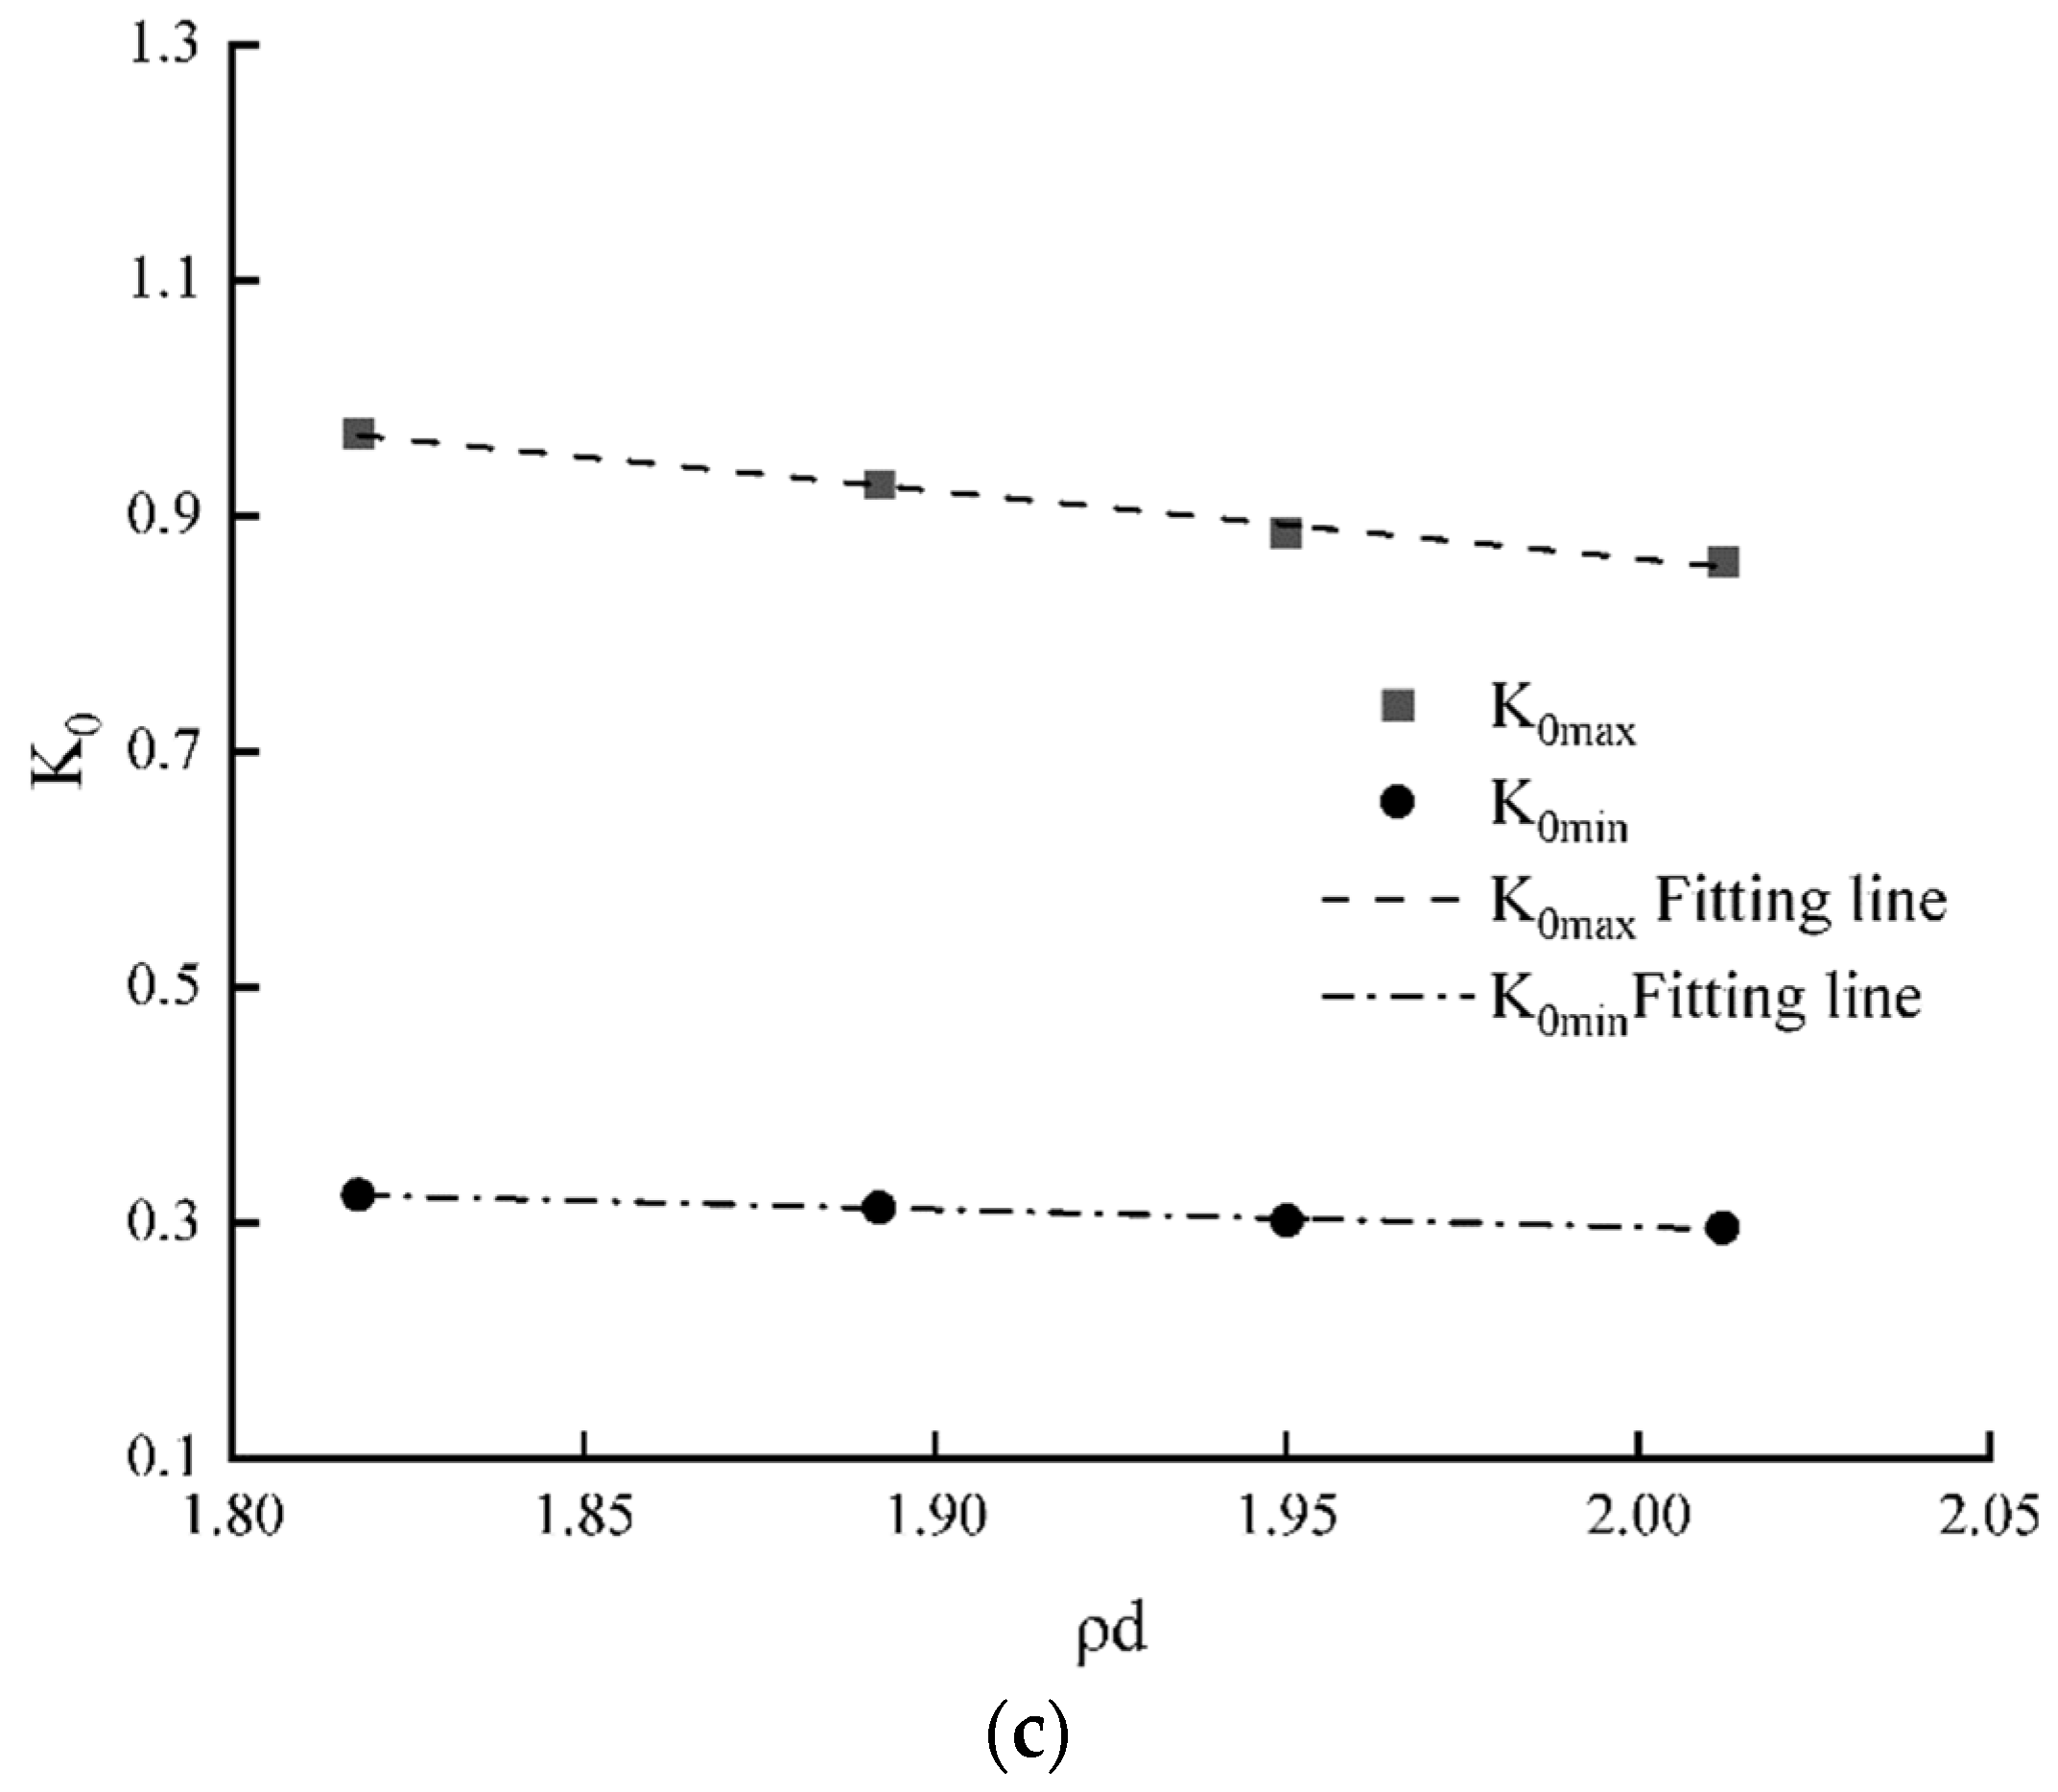
Based on Table 1 and Table 2, the relationship between the K0max/K0min and the ρd of rockfill is plotted in Figure 4. Figure 4 shows that the K0max and K0min of rockfill decrease linearly with an increase in ρd. Therefore, the relationship between K0ma/K0min and ρd can be expressed as follows:
where K0max0, K0min0, c, and d are the material parameters, and K0max0 and K0min0 are the K0 of the soil with ρd → 0 when σ′v is 0 and tends to be ∞, respectively.
The test data of S1–S4 were fitted using Equation (6), and the rockfill parameters K0max0, K0min0, c, and d used in the test are 1.8685, 0.4886, 0.7741, and 0.2724, respectively. The fitting curves are shown in Figure 4. It can be seen from Figure 4 that the fitting curve agrees well with the test results. Specifically, the error of the predicted value in Equation (6) is less than 1%, and the maximum error is less than 2%. Hence, it can be considered that Equation (6) accurately describes the relationship between K0max/K0min and ρd.
By combining Equations (1) and (6), the relationship between the K0 and ρd of coarse-grained soil can be obtained.
From Equation (7), under the known material parameters (i.e., K0max0, K0min0, c, and d) conditions, the K0 of coarse-grained soil can be estimated based on the OCR and σ′v.
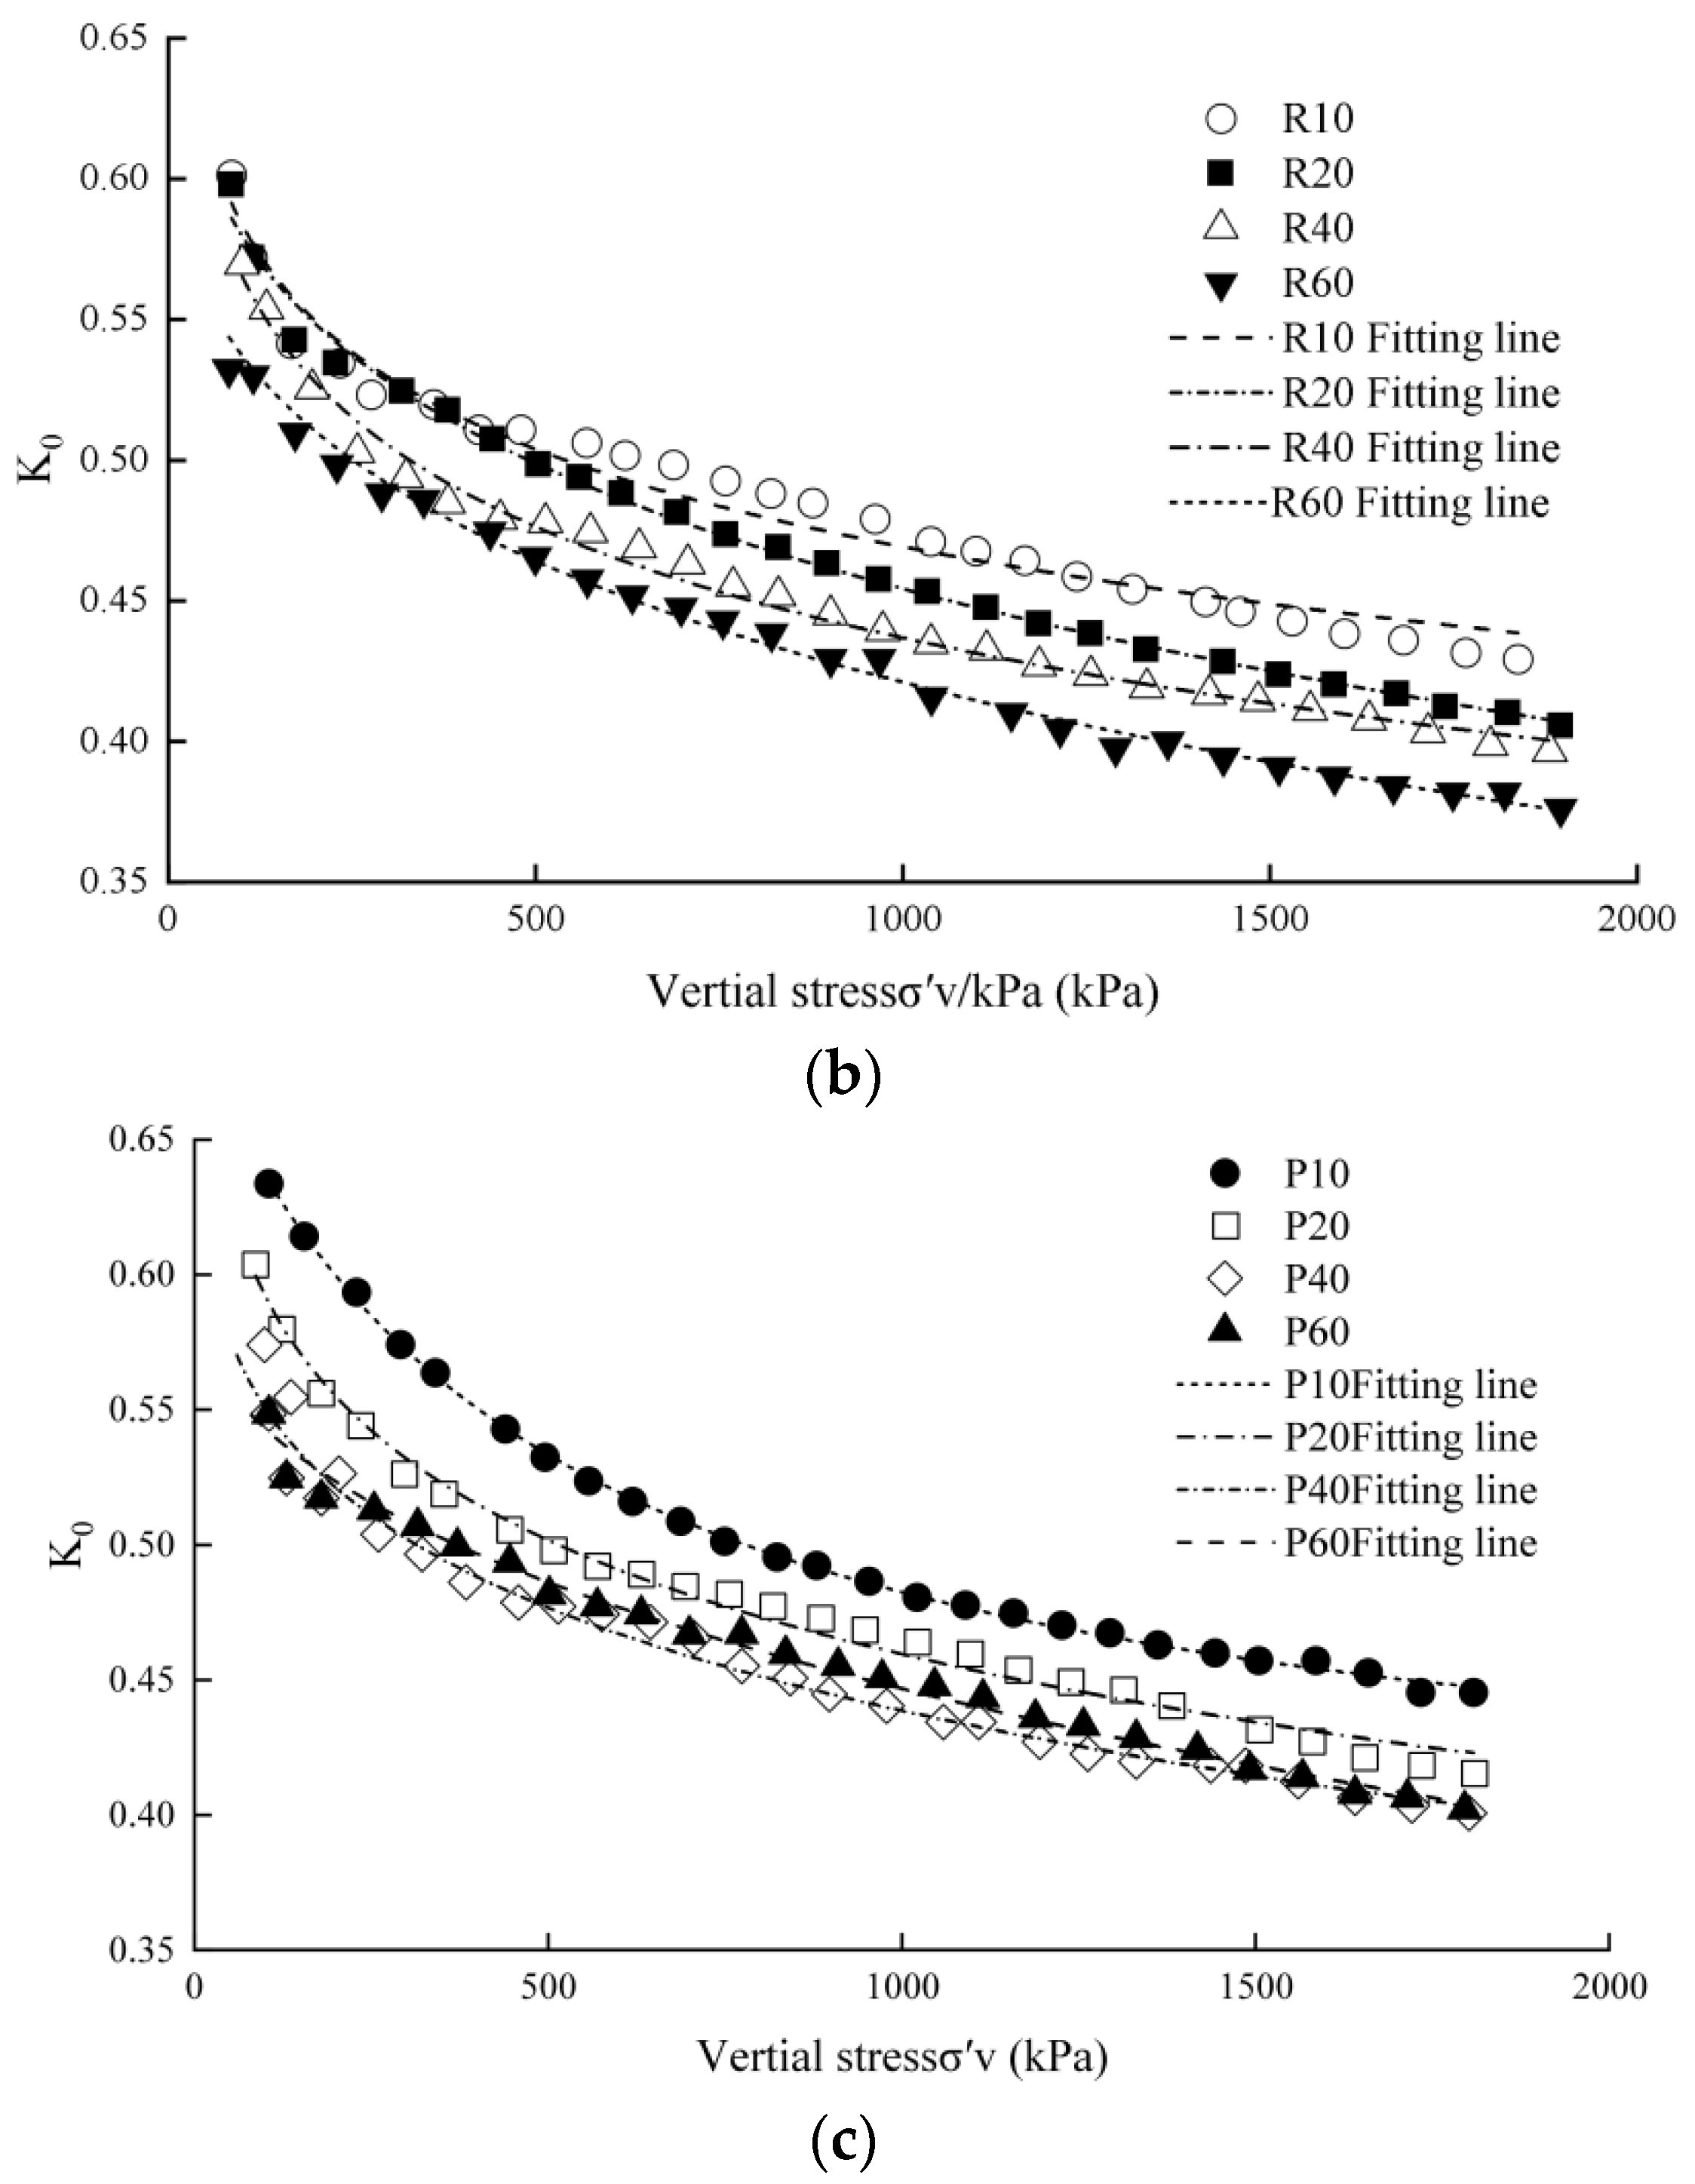
To validate Equation (7), the test results of R1–R4 were fitted, for which the sand gravel parameters K0max0, K0min0, c, and d are 1.3408, 0.2064, 0.7075, and 0.2596, respectively. The fitting curve and corresponding test data are plotted in Figure 5. In Figure 5, it is evident that the fitting curve of Equation (7) is in good agreement with the test data. The error of the predicted value in Equation (6) is less than 5%, and the maximum error is less than 11.3%. Obviously, Equation (7) can describe the relationship between K0 and ρd as well as σ′v for coarse-grained soil.
4. Empirical Formula Verification
In this paper, K0 tests were carried out on piles of sand, pebble material, and gravel, resulting in empirical equations for K0 and ρd. In order to further verify that the above empirical Equation (7) for determining the K0, ρd, and for coarse-grained soils are applicable to dry density coarse-grained soils at any gradation and to non-ground coarse-grained soils, the above conclusions need to be supported by more test data. In one study, the maximum particle sizes dmax of the original graded soil material were determined to be 600 and 100 mm for piled stone and sand-cobble, respectively. In order to meet the test size requirements, a series of large triaxial tests with different particle sizes and grading structures were carried out on the sand-cobble by using three different grading reduction methods, namely, a scalping technique, a replacement technique, and a parallel gradation technique [23]. The effect of different loading conditions on the K0 of sand pebbles was detailed by studying the static earth pressure coefficient of sand pebbles under different loading conditions, which was derived as K0 increases significantly with an increasing over consolidation ratio (OCR), yielding an empirical equation that can well describe the relationship between OCR and K0. The test results are shown in Table 4. The empirical Equation (7) derived above was further validated using the values obtained from the cited paper.
In Table 4, the relationships between the K0max and K0min and ρd for sand and pebbles are plotted, as shown in Figure 6, which shows that the K0max and K0min for sand and pebbles decrease linearly with an increasing density. The material parameters c and d of the sand and pebbles under this condition can be calculated by taking Equation (6) into account and then using Equation (7) to estimate the soil K0 equation under vertical stress.
Using Equation (7) to fit the sand and gravel K0 test results above, for which the fitting curve is in accordance with Figure 7, causes the K0-fitted value and the test to yield a very good match error, which is less than 5%; thus, the fitting effect is good. This result shows the reliability of the empirical formula and its applicability to different dry density coarse-grained soils. Therefore, the static lateral pressure coefficient test was carried out for different dry densities of sand and pebbles, for which the parameters presented in (7) were obtained, so that the relationship between the static lateral pressure coefficient and the initial dry density and vertical stress can be better described by Equation (7).
5. Influence Mechanism of Vertical Stress on K0
According to the research of Landva et al. [24] and Levenberg et al. [25], soil type has some influence on K0. Thus, to investigate the influence of soil type on the K0 of coarse-grained soil, experimental data (R2 and S3 as well as R3 and S4 with similar initial dry density values) were plotted in Figure 8. In Figure 8, it is evident that the K0 of sand gravel is larger than that of rockfill under the same σ′v. Therefore, it is obvious that the coarse-grained soil type precipitates the difference in K0.
To further study the effect of the coarse-grained soil type on K0, the average values of K0 under different σ′v values of R2, S3, R3, and S4 were listed in Table 5. According to Table 5, under the same conditions of initial relative density and gradation, the K0 of sand gravel is over 10% larger than that of rockfill. Under the unloaded condition, the K0 of sand gravel is over 14% larger than that of rockfill. From the above results, the soil type has a certain influence on the coarse-grained soil, and the K0 of sand gravel is larger than that of rockfill under the same initial conditions. Moreover, the influence of soil type on coarse-grained soil needs to be further studied.
6. Conclusions
A series of K0 tests for two types of soil (rockfill and sandy gravel) were conducted by a newly developed large-scale apparatus. The relationship between the K0, initial relative density (ρd), and vertical stress (σ′v) of coarse-grained soil was studied, and an empirical formula was proposed based on the test results. The following results were obtained:
- (1)
- σ′v has a significant influence on the K0 of coarse-grained soil, while K0 decreases as σ′vincreases, and this decreasing trend will be remarkably weakened under the influence of higher pressure. It was verified that the K0–σ′v relationship proposed is applicable to compacted coarse-grained soil.
- (2)
- According to the test results concerning rockfill, the K0 of the specimens tended to decrease with an increasing ρd. Furthermore, a formula for describing K0–σ′v was obtained, which can describe the relationship between the K0, ρd,, and σ′v of coarse-grained soil. The reliability of the formula was verified by the test results regarding sand gravel. Finally, according to the published test results, further evidence has been obtained that this formula can accurately describe the relationship between K0, ρd, and σ′v for any coarse-grained soil.
- (3)
- The type of coarse-grained soil in question has a certain influence on the K0 of coarse-grained soil. The K0 of sand gravel is larger than that of rockfill without other influencing factors.
Author Contributions
Conceptualization, M.-J.J., C.-R.F. and K.-X.Z.; methodology, M.-J.J.; validation, J.-G.Z.; formal analysis, C.-R.F. and K.-X.Z.; investigation, M.-J.J.; resources, J.-G.Z.; data curation, H.-L.X., K.-X.Z. and C.-R.F.; writing–original draft, K.-X.Z.; writing–review and editing, C.-R.F., K.-X.Z., H.-L.X. and M.-J.J.; supervision, J.-G.Z.; project administration, M.-J.J.; funding acquisition, M.-J.J. and J.-G.Z. All authors have read and agreed to the published version of the manuscript.
Funding
This work was supported by the National key R&D program of China (2017YFC0404804); a research grant (No. U1865104) from the Yalong River Joint Fund of the Natural Science Foundation of China—Yalong River Basin Hydropower Development Co., Ltd.; a research grant (Nos. 51878185, 52178321, 52108309) from NSFC; a research grant (No. B13024) from the 111 project, a key Project (NO. U2040221) supported by the National Natural Science Foundation of China; a grant from the Foundation of the Guangdong Key Laboratory of Oceanic Civil Engineering (LMCE202103); a grant from the Systematic Project of Guangxi Key Laboratory of Disaster Prevention and Engineering Safety (Number 2020ZDK003); and a grant from NHRI (YK321009).
Institutional Review Board Statement
Not applicable.
Informed Consent Statement
Not applicable.
Data Availability Statement
Not applicable.
Acknowledgments
The authors gratefully acknowledge the financial support from National key R&D program of China (2017YFC0404804); a research grant (No. U1865104) from Yalong River joint fund of natural science foundation of China—Yalong River basin hydropower development Co., Ltd.; a research grant (Nos. 51878185, 52178321, 52108309) from NSFC; a research grant (No. B13024) from the 111 project, a key Project (NO. U2040221) supported by the National Natural Science Foundation of China; a grant from the Foundation of Guangdong Key Laboratory of Oceanic Civil Engineering (LMCE202103); a grant from the Systematic Project of Guangxi Key Laboratory of Disaster Prevention and Engineering Safety (Number 2020ZDK003); a grant from NHRI (YK321009); and a grant from the Guangxi Natural Science Foundation (No. 2021GXNSFBA196091).
Conflicts of Interest
The authors declare no conflict of interest.
References
- Yang, P.Y.; Li, L.; Aubertin, M. Theoretical and Numerical Analyses of Earth Pressure Coefficient along the Centerline of Vertical Openings with Granular Fills. Appl. Sci. 2018, 8, 1721. [Google Scholar] [CrossRef]
- Sarma, S.K.; Tan, D. Determination of critical slip surface in slope analysis. Geotechnique 2006, 56, 539–550. [Google Scholar] [CrossRef]
- Farooq, M.U.; Mujtaba, H.; Farooq, K.; Sivakugan, N.; Das, B.M. Evaluation of Stability and Erosion Characteristics of Soil Embankment Slope Reinforced with Different Natural Additives. Iran. J. Sci. Technol. Trans. Civ. Eng. 2020, 44, 515–524. [Google Scholar] [CrossRef]
- Beiranvand, B.; Komasi, M. Study of the Arching Ratio in Earth Dam by Comparing the Results of Monitoring with Numerical Analysis (Case Study: Marvak Dam). Iran. J. Sci. Technol. Trans. Civ. Eng. 2021, 45, 1183–1195. [Google Scholar] [CrossRef]
- Yuan, B.; Chen, W.; Zhao, J.; Li, L.; Liu, F.; Guo, Y.; Zhang, B. Addition of alkaline solutions and fibers for the reinforcement of kaolinite-containing granite residual soil. Appl. Clay Sci. 2022, 228, 106644. [Google Scholar] [CrossRef]
- Kutschke, W.G.; Vallejo, L.E. Investigation of Lateral Stress Relief Using Finite Elements and Fracture Mechanics: Case History Study of the Saxon Pit. J. Geotech. Geoenviron. Eng. 2012, 138, 1277–1283. [Google Scholar] [CrossRef]
- Tang, L.Y.; Qiu, P.Y.; Schlinger, C.M.; Yang, G.S.; Ye, W.J. Analysis of the Influence of Vehicle Loads on Deep Underground Excavation-Supporting Structures. Iran. J. Sci. Technol. Trans. Civ. Eng. 2016, 40, 209–218. [Google Scholar] [CrossRef]
- Yuan, B.; Li, Z.; Zhao, Z.; Ni, H.; Su, Z.; Li, Z. Experimental study of displacement field of layered soils surrounding laterally loaded pile based on Transparent Soil. J. Soils Sediments 2021, 21, 3072–3083. [Google Scholar] [CrossRef]
- Ahmad, S.M. Pseudodynamic approach for computation of seismic passive earth resistance including seepage. Ocean. Eng. 2013, 63, 63–71. [Google Scholar] [CrossRef]
- Kaveh, A.; Akbari, H.; Hosseini, S.M. Plasma Generation Optimization for Optimal Design of Reinforced Concrete Cantilever Retaining Wall Structures. Iran. J. Sci. Technol. Trans. Civ. Eng. 2021, 46, 1177–1200. [Google Scholar] [CrossRef]
- Yuan, B.; Chen, W.; Li, Z.; Zhao, J.; Luo, Q.; Chen, W.; Chen, T. Sustainability of the polymer SH reinforced recycled Granite Residual Soil: Properties, physicochemical mechanism and applications. J. Soils Sediments 2022, 23, 246–262. [Google Scholar] [CrossRef]
- Guo, Q.-G. Engineering Properties and Application of Coarse-Grained Soil; China Water Power Press: Beijing, China, 2003. (In Chinese) [Google Scholar]
- Li, Z.; Xing, Y.C. Influence of dry density and fine content on shear strength of gravel and sand. Rock Soil Mech. 2006, 12, 2255–2260. [Google Scholar] [CrossRef]
- Gao, D.H.; Chen, Z.H.; Guo, N.; Zhu, Y.P.; Hu, S.P.; Yao, Z.P. The influence of dry density and matric suction on the deformation and the strength characteristics of the remolded unsaturated loess soils. Chin. J. Rock Mech. Eng. 2017, 36, 736–744. [Google Scholar]
- Li, D.S.; Liu, D.S. Comparative study on shear strength characteristics of coal gangue. J. Rock Mech. Eng. 2015, 34, 2808–2816. [Google Scholar]
- Federico, A.; Elia, G.; Germano, V.A. Short Note on the Earth Pressure and Mobilized Angle of Internal Friction in One-Dimensional Compression of Soils. J. Geoengin. 2008, 3, 41–46. [Google Scholar]
- Jaky, I. The coefficient of earth pressure at rest. J. Soc Hung. Archit. Eng. 1944, 78, 355–358. [Google Scholar]
- Shi, H.; Xie, D.; Wang, W.A. Theoretical formula determining the coefficient of earth pressure at rest for cohesionless soil. J. Hydraul. Eng. 2001, 4, 85–88. [Google Scholar] [CrossRef]
- Leen, J.; Yun, T.S.; Lee, D.; Lee, J. Assessment of K-0 correlation to strength for granular materials. Soils Found. 2013, 53, 584–595. [Google Scholar]
- Mesri, G.; Vardhanabhuti, B. Coefficient of earth pressure at rest for sands subjected to vibration. Can. Geotech. J. 2007, 44, 1242–1263. [Google Scholar]
- Northcutt, S.; Wijewickreme, D. Effect of particle fabric on the coefficient of lateral earth pressure observed during one-dimensional compression of sand. Can. Geotech. J. 2013, 50, 457–466. [Google Scholar] [CrossRef]
- Lee, J.; Lee, D.; Park, D. Experimental Investigation on the Coefficient of Lateral Earth Pressure at Rest of Silty Sands: Effect of Fines. Geotech. Test. J. 2014, 37, 13. [Google Scholar] [CrossRef]
- Zhu, J.G.; Jiang, M.J.; Lu, Y.Y.; Guo, W.L.; Zhang, B. Experimental study on the coefficient of sandy gravel under different loading conditions. Granul. Matter 2018, 20, 9. [Google Scholar] [CrossRef]
- Landva, A.O.; Valsangkar, A.J.; Pelkey, S.G. Lateral earth pressure at rest and compressibility of municipal solid waste. Can. Geotech. J. 2000, 37, 1157–1165. [Google Scholar] [CrossRef]
- Levenberg, E.; Garg, N. Estimating the coefficient of at-rest earth pressure in granular pavement layers. Transp. Geotech. 2014, 1, 21–30. [Google Scholar] [CrossRef]
- Zhu, J.G.; Jiang, M.J.; Lu, Y.Y.; Ji, E.Y.; Luo, X.H. Experimental study on influence of stress state on at-rest earth pressure coefficient for coarse grained soil. Rock Soil Mech. 2019, 40, 827–833. [Google Scholar]
- Marsehi, N.D.; Chan, C.K.; Seed, H.B. Evaluation of Properties of Rockfill Materials. J. Soil Mech. Found. Div. 1972, 98, 1064–1072. [Google Scholar]
- Bagherzadeh-Khalkhali, A.; Mirghasemi, A.A. Numerical and experimental direct shear tests for coarse-grained soils. Particuology 2009, 7, 83–91. [Google Scholar] [CrossRef]
- Lirer, S.; Flora, A.; Nicotera, M.V. Some remarks on the coefficient of earth pressure at rest in compacted sandy gravel. Acta Geotech. 2011, 6, 1–12. [Google Scholar] [CrossRef]
- Gu, X.Q.; Hu, J.; Huang, M.S. K-0 of granular soils: A particulate approach. Granul. Matter 2015, 17, 703–715. [Google Scholar] [CrossRef]
- Mokhtari, M.; Shariatmadari, N.; Ali, A.H.R.; Salehzadeh, H. Design and fabrication of a large-scale oedometer. J. Cent. South Univ. 2015, 22, 931–936. [Google Scholar] [CrossRef]
Figure 1.
Test equipment (Note: 1—pedestal, 2—base, 3—load sensor, 4—steel ball, 5—the bottom force transmission plate, 6—semicircular rigid cylinders, 7—the top force transmission plate, 8—pressure plate, 10—tension sensors, 11—displacement sensor, 12—load sensor, 13—loading frame, and 14—loading device). (a) Sketch map of test equipment, (b) top view of the apparatus, and (c) physical view of the instrument.

Figure 2.
Particle Size Distribution (PSD) curves of test specimens.

Figure 3.
K0–σ1 curves with different pd: (a) S1 and S3; (b) S2 and S4.

Figure 4.
K0max/K0min–pd fitting curves: (a) loading stage; (b) unloading stage. (c) K0max/K0min–Dr0 fitting curves.
Figure 4.
K0max/K0min–pd fitting curves: (a) loading stage; (b) unloading stage. (c) K0max/K0min–Dr0 fitting curves.


Figure 5.
K0–dM curves. (a) S1 and S3. (b) S2 and S4.

Figure 6.
K0max/K0min–pd fitting curves of the specimens for different techniques: (a) scalping technique, (b) replacement technique, and (c) parallel gradation technique.
Figure 6.
K0max/K0min–pd fitting curves of the specimens for different techniques: (a) scalping technique, (b) replacement technique, and (c) parallel gradation technique.


Figure 7.
K0–σv curves of the specimens for different techniques: (a) scalping technique, (b) replacement technique, and (c) parallel gradation technique.
Figure 7.
K0–σv curves of the specimens for different techniques: (a) scalping technique, (b) replacement technique, and (c) parallel gradation technique.


Figure 8.
K0 behavior of sandy gravel and rockfill under loading and unloading conditions.


Table 1.
Basic property of tested soil and specimens.
| Sand | Specimen | Density (g/cm3) |
|---|---|---|
| Rockfill | R1 | 2.003 |
| R2 | 1.948 | |
| R3 | 1.896 | |
| R4 | 1.847 | |
| Sand gravel | S1 | 2.043 |
| S2 | 1.989 | |
| S3 | 1.938 | |
| S4 | 1.844 |
Table 2.
K0max and K0min of the tested specimens.
| Fitting Parameters | Specimen | |||
|---|---|---|---|---|
| D1 | D2 | D3 | D4 | |
| K0max | 0.872 | 0.894 | 0.922 | 0.968 |
| K0min | 0.212 | 0.234 | 0.246 | 0.268 |
| n | 0.747 | 0.704 | 0.684 | 0.678 |
| R2 | 0.98 | 0.99 | 0.99 | 0.99 |
Table 3.
a and b under different vertical stress for specimens.
| Value | During Loading (MPa) | During Unloading (MPa) | ||||||||
|---|---|---|---|---|---|---|---|---|---|---|
| 0.1 | 0.5 | 1 | 2 | 4 | 3.4 | 3 | 2.5 | 1.5 | 1.1 | |
| a | 0.92 | 0.5 | 0.29 | 0.31 | 0.28 | 0.19 | 0.18 | 0.2 | 0.21 | 0.49 |
| b | 2.4 | 1.4 | 0.97 | 0.97 | 0.87 | 0.77 | 0.79 | 0.95 | 1.21 | 1.97 |
| R2 | 0.94 | 0.88 | 0.85 | 0.84 | 0.95 | 0.94 | 0.91 | 0.97 | 0.88 | 0.94 |
Table 4.
Different dry densities, K0max, and K0min.
| Soils | Density (g/cm3) | K0max | K0min |
|---|---|---|---|
| S60 | 2.051 | 0.953 | 0.291 |
| S40 | 2.034 | 0.972 | 0.296 |
| S20 | 1.962 | 1.006 | 0.304 |
| S10 | 1.904 | 1.042 | 0.312 |
| R60 | 2.010 | 0.880 | 0.227 |
| R40 | 2.009 | 0.892 | 0.284 |
| R20 | 1.942 | 0.914 | 0.297 |
| R10 | 1.907 | 0.935 | 0.311 |
| P60 | 2.012 | 0.861 | 0.296 |
| P40 | 1.950 | 0.885 | 0.302 |
| P20 | 1.892 | 0.926 | 0.313 |
| P10 | 1.818 | 0.970 | 0.324 |
Table 5.
The average value of K0 during loading/unloading for test specimens.
| Sand and Gravel | Rockfill | |||
|---|---|---|---|---|
| S3 | S4 | R2 | R3 | |
| Loading phase | 0.397 | 0.427 | 0.367 | 0.372 |
| Unloading phase | 0.62 | 0.646 | 0.54 | 0.565 |
Disclaimer/Publisher’s Note: The statements, opinions and data contained in all publications are solely those of the individual author(s) and contributor(s) and not of MDPI and/or the editor(s). MDPI and/or the editor(s) disclaim responsibility for any injury to people or property resulting from any ideas, methods, instructions or products referred to in the content. |
© 2023 by the authors. Licensee MDPI, Basel, Switzerland. This article is an open access article distributed under the terms and conditions of the Creative Commons Attribution (CC BY) license (https://creativecommons.org/licenses/by/4.0/).
Share and Cite
MDPI and ACS Style
Jiang, M.-J.; Xie, H.-L.; Fang, C.-R.; Zhang, K.-X.; Zhu, J.-G. Experimental Study on Influence of Initial Relative Dry Density on K0 of Coarse-Grained Soil. Buildings 2023, 13, 1059. https://0-doi-org.brum.beds.ac.uk/10.3390/buildings13041059
AMA Style
Jiang M-J, Xie H-L, Fang C-R, Zhang K-X, Zhu J-G. Experimental Study on Influence of Initial Relative Dry Density on K0 of Coarse-Grained Soil. Buildings. 2023; 13(4):1059. https://0-doi-org.brum.beds.ac.uk/10.3390/buildings13041059
Chicago/Turabian StyleJiang, Ming-Jie, Huo-Liang Xie, Chao-Rong Fang, Ke-Xin Zhang, and Jun-Gao Zhu. 2023. "Experimental Study on Influence of Initial Relative Dry Density on K0 of Coarse-Grained Soil" Buildings 13, no. 4: 1059. https://0-doi-org.brum.beds.ac.uk/10.3390/buildings13041059
Note that from the first issue of 2016, this journal uses article numbers instead of page numbers. See further details here.