


Rainwater Retention Test of Various Green Roofs: Influence on Membrane Temperatures and Evapotranspiration

Department of Building Engineering and Urban Planning, Faculty of Civil Engineering, University of Zilina, Univerzitna 8215/1, 010 26 Zilina, Slovakia
Buildings 2023, 13(8), 2058; https://0-doi-org.brum.beds.ac.uk/10.3390/buildings13082058
Submission received: 30 June 2023
/
Revised: 20 July 2023
/
Accepted: 21 July 2023
/
Published: 12 August 2023
(This article belongs to the Topic Sustainable Built Environment)
Abstract
:Green structures such as roofs or facades are great examples of ways to mitigate climate change, and they have multidisciplinary benefits. One of them is water retention during storms and high rainfalls. In this paper, the impact on the temperature of a membrane after excessive watering was investigated. The results of watered samples were compared to the non-watered ones. This test was carried out on five equal samples. The results showed that the actual foliage cover is very important. The worst results were obtained by the samples that did not have sufficient plant (foliage) cover. Notable differences in courses after watering reached up to 7 °C and lasted up to five days. Visible differences after watering were also exhibited by other samples. The type of drainage/retention layer also influenced the results, whereas the hard-profiled plastic board had high practical retention, which impacted temperatures over a long time period. The actual water content influenced and reduced the daily amplitude from 13 to 7 °C for at least five sunny days. This confirms the theoretical evapotranspiration calculations and actual water content in green roofs. In this case, the water content in the samples proves the cooling effect on the waterproofing membrane.
1. Introduction
Green roofs and facades belong to the group of green structures or greenery systems. The idea of green roofs was used in the ancient world: the Hanging Gardens of Babylon were actually a type of green roof. Scandinavian countries used sod roofs until the late 19th century. These were pitched roofs with birch bark roofing and grass as the vegetation layer. In the 20th century (1960s and 1970s), a rediscovery took place mostly in Germany [1]. Essentially, it can be said that the green roofs have a long history of research behind them and the idea is pretty old. With advances in material engineering and worldwide efforts to mitigate climate change, green roofs have attracted a lot of attention worldwide.
Research efforts can be divided into two main areas: water and heat management. In the area of water management, the research aims are as follows: storm water management [2,3,4] and a reduction in runoff volume, e.g., to avoid the clogging of the drainage network [5,6,7]. Over the years, heat management has changed from thermal loss reduction to a reduction in cooling loads [8,9,10]. A green roof (GR) consists of several layers; therefore, the research follows the individual properties of layers, such as foliage percentage, growth time [11], suitable plants [12,13,14], or substrates [15,16,17,18]. As a part of water conservation on-site, the quality of runoff water [7,17] is also important. Green roof layers have more functions, such as water accumulation and also drainage, where polyolefin-cup-style boards are widely used. Agglomerated cork is also used as the latest development [19,20] as a water accumulating material. Mineral wool insulation [21,22] is incorporated in order to reduce the substrate thickness.
One of the main benefits, regarding the reduction in the cooling load, is the evapotranspiration (ET) from vegetation. It can be defined as a dissipating part of surface heat flux into latent heat released into the external environment [23,24]. This is important during heat waves [10,25,26]. With the lack of natural rain and more frequent and longer heat waves, its effect can be increased by additional watering or irrigation systems [8,9,19,27]. Watered plants increase the cooling potential of green roofs [24].
The primary focus of green roofs is to reduce the well-known urban heat islands (UHIs), to mitigate climate change, and to positively influence the quality of the microclimate around the buildings. The UHI is a long-time phenomenon that has influenced the temperature distribution in urban environments. Increasing the green areas within the cities [26,28,29], wetting the individual surfaces, and more complex simulations of the urban environment [25,29] have been conducted in order to mitigate the UHI and to offer different solutions. Green roofs can absorb a large proportion of solar energy [30].
Additional green roof layers protect the waterproofing membrane against ultraviolet (UV) solar radiation. UV radiation causes membrane degradation. Green roofs minimize or decrease the daily/diurnal temperature amplitudes too [1,24]. Additional layers also reduce the heat flux and, therefore, heat is lost through the roof [10,31,32,33,34]. This reduction is dependent on the thickness of the roof’s thermal insulation [35,36]. By increasing the thermal protection of buildings according to worldwide efforts to reduce the energy demand of building stock, other benefits of green roofs are becoming more attractive.
Experiments worldwide have had different effects on the results, which are mostly of benefit in the summer [37,38,39]. Measurements have been conducted on different sample scales [37,38,40]. Simulation and experiment comparisons are given in [33,37,41]. Winter benefits [3,42,43,44] are not as widely covered as summer ones [1,31,45]. A snow layer, mostly powder snow [34], can highly influence the results and shape the differences. The reported energy saving in winter between a non-protected or non-covered flat roof and a green roof is about 10–15% [1,36,40,46]. This reduction is highly dependent on the thickness of the thermal insulation [39,44,45]. The overcooling of the outer surface caused by long-wave radiation and during winter is crucial [42,47,48]. Measurement of the long-wave radiation among other outdoor climate parameters is important [49,50,51].
Focusing on Central Europe, where this research was conducted, three other similar studies are found. Two of them are in the Czech Republic. The first is in the University Centre for Energy Efficient Buildings (UCEEB) CTU in Busterad. More green roofs [52] were tested, but the results are for commercial areas and they are confidential. There is also a testbed in Brno, but it is not applied to real roofs [53]. In Slovakia, an experimental roof in Kosice with different substrate thickness was investigated [46].
This paper is an update and follow-up to conducted and previously published papers of temperature measurements of different green roof fragments [31,32]—green and non-green roofs and gravel. Also, an analysis focusing solely on winter results is found in [31]. In this paper, the temperature courses of the membrane were compared between the irrigated and non-irrigated ones. This comparison highlights the possibility of comparing two identical samples, because there are two of them: one primarily for temperature and the other one for water retention measurements.
In Section 2, test site and sample compositions are described. Also, the methodology of irrigation or watering of the samples is provided. Outdoor boundary conditions (real outdoor climate chosen for the experiment) are described in Section 3. The results are introduced in Section 4. Temperature courses for different membrane covers during the selected periods and courses for watered and non-watered green roofs are presented and discussed here. Section 5 draws conclusions, limitations, and future plans.
2. Experimental Test Site Construction
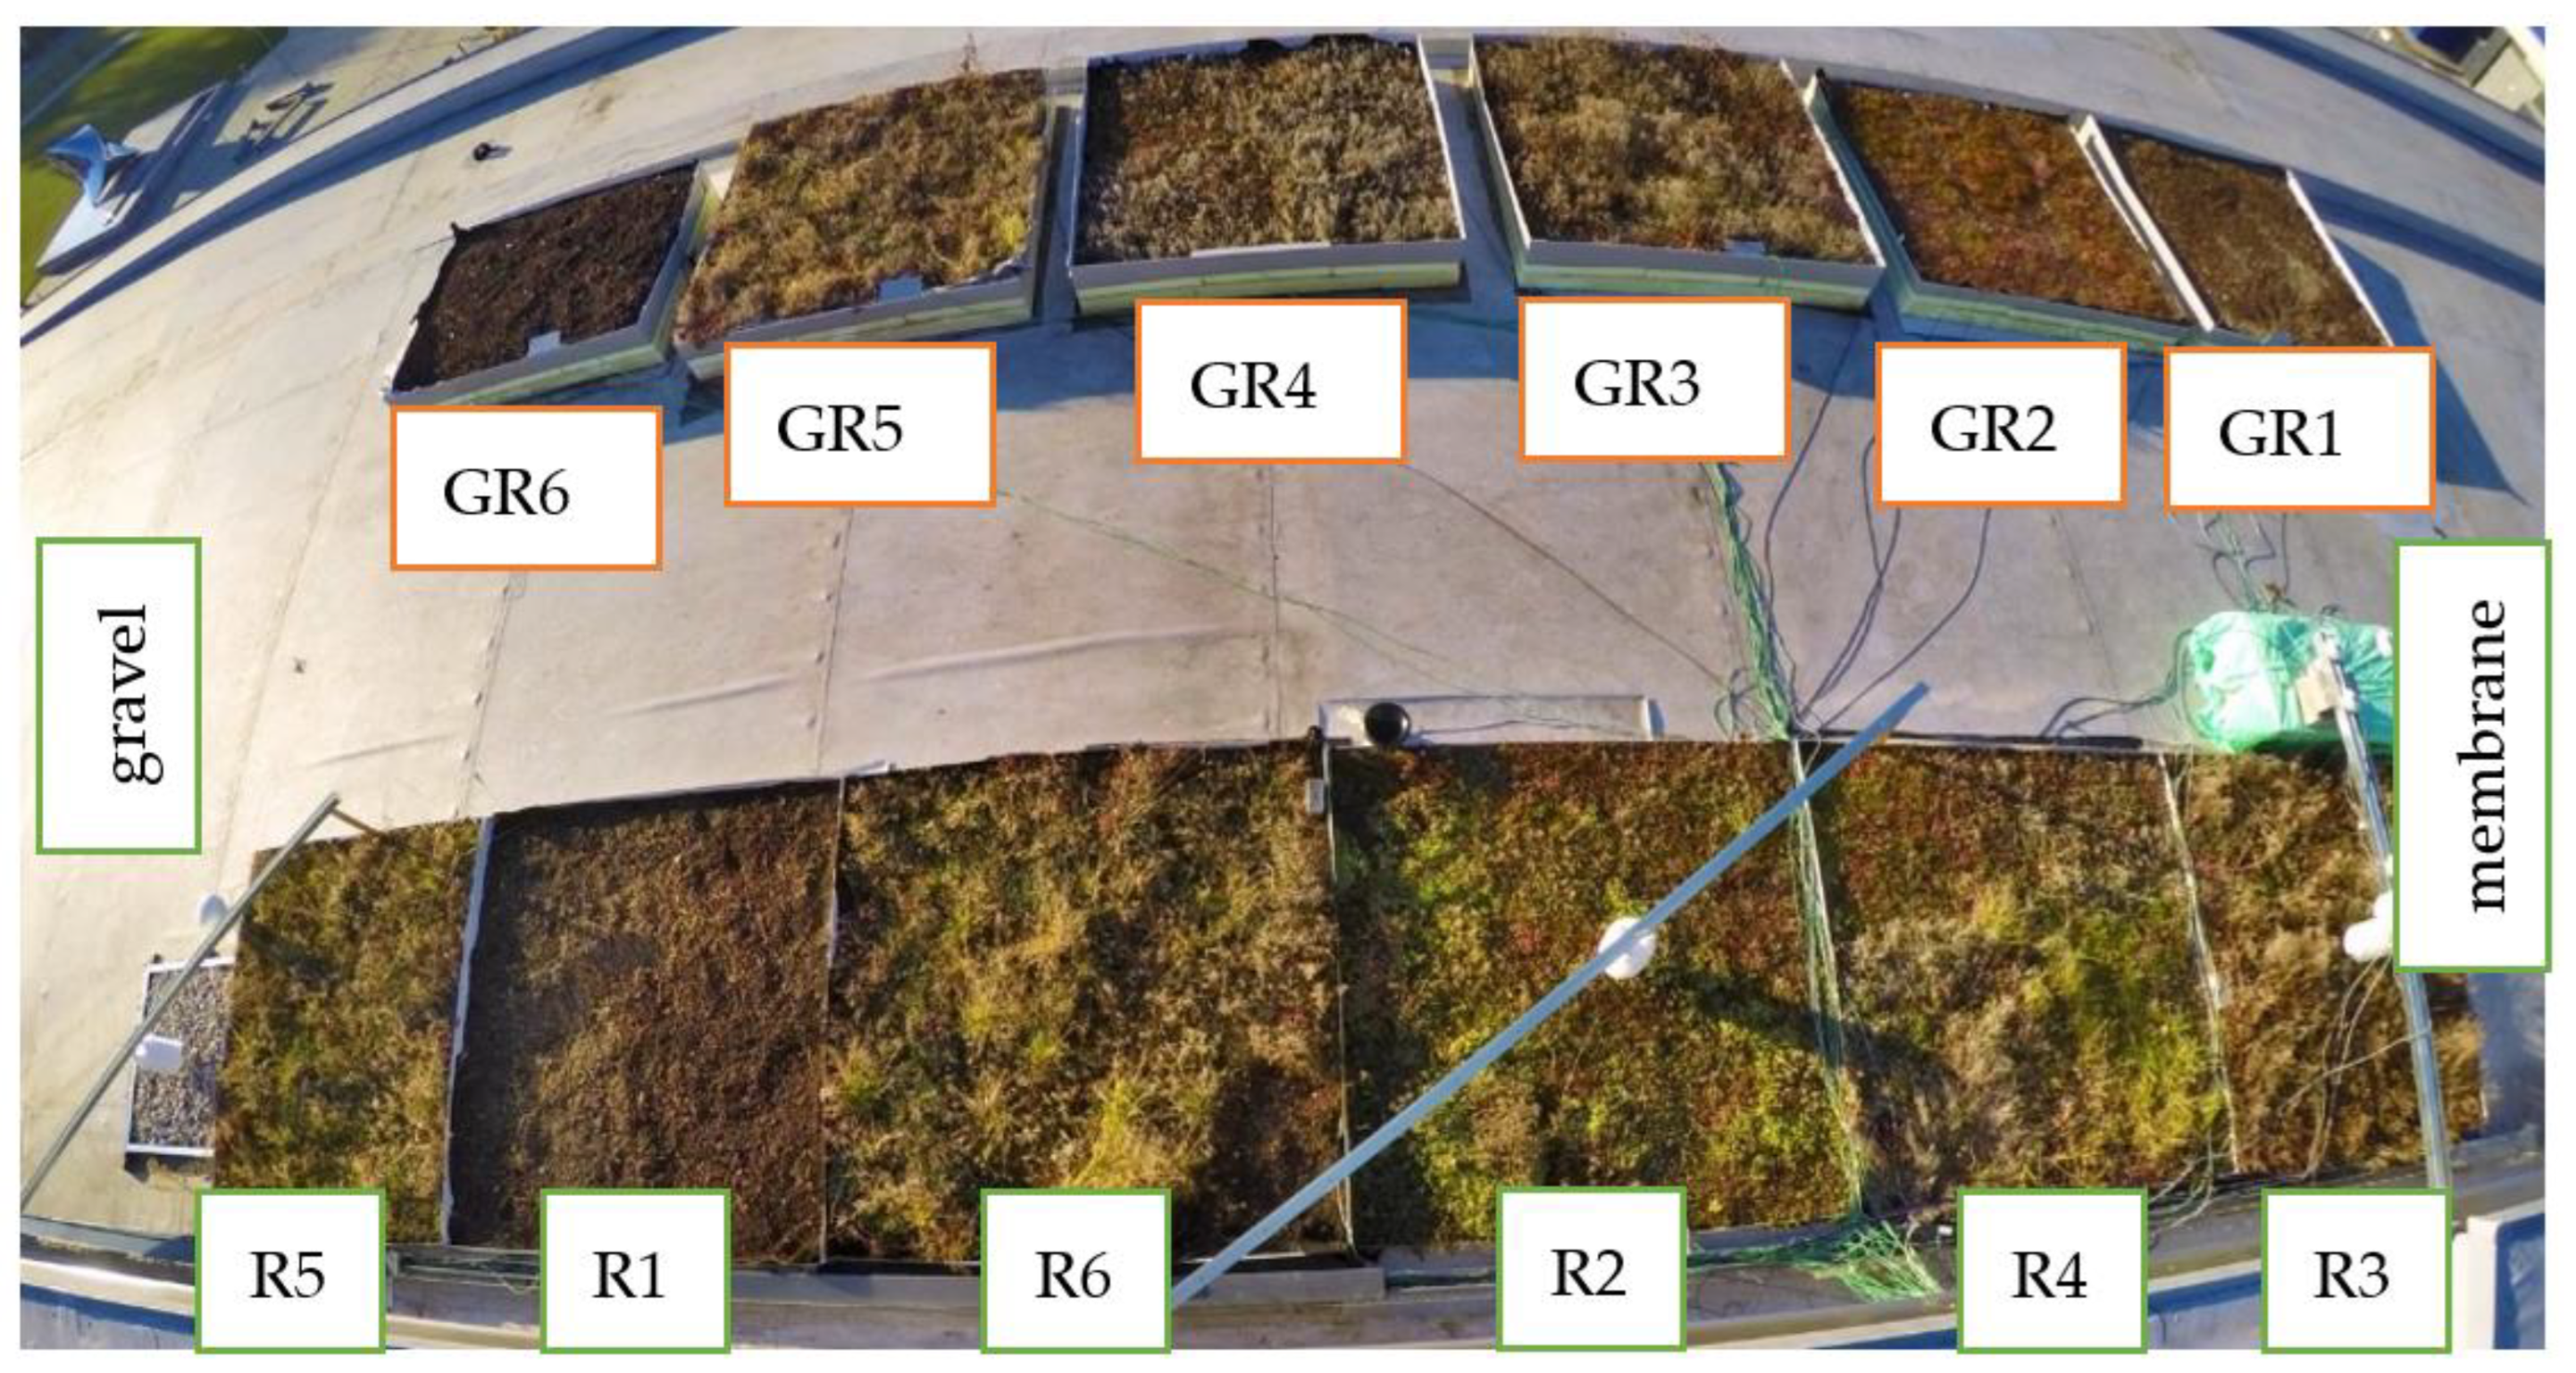
We conducted experimental measurements of samples on the roof of the Faculty of Civil Engineering. In Figure 1, the individual segments of green roof samples are numbered. The same compositions are labeled with the same number. This arrangement creates non-continuous numbering in the bottom row.
The concept for these measurements dates back to 2019 when the single-ply roof was reconstructed. The original roof composition up to the load-carrying concrete slab was removed to construct a new single-ply flat roof. Sensirion SHT21 sensors, which combine temperature and relative humidity measurement, were installed in two points [32] during the roof’s construction phase. Direct comparisons between green roof R3 and the non-protected single-ply roof could be made. It was also possible to compare the rest of the composition to the surface and membrane temperatures required for extensive green roofs.
We assessed the calibration measurement between these two areas and the results were similar [32]. After this measurement, the construction of R3 and other samples began in the autumn of 2020. Additional compositions followed in the summer of 2021. The last samples, marked as GR1/R1 and GR6 in Figure 1, were constructed in November 2021. Unlike most of the other samples, for the vegetation was not used pre-vegetated roll/mat but the cuttings. Consequently, the surface was only partially covered with plants during the test.
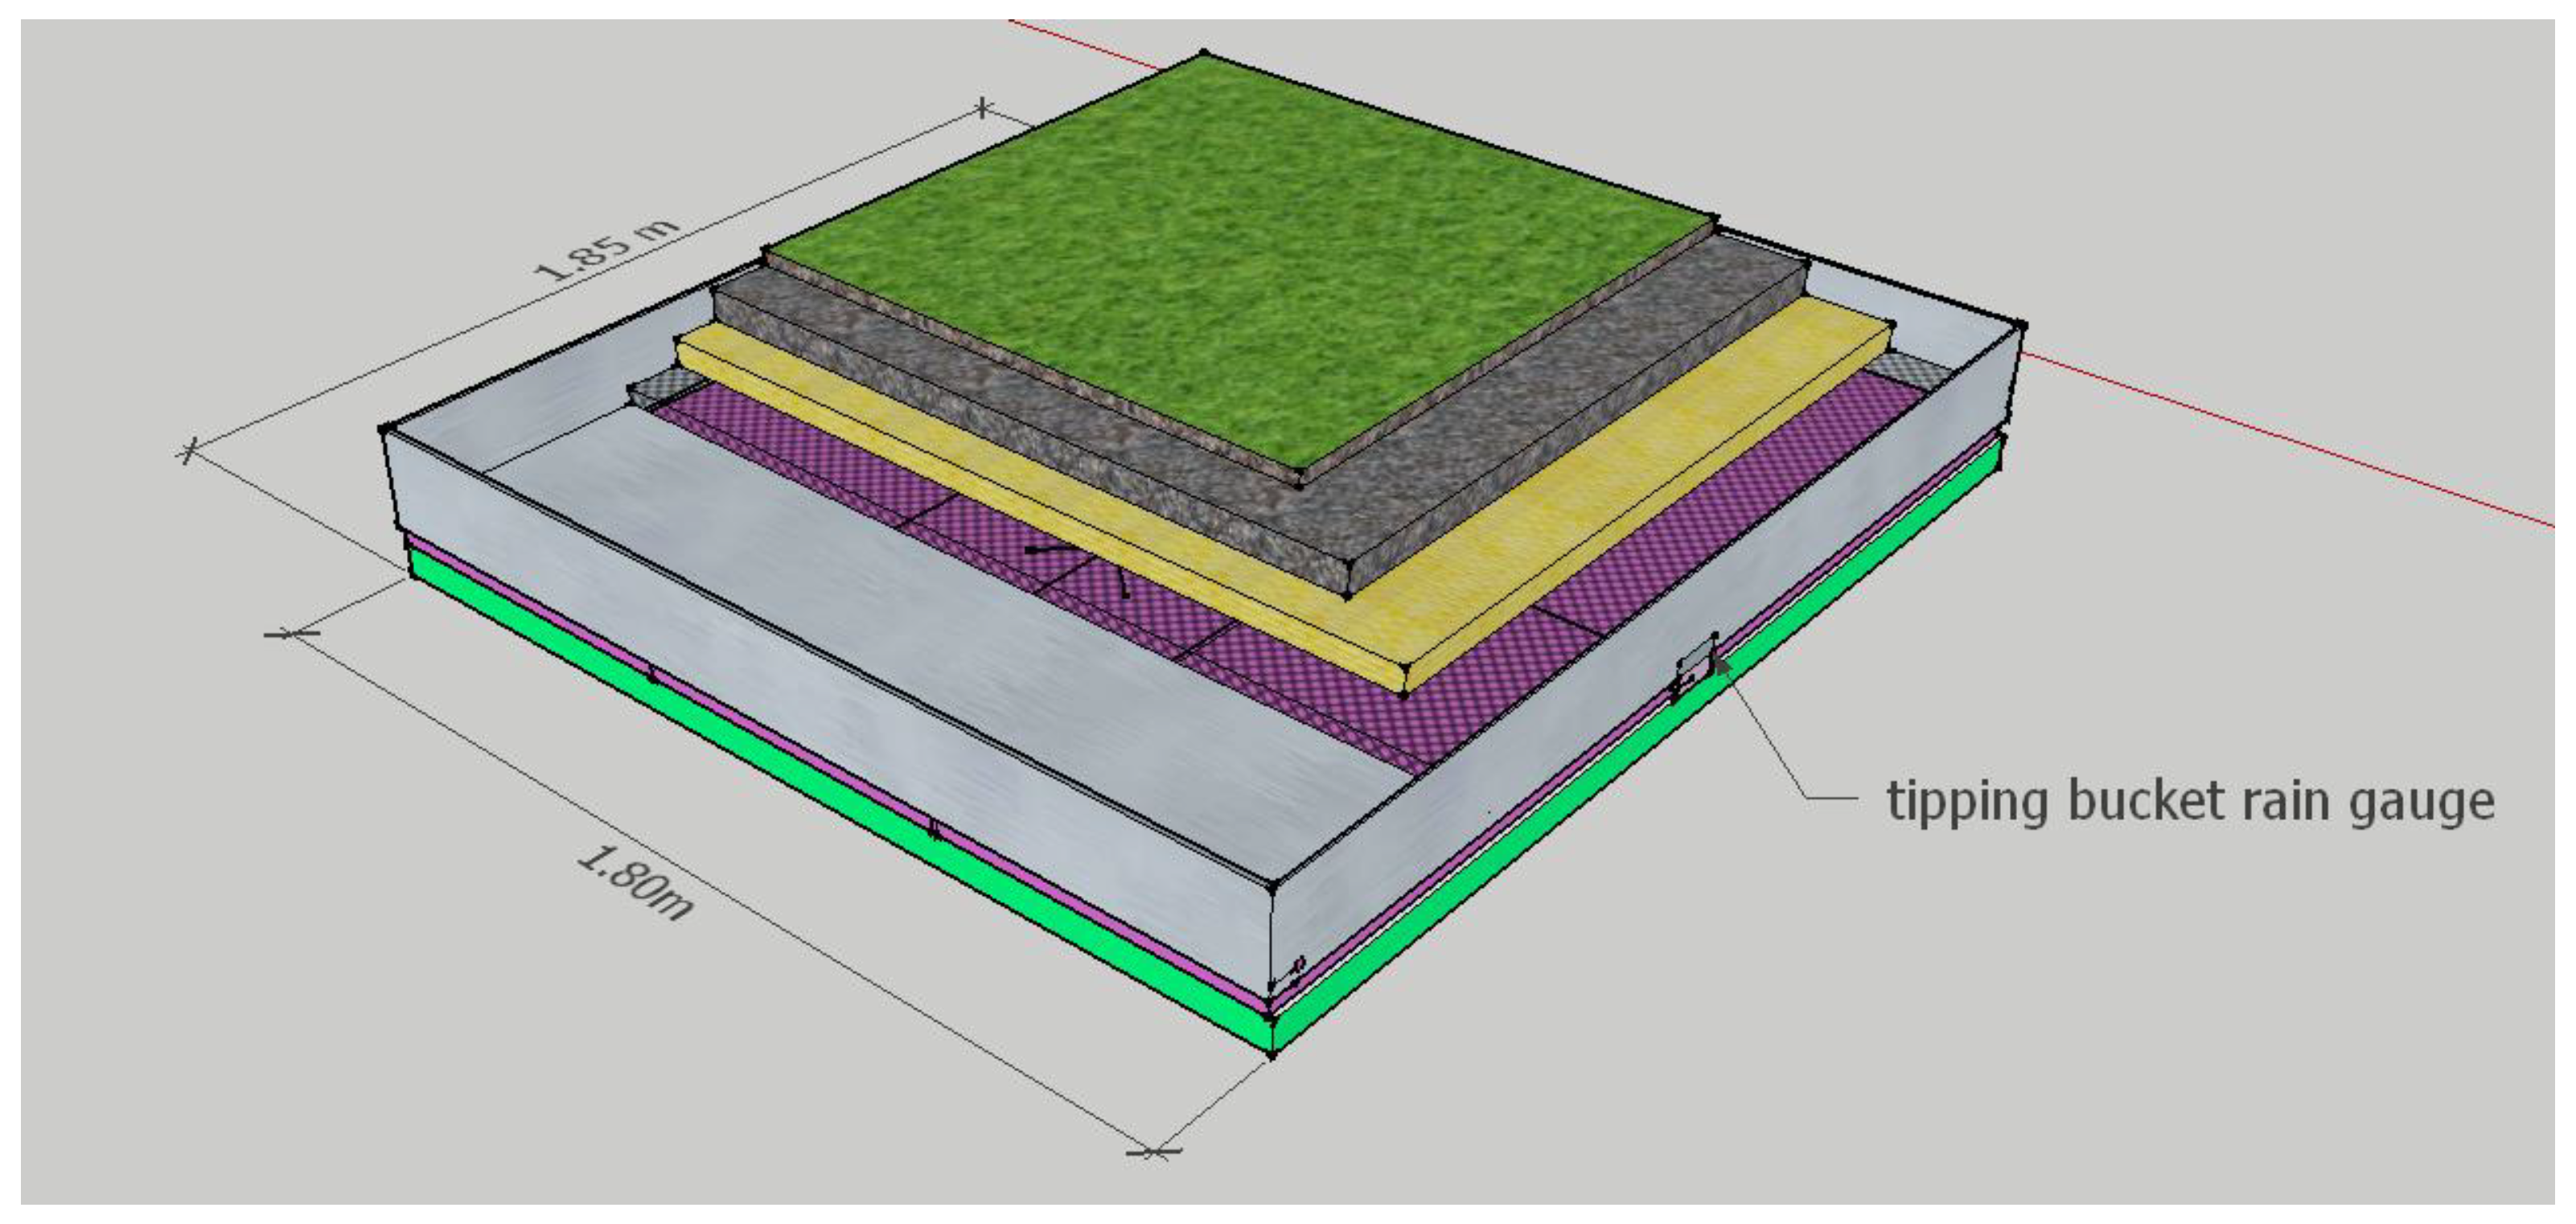
All samples were doubled to monitor the temperatures on the membrane of the roof (Figure 1—bottom row) and measure the amount of rainwater (Figure 1—upper row). These required additional pitched layers from thermal insulation, which caused a slight elevation. This method made it possible to use the tipping bucket rain gauge. The composition and sketch of the samples for water retention are shown in Figure 2. The upper row of samples was used in this test for watering or as watered samples.
All used or tested segments are commercially available on the Slovakian market (except for GR6). We followed individual sellers’ user guides during construction and maintenance.
Table 1 shows the exact compositions with different special layers. The structures measured 1.8 × 1.85 m, and the temperature was measured in the center of the sample. The first layer of samples was the root barrier, which avoids waterproof membrane leakage during measurements and creates waterproof containers for water retention measurements (Figure 2).
The main difference between the GR/R1 and GR/R2 compositions is that, in the second sample, plants were pre-vegetated into the recycled board; therefore, it was substrate-free. This system is mainly developed for green façades. Testing of the experimental façade for such types is shown in [54]. Recycled board was also used in the first sample, but without the plants. The substrate was situated on the board. The sedum plants required some time to grow; therefore, the foliage cover of the sample was minimal during the test.
To keep the thickness of the composition as low as possible on the extensive green roof, we used mineral wool to reduce the substrate thickness (GR/R3, 5, and GR6). The GR/R4 and R6 had more substrate, and no mineral wool was used. All samples of GR and R with the same numbers had the same compositions above the membrane, except for the sixth sample (Table 1).
Sheathed thermocouples and PT100 sensors within the samples, suitable for measuring water, were built in several positions. We used either the position on or below the membrane. Some positions were doubled by both sensor types for comparison. In the R3 sample, the sensor was under a waterproof membrane. Fluke Hydra with one-minute recording intervals served as data loggers for the sensors built into the green roof structures. Temperature and relative humidity sensors built into the flat roof under the membrane were connected to a Raspberry PI. The same one-minute recording intervals were used, capturing the quick rise and drop in surface temperatures accurately. The weather station is situated on the roof of the next building on the campus [49,55] to record the outdoor climate.
The methodology of our experiment was simple. On the mornings of 9 August and 3 September, we manually watered all elevated segments in protective containers with a hose. The watering was intensive, and the duration was based on previous experiments determined at 15 min, which was enough to reach the maximum retention capacity of simple and extensive green roofs. The retention capacity was reached once the water started to drain through the tipping bucket gauge. The water flow by watering was approx. 7 L/min, indicating 100 L per sample or 30 L per square meter of the sample. The retention capacity declared by the manufacturer was between 10 and 25 L/m2. There were differences in the retention capacity and phase shift of the water outflow. However, this paper does not analyze or focus on these differences.
3. Outdoor Climate Test Conditions
Two periods were chosen for the watering test: The first was from 8 to 15 August 2022 (Figure 3) and the second was from 1 to 7 September 2022 (Figure 4). Daily courses in outdoor air temperature and solar radiation were supplemented with calculated evapotranspiration (ET).
The Davis Vantage 2 Pro weather station calculated the ET. The exact equation was not known, but the results were similar to those for the methodology stated in [56]. The results differed by up to 10% per day. In the first measurement period, ET rates were available on 10 August. The theoretical ET, based on the actual climate, was up to 28 mm for the first watering test and up to 19 mm for the second watering test. The weather station calculated a theoretical ET in the range of 3.6–4.2 mm/day on cloudless and sunny days. If the retention capacity of the green roof was, for example, 12 L/m2, the water would evaporate in three days. Real evapotranspiration from the green roof is usually lower and ranges from 2.6 ± 1.3 mm/day to 4.8 mm/day for different green roof types [27].
4. Results and Discussion
The measurement results were divided into two parts: The first part measured the membrane’s temperature for green roof sample R3 and was comparable to the non-protected membrane and the one with gravel protection. This measurement was performed to show the green roof’s impact on the temperature course. The second part measured courses of membrane temperatures after watering in following days.
4.1. Temperature Measurement of Non-Covered Membrane, Gravel Protected Membrane, and Green Roof R3
Figure 5 shows the results of the first watering test. Figure 6 shows the results of the second watering test. The green roof R3 was not watered; therefore, the results did not display evapotranspiration effects, based on the lack of rainfall and the roof’s limited water retention. This phenomenon occurred at the end of the testing period, where the phase shift between the air temperature and green roof temperature was reduced by approx. 3 h on 9 and 10 August to 1.5 h on 15 August.
Figure 6 shows temperature courses during the second watering test. Although the non-protected membrane temperatures were lower than those in the August period, the green roof had higher maximum temperatures than outdoor air (e.g., 2 September). The phase shift was between 2 and 3 h based on actual weather.
For test periods (Figure 5 and Figure 6), the green roof had clear advantages in maximum temperatures and daily amplitudes. The maximum temperature for non-protected membranes was up to 60 °C, whereas the gravel-protected membrane was 47 °C. The usual green roof´s membrane reached temperatures below 30 °C (14 and 15.8) or even 23 °C (12.8). The gravel slightly reduced the maximum and minimum temperatures compared to the unprotected roof. However, the course was moved more to the right, maintaining the accumulated heat in the evening. At 22:00 local time (times in graphs are in UTC, which is 2 h behind local time), the grave-protected membrane was still around 30 °C.
The daily amplitude confirmed temperature stabilization. The non-protected membrane amplitude was >50 °C, the gravel-protected membrane was >30 °C, and the green roof membrane was somewhere between 10 and 15 °C. These findings support the fact that simply extensive green roof compositions can reduce the temperature load of the membrane and protect it against UV and solar radiation, which should extend the membrane’s durability significantly. On the other hand, the gravel-protected membrane had lower temperatures. However, the gravel retains the accumulated heat and contributes to the UHI effect by radiating it back at night.
4.2. Watering Test
As mentioned before, the watering test was repeated. Consequently, the measurement was conducted in situ using the outdoor climate. The results might not have been identical, but should have the same pattern. Figure 7 shows the membrane temperature courses for the first watering test. Figure 8 shows the second watering test courses.
Our results are summarized in two tables. Table 2 and Table 3 show the first watering event. In Table 2, minimum, maximum, and average temperatures on the second day after watering are presented. Table 3 shows the time period after watering (starting at 10:00 of watering day). The different section/composition results are influenced by the actual foliage cover of the sample, type of water retention layer, and substrate/mineral wool use. The same representation of the results is for the second watering event.
4.2.1. First Test
The highest impact of watering on temperature was on the first sample, which contained small sedum plants covering its surface. Therefore, its protective abilities were significantly limited. The soil color also had higher solar radiation absorption, which overheated the composition. According to [11], a higher foliage percentage from sedum cuttings takes approximately four years (four years is maximum, which could be also earlier). The second highest impact of watering was on the second sample, which consisted of a recycled board with rooted plants on the surface. This composition limited the vegetation height, which was short and had some moss. The third most influenced sample was GR3. It had a built-in plastic water retention and drainage board with a solid retention capacity of up to 9 L/m2.
This fact supports retention because the board does not change its capacity with time and weather conditions such as substrate, plants, or mineral wool. A similar board with a lower retention capacity was used in sample GR5. Slight, visible differences appeared in GR4, which only had a fabric mat as the drainage board (visible in the last figure of Table 1) and soil substrate. The duration of the change and the composition’s actual water content influenced the courses for only two days. The rest of the monitored days were almost a perfect match in both samples.
This observation was also valid for the R/GR5 sample, where a slight difference was visible for two days. Then, the watered and non-watered courses matched each other. Samples GR6 and R6 were not identical, but their courses were similar, and the irrigation effect was minor. The three samples with the highest differences, e.g., R/GR1, reduced the amplitude from 14 to 7, which lasted until the end of the monitoring period. The R/GR3 sample’s amplitude reduction was long and ranged from 9 to 5 °C.
4.2.2. Second Test
When the watering test was performed a second time, the impact was higher in all tested roof compositions. The highest difference was in the case of R/GR3, where the amplitude was reduced from 16 to 6 °C. The second highest was R/GR2, with an amplitude reduction from 15 to 7 °C (second day—sunny day after watering). The first sample with small foliage ranked third this time. The rest of the samples showed a higher impact, with the watering impact lasting longer than the monitored period in some cases. In other words, the remaining water was still in the composition. The shortest time, where both courses appeared similar, was for R/GR1 and R/GR4. The fourth day (6 September) was without a significant reduction.
On the other hand, differences were detected between R/GR2 and R/GR3. On the last monitored day (Figure 8), the amplitude of the second sample reduced from 13 to 7 °C and from 13 to 5 °C of the third sample.
Differences in the previous test could have resulted from different water content at the start of the experiment. The weather was also less hot than in the August period. Temperature courses were coupled with the water retention and water content of the samples depending on the outdoor climate. The climate was perfectly described by theoretical evaporation. We obtained similar results to [27], where the daily evapotranspiration for various green roofs was from 2.6 ± 1.3 mm/day to 4.8 mm/day. Our results showed that water content influenced the courses for several days, unlike the results in another study [19], where the courses matched after 12 h.
5. Conclusions
In this paper, we analyzed the impact of green roof compositions between non-protected PVC roof membranes and gravel-covered membranes. We also measured the influence of water content on extensive green roof samples. We compared five identical samples and one almost identical sample. The same test was conducted twice to enhance our results: once in August and again in September. Here is a summary of our results for different membrane covers:
- -
- The highest maximum temperatures for non-protected membranes were up to 60 °C, 47 °C for gravel-protected membranes, and <30 °C for green roof R3.
- -
- The daily amplitudes for non-protected membranes were >50 °C, >30 °C for gravel-protected membranes, and 10–15 °C for green roofs membranes.
- -
- Gravel-protected roofs had slightly reduced maximal and minimal temperatures compared to unprotected roofs. However, the course was moved more to the right, retaining the accumulated heat in the evening and contributing to the UHI effect.
- -
- The green roof’s membrane temperature course was close to the outdoor air temperature. Therefore, if some water was in the composition, temperatures were lower.
- -
- The green roof’s membrane was well protected against UV radiation, and the temperature amplitude was significantly lower.
The results of our watering test are summarized as follows:
- -
- Actual water content in the sample influenced the initial and ending difference;
- -
- Foliage (plants) coverage is important;
- -
- Using a retention and drainage layer fabricated from profiled plastic board is important because of high practical water retention (composition GR3);
- -
- Substrate-dependent compositions for water retention are not recommended, due to their small impact and retention (limited thickness of substrate in extensive roofs).
It is important to emphasize that these results are mostly valid for extensive roofs with thin substrate layers. Other researchers have found that in green roofs with higher substrates, almost no rainwater reaches the membrane in dry summers and during summer heat. Consequently, the substrate serves as the main retention layer [35].
The gravel-protected roofs had slightly reduced maximum and minimum membrane temperatures compared to unprotected roofs. However, the course was moved more to the right, retaining the accumulated heat in the evening. At 22:00 local time (time in graphs is Coordinated Universal Time (UTC), which is 2 h behind local time), the gravel-protected membrane still had a temperature of around 30 °C. Since gravel-protected membranes contribute to the UHI effect, gravel is not recommended.
During the building phase of the green roof, watering was necessary to root plants from the pre-vegetated mat or cuttings into the substrate. This process required watering for more than two weeks. All samples on the test roof were well beyond this phase. Most of the green roof compositions survived more than two complete years. With climate change, taking roots could be problematic in some locations, even in Central Europe. A longer period is needed to obtain sufficient foliage cover after using cuttings for the vegetation layer [11]. Most producers recommend using a drip irrigation system. As our research confirmed, the water content in the structure could improve the benefits of the green roof [8,30]. The weather station calculated the ET and the methodology presented in [56]. The differences between the temperature courses after watering correlated with the evapotranspiration calculated in [27].
This measurement had some limitations and flaws. The row of samples for temperature measurement (bottom row) was in the shade during the morning for approx. 2 h more than the water retention row (upper row) (Figure 1). This discrepancy represents the everyday reality because almost every roof is partly shaded during the day. The upper row may be considered the worst-case scenario, whereas the bottom one is normal. During the long dry phase, the difference between plants was slightly visible. Another problem was the tipping capacity of the rain gauges, where the drainage outflow was too high after reaching retention capacity.
As mentioned before, samples R/GR1 and GR6 had almost no foliage cover, which influenced the measurement results. In the future, we will repeat the test with higher foliage cover. More aspects of the practical retention test outcome will also be published.
Funding
This research and APC was funded by Slovak Scientific Grant Agency (VEGA) grant number 1/0673/20 and Cultural and Educational Grant Agency (KEGA) of the Ministry of Education, Science, Research and Sport of the Slovak Republic grant number 023ŽU-4/2023.
Data Availability Statement
The data presented in this study are available on request from the corresponding author.
Conflicts of Interest
The author declares no conflict of interest. The funders had no role in the design of the study; in the collection, analyses, or interpretation of data; in the writing of the manuscript, or in the decision to publish the results.
References
- Bevilacqua, P. The Effectiveness of Green Roofs in Reducing Building Energy Consumptions across Different Climates. A Summary of Literature Results. Renew. Sustain. Energy Rev. 2021, 151, 111523. [Google Scholar] [CrossRef]
- Zhang, S.; Lin, Z.; Zhang, S.; Ge, D. Stormwater Retention and Detention Performance of Green Roofs with Different Substrates: Observational Data and Hydrological Simulations. J. Environ. Manag. 2021, 291, 112682. [Google Scholar] [CrossRef]
- Yan, J.; Zhang, S.; Zhang, J.; Zhang, S.; Zhang, C.; Yang, H.; Wang, R.; Wei, L. Stormwater Retention Performance of Green Roofs with Various Configurations in Different Climatic Zones. J. Environ. Manag. 2022, 319, 115447. [Google Scholar] [CrossRef]
- Abdul Khadir, F.K.; Yee, N.C.; Takaijudin, H.B.; Zawawi, N.A.; Alaloul, W.S.; Musarat, M.A. Evaluation of the Implementation of Sustainable Stormwater Management Practices for Landed Residential Areas: A Case Study in Malaysia. Sustainability 2023, 15, 10414. [Google Scholar] [CrossRef]
- Palermo, S.A.; Turco, M.; Principato, F.; Piro, P. Hydrological Effectiveness of an Extensive Green Roof in Mediterranean Climate. Water (Switzerland) 2019, 11, 1378. [Google Scholar] [CrossRef] [Green Version]
- Talebi, A.; Bagg, S.; Sleep, B.E.; O’Carroll, D.M. Water Retention Performance of Green Roof Technology: A Comparison of Canadian Climates. Ecol. Eng. 2019, 126, 1–15. [Google Scholar] [CrossRef]
- Monteiro, C.M.; Santos, C.; Castro, P.M.L. Extensive Green Roofs: Different Time Approaches to Runoff Coefficient Determination. Water 2023, 15, 1852. [Google Scholar] [CrossRef]
- Sun, T.; Bou-Zeid, E.; Ni, G.H. To Irrigate or Not to Irrigate: Analysis of Green Roof Performance via a Vertically-Resolved Hygrothermal Model. Build. Environ. 2014, 73, 127–137. [Google Scholar] [CrossRef]
- Ascione, F.; Bianco, N.; de’ Rossi, F.; Turni, G.; Vanoli, G.P. Green Roofs in European Climates. Are Effective Solutions for the Energy Savings in Air-Conditioning? Appl. Energy 2013, 104, 845–859. [Google Scholar] [CrossRef]
- Heusinger, J.; Weber, S. Surface Energy Balance of an Extensive Green Roof as Quantified by Full Year Eddy-Covariance Measurements. Sci. Total Environ. 2017, 802, 149698. [Google Scholar] [CrossRef]
- Schröder, R.; Kiehl, K. Extensive Roof Greening with Native Sandy Dry Grassland Species: Effects of Different Greening Methods on Vegetation Development over Four Years. Ecol. Eng. 2020, 145, 105728. [Google Scholar] [CrossRef]
- Yıldırım, S.; Özburak, Ç.; Özden, Ö. Green Roofs, Vegetation Types, Impact on the Thermal Effectiveness: An Experimental Study in Cyprus. Sustainability 2023, 15, 2807. [Google Scholar] [CrossRef]
- Bevilacqua, P.; Coma, J.; Pérez, G.; Chocarro, C.; Juárez, A.; Solé, C.; De Simone, M.; Cabeza, L.F. Plant Cover and Floristic Composition Effect on Thermal Behaviour Ofextensive Green Roofs. Build. Environ. 2015, 92, 305–316. [Google Scholar] [CrossRef] [Green Version]
- Walters, S.A.; Gajewski, C.; Sadeghpour, A.; Groninger, J.W. Mitigation of Climate Change for Urban Agriculture: Water Management of Culinary Herbs Grown in an Extensive Green Roof Environment. Climate 2022, 10, 180. [Google Scholar] [CrossRef]
- Ouldboukhitine, S.E.; Belarbi, R.; Djedjig, R. Characterization of Green Roof Components: Measurements of Thermal and Hydrological Properties. Build. Environ. 2012, 56, 78–85. [Google Scholar] [CrossRef]
- Pianella, A.; Clarke, R.E.; Williams, N.S.G.; Chen, Z.; Aye, L. Steady-State and Transient Thermal Measurements of Green Roof Substrates. Energy Build. 2016, 131, 123–131. [Google Scholar] [CrossRef]
- Malcolm, E.G.; Reese, M.L.; Schaus, M.H.; Ozmon, I.M.; Tran, L.M. Measurements of Nutrients and Mercury in Green Roof and Gravel Roof Runoff. Ecol. Eng. 2014, 73, 705–712. [Google Scholar] [CrossRef]
- Kazemi, M.; Courard, L.; Attia, S. Water Permeability, Water Retention Capacity, and Thermal Resistance of Green Roof Layers Made with Recycled and Artificial Aggregates. Build. Environ. 2023, 227, 109776. [Google Scholar] [CrossRef]
- Simões, N.; Almeida, R.; Tadeu, A.; Brett, M.; Almeida, J. Comparison between Cork-Based and Conventional Green Roof Solutions. Build. Environ. 2020, 175, 106812. [Google Scholar] [CrossRef]
- Tadeu, A.; Simões, N.; Almeida, R.; Manuel, C. Drainage and Water Storage Capacity of Insulation Cork Board Applied as a Layer on Green Roofs. Constr. Build. Mater. 2019, 209, 52–65. [Google Scholar] [CrossRef]
- Kostadinović, D.; Jovanović, M.; Bakić, V.; Stepanić, N.; Todorović, M. Experimental Investigation of Summer Thermal Performance of the Green Roof System with Mineral Wool Substrate. Build. Environ. 2022, 217, 109061. [Google Scholar] [CrossRef]
- Arkar, C.; Domjan, S.; Medved, S. Heat Transfer in a Lightweight Extensive Green Roof under Water-Freezing Conditions. Energy Build. 2018, 167, 187–199. [Google Scholar] [CrossRef]
- Schweitzer, O.; Erell, E. Evaluation of the Energy Performance and Irrigation Requirements of Extensive Green Roofs in a Water-Scarce Mediterranean Climate. Energy Build. 2014, 68, 25–32. [Google Scholar] [CrossRef]
- Cascone, S.; Coma, J.; Gagliano, A.; Pérez, G. The Evapotranspiration Process in Green Roofs: A Review. Build. Environ. 2019, 147, 337–355. [Google Scholar] [CrossRef]
- Kubilay, A.; Allegrini, J.; Strebel, D.; Zhao, Y.; Derome, D.; Carmeliet, J. Advancement in Urban Climate Modelling at Local Scale: Urban Heat Island Mitigation and Building Cooling Demand. Atmosphere (Basel) 2020, 11, 1313. [Google Scholar] [CrossRef]
- Wang, Y.; Akbari, H. Analysis of Urban Heat Island Phenomenon and Mitigation Solutions Evaluation for Montreal. Sustain. Cities Soc. 2016, 26, 438–446. [Google Scholar] [CrossRef]
- Gößner, D.; Mohri, M.; Krespach, J.J. Evapotranspiration Measurements and Assessment of Driving Factors: A Comparison of Different Green Roof Systems during Summer in Germany. Land 2021, 10, 1334. [Google Scholar] [CrossRef]
- Gülten, A.; Aksoy, U.T.; Öztop, H.F. Influence of Trees on Heat Island Potential in an Urban Canyon. Sustain. Cities Soc. 2016, 26, 407–418. [Google Scholar] [CrossRef]
- Li, H.; Zhao, Y.; Sützl, B.; Kubilay, A.; Carmeliet, J. Impact of Green Walls on Ventilation and Heat Removal from Street Canyons: Coupling of Thermal and Aerodynamic Resistance. Build. Environ. 2022, 214, 108945. [Google Scholar] [CrossRef]
- Freudenberg, P.; Hänicke, P.; Kuzmanovska, J. Hygrothermal Performance of Simple Intensive Green Roofs with Different Irrigation Schemes. In Proceedings of the Conference: 13th Nordic Symposium on Building Physics, Aalborg, Denmark, 12–14 June 2023. [Google Scholar]
- Juras, P. Positive Aspects of Green Roof Reducing Energy Consumption in Winter. Energies 2022, 15, 1493. [Google Scholar] [CrossRef]
- Juras, P. Introduction to the Green Roof Research. In International Conference on Russian-Polish-Slovak Seminar Theoretical Foundation of Civil Engineering; Lecture Notes in Civil Engineering; Springer International Publishing: Cham, Switzerland, 2022. [Google Scholar]
- Vertaľ, M.; Zozulák, M.; Vašková, A.; Korjenic, A. Hygrothermal Initial Condition for Simulation Process of Green Building Construction. Energy Build. 2018, 167, 166–176. [Google Scholar] [CrossRef]
- Zhao, M.; Srebric, J.; Berghage, R.D.; Dressler, K.A. Accumulated Snow Layer Influence on the Heat Transfer Process through Green Roof Assemblies. Build. Environ. 2015, 87, 82–91. [Google Scholar] [CrossRef]
- Daouas, N. Impact of External Longwave Radiation on Optimum Insulation Thickness in Tunisian Building Roofs Based on a Dynamic Analytical Model. Appl. Energy 2016, 177, 136–148. [Google Scholar] [CrossRef]
- Schade, J.; Lidelöw, S.; Lönnqvist, J. The Thermal Performance of a Green Roof on a Highly Insulated Building in a Sub-Arctic Climate. Energy Build. 2021, 241, 110961. [Google Scholar] [CrossRef]
- Stöckl, B.; Zirkelbach, D.; Künzel, H.M. Hygrothermal Simulation of Green Roofs-New Models and Practical Application. In Proceedings of the Nordic Symposium on Building Physics (NSB), Lund, Sweden, 15–19 June 2014. [Google Scholar]
- Smalls-Mantey, L.; Montalto, F. The Seasonal Microclimate Trends of a Large Scale Extensive Green Roof. Build. Environ. 2021, 197, 107792. [Google Scholar] [CrossRef]
- Vera, S.; Pinto, C.; Tabares-Velasco, P.C.; Bustamante, W.; Victorero, F.; Gironás, J.; Bonilla, C.A. Influence of Vegetation, Substrate, and Thermal Insulation of an Extensive Vegetated Roof on the Thermal Performance of Retail Stores in Semiarid and Marine Climates. Energy Build. 2017, 146, 312–321. [Google Scholar] [CrossRef]
- Getter, K.L.; Rowe, D.B.; Andresen, J.A.; Wichman, I.S. Seasonal Heat Flux Properties of an Extensive Green Roof in a Midwestern U.S. Climate. Energy Build. 2011, 43, 3548–3557. [Google Scholar] [CrossRef]
- Yang, Y.; Davidson, C.I.; Zhang, J. Evaluation of Thermal Performance of Green Roofs via Field Measurements and Hygrothermal Simulations. Energy Build. 2021, 237, 110800. [Google Scholar] [CrossRef]
- Lee, L.S.H.; Jim, C.Y. Thermal-Irradiance Behaviours of Subtropical Intensive Green Roof in Winter and Landscape-Soil Design Implications. Energy Build. 2020, 209, 109692. [Google Scholar] [CrossRef]
- Klein, P.M.; Coffman, R. Establishment and Performance of an Experimental Green Roof under Extreme Climatic Conditions. Sci. Total Environ. 2015, 512–513, 82–93. [Google Scholar] [CrossRef]
- Wei, T.; Jim, C.Y.; Chen, A.; Li, X. A Random Effects Model to Optimize Soil Thickness for Green-Roof Thermal Benefits in Winter. Energy Build. 2021, 237, 110827. [Google Scholar] [CrossRef]
- Besir, A.B.; Cuce, E. Green Roofs and Facades: A Comprehensive Review. Renew. Sustain. Energy Rev. 2018, 82, 915–939. [Google Scholar] [CrossRef]
- Vertal, M. Experimentálna Vegetačná Strecha s Biodiverzným Potenciálom. Strechy Fasády Izol 2020, 11, 12. (In Slovak) [Google Scholar]
- Ponechal, R. Increasing Thermal Mass in Low Carbon Dwelling. Procedia Eng. 2015, 111, 645–651. [Google Scholar] [CrossRef] [Green Version]
- Ponechal, R.; Staffenova, D. Impact of External Wall Insulation Thickness on Internal Surface Temperature Behaviour. In MATEC Web of Conferences; EDP Sciences: Les Ulis, France, 2017; Volume 117, p. 00140. [Google Scholar]
- Juras, P.; Jurasova, D. Outdoor Climate Change Analysis in University Campus: Case Study with Heat-Air-Moisture Simulation. Civ. Environ. Eng. 2020, 16, 370–378. [Google Scholar] [CrossRef]
- Jurasova, D. Numerical Analysis of Outdoor Climate Conditions Based on the 3-Years Measurement for Zilina. Proc. IOP Conf. Ser. Mater. Sci. Eng. 2018, 415, 012025. [Google Scholar] [CrossRef]
- Evins, R.; Dorer, V.; Carmeliet, J. Simulating External Longwave Radiation Exchange for Buildings. Energy Build. 2014, 75, 472–482. [Google Scholar] [CrossRef]
- Research of the Formation of Extensive Green Roofs. Available online: https://www.uceeb.cz/en/research-of-the-formation-of-extensive-green-roofs/ (accessed on 26 June 2023).
- Petreje, M.; Sněhota, M.; Chorazy, T.; Novotný, M.; Rybová, B.; Hečková, P. Performance Study of an Innovative Concept of Hybrid Constructed Wetland-Extensive Green Roof with Growing Media Amended with Recycled Materials. J. Environ. Manag. 2023, 331, 117151. [Google Scholar] [CrossRef]
- Juras, P.; Durica, P. Measurement of the Green Façade Prototype in a Climate Chamber: Impact of Watering Regime on the Surface Temperatures. Energies 2022, 15, 2459. [Google Scholar] [CrossRef]
- Jurasova, D. Analysis of Long-Term Measured Exterior Air Temperature in Zilina. Civ. Environ. Eng. 2018, 14, 124–131. [Google Scholar] [CrossRef] [Green Version]
- Bakhshoodeh, R.; Ocampo, C.; Oldham, C. Evapotranspiration Rates and Evapotranspirative Cooling of Green Façades under Different Irrigation Scenarios. Energy Build. 2022, 270, 112223. [Google Scholar] [CrossRef]
Figure 1.
View of test site. The same segment compositions are marked with the same number (picture from October 2021). The upper row was watered, whereas the bottom row was dry.
Figure 1.
View of test site. The same segment compositions are marked with the same number (picture from October 2021). The upper row was watered, whereas the bottom row was dry.

Figure 2.
The scheme of the container for water retention measurement. The container consists of an elevated enclosed wall, a plastic-coated plate, and a membrane. There is an extra layer of XPS board to create a pitch for drainage with a tipping bucket gauge. The same composition is created inside the container as the one that is directly placed on the roof membrane with the same sample number.

Figure 3.
Outdoor climate conditions during the first watering test from 8 to 15 August 2022. Evapotranspiration rates were only available on 10 August. Sunny weather with some semi-cloudy days (13 and 14 August).
Figure 3.
Outdoor climate conditions during the first watering test from 8 to 15 August 2022. Evapotranspiration rates were only available on 10 August. Sunny weather with some semi-cloudy days (13 and 14 August).

Figure 4.
Outdoor climate conditions during the second watering test from 1 to 7 September 2022. Cloudy weather on 4 September, semi-cloudy on 6 September.
Figure 4.
Outdoor climate conditions during the second watering test from 1 to 7 September 2022. Cloudy weather on 4 September, semi-cloudy on 6 September.

Figure 5.
Daily temperature courses for the membrane and outdoor air during the first watering test. The green roof was not watered. The green roof course had maximal temperatures close to outdoor air at the end of the test period, and the phase shift was lowered.
Figure 5.
Daily temperature courses for the membrane and outdoor air during the first watering test. The green roof was not watered. The green roof course had maximal temperatures close to outdoor air at the end of the test period, and the phase shift was lowered.

Figure 6.
Daily temperature courses for the membrane and outdoor air during the second watering test. The green roof was not watered. The green roof course had maximum temperatures similar or higher than outdoor air.
Figure 6.
Daily temperature courses for the membrane and outdoor air during the second watering test. The green roof was not watered. The green roof course had maximum temperatures similar or higher than outdoor air.

Figure 7.
First (August) watering test. The membranes’ temperature courses for watered and non-watered green roof compositions (segments). Watering was performed during the second day and there was a sudden rise in temperature by the morning.
Figure 7.
First (August) watering test. The membranes’ temperature courses for watered and non-watered green roof compositions (segments). Watering was performed during the second day and there was a sudden rise in temperature by the morning.

Figure 8.
Second (September) watering test. The membranes’ temperature courses for watered and non-watered green roof compositions (segments). Watering was performed during the second day and there was a sudden rise in temperature by the morning.
Figure 8.
Second (September) watering test. The membranes’ temperature courses for watered and non-watered green roof compositions (segments). Watering was performed during the second day and there was a sudden rise in temperature by the morning.


Table 1.
Numbering and exact composition of the green roof samples. Visible layers are bold.
| Name | Composition | Thickness (mm) | Figure |
|---|---|---|---|
| GR1 | sedum plants cuttings | - |  |
| substrate | 30 | ||
| recycled board | 50 | ||
| geotextile | - | ||
| GR2 | pre-vegetated plants rooted into the recycled board | 50 |  |
| geotextile | - | ||
| GR3 | pre-vegetated roll | 40 |  |
| mineral wool board | 40 | ||
| hard plastic profiled water retention board (cup style board) | 10 | ||
| GR4 | pre-vegetated roll | 40 |  |
| substrate | 30 | ||
| geotextile | - | ||
| profiled drainage mat | 25 | ||
| GR5 | pre-vegetated roll | 40 |  |
| substrate | 30 | ||
| mineral wool board | 50 | ||
| hard plastic profiled water retention board | 10 | ||
| GR6 | sedum plants cuttings | - |  |
| substrate | 90 | ||
| mineral wool board | 50 | ||
| profiled drainage mat | 25 | ||
| R6 | planted vegetation | 40 | |
| substrate | 90 | ||
| profiled drainage mat | 25 |
Table 2.
Measured temperatures on the second day after watering for the first watering test (courses are in Figure 7).
Table 2.
Measured temperatures on the second day after watering for the first watering test (courses are in Figure 7).
| Results of Second Day after Watering during August Watering Event—10.8 | ||||||
|---|---|---|---|---|---|---|
| AVERAGE (°C) | Sample 1 | Sample 2 | Sample 3 | Sample 4 | Sample 5 | Sample 6 |
| watered | 17.19 | 19.43 | 17.99 | 18.41 | 19.31 | 19.96 |
| non-watered | 20.30 | 19.02 | 17.50 | 18.71 | 20.03 | 19.15 |
| difference | 3.12 | −0.41 | −0.49 | 0.30 | 0.72 | −0.82 |
| MAX (°C) | Sample 1 | Sample 2 | Sample 3 | Sample 4 | Sample 5 | Sample 6 |
| watered | 19.82 | 21.78 | 19.81 | 20.69 | 21.87 | 21.61 |
| non-watered | 27.30 | 25.33 | 21.83 | 22.06 | 23.33 | 22.45 |
| difference | 7.48 | 3.56 | 2.01 | 1.36 | 1.46 | 0.83 |
| MIN (°C) | Sample 1 | Sample 2 | Sample 3 | Sample 4 | Sample 5 | Sample 6 |
| watered | 14.29 | 16.69 | 15.73 | 15.63 | 16.53 | 18.52 |
| non-watered | 14.68 | 14.61 | 13.99 | 15.82 | 16.81 | 16.16 |
| difference | 0.39 | −2.08 | −1.74 | 0.19 | 0.28 | −2.36 |
Table 3.
Measured temperatures for the time period from first watering test on 9 August to 15 August (courses are in Figure 7).
Table 3.
Measured temperatures for the time period from first watering test on 9 August to 15 August (courses are in Figure 7).
| Results of August Watering Event from 10:00 9 August to 23:59 15 August | ||||||
|---|---|---|---|---|---|---|
| AVERAGE (°C) | Sample 1 | Sample 2 | Sample 3 | Sample 4 | Sample 5 | Sample 6 |
| watered | 19.42 | 21.04 | 19.59 | 20.18 | 20.91 | 21.67 |
| non-watered | 22.17 | 20.17 | 18.82 | 20.09 | 20.98 | 20.53 |
| difference | 2.74 | −0.87 | −0.76 | −0.09 | 0.07 | −1.13 |
| MAX (°C) | Sample 1 | Sample 2 | Sample 3 | Sample 4 | Sample 5 | Sample 6 |
| watered | 19.25 | 20.86 | 19.46 | 20.04 | 20.76 | 21.54 |
| non-watered | 21.94 | 20.07 | 18.71 | 20.01 | 20.94 | 20.45 |
| difference | 2.70 | −0.80 | −0.75 | −0.03 | 0.18 | −1.10 |
| MIN (°C) | Sample 1 | Sample 2 | Sample 3 | Sample 4 | Sample 5 | Sample 6 |
| watered | 12.24 | 14.71 | 13.99 | 13.36 | 14.74 | 15.62 |
| non-watered | 14.22 | 13.08 | 12.23 | 14.60 | 15.33 | 14.97 |
| difference | 1.99 | −1.63 | −1.76 | 1.24 | 0.59 | −0.66 |
Table 4.
Measured temperatures on the second day after watering for the second watering test (courses are in Figure 8).
Table 4.
Measured temperatures on the second day after watering for the second watering test (courses are in Figure 8).
| Results of Second Day after Second Watering Test—3 September | ||||||
|---|---|---|---|---|---|---|
| AVERAGE (°C) | Sample 1 | Sample 2 | Sample 3 | Sample 4 | Sample 5 | Sample 6 |
| watered | 15.27 | 17.39 | 15.74 | 15.89 | 17.03 | 16.96 |
| non-watered | 16.44 | 16.30 | 16.21 | 16.85 | 16.84 | 16.47 |
| difference | 1.16 | −1.09 | 0.47 | 0.96 | −0.18 | −0.48 |
| MAX (°C) | Sample 1 | Sample 2 | Sample 3 | Sample 4 | Sample 5 | Sample 6 |
| watered | 20.23 | 20.84 | 18.81 | 19.66 | 19.46 | 18.32 |
| non-watered | 23.04 | 25.76 | 26.24 | 22.25 | 22.49 | 21.14 |
| difference | 2.81 | 4.92 | 7.44 | 2.59 | 3.03 | 2.83 |
| MIN (°C) | Sample 1 | Sample 2 | Sample 3 | Sample 4 | Sample 5 | Sample 6 |
| watered | 10.45 | 13.56 | 12.34 | 11.71 | 14.27 | 15.35 |
| non-watered | 10.77 | 9.96 | 9.35 | 12.39 | 12.16 | 12.28 |
| difference | 0.33 | −3.60 | −2.99 | 0.68 | −2.11 | −3.06 |
Table 5.
Measured temperatures for the second watering period from 3 September to 7 September (courses are in Figure 8).
Table 5.
Measured temperatures for the second watering period from 3 September to 7 September (courses are in Figure 8).
| Results of September Watering Event from 10:00 3 September to 23:59 7 September | ||||||
|---|---|---|---|---|---|---|
| AVERAGE (°C) | Sample 1 | Sample 2 | Sample 3 | Sample 4 | Sample 5 | Sample 6 |
| watered | 16.68 | 17.72 | 16.59 | 16.83 | 17.66 | 17.66 |
| non-watered | 17.46 | 16.88 | 16.45 | 17.27 | 17.53 | 17.18 |
| difference | 0.77 | −0.84 | −0.14 | 0.44 | −0.12 | −0.48 |
| MAX (°C) | Sample 1 | Sample 2 | Sample 3 | Sample 4 | Sample 5 | Sample 6 |
| watered | 16.63 | 17.51 | 16.52 | 16.77 | 17.51 | 17.66 |
| non-watered | 17.36 | 16.72 | 16.29 | 17.18 | 17.44 | 17.11 |
| difference | 0.73 | −0.79 | −0.22 | 0.41 | −0.07 | −0.55 |
| MIN (°C) | Sample 1 | Sample 2 | Sample 3 | Sample 4 | Sample 5 | Sample 6 |
| watered | 10.29 | 8.72 | 11.19 | 11.43 | 10.68 | 14.49 |
| non-watered | 10.77 | 9.85 | 9.32 | 11.98 | 12.16 | 12.27 |
| difference | 0.48 | 1.13 | −1.87 | 0.55 | 1.48 | −2.22 |
Disclaimer/Publisher’s Note: The statements, opinions and data contained in all publications are solely those of the individual author(s) and contributor(s) and not of MDPI and/or the editor(s). MDPI and/or the editor(s) disclaim responsibility for any injury to people or property resulting from any ideas, methods, instructions or products referred to in the content. |
© 2023 by the author. Licensee MDPI, Basel, Switzerland. This article is an open access article distributed under the terms and conditions of the Creative Commons Attribution (CC BY) license (https://creativecommons.org/licenses/by/4.0/).
Share and Cite
MDPI and ACS Style
Juras, P. Rainwater Retention Test of Various Green Roofs: Influence on Membrane Temperatures and Evapotranspiration. Buildings 2023, 13, 2058. https://0-doi-org.brum.beds.ac.uk/10.3390/buildings13082058
AMA Style
Juras P. Rainwater Retention Test of Various Green Roofs: Influence on Membrane Temperatures and Evapotranspiration. Buildings. 2023; 13(8):2058. https://0-doi-org.brum.beds.ac.uk/10.3390/buildings13082058
Chicago/Turabian StyleJuras, Peter. 2023. "Rainwater Retention Test of Various Green Roofs: Influence on Membrane Temperatures and Evapotranspiration" Buildings 13, no. 8: 2058. https://0-doi-org.brum.beds.ac.uk/10.3390/buildings13082058
Note that from the first issue of 2016, this journal uses article numbers instead of page numbers. See further details here.