
The Development of a Framework for the Automated Translation of Sketch-Based Data into BIM Models

1
Department of Architectural Engineering, Chungbuk National University, Cheongju 28644, Republic of Korea
2
Department of Civil Engineering, Gangneung-Wonju National University, Gangneung 25457, Republic of Korea
*
Author to whom correspondence should be addressed.
Buildings 2024, 14(4), 916; https://0-doi-org.brum.beds.ac.uk/10.3390/buildings14040916
Submission received: 26 February 2024
/
Revised: 20 March 2024
/
Accepted: 25 March 2024
/
Published: 27 March 2024
(This article belongs to the Special Issue Advance in BIM-Based Technologies for Sustainable Building Performance Predictions)
Abstract
:At the foundational phase of architectural design, it is of the utmost importance to precisely capture and articulate the visions and requirements of stakeholders, including building owners. This critical step ensures that professionals, including architects, can effectively translate the initial concepts into actionable designs. This research was directed towards developing a framework to facilitate the decision-making process by efficiently depicting the client’s intentions. This study demonstrates a framework that leverages deep learning to automate the creation of Building Information Modeling (BIM) models from sketched data. The framework’s methodology includes defining the necessary processes, system requirements, and data for system development, followed by the actual system implementation. It involves several key phases: (1) developing a process model to outline the framework’s operational procedures and data flows, (2) implementing the framework to translate sketched data into a BIM model through system and user interface development, and, finally, (3) validating the framework’s ability to precisely convert sketched data into BIM models. Our findings demonstrate the framework’s capacity to automatically interpret sketched lines as architectural components, thereby accurately creating BIM models. In the present study, the methodology and framework proposed enable clients to represent their understanding of spatial configuration through Building Information Modeling (BIM) models. This approach is anticipated to enhance the efficiency of communication with professionals such as architects.
1. Introduction
Continual research efforts are focused on refining the interaction between clients and architectural experts to ensure the precise incorporation of a client’s specific demands into the spatial organization at the outset of the architectural design process. During the initial design phase, effective communication between architects and building owners is essential for optimizing costs and improving the overall satisfaction of the occupants in terms of spatial design [1]. While acknowledging the importance of early discussions, many owners of buildings experience difficulty in fully understanding the spatial configurations they need and conveying these requirements in well-defined plans. As a result, users dedicate significant amounts of time and energy to precisely communicate their needs to experts throughout the process of creating architectural documents.
At the initial design stage, users primarily convey their spatial requirements to experts through communication models like 2D images and 3D physical models. However, 2D images offer limited assistance in understanding the specific shapes of architectural objects like 3D building components [2]. Moreover, the physical 3D models created during the initial design phase lack material properties, limiting the ability to review the building’s performance based on physical properties [3,4,5]. Since users’ requirements are conveyed to experts verbally or in written form [6,7,8], experts need to invest significant time and effort in creating communication models that align with users’ needs [9]. Therefore, the development of a 3D-based planning environment that efficiently articulates a client’s intentions and facilitates smooth communication with experts continues to be a critical demand. This development is expected to effectively support users in making spatial configuration decisions. During the early stages of building design, clients typically communicate their spatial needs to architects using models such as 2D images and 3D representations. However, 2D images fall short of conveying the complexities of architectural forms compared to 3D building elements. Similarly, 3D physical models at this stage do not incorporate material characteristics, thus limiting the evaluations of a building’s performance based on its physical attributes. Given that clients’ requirements are often shared verbally or in writing, architects must expend considerable effort to develop communicative models that resonate with client’s needs. Therefore, there is a pressing requirement for a 3D-based planning environment that not only clearly expresses a client’s intentions but also streamlines communication with professionals. Such an advancement is anticipated to significantly aid users in making informed decisions regarding spatial configurations.
This research aimed to develop a framework for the automated creation of Building Information Modeling (BIM) models from floor plan sketches submitted by clients lacking professional architectural skills. This framework ensures the delivery of BIM models that accurately embody a client’s spatial concepts, articulated through detailed 3D architectural components, effectively capturing their initial design intentions based on the provided sketches.
2. Literature Reviews
Traditionally, sketches have been integral to all phases of architectural design for their innate capacity to rapidly and clearly communicate initial ideas [9]. This process empowers stakeholders to delineate their spatial needs to architects, thereby streamlining and enhancing the decision-making process [10]. However, the diversity in clients’ sketching styles and habits necessitates considerable time and effort from architects to interpret intentions [11]. Most stakeholders including building owners face difficulties in representing their needs in forms that architects can understand due to the extensive time and effort required to learn the conventional perspective drawing techniques used in practice. To facilitate decision-making in spatial composition for clients utilizing sketches, it is imperative to explore methods that allow for the conversion of sketch information into explicit architectural representations, such as architectural objects and spaces, that are easily comprehensible to experts. In this context, research has been continuously conducted on (1) the recognition and interpretation of sketch information [12,13], (2) the creation of CAD drawings based on sketches [14,15,16,17], and (3) sketch-based 3D modeling [3,5,18]. Despite these efforts, significant challenges remain in converting sketch information into explicit architectural expressions. Despite the diversity of sketch representation techniques posing challenges in converting sketches to digital forms like 3D models, continuous efforts are made to transform user-provided sketch information into models. Notably, ongoing research has been focusing on converting sketch information provided by stakeholders into BIM models. Although there have been efforts to transform floor plan sketches created by experts into BIM models [11], a significant challenge remains: stakeholders are required to learn the architectural notation necessary for representing floor plans, which presents a barrier to leveraging BIM’s full capabilities [19]. This highlights the necessity for research aimed at the efficient creation of preliminary design models in BIM, solidifying the spatial and performance requirements of buildings as specified by stakeholders.
Research on the recognition and interpretation of sketch information has primarily focused on identifying sketch strokes and extracting vector information, such as lines, from these strokes. However, there is a notable deficiency in methods capable of extracting fundamental information from sketches representing architectural objects, such as walls and floors, including central lines that are essential for generating architectural objects [12,13,17]. Studies on generating CAD drawings from sketches have proposed methods for recognizing architectural objects in planar sketches and converting them into CAD-based architectural objects. Nonetheless, these methods are limited by the need for users to learn symbols, scaling, and plan-based building structure representation techniques. Additionally, the lack of methods for creating 3D models presents challenges in supporting a comprehensive understanding of spatial forms [14,15,16].
Research on sketch-based 3D modeling has proposed effective methods for creating 3D models from objects recognized in sketch information. Yet, there is a scarcity of methods for recognizing architectural objects represented in sketch information and generating 3D architectural objects from these sketches [18,20]. Furthermore, 3D models generated by existing methods often lack wall-based spatial partitioning and are presented in mesh form, making it difficult to support users in decision-making processes regarding spatial scale and layout [3,5].
Comprehensively, an automated workflow has been suggested, encompassing the recognition of sketch strokes, the conversion of these strokes into vector information, and the generation of 3D architectural objects from vector information [9]. However, this workflow requires learning computer languages and image processing techniques for information exchange and transformation between stages. For instance, Cho and Lee [11] developed an automated process for recognizing architectural objects such as walls and windows from image-based planar sketch information, extracting vector information like central lines for each architectural object, and generating BIM-based architectural objects based on vector information. Nevertheless, improving sketch stroke recognition algorithms is essential for accurately identifying the pixel areas of architectural objects represented by sketch strokes in input images. Additionally, existing research necessitates the iterative input of user parameters for vectorization algorithms [21] to empirically identify parameter values that enable the accurate extraction of vector information [11]. This demands a significant understanding of computer languages and vectorization algorithms from users, requiring considerable time and effort to generate 3D architectural objects from sketch information. Consequently, there is a continuous demand for research that enables the effective generation of 3D architectural objects and models from rough sketch information that users can easily express.
Furthermore, research actively pursuing the provision of building performance analysis information based on previously generated 3D and BIM models is being conducted to support decision-making in budget management for spatial composition during the early design stages [22,23,24,25]. However, there is a lack of processes capable of offering building performance analysis information through developed 3D models based on users’ spatial requirements, necessitating an integrated approach of sketch-based 3D modeling and building performance analysis based on 3D models for effective decision support in spatial composition. On the other hand, existing research on sketch-based 3D modeling faces limitations in acquiring building performance analysis information due to insufficient material information in 3D models [3,4,5]. Therefore, if the integration of BIM-based building performance analysis and sketch-based 3D modeling is possible, it is anticipated that efficiently providing users with 3D spatial and building performance analysis information through BIM models developed based on clients’ spatial requirements during the early design stages could be achieved. This necessitates research on the effective creation of sketch-based BIM models; yet, existing studies face constraints such as requiring users to learn architectural representation techniques and significant time and effort demands in converting sketch information into 3D architectural objects [11]. Consequently, there is a continuous demand for an environment that allows users to effectively generate BIM models from rough sketch information (spatial requirements) provided during the initial design stages and through which a client’s spatial and building performance requirements can be efficiently materialized.
This study aims to develop a framework that enables the efficient generation of BIM models from user-provided sketched data, automatically creating detailed building components like walls, floors, and roofs from the sketched data. The created BIM models not only accurately depict the stakeholder’s specifications, facilitating architects’ understanding of stakeholder’s objectives with efficiency, but also integrate material properties. This integration allows for the early evaluation of building performance, energy use, and material expenses by using the BIM models. Consequently, the developed framework facilitates the decision-making process related to spatial planning and development, ensuring that initial design choices align with both functional and economic considerations.
3. Research Method
In this study, a systematic approach to developing a framework was adopted, delineating both the process model development and its implementation. The process model played an essential role in establishing the necessary detailed steps (activities) for framework development. Through the defined activities, a definition for the specific data flow requisite for the development of the framework was developed. Within each activity, constraints and mechanisms were established to guide the execution of the activity. The developed process model facilitated the implementation of each activity based on the defined data by setting algorithms and environments for implementation grounded on the conditions and mechanisms within the process model. The development of the process model was essential to identify the necessary data flow and define a structured sequence of activities for the framework’s development. Subsequently, the framework’s implementation phase focused on developing both system and user interfaces, defined in the previously defined process model activities. This phase elaborated on the algorithms and integration strategies for disparate systems outlined in the process model, ensuring that the user interface facilitated seamless interaction with the system interface.
3.1. Development of a Process Model
The objective of developing a process model was to define the processes required for framework development. The process model consisted of a series of activities, along with the necessary input and output data to depict these activities, thereby outlining the comprehensive workflow of framework development.
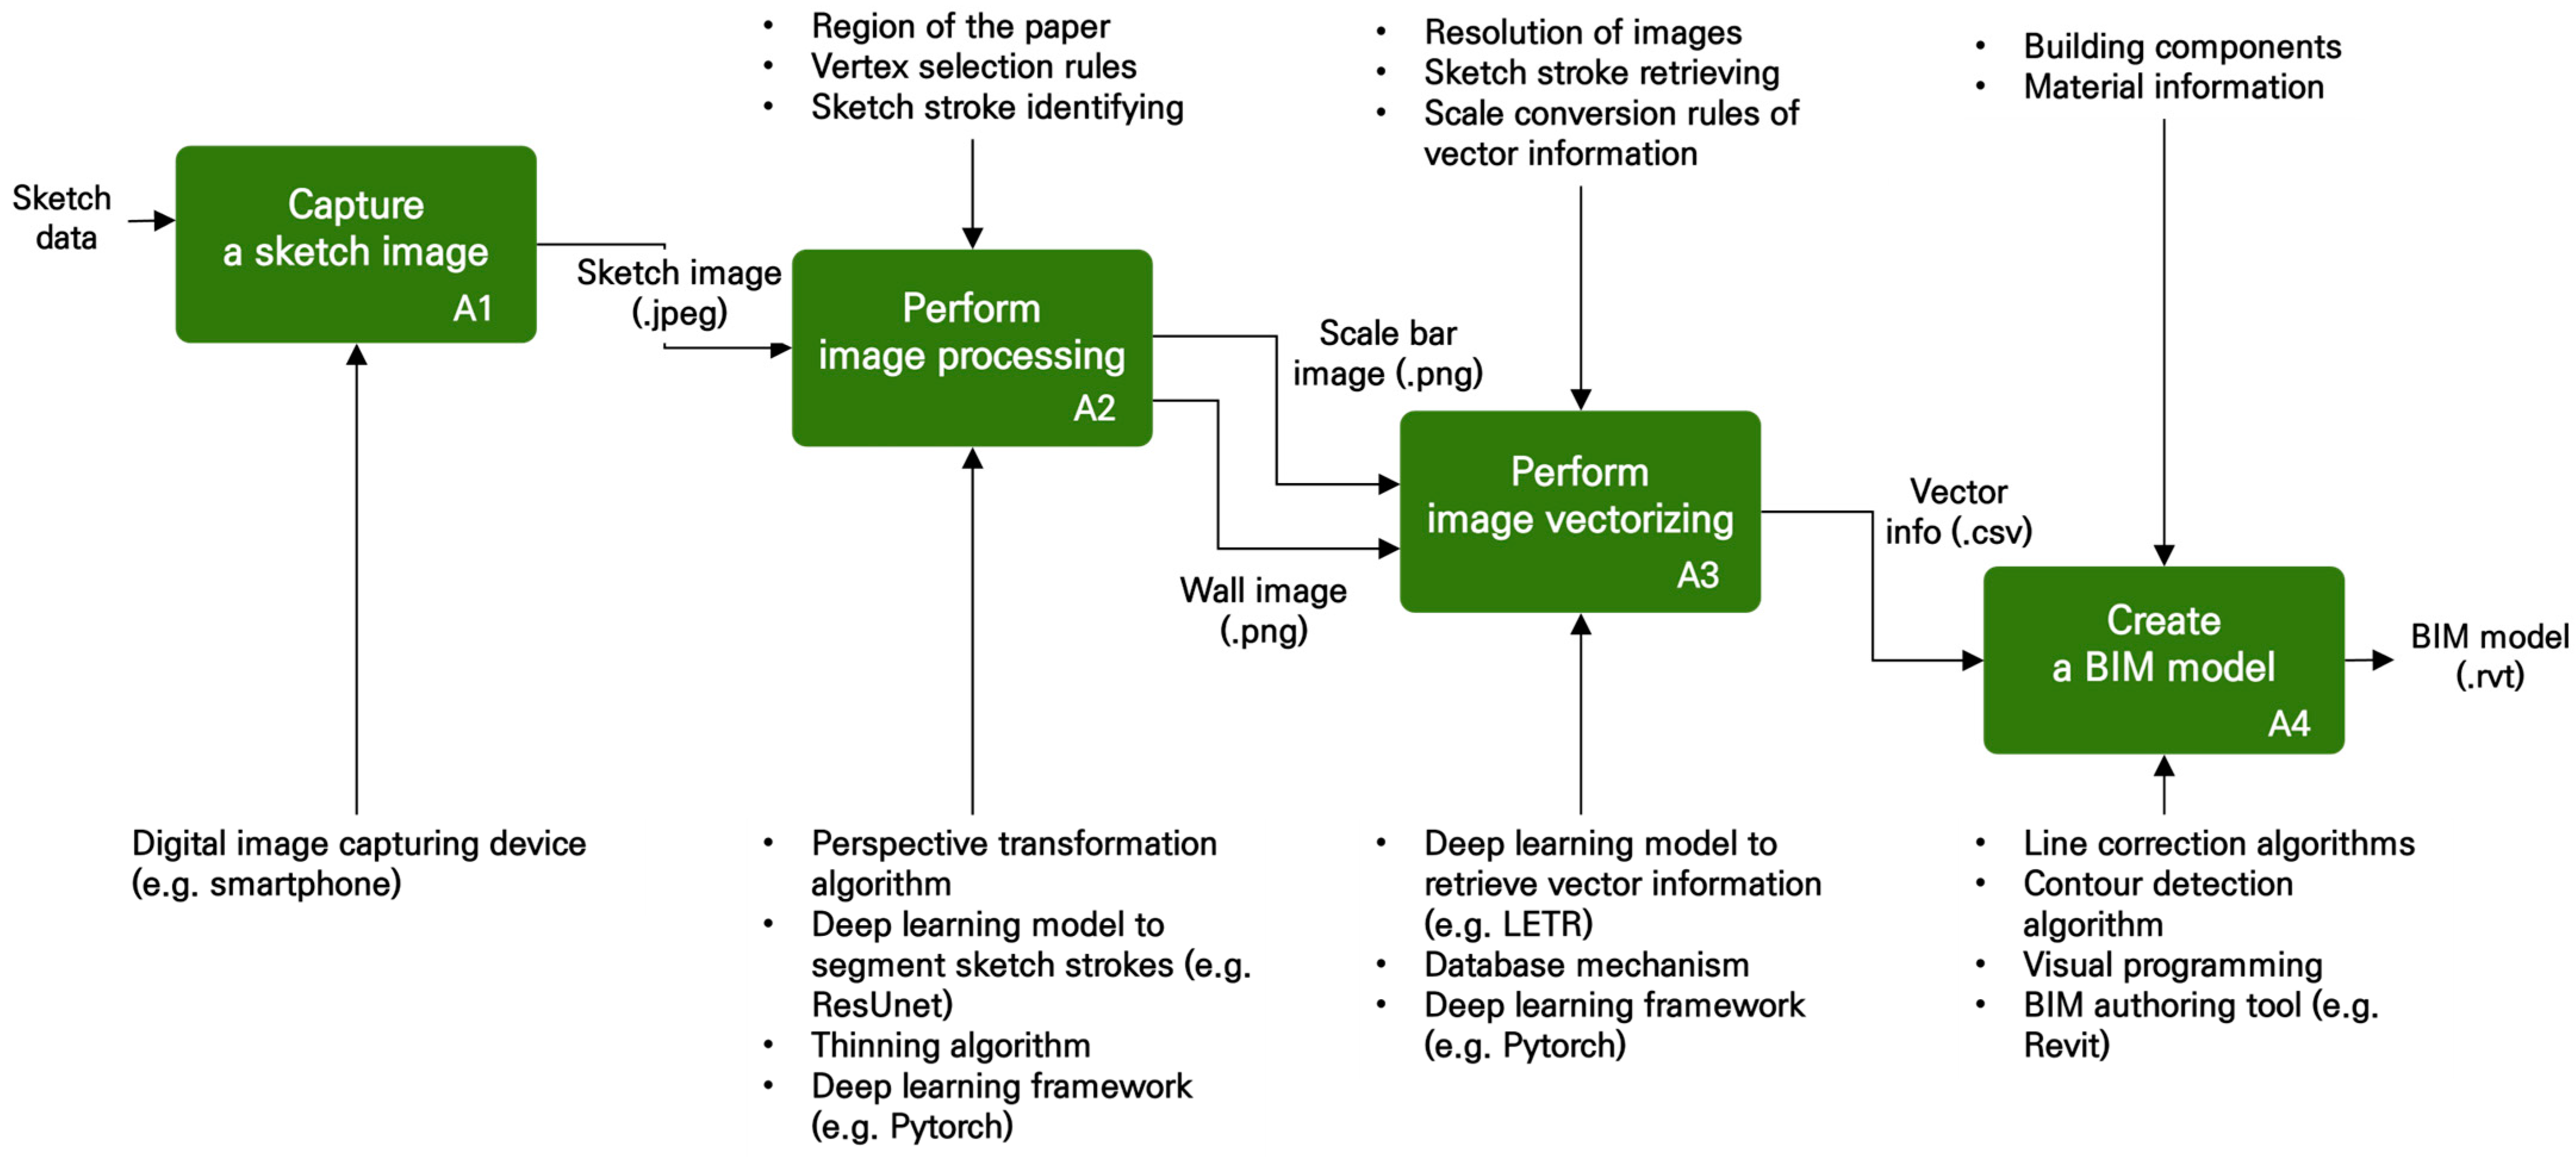
For the development of the process model, the Integration Definition of Function Modeling 0 (IDEF0) modeling technique defined by the International Organization for Standardization (ISO) was adopted [26]. The IDEF0 modeling technique is a method used for designing the functions of a system, allowing for the representation of activities (functions) within boxes. It uses arrows and text outside the boxes to depict each activity’s inputs, outputs, conditions, and mechanisms. The relationships between different activities, such as dependencies and sequences, are represented by connecting the activities with arrows.
Figure 1 illustrates the process model developed using the IDEF0 modeling technique. The process model consisted of four stages: capturing a sketch image (Activity 1, represented by A1), performing image manipulation (Activity 2, represented by A2), performing image vectorizing (Activity 3, represented by A3), and creating a BIM model (Activity 4, represented by A4).
A1 is the stage where sketch information provided by the client is received as input and a digital sketch image is produced as output. Through the A1 phase, sketch information created using analog methods such as paper and pens is converted into digital sketch image data in formats like JPEG, facilitated by devices such as smartphones.
A2 represents the phase where the digital sketch image is used as input to generate scaled and wall images as output. The digital sketch images produced by A1 include extraneous data such as shadows, reflections, and images of the desk surface, alongside sketch lines depicting walls and scale bars that represent length information. A2 involves applying perspective transformation techniques based on the internal area of the paper to eliminate unnecessary data outside the paper, such as the desk surface. A rule for selecting the outer vertices of the paper was applied to define the internal area of the paper. Furthermore, to remove data such as shadows and reflections on the paper, a deep learning model capable of distinguishing between sketch lines and non-line objects, ResUnet [27], was utilized. The ResUnet model was employed specifically for recognizing sketch lines in images and the Pytorch 1.8.2+cu111 [28] deep learning framework was used for its implementation. In this study, a method for recognizing sketch strokes based on deep learning was identified as an algorithm for recognizing pixels corresponding to the input sketch strokes, and this was implemented through the ResUnet model. Building on the ResUnet model, the research applied an accurate stroke recognition method to the framework. Pytorch serves as a library for scientific computing and deep learning, offering accelerated computations through Graphical Processing Units (GPUs), which can enhance the speed of operations by up to 50 times compared to those conducted with Central Processing Units (CPUs) [29]. Additionally, it provides mathematical representation models for numerical optimization used in the creation of deep learning models, facilitating the efficient learning and development of these models [29]. Since each recognized sketch line had thickness, it was challenging to clearly define the central line information used for wall creation. To effectively extract central line information, it was necessary to transform the thickness of the sketch lines into single pixels of a shape similar to the central line. For this purpose, a thinning algorithm was used to remove pixels other than those corresponding to the central line in each sketch line. The sketch images, after the application of the thinning algorithm, were divided into scaled images and central line images of walls and were saved in image formats such as PNG. The scale bar images were created to extract the actual length information of the walls, and the central line images of the walls were generated to extract the central line information from the sketch lines.
A3 is the phase where vector information, such as the coordinates of lines, is generated using the scaled images and the central line images of walls as input. To extract vector information, each scaled image and central line image of walls is input into a deep learning-based line detection model (LETR [30]). The vector information extracted from the central line images of walls is converted into an image format like SVG, which is then transformed into length information through resolution adjustment of the image. The specific figures required for image resolution adjustment were calculated using the vector information extracted from the scaled images, a predefined scale, and the length (width) of the scale bar. The LETR model was employed to extract the central lines of individual sketch strokes from the input images, utilizing the Pytorch deep learning framework for its implementation. The extracted vector information was used to create building component objects in a BIM authoring tool (Revit version 2022 [31]) and a database mechanism was established to convert the vector information into a data format that allowed for information exchange with the BIM authoring tool, facilitating object creation.
A4 is the stage where vector information is received as input to create a BIM model composed of building component objects such as walls, floors, and roofs. Prior to generating building component objects like walls in the BIM model, a line correction algorithm was used in the preprocessing of the vector information (central lines of walls). The line correction algorithm (deburring, removing overlapping lines) was developed to eliminate lines that were similar in length and angle and occupied the same position and to deburr lines that extended beyond the plane. The corrected vector information was utilized for the creation of walls in the BIM model, alongside conditions such as material information. Contour extraction necessary for the creation of floors and roofs was performed from the corrected vector information, for which an outermost contour extraction algorithm was developed. The floor and roof objects in the BIM model were created using the extracted outermost contours and defined material information. To automate the creation of building component objects in the BIM model, the BIM authoring tool Revit version 2022 and the visual programming technique Dynamo [32] were employed.
3.2. Implementation of a Process Model
The development of the process model enabled the articulation of the framework’s functionality through a sequence of activities that were subsequently employed as processes for implementing the framework. In the implementation of the framework, individual activities were realized as both system interfaces and user interfaces. For the system interface implementation, algorithms defined in the process model were developed, and methods for interfacing between different activities were established.
The implementation of both the system and user interfaces utilized the Python 3.8.10 programming language [33] and the OpenCV 4.5.5 image processing library [34]. During the image preprocessing execution phase (as shown in Figure 1 A2), the Pytorch deep learning framework was employed for the implementation of deep learning models. For the creation of the BIM model phase (as indicated in Figure 1 A4), the BIM authoring tool Revit version 2022 and the embedded technique Dynamo within Revit were used.
3.2.1. Sketching Image Creation System
The sketching image creation system implemented the process associated with Figure 1 A1. The camera function of portable devices, such as smartphones, was utilized to convert sketch information into an image file format. Images stored on the devices were transferred to a desktop PC using the automatic synchronization feature of cloud storage services such as Dropbox [35]. The input/output image column in the first row of Table 1 illustrates the transformation of sketch information into sketch images.
3.2.2. Image Preprocessing System
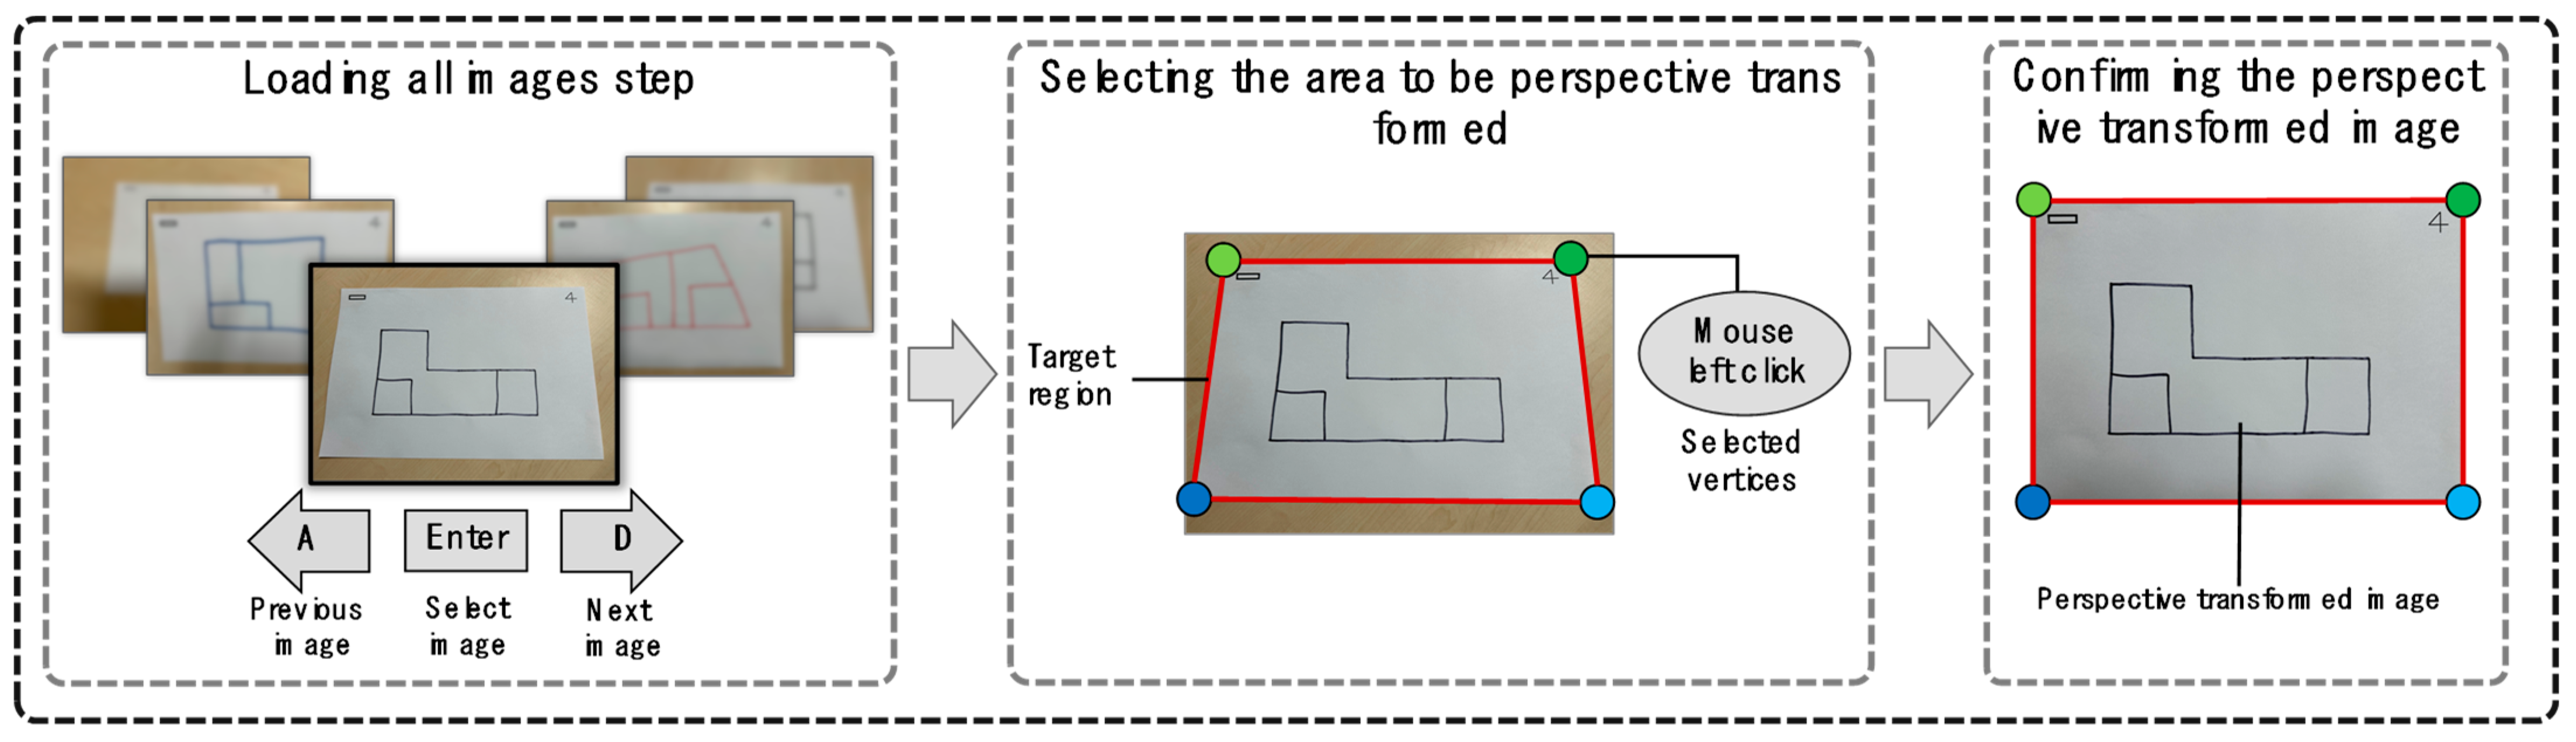
The image processing system executed the procedure corresponding to A2, as illustrated in Figure 1. To eliminate unnecessary data outside of the paper, such as the desk surface from sketch images, a Perspective Transformation (PT) application was developed. Figure 2 illustrates the operational process and user interface of the PT application. The PT application enables users to specify a rectangular area within the image (e.g., the area of the paper) and transforms the specified area into a pre-set shape (e.g., a rectangle). The PT application is designed to load all images within an automatic synchronization folder and display the most recently created image. Thus, when the application is initiated, users can first view the image captured during A1 in Figure 1 on the screen.
Through the PT application, users can navigate to previous and next images using the A and D keys on the keyboard, respectively, and rotate the currently displayed image using the R key. Additionally, the Esc key allows users to exit the function, and the Enter key enables the selection of an image for perspective transformation. The area to be transformed is determined by selecting four corners within the chosen image using mouse left clicks. The sequence of selecting these corners, which can be done in either clockwise or counter-clockwise order, is designed to facilitate the removal of unnecessary data outside the paper. After selecting the four corners with four left clicks, users can initiate the perspective transformation feature with a fifth left click. The image, once transformed, is automatically saved to a specified folder path and visualized on the screen for user verification. The input/output image column in the third row of Table 1 displays an image that has undergone perspective transformation.
To remove unnecessary data such as shadows, reflections, and stains depicted in the perspective-transformed image, a deep learning model (referred to as the sketch information recognition model) was developed to distinguish between sketch strokes and non-stroke objects. The development of the sketch information recognition model was defined in the following three stages and is described in the following subsections.
- 1.
- The stage of establishing and implementing the structure of the sketch information recognition model
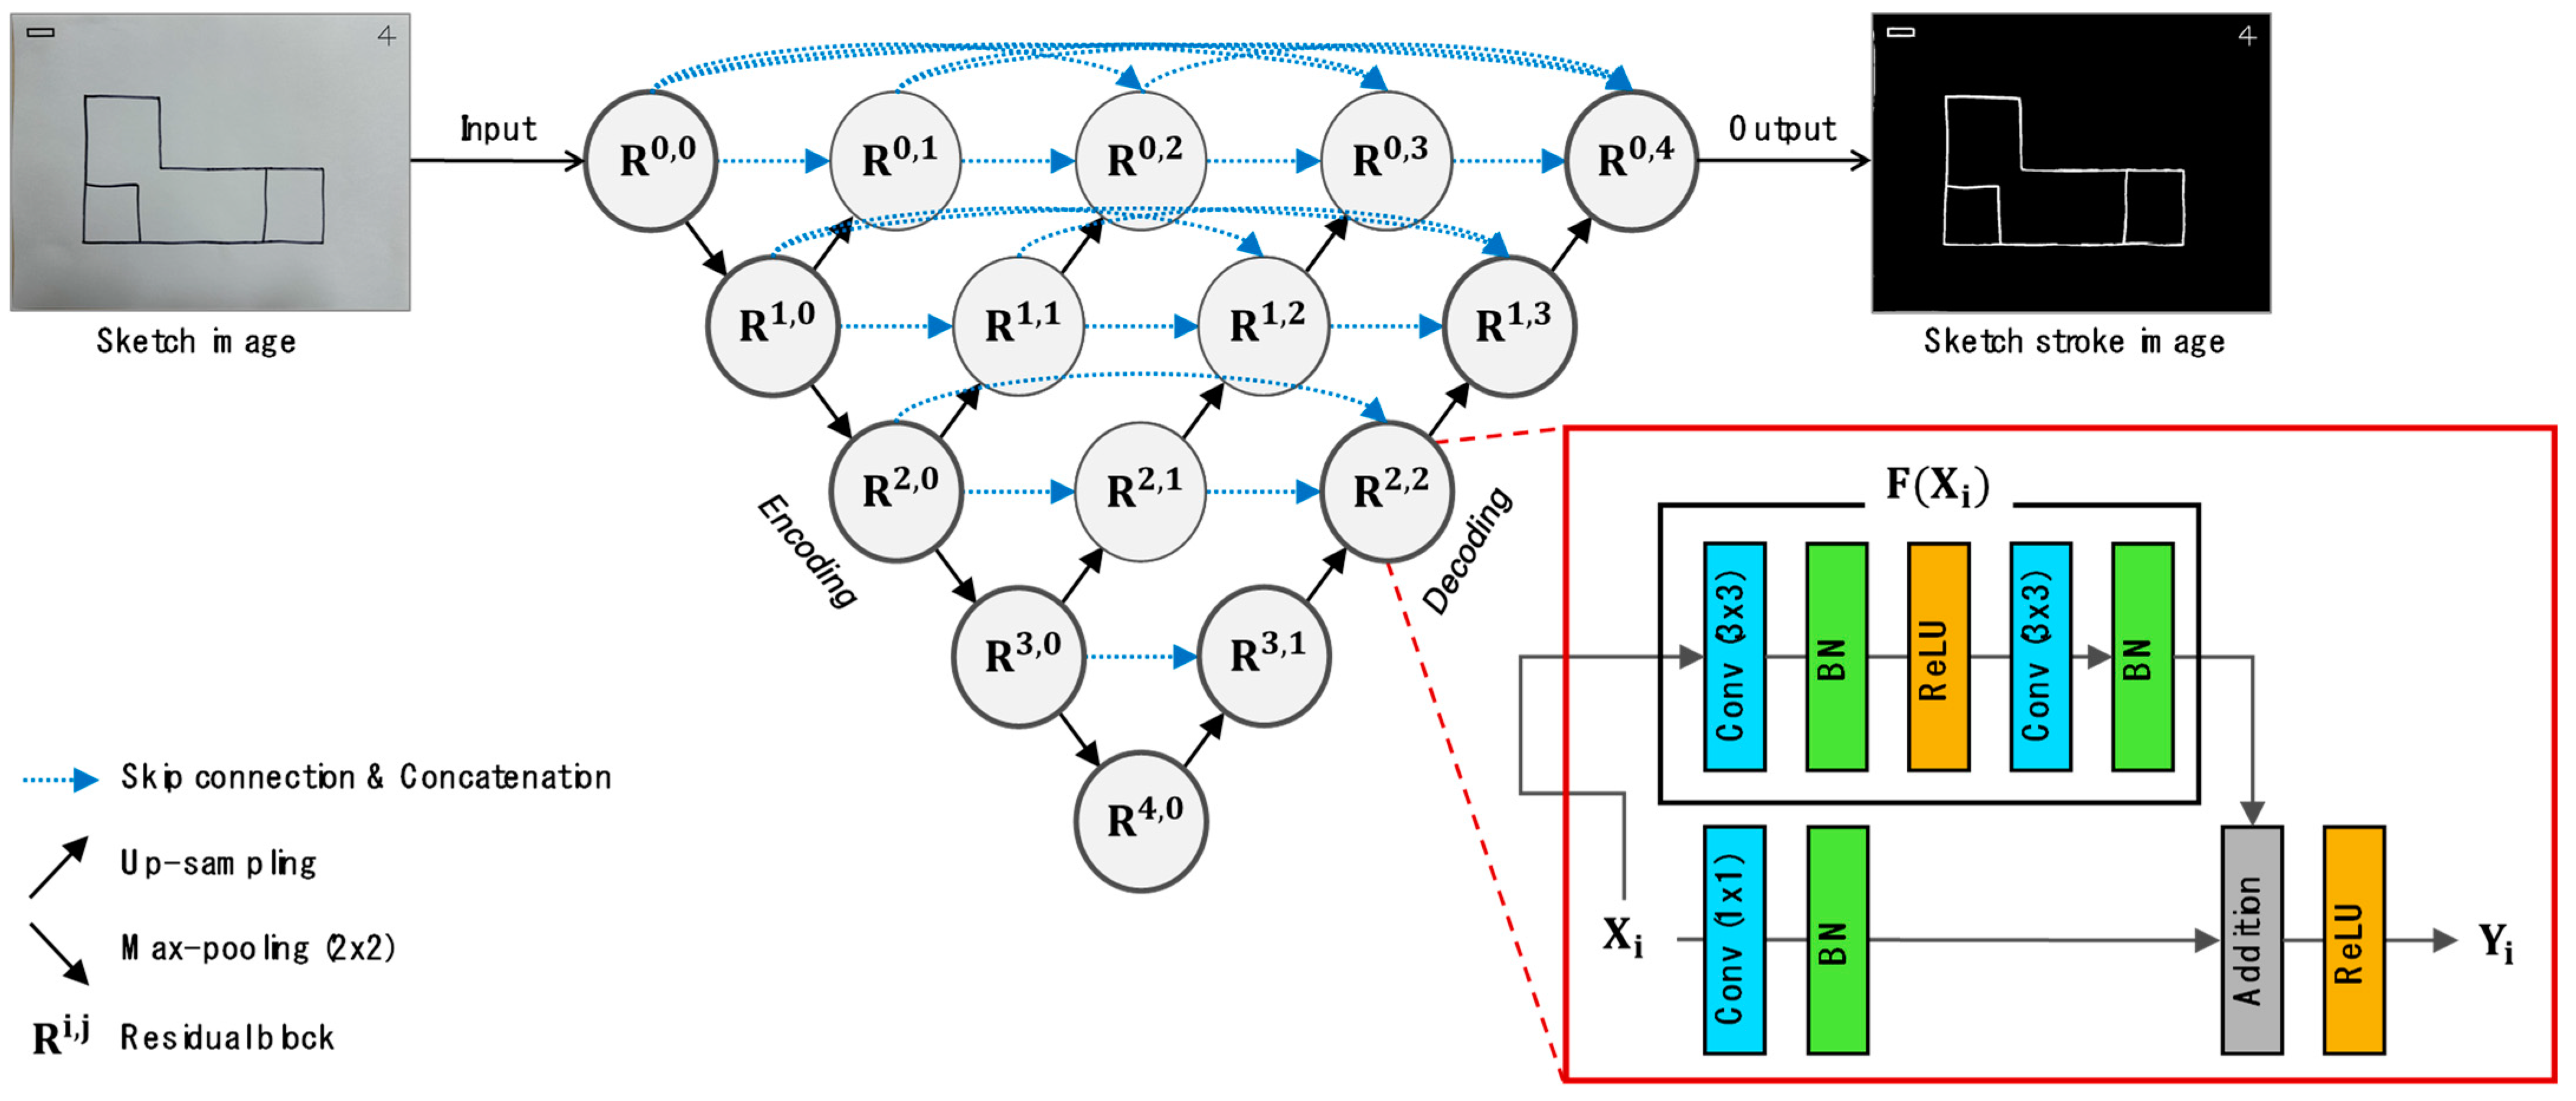
The overall architecture of the sketch information recognition model was implemented based on ResUnet. The motivation behind developing ResUnet was to detect road areas in remote sensing images, with the advantage being its high binary classification performance with a limited amount of training data. This study posited that the morphological similarities between road areas in remote sensing images and sketch strokes in sketch images as identified by [27] are significant. Furthermore, the problem of binary classification between road areas and non-road objects is semantically similar to distinguishing between sketch strokes and non-stroke objects. Therefore, a deep learning model capable of recognizing sketch strokes was developed based on the architecture of ResUnet, effectively detecting sketch strokes within images.
The structural feature of ResUnet involves the adaptation of the encoding, decoding, and skip connection structure of Unet [36], with individual convolutional blocks within Unet replaced by [37]. This study implemented the sketch information recognition model using the encoding, decoding, and skip connection structure of Nested-Unet [38] combined with residual blocks. Figure 3 displays the architecture of the implemented sketch information recognition model and the structure of its constituting residual blocks. The sketch information recognition model is characterized by an encoding and decoding structure composed of 15 residual blocks. The encoding and decoding structures are progressively interconnected through skip connections to mitigate the loss of positional information due to upsampling in decoding. Each residual block is designed to perform an addition operation (Addition) of the input data with the result of a sequence of operations (the result is followed from the calculation of following a series of functions: 3 × 3 convolution, batch normalization, ReLU activation function, 3 × 3 convolution, batch normalization), and then apply the ReLU activation function. To facilitate the addition operation between the input and the operation result, a 1 × 1 convolution and batch normalization operation was conducted on the input to align the dimensions between the data.
- 2.
- The stage of preparing data for the training of the sketch information recognition model
A dataset comprising 50 data points was created for the training of the sketch information recognition model. This dataset consisted of input images and mask images. The input images were photographs of paper with sketch strokes and the mask images were crafted to represent the sketch strokes within the input images.
- 3.
- The stage of training and applying the sketch information recognition model
Setting an appropriate loss function and optimization function for the problem a deep learning model aims to solve is crucial for efficiently optimizing the model’s parameters and enhancing its accuracy [39]. The objective of a sketch recognition model is to accurately binary classify pixels within an input sketch image as either representing sketch strokes or not. In pursuit of this objective, the Binary Cross Entropy loss function, suitable for problems where the output is classified into one of two classes [40], was employed to calculate the difference (loss) between the model’s output (segmentation) and the correct answer (ground truth). Additionally, sketch information, which reflected the various spatial requirements (such as the scale and layout of threads) and pen thickness, as well as the client’s hand tremor, represented nonlinear and complex data. To efficiently optimize the model’s parameters in the face of such data, the Adam optimizer [41] was utilized. Both Binary Cross Entropy and the Adam optimizer were implemented using Pytorch.
The number of epochs was set to 150 and the batch size was established at 16. Training and operation of the model were conducted on a Windows 10 platform using the graphical resources of an NVIDIA Quadro P4000. Images from the training dataset were resized to a resolution of 224 × 224 for use in model training.
The trained model was fed images that had undergone perspective transformation (as shown in the input/output image column of the first row in Table 1), and the images outputted by the model are displayed in the input/output image column of the fourth row in Table 1.
The sketch strokes detected by the sketch information recognition model possessed thickness, which hindered the efficient extraction of central line information. This study utilized the thinning algorithm by [42] to convert the thickness of the sketch strokes to a single pixel. The thinning algorithm was implemented using libraries provided by OpenCV. An algorithm to separate the images with applied thinning into central line images of walls and scaled images was also developed using libraries from OpenCV. The centerline images of walls generated through the thinning algorithm, along with scaled images, could exhibit errors within a margin of approximately 1 pixel. It was inferred that the cause of such errors stemmed from the challenges in precisely determining the positions of the centerline pixels due to the thickness of the sketch strokes and their irregular shapes. The input/output image column in the fifth row of Table 1 displays the central line images of the walls, while the input/output image column in the sixth row of Table 1 shows the scaled images.
3.2.3. Vector Information Extraction System
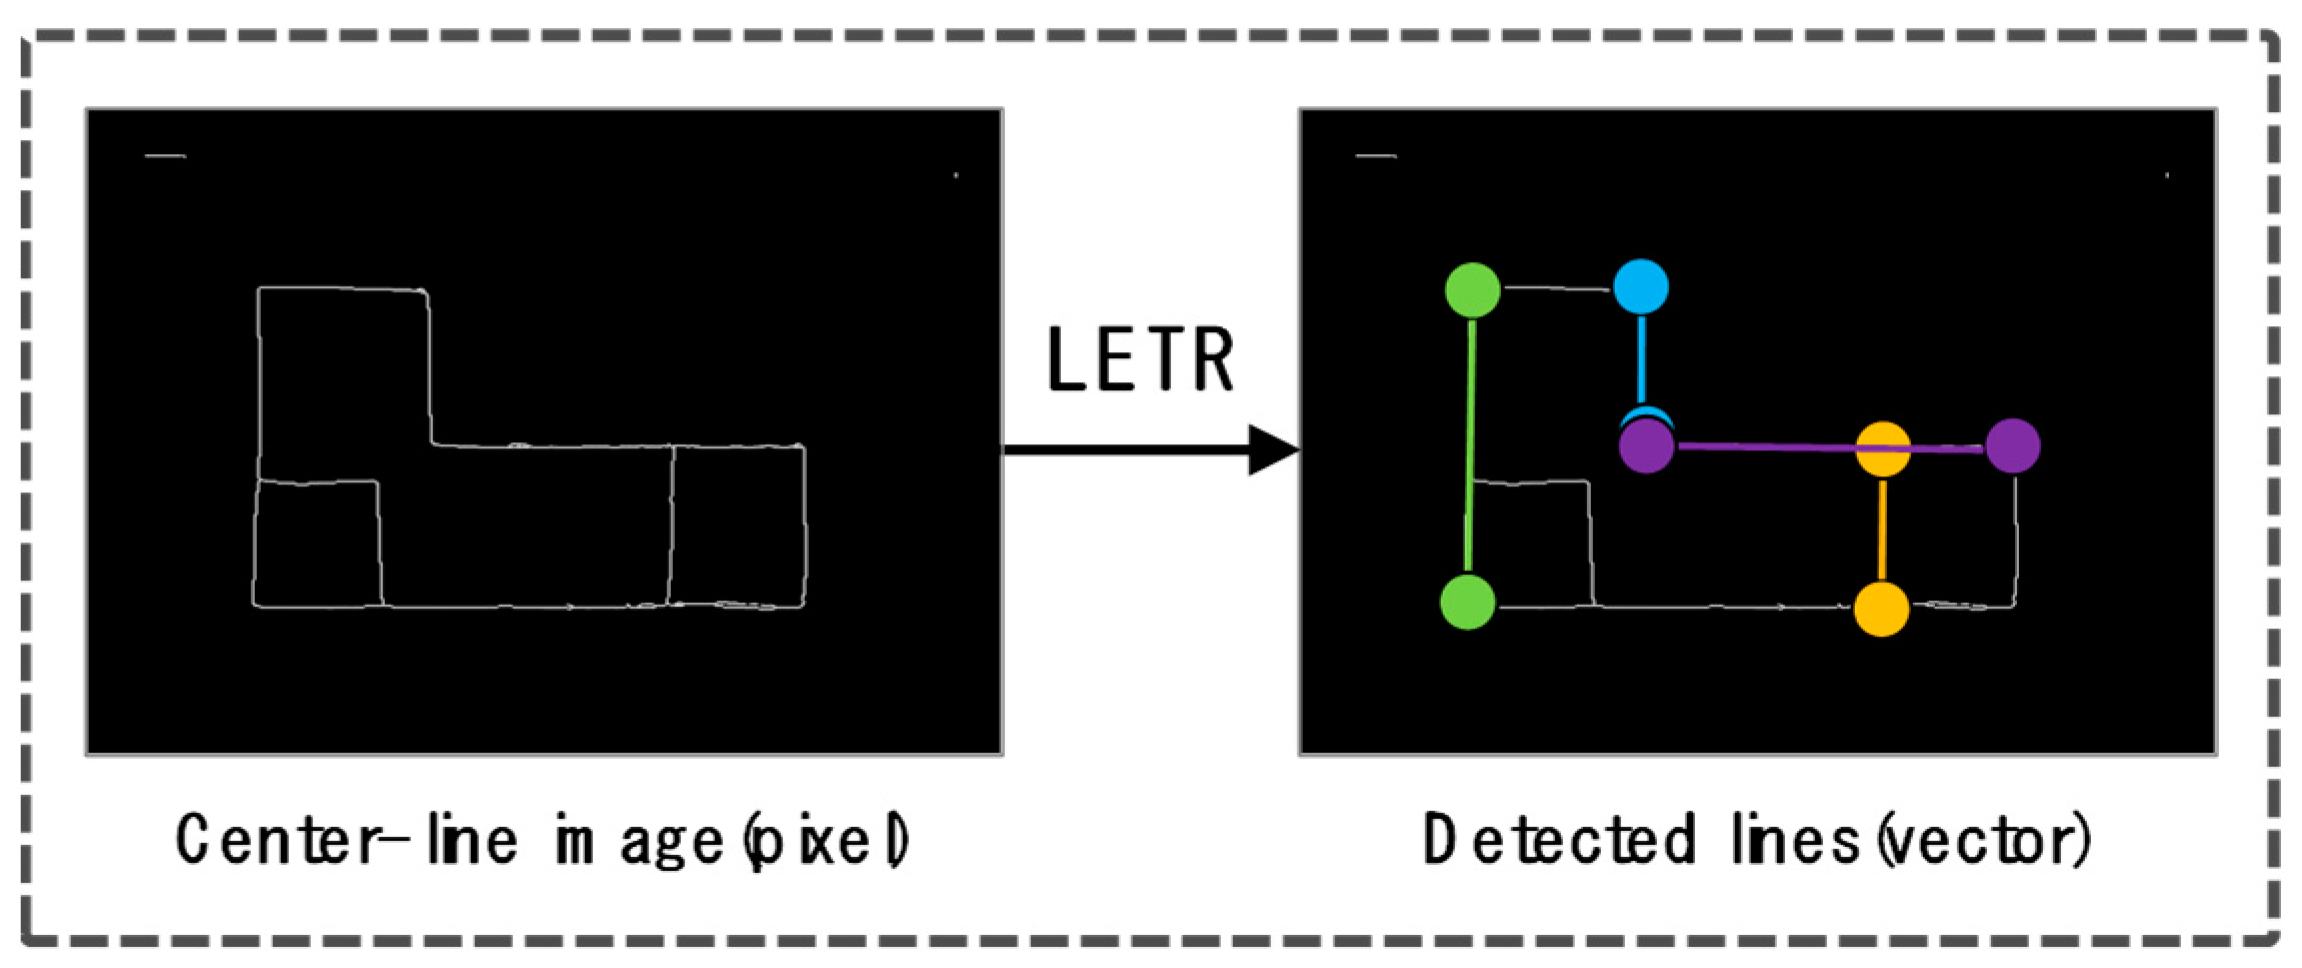
The vector information extraction system implemented the process associated with A3, as illustrated in Figure 1. To extract the length information of the scale bar from the scaled images and the central line information of individual walls from the central line images, a deep learning-based line detection model, LinE segment Transformers (LETR) [30], was employed. LETR is a model that takes pixel-based images as input and detects instance-level lines and their point coordinates within the images. Figure 4 illustrates the detection of instance-level line information by inputting the central line images of walls into LETR. LETR was developed based on the self-attention mechanism of the transformer [43], demonstrating exceptional capabilities in understanding associations. The method of vectorizing sketch information using LETR was effectively utilized for accurately defining the associations between points, specifically the start and end points of lines.
This study conducted the extraction of vector information using LETR in the following two stages.
- 1.
- Measuring the length of a single horizontal line from a bar-scale image
A bar-scale image was inputted into the LETR model and a single horizontal line of the scale bar within the image was detected. The seventh row of Table 1, under the column labeled “Input/Output image”, illustrates the detected horizontal line (colored orange). The output from LETR consisted of the individual line’s dot coordinates and a similarity score. The similarity score was calculated to be between 0 and 1, where LETR output lines had a similarity score exceeding a predefined threshold. This score indicated the degree of resemblance between the pixel formation in the image and the detected line’s shape. For instance, in the scale image, an orange line detected over a formation of white pixels (with a similarity score of 0.89) signified that the shape of the detected line was as similar to the pixel formation as the similarity score indicated. This study verified that when a scale image is inputted into LETR, horizontal lines longer in length tend to receive higher similarity scores compared to shorter vertical lines. Consequently, for the detection of a single horizontal line, the implementation was designed to output the line with the highest similarity score among the detected lines. The information of the outputted horizontal line included the coordinates of the line’s starting and ending points.
- 2.
- Obtaining the coordinates of points along the central path from an image of a wall’s centerline
An image of a wall’s centerline was inputted into the LETR model and each of the centerlines within the image was successfully detected. The eighth row in Table 1, under the “Input/Output image” column, depicts the detected centerlines (colored orange). A similarity score of 0.67 was established for the detection of the centerlines, and the information of the outputted centerlines included the coordinates of the starting and ending points of each line.
Single horizontal line information was extracted from a scale image and individual centerline information from an image of a wall’s centerline using the LETR model. The extracted centerline information was saved as Scalable Vector Graphics (SVG) files using the Matplotlib library [44]. To reflect the actual length information on the centerline information, the resolution of the SVG files was adjusted using the svgpathtools library [45]. The required values for the resolution adjustment were calculated based on the length of the extracted single horizontal line, the actual length of the scale bar represented on the paper, and a predefined scale ratio. For example, given the actual length of the scale bar (2 cm) and a predefined scale ratio (1/50), the actual length of the single horizontal line should be calculated as 1 m. However, the length extracted through the deep learning model was 16 m, requiring the length to be reduced to one-sixteenth, thereby converting it to 1 m. To accomplish this reduction to one-sixteenth, the vertical and horizontal resolution of the image needed to be decreased to half of their original values, achieving a reduction by a factor of sixteen. Therefore, the formula for calculating the vertical and horizontal resolution of the image to transform the length of the centerline information can be expressed as shown in Equation (1).
where R^, R, and L are adjusted resolution, original resolution, and length of the horizontal line of the scale bar, respectively.
Individual centerline information was extracted from an image of a wall’s centerline and the actual length information was incorporated into the centerline information through image resolution adjustment. Given that centerline information is utilized for generating building components such as walls in BIM models, it was imperative to convert this information into a format that facilitated interoperability with BIM models, specifically into Comma Separated Values (CSV) format. To transition the SVG file (containing centerline information) to a CSV file, an algorithm was implemented using the svgpathtools library. This algorithm extracted the dot coordinates of the start and end points of each line from the SVG file and recorded them in the CSV file.
3.2.4. BIM Model Creation System
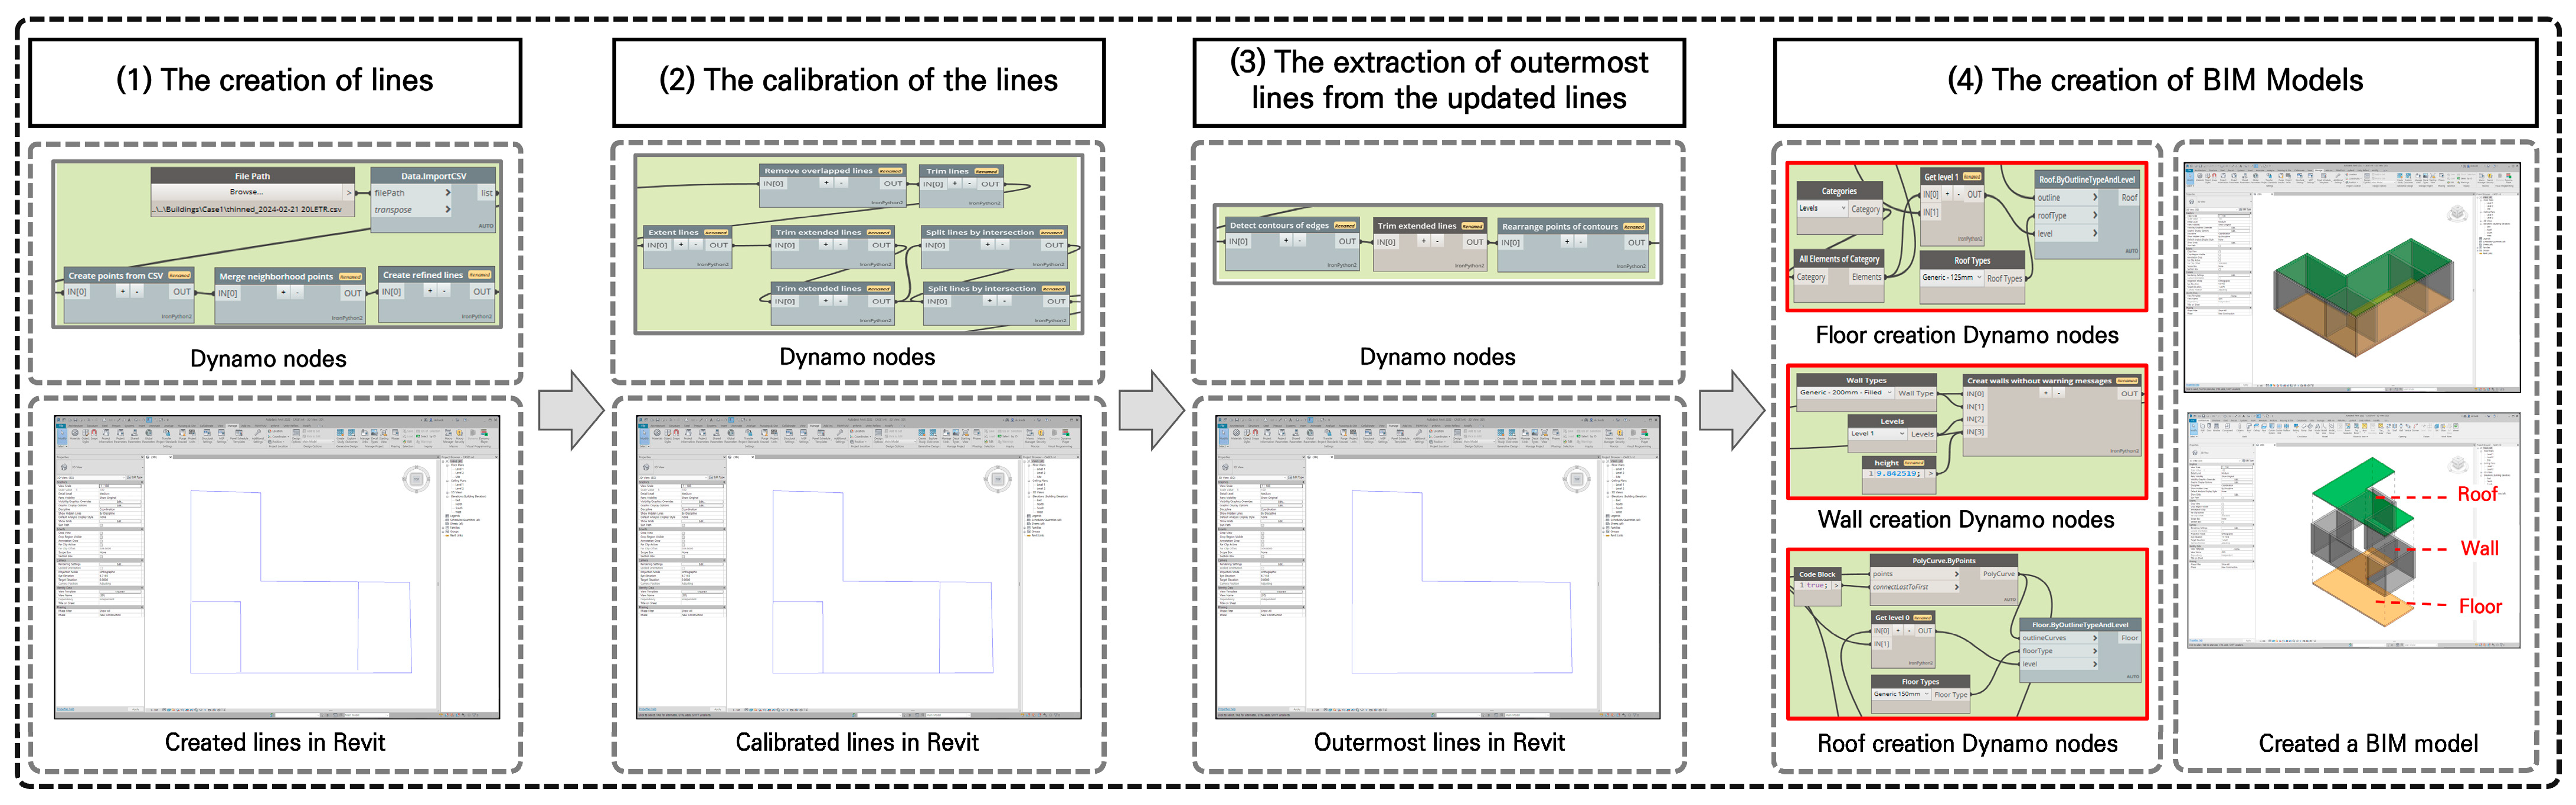
The image processing system executed the procedure corresponding to A4, as illustrated in Figure 1. The CSV file containing the centerline information of walls was imported into the BIM authoring tool Revit, resulting in the generation of a BIM model that included building component objects such as walls, floors, and roofs. To automate the creation of building component objects from vector information like centerline data in Revit, automated programming techniques were necessary. This study utilized Dynamo, a visual programming tool embedded in Revit, along with the Python programming language, to automate the object generation process. Figure 5 illustrates the four stages set for the creation of the BIM model.
Each step of the workflow comprised the following four distinct stages.
- 1.
- Reading the CSV file (containing centerline information) in the BIM authoring tool and generating lines
In Revit, to generate centerlines, Dynamo nodes capable of accessing the CSV file were utilized to extract the coordinates of the start and end points of each individual centerline. The extracted point coordinates were then used to create lines through Dynamo nodes that output lines from input start and end points.
- 2.
- Adjusting the lines
Due to the limitations of deep learning-based line detection models, instances where lines with similar shapes, such as length and position, are generated more than once occur intermittently. Additionally, issues arise where lines meant to intersect in the sketching process do not intersect as intended or pass through each other during the vector information extraction phase. Consequently, this research implemented an algorithm for adjusting lines using Python nodes in Dynamo. The line adjustment algorithm was designed to perform the following functions:
- Integrate points that were in close proximity.
- Remove overlapping lines.
- Refine lines that pass through intersections.
Utilizing these functions, the adjusted lines were employed in the creation of wall objects.
- 3.
- Extracting the outermost lines from the adjusted lines
To generate objects such as floors and roofs in the BIM model, closed curves composed of three or more lines were required. This research utilized the outermost lines extracted from the adjusted lines as the closed curves needed for creating floor and roof objects. The algorithm for extracting the outermost lines was implemented using Python nodes in Dynamo. The operating conditions for the outermost line extraction algorithm were as follows:
- The lines used as inputs for the algorithm were represented in the form of closed curves.
- The lines used as inputs for the algorithm consisted of point coordinates (x, y coordinates) that could be represented on a 2D coordinate plane.
The algorithm for extracting the outermost lines selected the outermost lines from the inputted lines based on the following two rules:
- (1)
- If a line (referred to as Line 1) had less than two intersections with lines other than Line 1, where the intersecting line (referred to as Line 2) passed over the midpoint of Line 1 and was perpendicular to Line 1, then Line 1 was classified as an outermost line.
- (2)
- Among the lines not classified as outermost lines, if a line (referred to as Line 3) had a perpendicular line passing over its midpoint and this perpendicular line intersected at least once with perpendicular lines passing over the midpoints of two lines neighboring Line 3, then Line 3 was classified as an outermost line.
In Table 1, the tenth row under the column labeled “Input/Output image” depicts the outermost lines extracted through the rules.
- 4.
- Creating building components including walls, floors, and roofs in the BIM models
To create wall objects in the BIM model, Dynamo nodes that output wall objects were used with inputs of the line (adjusted line), creation location (1st floor), and material (200 mm thickness concrete). For the creation of floor and roof objects, Dynamo nodes were utilized to generate each floor and roof object with inputs of the line (outermost line), creation location (1st floor), and material (concrete). In Table 1, the eleventh row under the “Input/Output image” column illustrates the walls, floors, and roofs created in the BIM model.
4. Validation
Verification to ascertain whether the framework was capable of automatically converting sketch information into objects such as walls, floors, and roofs in a BIM model was conducted. The verification process initially compared the number of wall objects in the generated BIM model with the count of sketch strokes in the sketch information upon inputting sketch data into the developed framework. Furthermore, a secondary verification of the framework was performed by confirming whether the floor and roof objects in the created BIM model were generated atop the centerlines of the exterior walls.
Table 2 illustrates the translation of sketch information into a BIM model through the developed framework. In Table 2, the input data represent the sketch information initially inputted into the framework, showcasing a total of nine strokes, as depicted in the sketch stroke diagram within Table 2. This sketch information was translated into a BIM model via the framework, and the wall configuration in Table 2 displays the creation of nine wall objects within the BIM model. The verification results confirmed that the number of sketch strokes matched the number of wall objects created in the BIM model. Similarly, the floors and roofs were also generated on top of the outermost lines of the walls, as indicated by the output data in Table 2. Consequently, it was verified that the framework was capable of automatically translating sketch information into a BIM model.
5. Conclusions and Discussions
This study developed a framework capable of effectively translating user requirements, as expressed through floor plan sketches, into specific building component objects within BIM models during the initial design phase. The aim was to support users’ spatial configuration decision-making processes. Verification results confirmed that the framework can automatically convert sketch information into wall, floor, and roof objects within BIM models. The developed framework allows designers to use an initial model that reflects users’ specific feedback as a base model. Furthermore, the automatic generation of initial BIM models enables designers to utilize these as foundational models for further development.
The framework is designed to automatically convert sketch information into BIM models; however, it faces limitations in accommodating the diverse sketching notations used by different users. Consequently, this research restricted the form of sketch information to (1) be composed of closed outlines and (2) consist of sketch strokes longer than a specific length (e.g., 2 cm) as part of the study conditions. To enable the conversion of a broader range of sketch information into BIM models in future research, it appears necessary to conduct further research aimed at enhancing the framework through the following improvements.
- Development of an improved vector information extraction model based on sketch information for more accurate extraction of individual line point coordinates from images.
- Enhancement of line correction and outermost outline algorithms during the automatic generation phase of BIM models.
In this study, a more fundamental investigation was conducted on the errors that could arise within the Image Preprocessing System. The potential for errors in perspective transformation was noted, particularly when the accurate input of the coordinates of four vertices was compromised through user mouse manipulation. For the accuracy assessment of perspective transformation, the correct values of the four vertices’ coordinates (pixel locations) necessary for selecting the area to apply perspective transformation were required. However, accurately identifying the coordinates of an object’s vertices in object images proved challenging. To correct such errors, it is anticipated that future accuracy assessments could be facilitated through the visualization of input and output in various test cases.
Furthermore, research aimed at enhancing the framework to utilize a broader range of sketch information for more efficient BIM model creation is planned. Additionally, this study will conduct research aimed at enhancing the understanding of spatial configurations through experiences in spaces utilizing objects such as furniture within virtual 3D environments created using BIM models. This approach leverages the framework developed through this research, facilitating the comprehension of space based on sketch information directly provided by users. Moreover, research is planned to more efficiently utilize the developed framework within the BIM environment. The methodology presented in this study proposes the preliminary creation of BIM components through sketch information. Subsequent research will explore the use of these generated BIM components for the integration of simulations to present specific building performances.
Author Contributions
Conceptualization, writing, visualization, funding acquisition, and methodology, W.J.; writing—original draft, application development, and formal analysis, B.K.; writing—review, M.D.A.; writing—review, supervision, S.-G.Y. All authors have read and agreed to the published version of the manuscript.
Funding
This research was supported by the Basic Science Research Program through the National Research Foundation of Korea (NRF), funded by the Ministry of Education (NRF-2020R1I1A3052594).
Data Availability Statement
The raw data supporting the conclusions of this article will be made available by the authors on request.
Conflicts of Interest
The authors declare no conflicts of interest.
References
- Sacks, R.; Eastman, C.; Lee, G.; Teicholz, P. BIM Handbook: A Guide to Building Information Modeling for Owners, Designers, Engineers, Contractors, and Facility Managers; John Wiley & Sons: New York, NY, USA, 2018. [Google Scholar]
- Rajabi, M.S.; Radzi, A.R.; Rezaeiashtiani, M.; Famili, A.; Rashidi, M.E.; Rahman, R.A. Key Assessment Criteria for Organizational BIM Capabilities: A Cross-Regional Study. Buildings 2024, 12, 1013. [Google Scholar] [CrossRef]
- de Klerk, R.; Duarte, A.M.; Medeiros, D.P.; Duarte, J.P.; Jorge, J.; Lopes, D.S. Usability studies on building early stage architectural models in virtual reality. Autom. Constr. 2019, 103, 104–116. [Google Scholar] [CrossRef]
- Lee, K.T.; Im, J.B.; Park, S.J.; Kim, J.H. Conceptual framework to support personalized indoor space design decision-making: A systematic literature review. Buildings 2022, 12, 716. [Google Scholar] [CrossRef]
- Yang, H.B.; Johanes, M.; Kim, F.C.; Bernhard, M.; Huang, J. Architectural Sketch to 3D Model: An Experiment on Simple-Form Houses. In Proceedings of the Computer-Aided Architectural Design Conference on INTERCONNECTIONS: Co-Computing Beyond Boundaries, Delft, The Netherlands, 5–7 July 2023; Springer: Cham, Switzerland, 2023. [Google Scholar]
- Norouzi, N.; Shabak, M.; Embi, M.R.; Khan, T.H. The architect, the client and effective communication in architectural design practice. Procedia-Soc. Behav. Sci. 2015, 172, 635–642. [Google Scholar] [CrossRef]
- Upomo, T.; Romarchan, A.; Kusumawardani, R. Seepage control in foundation of a small earthfill dam using grouting method. Malays. Constr. Res. J. 2017, 2, 62–68. [Google Scholar]
- Lee, J.K.; Lee, S.; Kim, Y.C.; Kim, S.; Hong, S.W. Augmented virtual reality and 360 spatial visualization for supporting user-engaged design. J. Comput. Des. Eng. 2023, 10, 1047–1059. [Google Scholar] [CrossRef]
- Bonnici, A.; Akman, A.; Calleja, G.; Camilleri, K.P.; Fehling, P.; Ferreira, A.; Hermuth, F.; Israel, J.H.; Landwehr, T.; Liu, J.; et al. Sketchbased interaction and modeling: Where do we stand? AI EDAM 2019, 33, 370–388. [Google Scholar]
- Dzurilla, D.; Achten, H. What is Architectural Digital Sketch? In Proceedings of the eCAADe, Novi Sad, Serbia, 8–10 September 2021.
- Cho, D.G.; Lee, J.K. Training Floorplan Sketches and Applying to the Spatial Design—Focused on the Development of Automated BIM Modeling module from Floor Plan Sketches in the Early Stage of Design. J. Korea Inst. Spat. 2021, 16, 365–374. [Google Scholar]
- Zhang, X.; Li, X.; Liu, Y.; Feng, F. A survey on freehand sketch recognition and retrieval. Image Vis. Comput. 2019, 89, 67–87. [Google Scholar] [CrossRef]
- Wang, S.; Bau, D.; Zhu, J.Y. Sketch your own GAN. In Proceedings of the IEEE/CVF International Conference on Computer Vision, Montreal, BC, Canada, 17 October 2021. [Google Scholar]
- Aoki, Y.; Shio, A.; Arai, H.; Odaka, K. A prototype system for interpreting hand-sketched floor plans. In Proceedings of the 13th International Conference on Pattern Recognition, Vienna, Austria, 25–29 August 1996. [Google Scholar]
- Weber, M.; Liwicki, M.; Dengel, A.A. scatch-a sketch-based retrieval for architectural floor plans. In Proceedings of the 2010 12th International Conference on Frontiers in Handwriting Recognition, Kolkata, India, 16–18 November 2010. [Google Scholar]
- Ahmed, S.; Weber, M.; Liwicki, M.; Langenhan, C.; Dengel, A.; Petzold, F. Automatic analysis and sketch-based retrieval of architectural floor plans. Pattern Recognit. Lett. 2014, 35, 91–100. [Google Scholar] [CrossRef]
- Li, C.; Pan, H.; Bousseau, A.; Mitra, N.J. Free2CAD: Parsing freehand drawings into CAD commands. ACM Trans. Graph. 2022, 41, 1–16. [Google Scholar] [CrossRef]
- Wang, J.; Lin, J.; Yu, Q.; Liu, R.; Chen, Y.; Yu, S.X. 3D Shape Reconstruction from Free-Hand Sketches. In Proceedings of the Computer Vision—ECCV 2022 Workshops, Tel Aviv, Israel, 23–27 October 2023. [Google Scholar]
- Rajabi, M.S.; Rezaeiashtiani, M.; Radzi, A.R.; Famili, A.; Rezaeiashtiani, A.; Rahman, R.A. Underlying Factors and Strategies for Organizational BIM Capabilities: The Case of Iran. Appl. Syst. Innov. 2022, 5, 109. [Google Scholar] [CrossRef]
- Estiri, S.N.; Jalilvand, A.H.; Naderi, S.; Najafi, M.H.; Fazeli, M. A Low-Cost Stochastic Computing-based Fuzzy Filtering for Image Noise Reduction. In Proceedings of the 2022 IEEE 13th International Green and Sustainable Computing Conference (IGSC), Pittsburgh, PA, USA, 24–25 October 2022. [Google Scholar]
- Harris, C.; Stephens, M. A combined corner and edge detector. In Proceedings of the Alvey vision conference, Alvey Vision Club, Manchester, UK, 31 August–2 September 1988. [Google Scholar] [CrossRef]
- Jeong, W.; Kim, J.B.; Clayton, M.J.; Haberl, J.S.; Yan, W. Visualization of Building Energy Performance in Building Information Models. In Proceedings of the ACADIA, Cambridge, ON, Canada, 21–23 October 2013. [Google Scholar]
- Jeong, W.; Kim, M.K. Building Performance Visualization using Object-Oriented Physical Modeling and BIM. J. Reg. Assoc. Archit. Inst. Korea 2020, 22, 125–131. [Google Scholar]
- Pučko, Z.; Maučec, D.; Šuman, N. Energy and cost analysis of building envelope components using BIM: A systematic approach. Energies 2020, 13, 2643. [Google Scholar] [CrossRef]
- Maglad, A.M.; Houda, M.; Alrowais, R.; Khan, A.M.; Jameel, M. Bim-based energy analysis and optimization using insight 360 (case study). Case Stud. Constr. Mater. 2023, 18, e01755. [Google Scholar] [CrossRef]
- National Institute of Standards and Technology. FIPS Publication 183: Integration Definition of Function Modeling (IDEF0); National Institute of Standards and Technology: Gaithersburg, MD, USA, 1993; Volume 128. [Google Scholar]
- Zhang, Z.; Liu, Q.; Wang, Y. Road extraction by deep residual u-net. IEEE Geosci. Remote Sens. Lett. 2018, 15, 749–753. [Google Scholar] [CrossRef]
- Paszke, A.; Gross, S.; Massa, F.; Lerer, A.; Bradbury, J.; Chanan, G.; Killeen, T.; Lin, Z.; Gimelshein, N.; Antiga, L. Pytorch: An imperative style, high-performance deep learning library. Adv. Neural Inf. Process. Syst. 2019, 32, 1–12. [Google Scholar]
- Stevens, E.; Antiga, L.; Viehmann, T. Deep Learning with PyTorch; Manning Publications: New York, NY, USA, 2020. [Google Scholar]
- Xu, Y.; Xu, W.; Cheung, D.; Tu, Z. Line segment detection using transformers without edges. In Proceedings of the IEEE/CVF Conference on Computer Vision and Pattern Recognition, Nashville, TN, USA, 20–25 June 2021; pp. 4257–4266. [Google Scholar]
- Autodesk Revit Software|Get Prices & Buy Official Revit. 2024. Available online: https://www.autodesk.eu/products/revit/overview (accessed on 25 February 2024).
- Dynamo Studio|Computational BIM Design Software|Autodesk. Available online: https://www.autodesk.com/products/dynamo-studio/overview (accessed on 25 February 2024).
- Van Rossum, G.; Drake, F.L., Jr. The Python Language Reference; Python Software Found: Wilmington, DE, USA, 2014. [Google Scholar]
- Bradski, G. The openCV library. Dr. Dobbs J. Softw. Tools Prof. Program. 2000, 25, 120–123. [Google Scholar]
- Dropbox.com. Available online: https://www.dropbox.com (accessed on 25 February 2024).
- Ronneberger, O.; Fischer, P.; Brox, T. U-Net: Convolutional Networks for Biomedical Image Segmentation. In Medical Image Computing and Computer-Assisted Intervention—MICCAI; Navab, N., Hornegger, J., Wells, W.M., Frangi, A.F., Eds.; Springer International Publishing: Berlin/Heidelberg, Germany, 2015; Volume 9351, pp. 234–241. [Google Scholar]
- He, K.; Zhang, X.; Ren, S.; Sun, J. Deep residual learning for image recognition. In Proceedings of the IEEE Conference on Computer Vision and Pattern Recognition, Las Vegas, NV, USA, 27–30 June 2016. [Google Scholar]
- Zhou, Z.; Rahman Siddiquee, M.M.; Tajbakhsh, N.; Liang, J. UNet++: A Nested U-Net Architecture for Medical Image Segmentation. In Deep Learning in Medical Image Analysis and Multimodal Learning for Clinical Decision Support; Stoyanov, D., Taylor, Z., Carneiro, G., Syeda-Mahmood, T., Martel, A., Maier-Hein, L., Tavares, J.M.R.S., Bradley, A., Papa, J.P., Belagiannis, V., et al., Eds.; Springer International Publishing: Berlin/Heidelberg, Germany, 2018; Volume 11045, pp. 3–11. [Google Scholar]
- Morteza, A.; Yahyaeian, A.A.; Mirzaeibonehkhater, M.; Sadeghi, S.; Mohaimeni, A.; Taheri, S. Deep learning hyperparameter optimization: Application to electricity and heat demand prediction for buildings. Energy Build. 2023, 289, 113036. [Google Scholar] [CrossRef]
- A Tour of Machine Learning Algorithms. Available online: https://machinelearningmastery.com/a-tour-of-machine-learning-algorithms (accessed on 25 February 2024).
- Kingma, D.P.; Ba, J. Adam: A Method for Stochastic Optimization. In Proceedings of the ICLR, San Diego, CA, USA, 7–9 May 2015. [Google Scholar]
- Zhang, T.Y.; Suen, C.Y. A fast parallel algorithm for thinning digital patterns. Commun. ACM 1984, 27, 236–239. [Google Scholar] [CrossRef]
- Vaswani, A.; Shazeer, N.; Uszkoreit, J.; Jones, L.; Gomez, A.N.; Kaiser, L.; Polosukhin, I. Attention is all you need. In Proceedings of the Neural Information Processing Systems, Long Beach, CA, USA, 4–9 December 2017. [Google Scholar]
- Hunter, J.D. Matplotlib: A 2D graphics environment. Comput. Sci. Eng. 2007, 9, 90–95. [Google Scholar] [CrossRef]
- GitHub—Mathandy/Svgpathtools. Available online: https://github.com/mathandy/svgpathtools (accessed on 25 February 2024).
Figure 1.
The overall diagram of the process model describes the data flow and workflow of the framework [9,10,11,12].

Figure 2.
The operational flow and user interface of the perspective transformation application.

Figure 3.
The architecture of the sketch data recognition model based on ResUnet and the structure of the residual block.
Figure 3.
The architecture of the sketch data recognition model based on ResUnet and the structure of the residual block.

Figure 4.
Line entities identified in the center-line image through the LETR model [30].
Figure 4.
Line entities identified in the center-line image through the LETR model [30].

Figure 5.
The comprehensive workflow of the BIM creation system.


Table 1.
Input and output for each activity in the process model.
| Activity | Input/Output Image | Description |
|---|---|---|
| A1 |  | Capturing sketch information with a portable device, such as a smartphone, and transferring it to a desktop PC through an automatic synchronization service. |
| A2 |  | The refined sketch image, with extraneous data outside the paper eliminated via the perspective transformation application. |
 | The process in which the refined sketch information recognition model identifies sketch strokes and eliminates elements like shadows and lighting. | |
 | The image that includes walls outlined with center lines, transformed to a thickness of a single pixel by the thinning algorithm. | |
 | The scaled image reduced to single-pixel thickness using thinning algorithms. | |
| A3 |  | Retrieving the width and length of the scale bar from the scaled image via a deep learning-based line detection model. |
 | Extracting point coordinates from the center-line wall image, which consists of numerical information, after processing with the deep learning-based line detection model. | |
| A4 |  | The refined center-line wall image, enhanced by line correction algorithms including filleting and the removal of overlapping lines. |
 | The outermost lines derived from the calibrated lines. | |
 | The creation of walls, floors, and roofs in the BIM model. |
Table 2.
The comparison between sketch data and a BIM model in terms of object count.
| The Input Data Represented as the Sketched Image | The Composition of Strokes in the Sketched Image | The Output Data Represented as a BIM Model | The Composition of Walls in the BIM Model |
|---|---|---|---|
 |  |  |  |
Disclaimer/Publisher’s Note: The statements, opinions and data contained in all publications are solely those of the individual author(s) and contributor(s) and not of MDPI and/or the editor(s). MDPI and/or the editor(s) disclaim responsibility for any injury to people or property resulting from any ideas, methods, instructions or products referred to in the content. |
© 2024 by the authors. Licensee MDPI, Basel, Switzerland. This article is an open access article distributed under the terms and conditions of the Creative Commons Attribution (CC BY) license (https://creativecommons.org/licenses/by/4.0/).
Share and Cite
MDPI and ACS Style
Jeong, W.; Kong, B.; Adhikari, M.D.; Yum, S.-G. The Development of a Framework for the Automated Translation of Sketch-Based Data into BIM Models. Buildings 2024, 14, 916. https://0-doi-org.brum.beds.ac.uk/10.3390/buildings14040916
AMA Style
Jeong W, Kong B, Adhikari MD, Yum S-G. The Development of a Framework for the Automated Translation of Sketch-Based Data into BIM Models. Buildings. 2024; 14(4):916. https://0-doi-org.brum.beds.ac.uk/10.3390/buildings14040916
Chicago/Turabian StyleJeong, WoonSeong, ByungChan Kong, Manik Das Adhikari, and Sang-Guk Yum. 2024. "The Development of a Framework for the Automated Translation of Sketch-Based Data into BIM Models" Buildings 14, no. 4: 916. https://0-doi-org.brum.beds.ac.uk/10.3390/buildings14040916
Note that from the first issue of 2016, this journal uses article numbers instead of page numbers. See further details here.