Energy Diagnosis of University Buildings: Renewable Energy Institute from UNAM


1
Instituto de Energías Renovables, Universidad Nacional Autónoma de México, 62580 Temixco, Mexico
2
Instituto de Ingeniería, Universidad Nacional Autónoma de México, 04510 Mexico City, Mexico
3
Centro de Innovación en Ingeniería Aplicada, Universidad Católica del Maule, 3480112 Talca, Chile
*
Author to whom correspondence should be addressed.
Buildings 2018, 8(10), 136; https://0-doi-org.brum.beds.ac.uk/10.3390/buildings8100136
Submission received: 23 July 2018
/
Revised: 18 September 2018
/
Accepted: 25 September 2018
/
Published: 27 September 2018
(This article belongs to the Special Issue Building Sustainability Assessment)
Abstract
:The purpose of this study has been to conduct an energy diagnosis research of the third level. An energy diagnosis is a tool aimed to seek improvements related to measures of energy efficiency and saving, and environmental conservation as well. These improvements would prove to be relevant for any kind of building. The diagnosis was carried out in 36 university buildings (Renewable Energy Institute—REI) through survey and census; that in order (to identify and) to characterize current patterns of energy consumption and demand, as well as for generating specific strategies towards energy efficiency and saving, for instance the identification of systemic indicators and corrective proposals, and non-financial investment. The results promote the achievement of grand energy efficiency. The task on energy conservation entails the supporting participation of each person who either studies or works in the entity, whereas some other activities require economic stimulus for being implemented. Annual per capita energy consumption in the REI is 40 kWh/person: that is greater than the country’s average consumption rate. The main energy consumption corresponds to Building 3.1 (49% of total energy consumption). This is due to its large concentration of laboratories specialized in renewable energy research and innovation.

1. Introduction
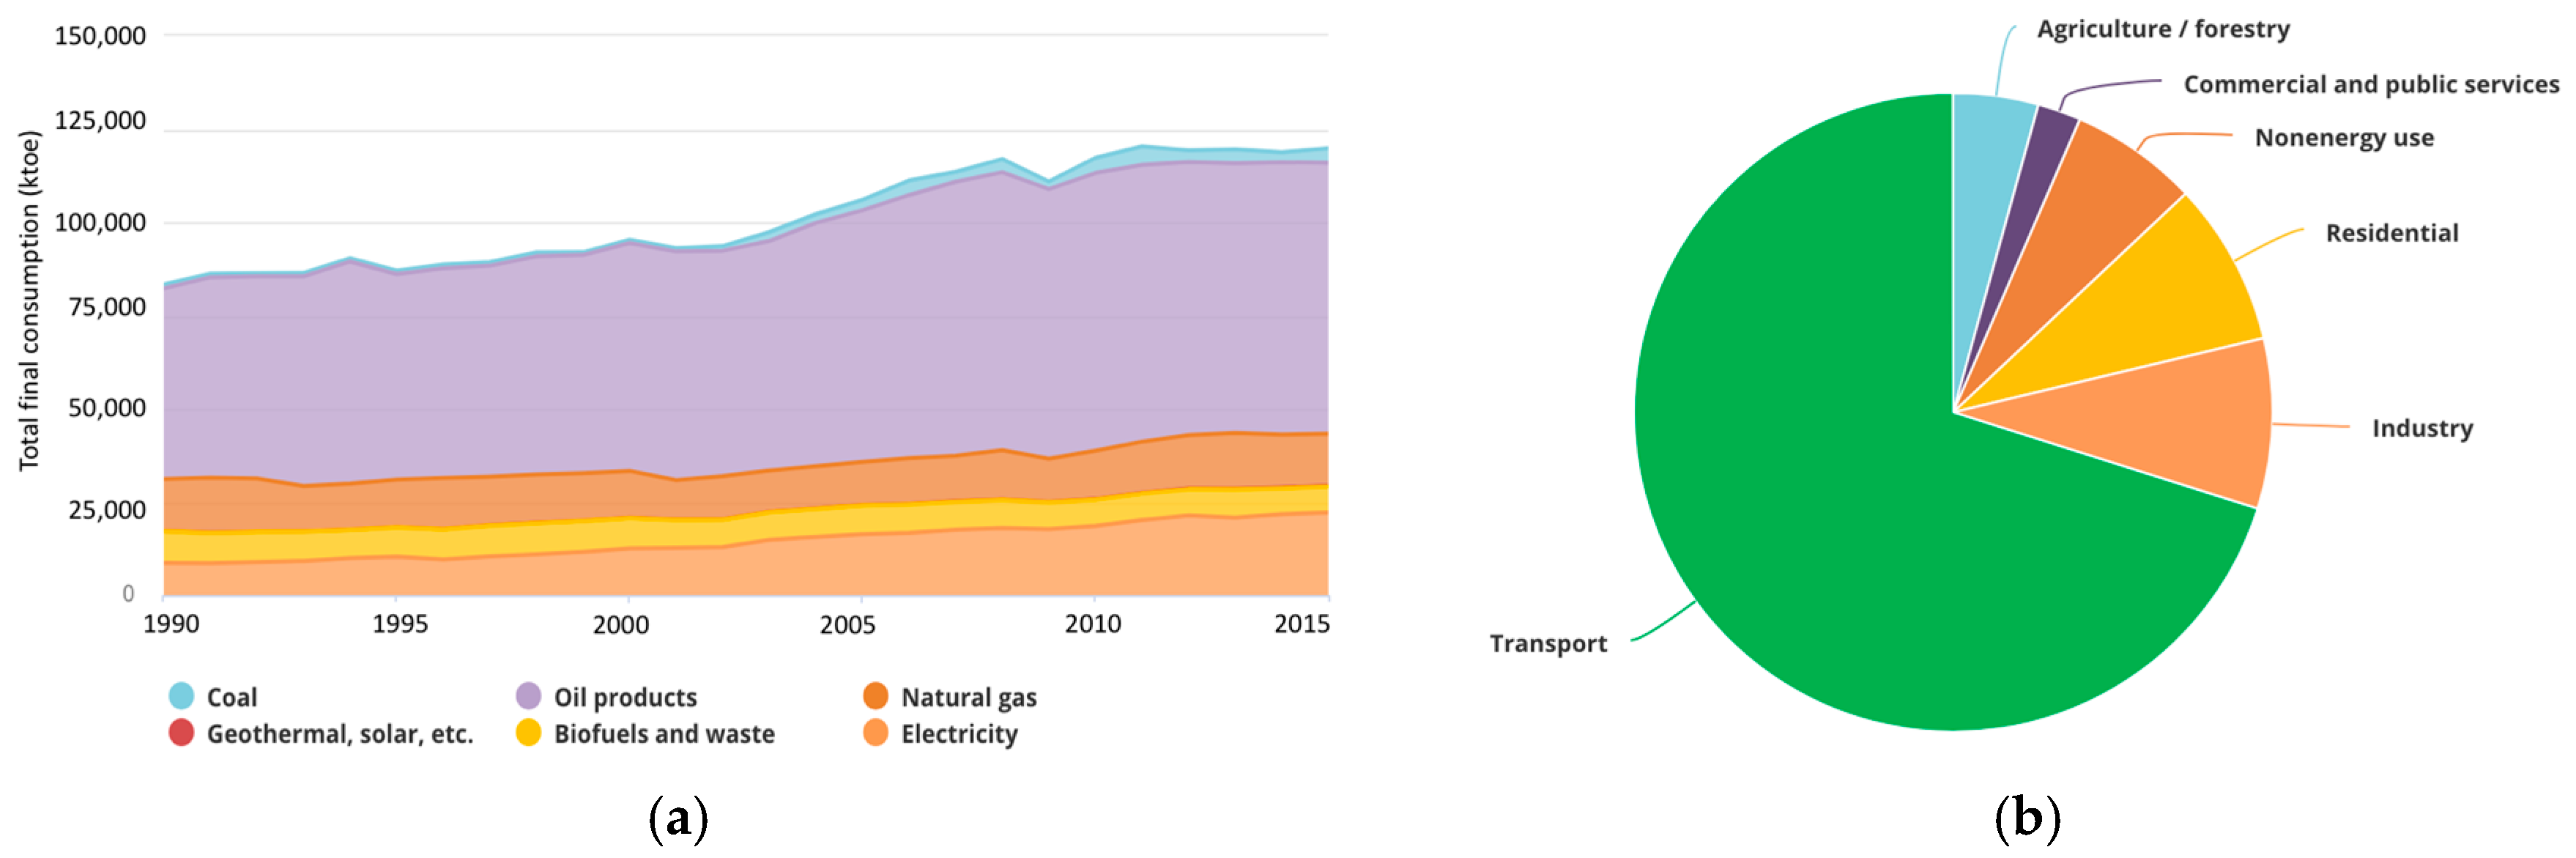
The building sector does not regularly exist as the one field that takes into account categorizing the final energy consumption. In fact, the International Energy Agency [1] divide the final energy consumption into three parts: industry, transport and ‘other’ (for residential, commercial and public services, agriculture/forestry, fishing and non-specified consumption). Allouhi et al. [2] reported that the buildings with their various types, are surely responsible for a major part of the consumed energy inside the ‘other’ sector. Figure 1 [1] shows total final consumption by source and share of oil products final consumption by sector, in Mexico.
The building sector, which covers residential, commercial and public buildings, includes many types of buildings (schools, universities, hotels, hospitals, offices, etc.) with a wide variety of uses and energy services. And yet, few sources offer data by typology and there is not consensus on a universal classification, which makes the analysis extremely difficult. The categorization for building is not universal, as these are associated to wide climate conditions and construction type variations, different building/space types and floor area, which makes the comparison and the analysis very difficult [3,4]. The buildings sector is the largest energy-consuming sector, accounting for over one-third of final energy consumption globally and an equally important source of carbon dioxide emissions. In certain regions highly dependent on traditional biomass, energy use in buildings represents as much as 80% of total final energy use [5]. In the case of Mexico, the building sector consumes 18% of country’s total energy [1,6]; and the university buildings belong to the building sector. Morillon et al. [7] determined that in Mexico, educational buildings (schools and universities) consume 14.5% of comercial building’ energy.
One university campus is a placed that encompasses a diversity of elements, different uses, buildings and usage profiles [8]. Moreover, educational buildings function as community centers of activity and learning; therefore, they must pose an exemplary management within the community and hence be able to demonstrate the best practices regarding high performance and energy consumption design. Optimizing energy consumption in buildings during operation can reduce significantly their impact on the global environment. Some authors have investigated energy consumption in university buildings: Yuan et al. [9] compare the effect of energy conservation measures between two buildings on university campus in northern China. Zhang and Xu [10] evaluated end use consumption in a university campus based on energy consumption surveys; Hong et al. [11] presented an energy consumption study for the University of Korea. Escrivá-Escrivá et al. [12] modeled space conditioning load curves in a university building in the Universidad Politécnica de Valencia in Spain; Aljami [13] performed an energy audit of an educational building in a hot summer climate in Kuwait; Desideri et al. [14] presented results from the European project Educa-RUE: an example of energy efficiency paths in educational buildings.
The amount of energy consumed for each build m2 (kWh/m2) and for each building user (kWh/person) pose the most commonly used indicators for energy consumption. Several authors [15,16,17,18,19] have defined these indicators in order to estimate the consumption of energy in higher education buildings. Therefore, due to the set of elements that have been provided for the quantification of energy consumption in buildings, there is solid ground for conducting diagnosis performance and evaluation of energy uses. Annual per capita consumption in the REI is 40 kWh/person: that is greater than the country’s average consumption [20].
An energy diagnosis (ED) is a tool that analyses, measures, and evaluate the main energy consuming equipment, systems and processes in a systematic and objective manner. ED offers a possibility of improvement, modernization and savings, which can lead to greater energy efficiency [21,22,23,24,25,26]. In such regard, ED allows for the enhancement of both environmental and production conditions in which has been involved, by being able to overcome the current conditions of productions and individuals’ performance [27]. In regular conditions, the exercise of an ED, made by professionals of the energy field, lead to reducing production costs without negatively affecting its quality and quantity.
The buildings ED is a habitual activity and promoted by authorities in countries belonging to Europe, North America and some countries in Asia. These three continents concentrate most of the scientific articles on energy diagnosis. On the other hand, in Central America, South America, Africa, Oceania and largely of Asia, the energy diagnosis is far from being an everyday activity, although a few authors from these continents have researched on buildings ED.
According to the National Commission for the Efficient Use of Energy (NCEUE-Mexico) [28], the main objectives of an ED are to establish energy saving goals, design and apply integral systems for saving energy, evaluate energy saving measures technically and economically and decrease energy consumption, without negatively affecting production levels and conditions.
Energy consumption and power demands are the main variables analysed in this research. Buildings comprehend approximately 40% of global energy consumption and also play an important role in the energy market. It is predicted that energy demand for buildings will continue growing worldwide in future decades [29,30,31]. As for this research, energy consumption means the amount of electrical energy consumed by REI users, while power demand means the resulting value out of calculating the average instantaneous power over a period of time [32]. There are different methods for calculating this value, but the most commonly used is the “sliding window”, in which the interval is 15 min.
This study is focused on an ED of university buildings in tropical climate conditions that is compared with an ED conducted at the same institution 10 years ago. We propose three levels of energy diagnosis to meet the NCEUE’s standards. These attributes differentiate this research from other similar studies.
Finally, the main aim of this research is to produce strategies and proposals derived from a third level energy diagnosis, by characterizing consumption patterns, in order to help achieving greater energy efficiency levels within the REI. The task at hand requires of the supporting participation of each person who either studies or works at the entity, while some other activities require economic stimulus for its implementation. To investigate the REI’s energy consumption is of importance for Mexico since this entity is dedicated to train professionals that will deal with their own researches on mechanisms and energy saving strategies. Therefore, such energy saving proposals applied in this place will serve as an example for students as well as for the community linked to the Institute. Recently, in August 2018, UNAM provided a new space to the REI. The place has a total area of 39.750 m2 and it is located near the REI. As a consequence, the Institute will be able to expand its teaching and research activities [33]. Therefore, new construction projects should take into consideration the energy saving proposals reported in this research.
Background
The REI is located in the municipality of Temixco, Morelos (Mexico). The climate of the Temixco zone is tropical (altitude: 1237 m). Precipitation varies 194 mm between the driest and wettest month. Average temperature varies 5.4 °C (see Table 1).
The REI is the result of teaching, research and dissemination activities performed institutionally since 1979, and also corresponds to the transformation of the Energy Research Centre (ERC) into an Institute in 2013.
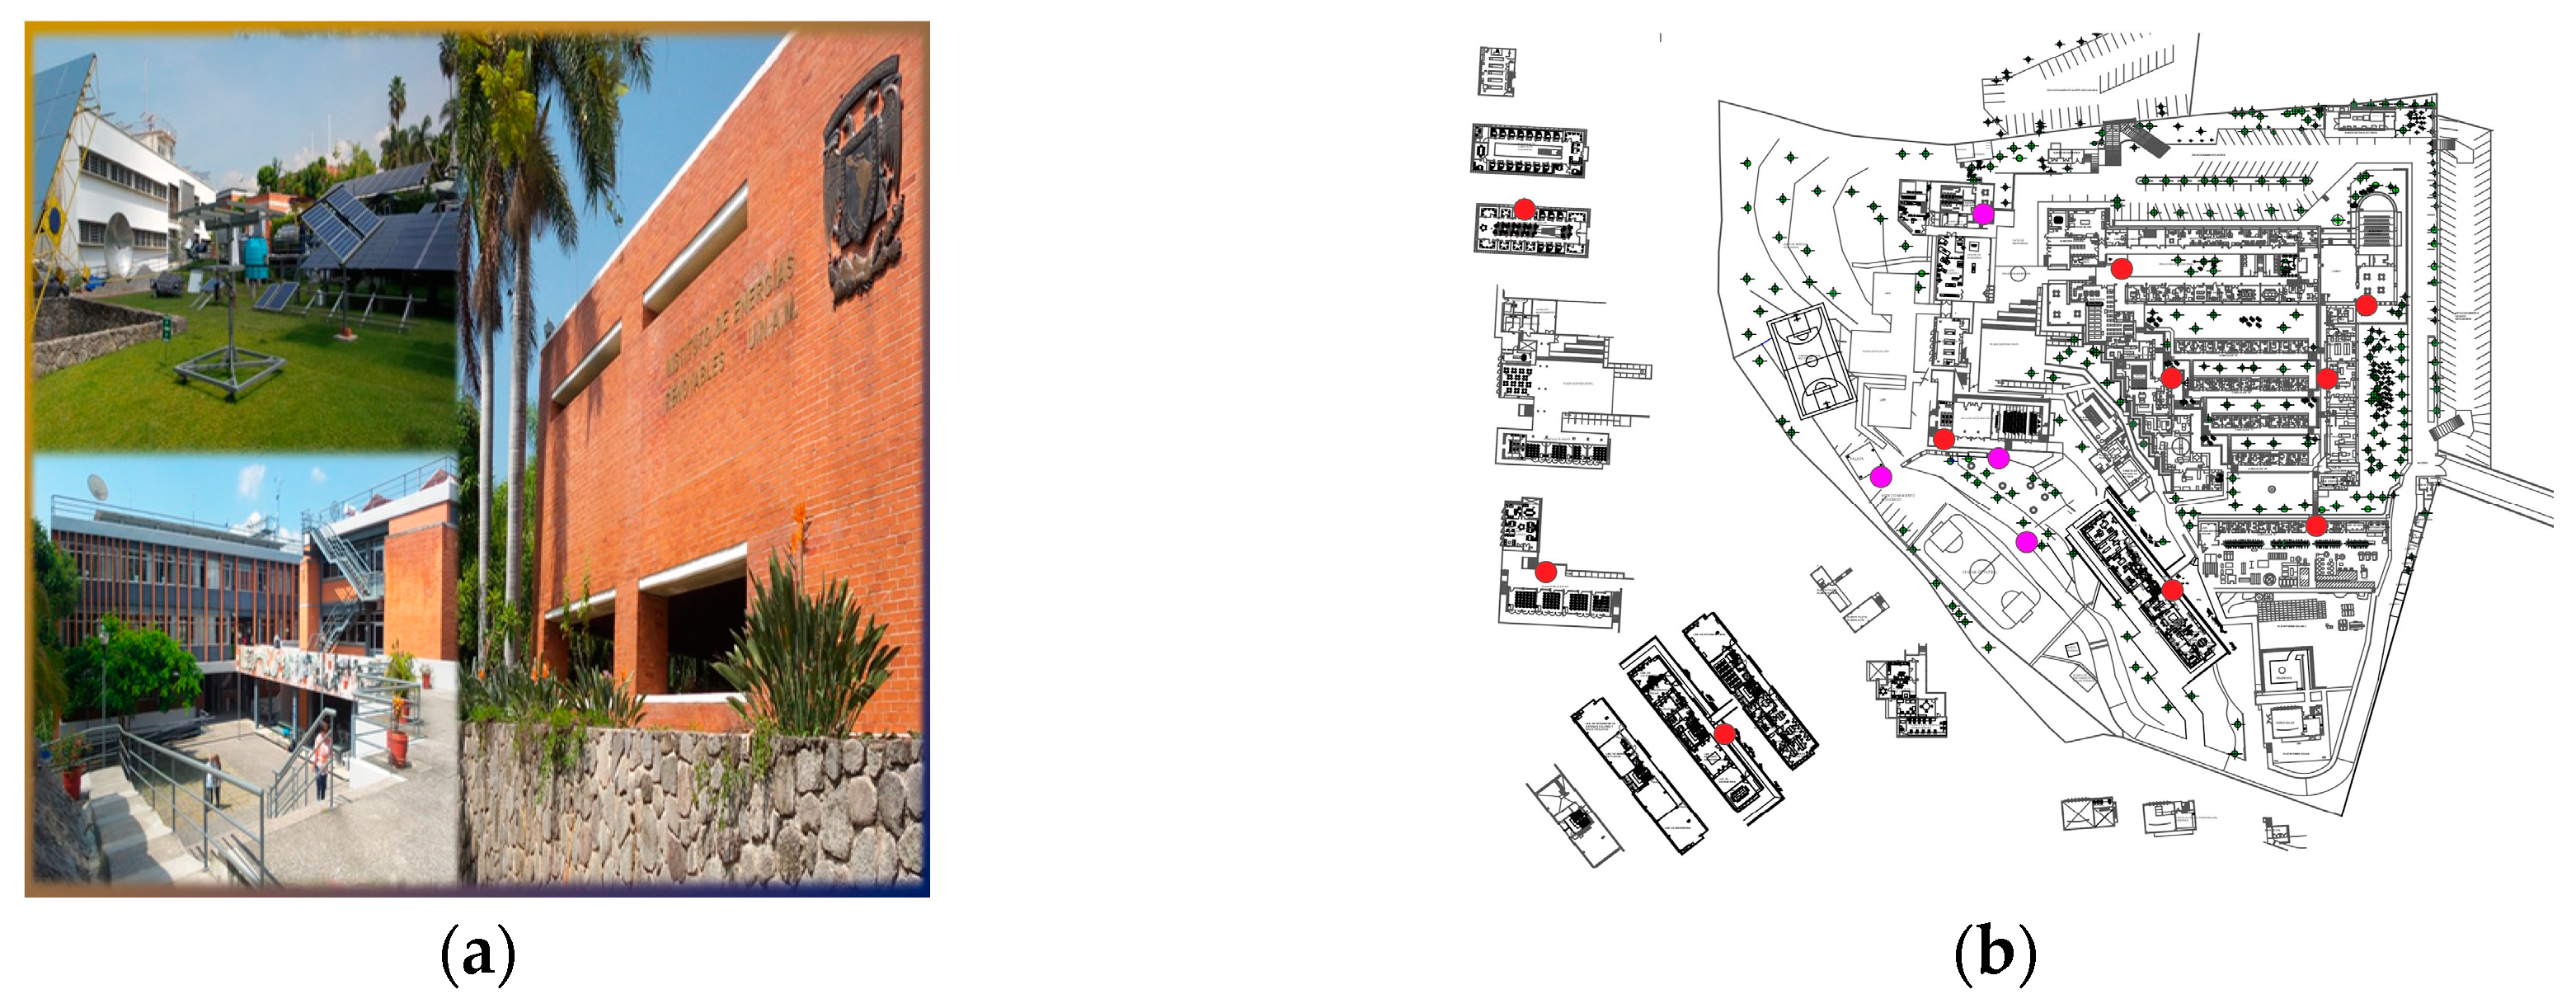
Back in year 2006, an ED was conducted at this entity. The ERC had 12,223 m2 distributed among 13 buildings, located in a total area of approximately 32,581 m2. According to this ED, for the activities performed in this institution, electric energy was required as the main source, in addition to small amounts of LP gas and diesel. The latter were needed to operate the emergency power plant, which was used sporadically when power outages in the area occurred [35]. The activities of this institution have not changed fundamentally in its evolution from centre to institute, but it has grown considerably in size. In the present time it has 14,700 m2 distributed among 36 buildings (Figure 2).
The mission of the Institute is to carry out basic and applied scientific research in energy, with emphasis on renewable energies, which contribute to the development of sustainable energy technologies. In the present days, renewable energy sources have gained much popularity for being an alternative energy source next to fossil fuel. Additionally, these sources present, during power generation, low or zero levels of pollutants emission to the environment. In spite of the fact that these sources still do not meet the energy needs, as fossil fuels do, they have been decisive as for solutions of many energy problems, like in the case of electric and water supply for rural sectors [36,37,38]. Moreover, the so-called conventional energy sources, based on hydrocarbons or combustible fuels, remain as the main energy source including both residential and productive sector. Therefore, since there are reasons for depending on those types of energy carriers, it is tremendously necessary to strengthen the saving measures and rational use of all potential sources of energy [35]. In any case, it is to be said that the saving and rational use of all energy forms will be at the centre of the application and control of a specific or detailed program for the same purpose. Regardless of the place in which it is done, buildings design starts from technically based methods or procedures in order to identify the efficiency and accountability with any type of energy.
2. Methodology
The ED performed entailed different stages: authorization management, previous diagnoses review, billing analysis, data collection, electrical parameters measurement, energy indicators and corrective measures approach. Below is the breakdown of each step:
- Asking the permission of REI authorities. In order to gain full cooperation from the REI staff and its users during the collection of technical data, permission and support was requested to Management.
- Reviewing a previously conducted ED at this institution: in this case, the CIE Energy Conservation Program [35].
- Performing analyses on the electric billing of 32 months (August 2013 to March 2016).
- Measurement of electrical parameters using a DM-III Multitest network analyzer for obtaining values on voltage, current, electrical consumption, etc. The equipment was connected to REI substation for one week (Monday to Friday).
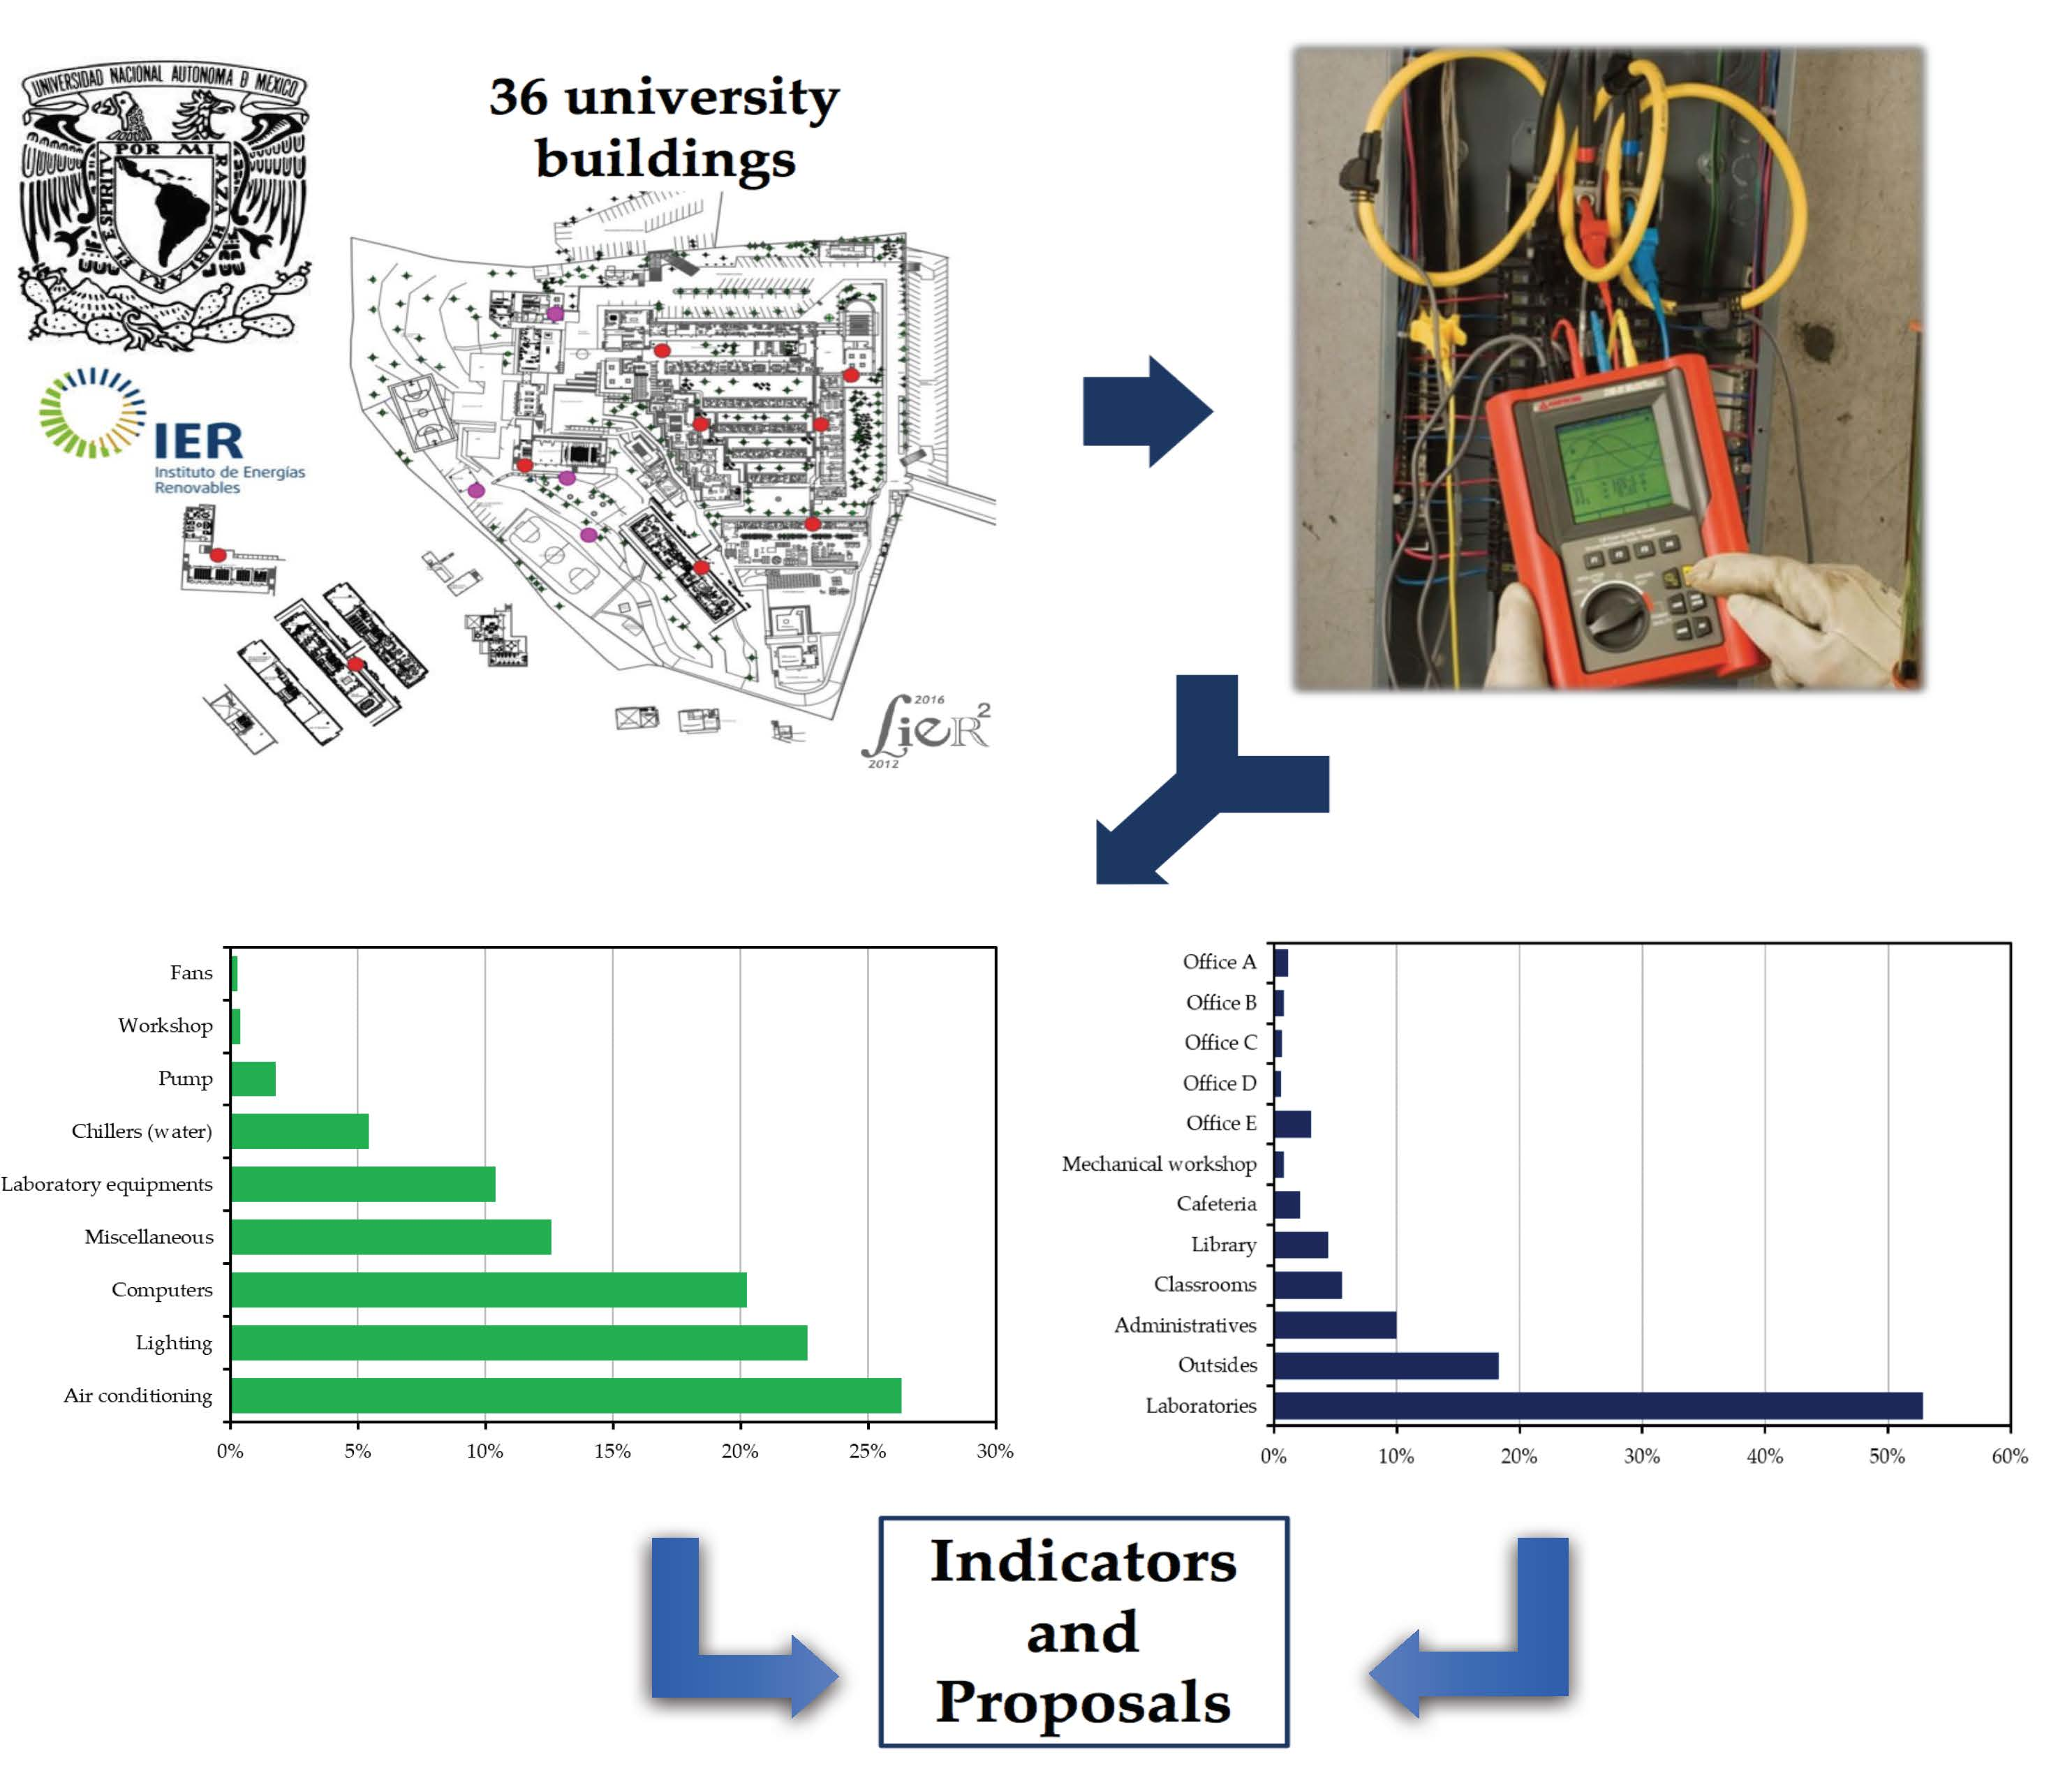
- Collecting of data throughout the entire Institute, and its 36 different areas. According to the different sorts of activities conducted in each area, and in order to simplify the exercise of this step, there were categories of interest established for the diagnosis of each one. This meant designing a different set of questions aimed at obtaining the specifics as for the equipment’s electrical parameters: computers, air conditioners, laboratory equipment, lighting, workshop, chillers (water based), fans, pumps and miscellaneous. Information was collected on the electrical parameters of each equipment (power, voltage, current), in addition to the period of daily use and days per week on use. Finally, the thrown data allowed an estimation about the installed, daily and weekly consumption demand.
- The energy indicators, according to the ISO 50001, Electricity Consumption Indicators (ECI) were established to qualify the performance of REI buildings; the indexes selected to qualify the institution were: surface ECI or built per m2 (kWh/m2) and personal ECI or per capita (kWh/person).
- Suggesting of corrective measures with or without investment. Once the energy consumption patterns were characterized and the starting point was established, various corrective measures were proposed.
We propose three levels of ED to meet the NCEUE’s standards. The energy diagnosis is then classified relative to its depth of analysis and for that there are three categories:
- Level one or basic: the ED is carried out with visual examination in which every piece of energy consuming equipment is recognized and reviewed in order to generate an idea of potential saving measures. These measures can go from suggestions of modification on operation habits, towards correction of waste disposal or incorporation of more efficient technologies. This analysis lacks actual measurement, then such energy saving potential measures are merely estimates and the savings may or may not be achieved. The main advantage of this approach is that it provides a general idea about the existence of possible energy savings (economical cost).
- Level two or fundamental: the ED provides information on energy consumption whether it is electric or thermal, at functional areas or in specific operation processes. This level of analysis is the most useful for determining potential savings in a facility due to its qualitative and quantitatively analysis on most of the energy consuming equipment. This level offers data on energy saving and costs reduction, thus stating goals for achieving greater energy efficiency. For this level it is important to have all equipment and instruments necessary for the evaluation of energy parameters.
- Level three or advanced: the ED generates precise and detailed information on each one of the relevant points of the industrial process diagram, or any installation to be evaluated; as well as the energy losses of all equipment involved. This level of analysis is characterized by the participation of specialists and the use of the extensive instrumentation related to data acquisition. Studies on engineering and actions suggested for achieving energy saving are the product of the reengineering process. In fact, the cost is much greater in the second level of analysis.
Despite the existence of this classification, the ED levels are not rigid. In many cases, a study can be applied to a single part or stage of the process or installation, thus granting the possibility to create intermediate levels that may focus on certain objectives and scopes for specific areas of the process or installation
3. Results and Analyse
3.1. Electricity Billing
The energy supply for the REI is provided by the Federal Electricity Commission CFE as it was established in a contract for the H-M tariff (H: hourly; M: medium voltage). This applies to energy services of any kind; and as it is of medium voltage supply, and then the demand of 100 kW or more is needed. Additionally, the CFE makes special distinctions between charges depending on which area of the Mexican territory the facility is located. According to the receipts emitted by CFE (from August 2013 until March 2016) as for the REI energy use, electric demand was of 130 kW, considering that is located in the country’s central region. Furthermore, there are benefits for the use of all potential power that occurred once during each of the revised months.
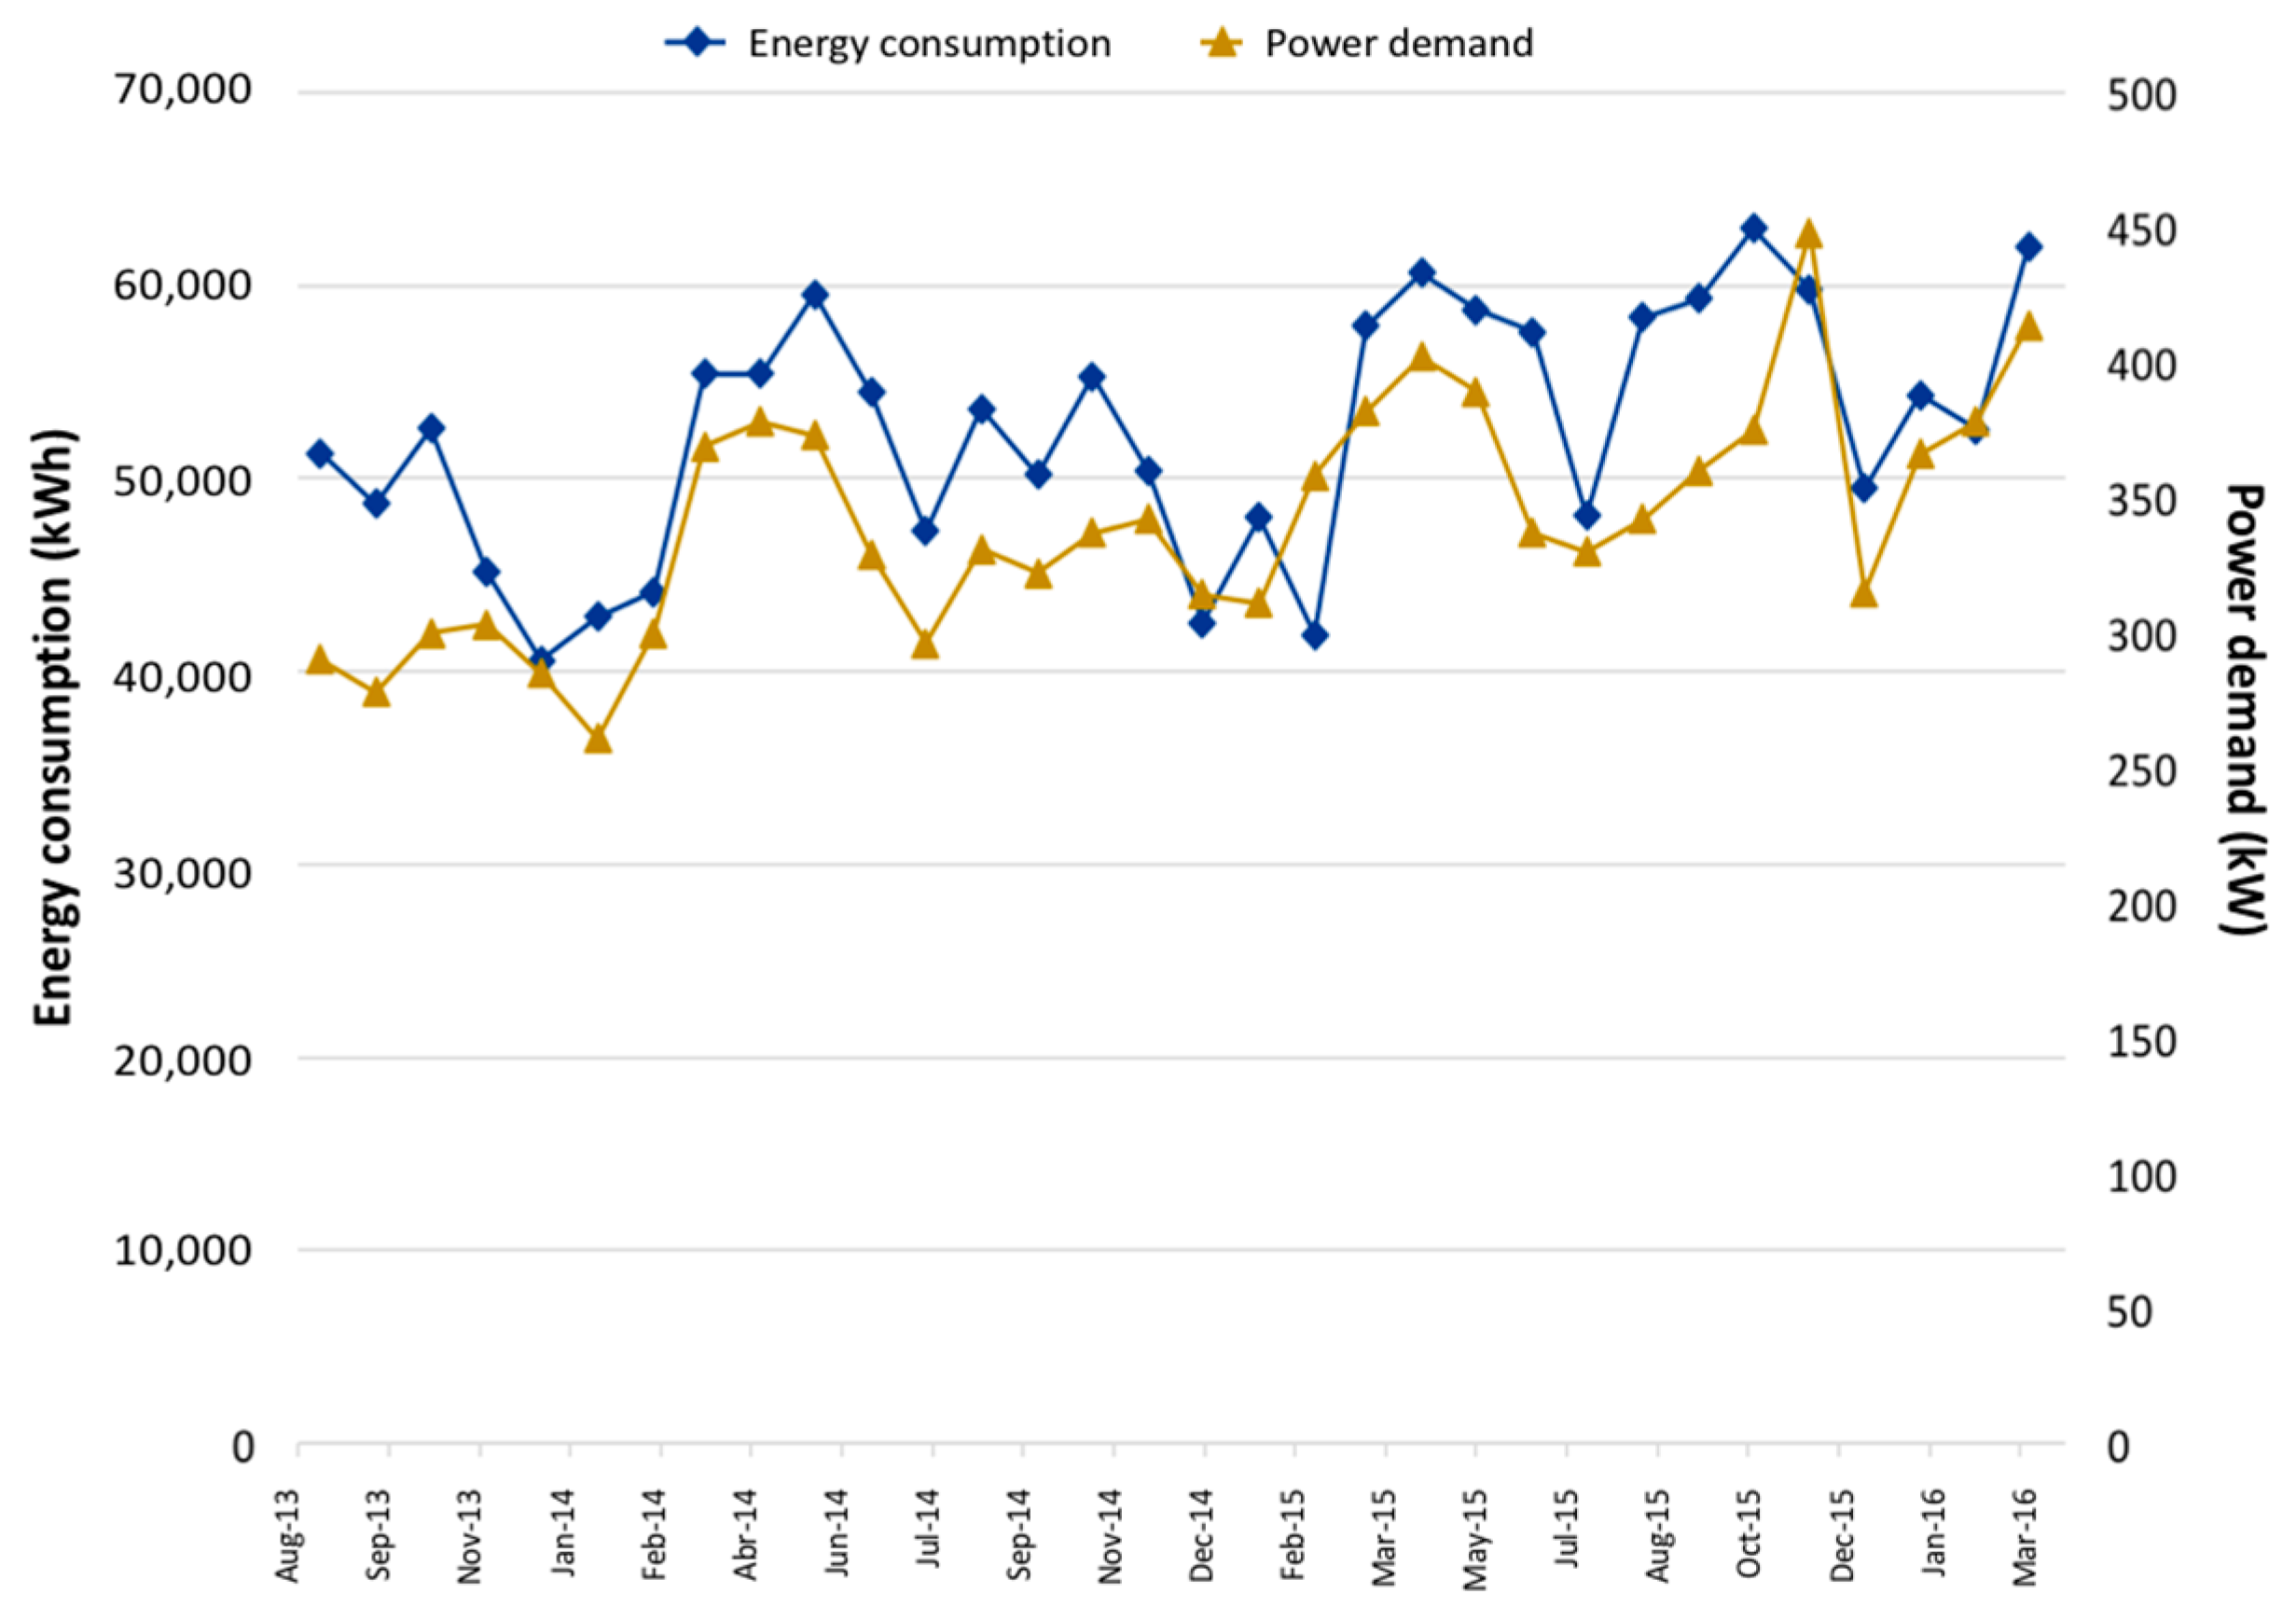
Figure 2 shows the consumption behaviour of electrical energy (in kWh), and the potential demand (in kW) as for the months indicated. A growing trend can be observed over time, which corresponds to the increasing in size that the Institute experienced in recent years. There are also periods of time where the consumption and demand levels were lower, specifically during June–July and December to January. This is because those are holiday periods for teachers, students and administrative staff, hence the number of users decreases considerably, and that is reflected in the levels of demand and consumption of energy. Additionally, it is a fact that during all year, the REI users make use of the air conditioning system due to the high temperatures from January until December (see Table 1). As other authors [36,37,38] have detected variability in energy consumption related to climate conditions, the case of the REI’s energy consumption level presents no variation in such terms because the area of Temixco is characterized by its tropical climate conditions.
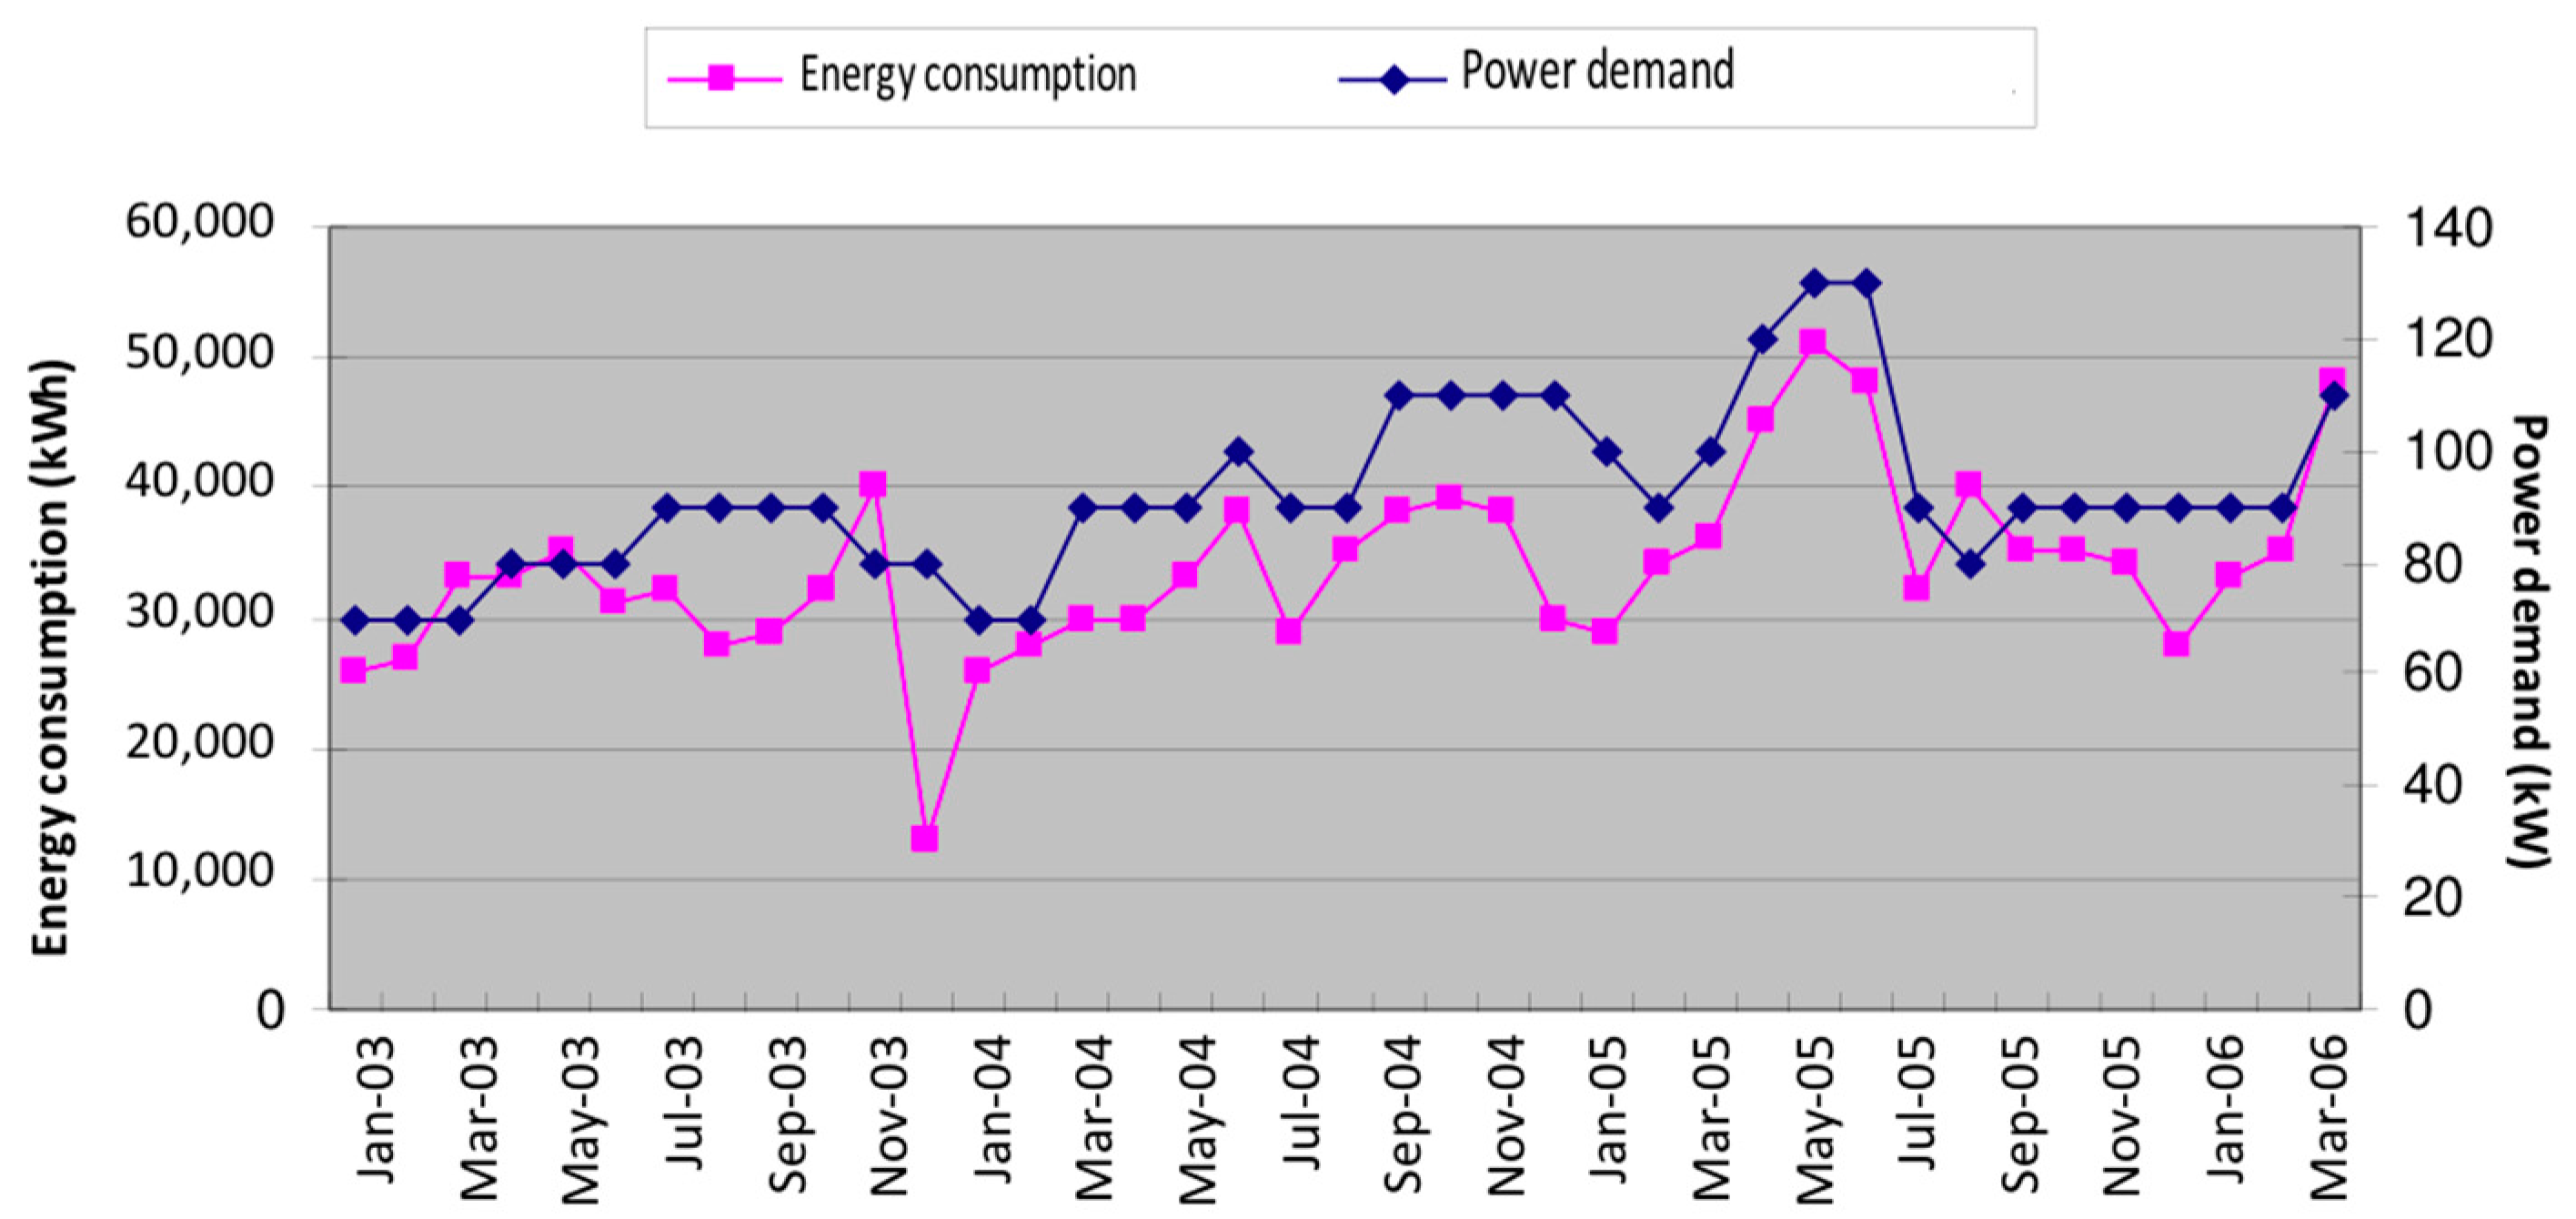
When comparing the month of September 2013 with September 2015, an increase can be seen of 21% on energy consumption and of 29% on power demand. Such increase is directly related to the implementation of Building 3.1 at the end of 2014. This building has a number of laboratories containing specialized equipment that consume a considerable amount of energy. It also can be seen that, when comparing the month of January 2016 with January 2006 [35], there is an increase in energy consumption of more than 100%, while power demand increased more than 500% (see Figure 3 and Figure 4).
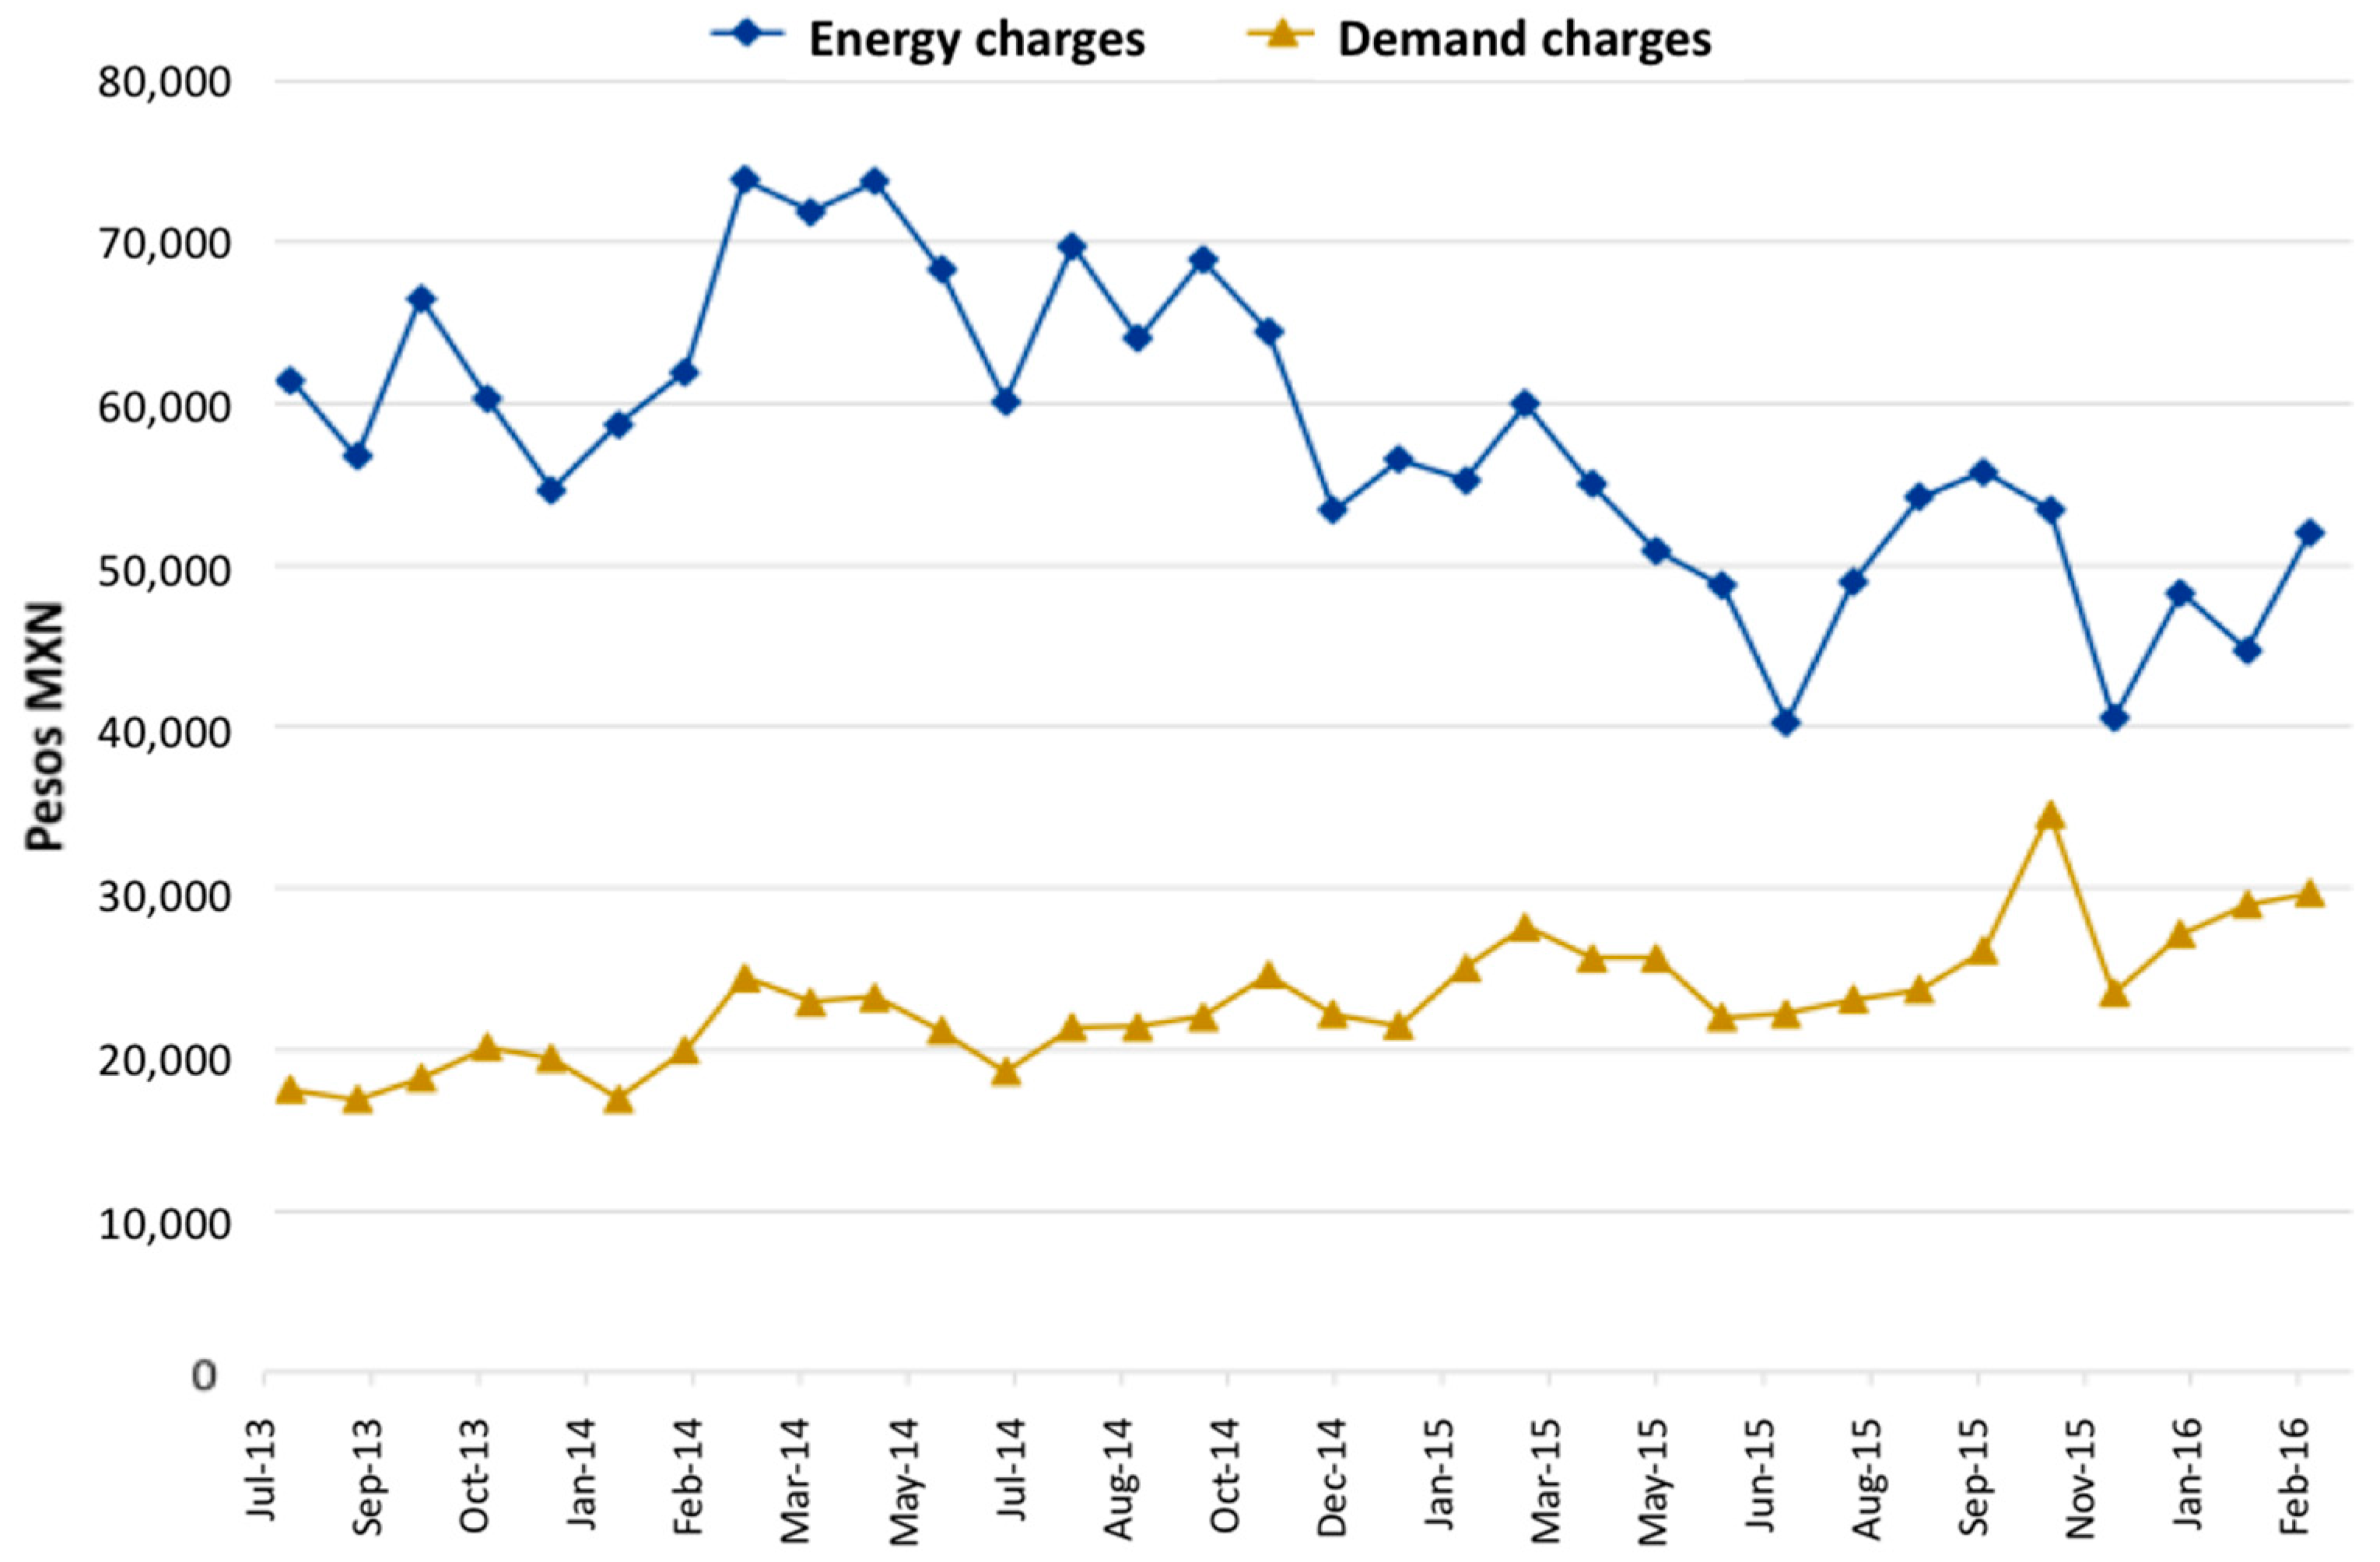
The changes in consumption and demand are reflected in the charges of energy and demand. Figure 5 shows the behaviour of both elements throughout the same period of time. It can be noticed that the amount of energy charges has been decreasing, while amounts of demand charges have increased. This decrease in payment for energy is caused by the incorporation of photovoltaic repairs in the Institute. This source of energy can supply up to 21% of the Institute’s total energy demand.
3.2. Electrical Parameters Measurement
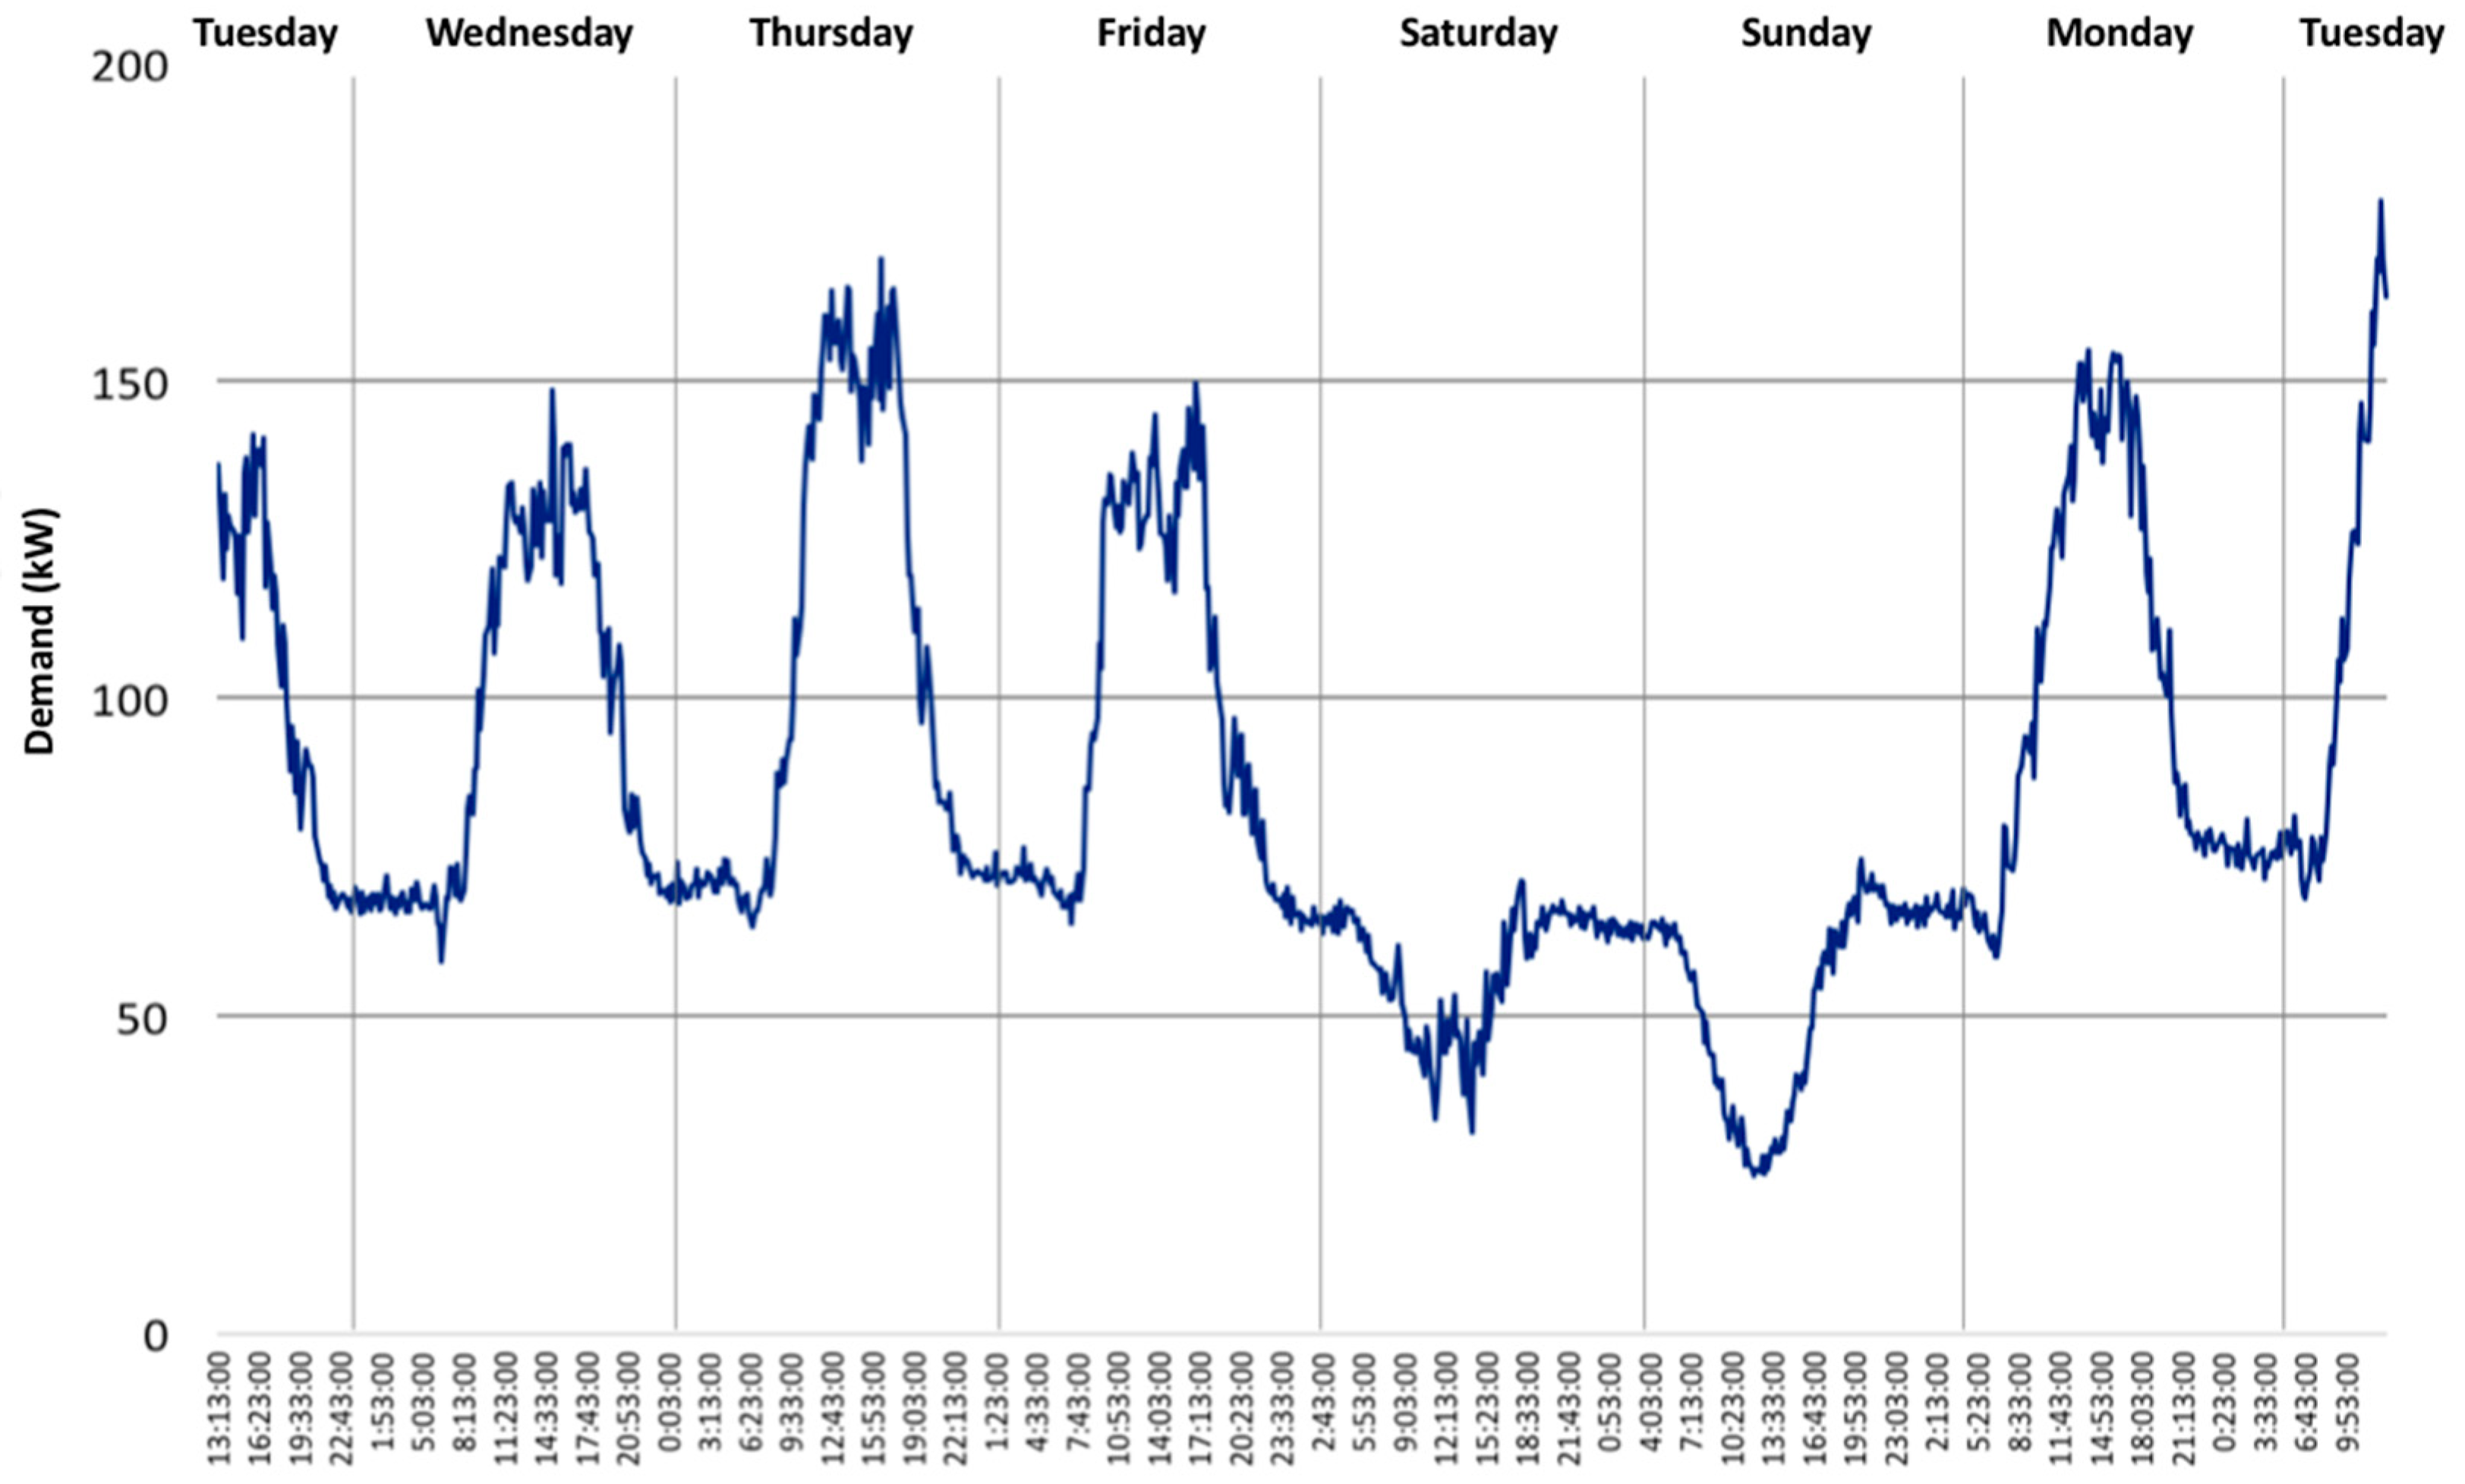
Figure 6 shows the instantaneous load profile of the REI. There, it can be noticed that the demand profile from Monday to Friday is similar. Demand begins increasing at 8:00, time in which working activities start in the facilities of the Institute. Maximum demand peaks appear during 13:00 and 17:00, and the average value of maximum demand registered is of 102.16 kW. The minimum demand is between 6:00–7:00 during the week and weekends, and the minimum value registered lies within 25 and 75.95 kW. The trend observed in Figure 4 is caused by the increased usage of the REI’s facilities during the day and also by the increase of environment temperature after lunch time. When comparing the data from 2006, as the average of maximum demand was of 90 kW and the minimum demand of around 30 kW [35], it can be demonstrated that demand has grown 16% during the past 10 years.
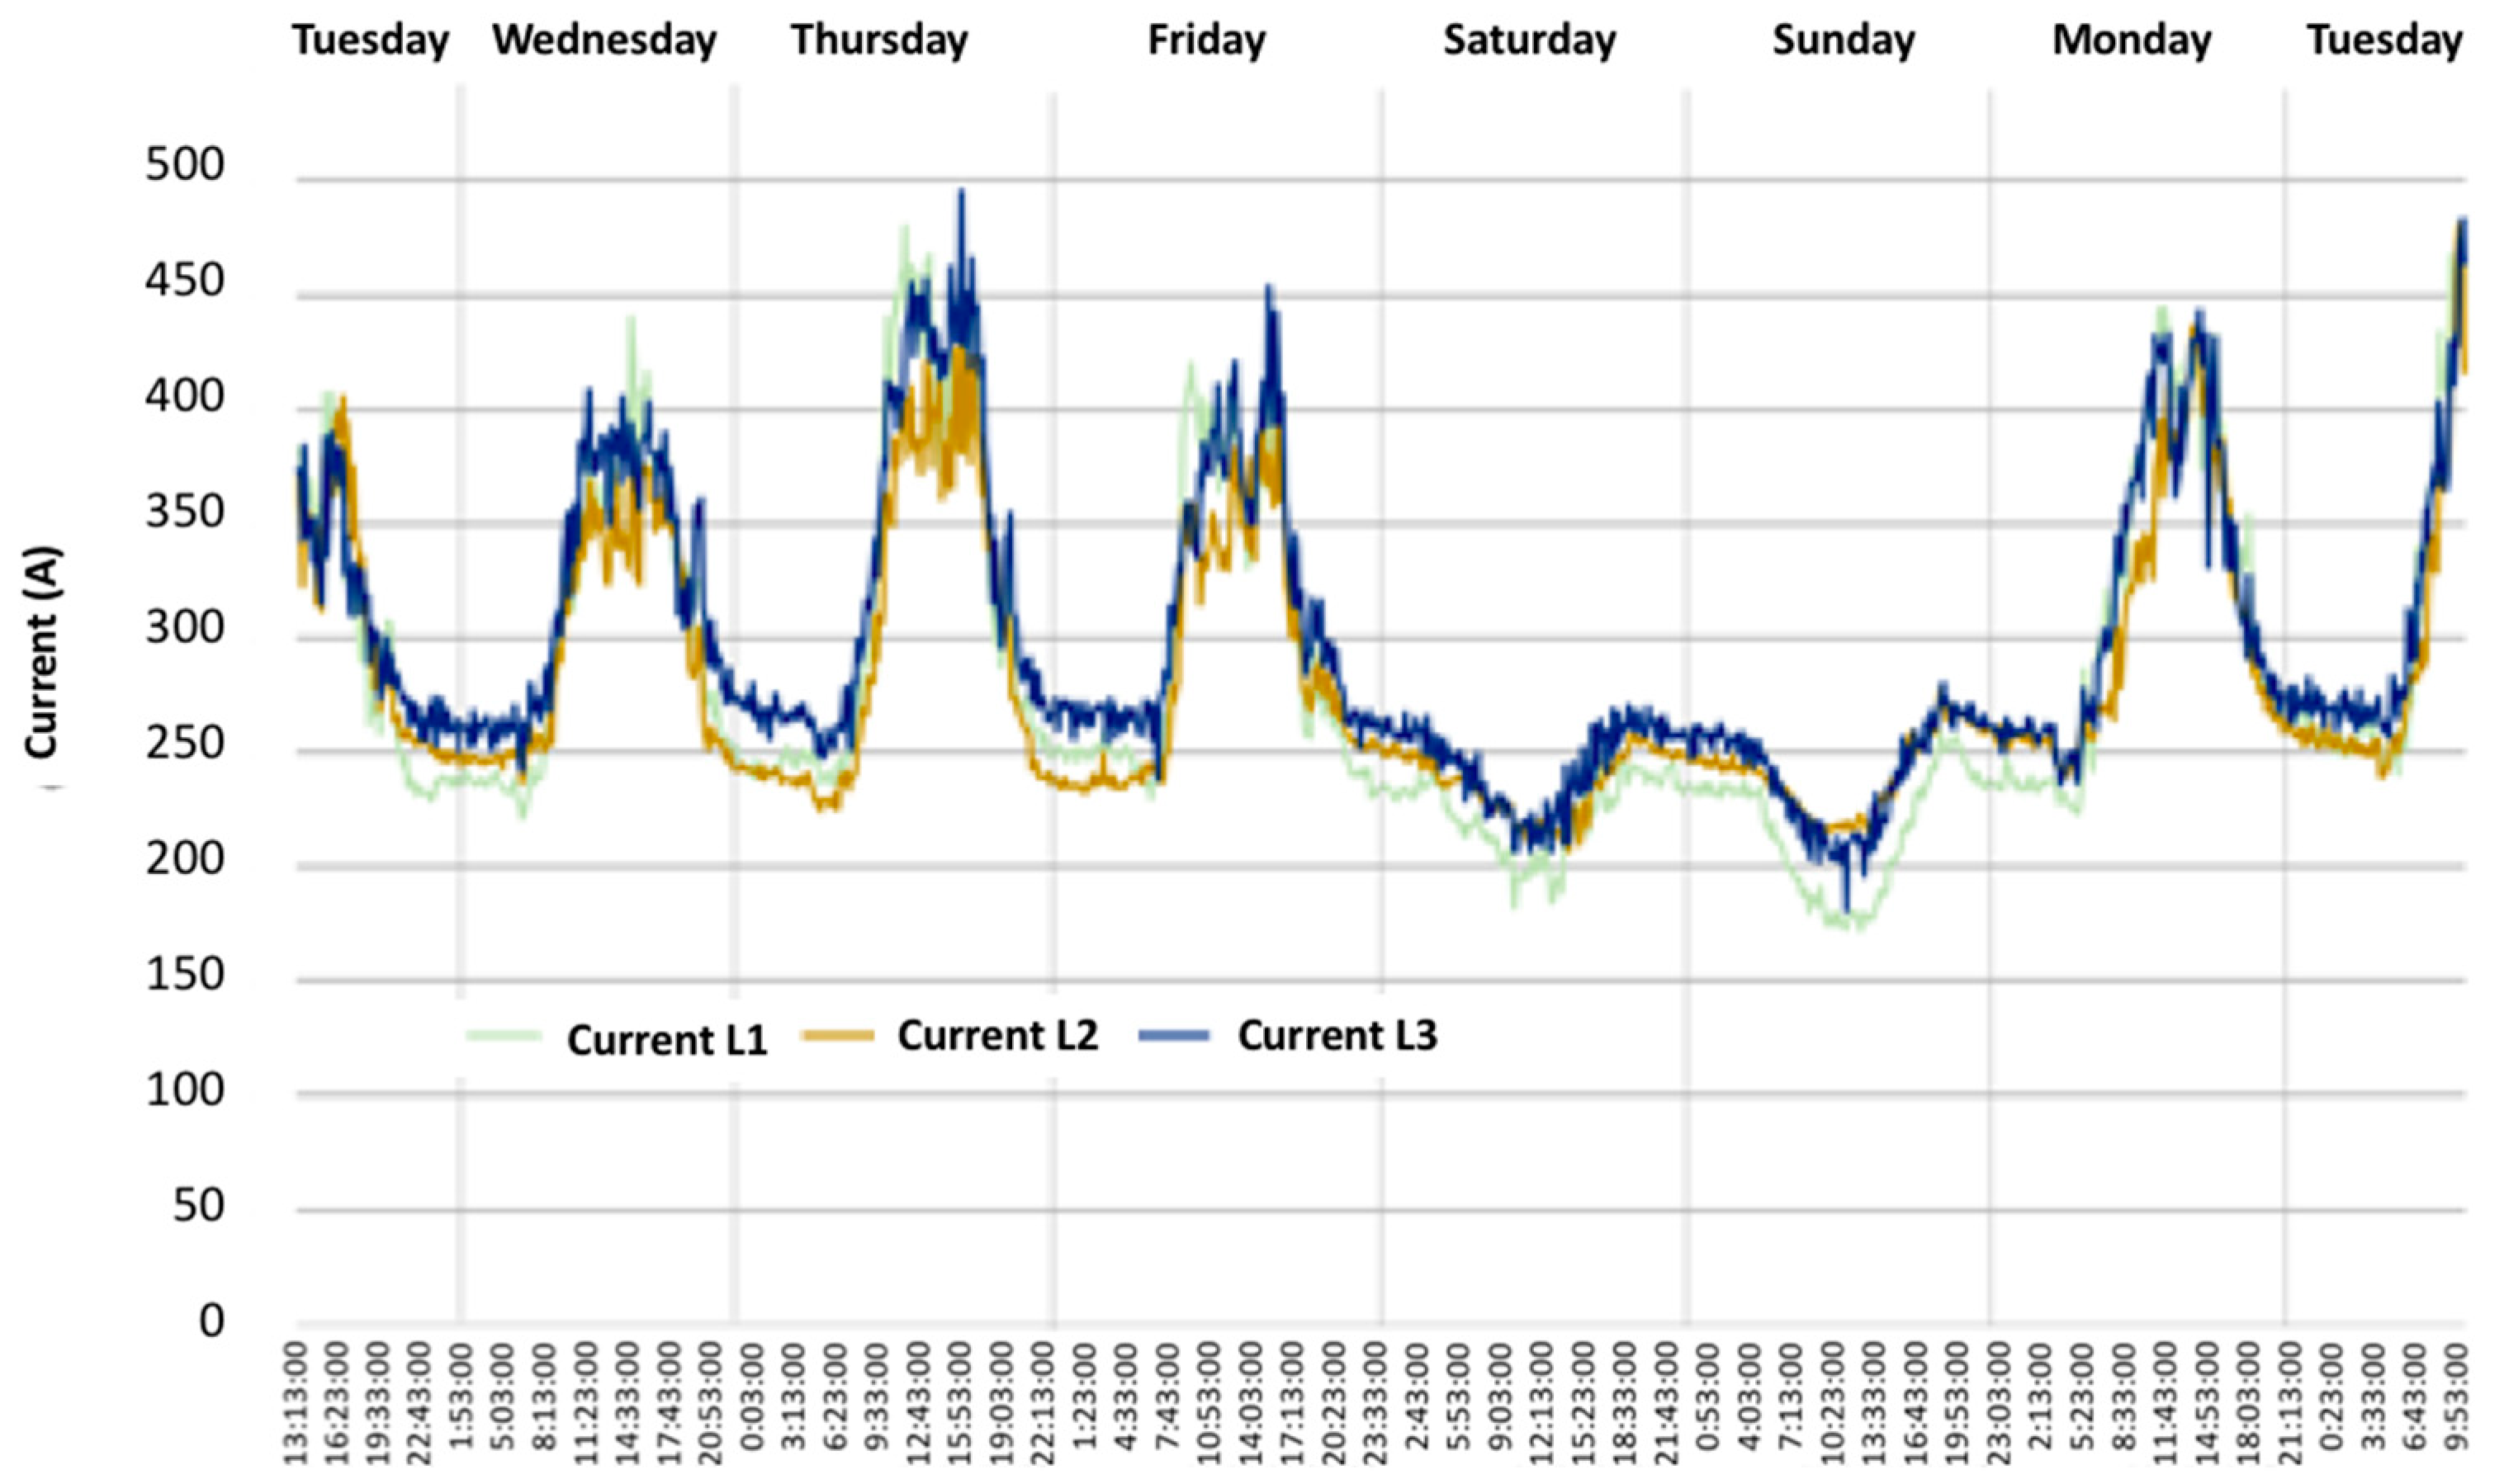
Figure 7 presents the profile of current levels for each phase. As it can be seen, the highest demand levels appear from Monday to Tuesday. According to the instantaneous load profile, the increase starts, during work week, at 8:00 and it maintains a high demand rate until 21:00 approximately. During weekends, demand level is minimal.
3.3. Results of the REI-UNAM Survey
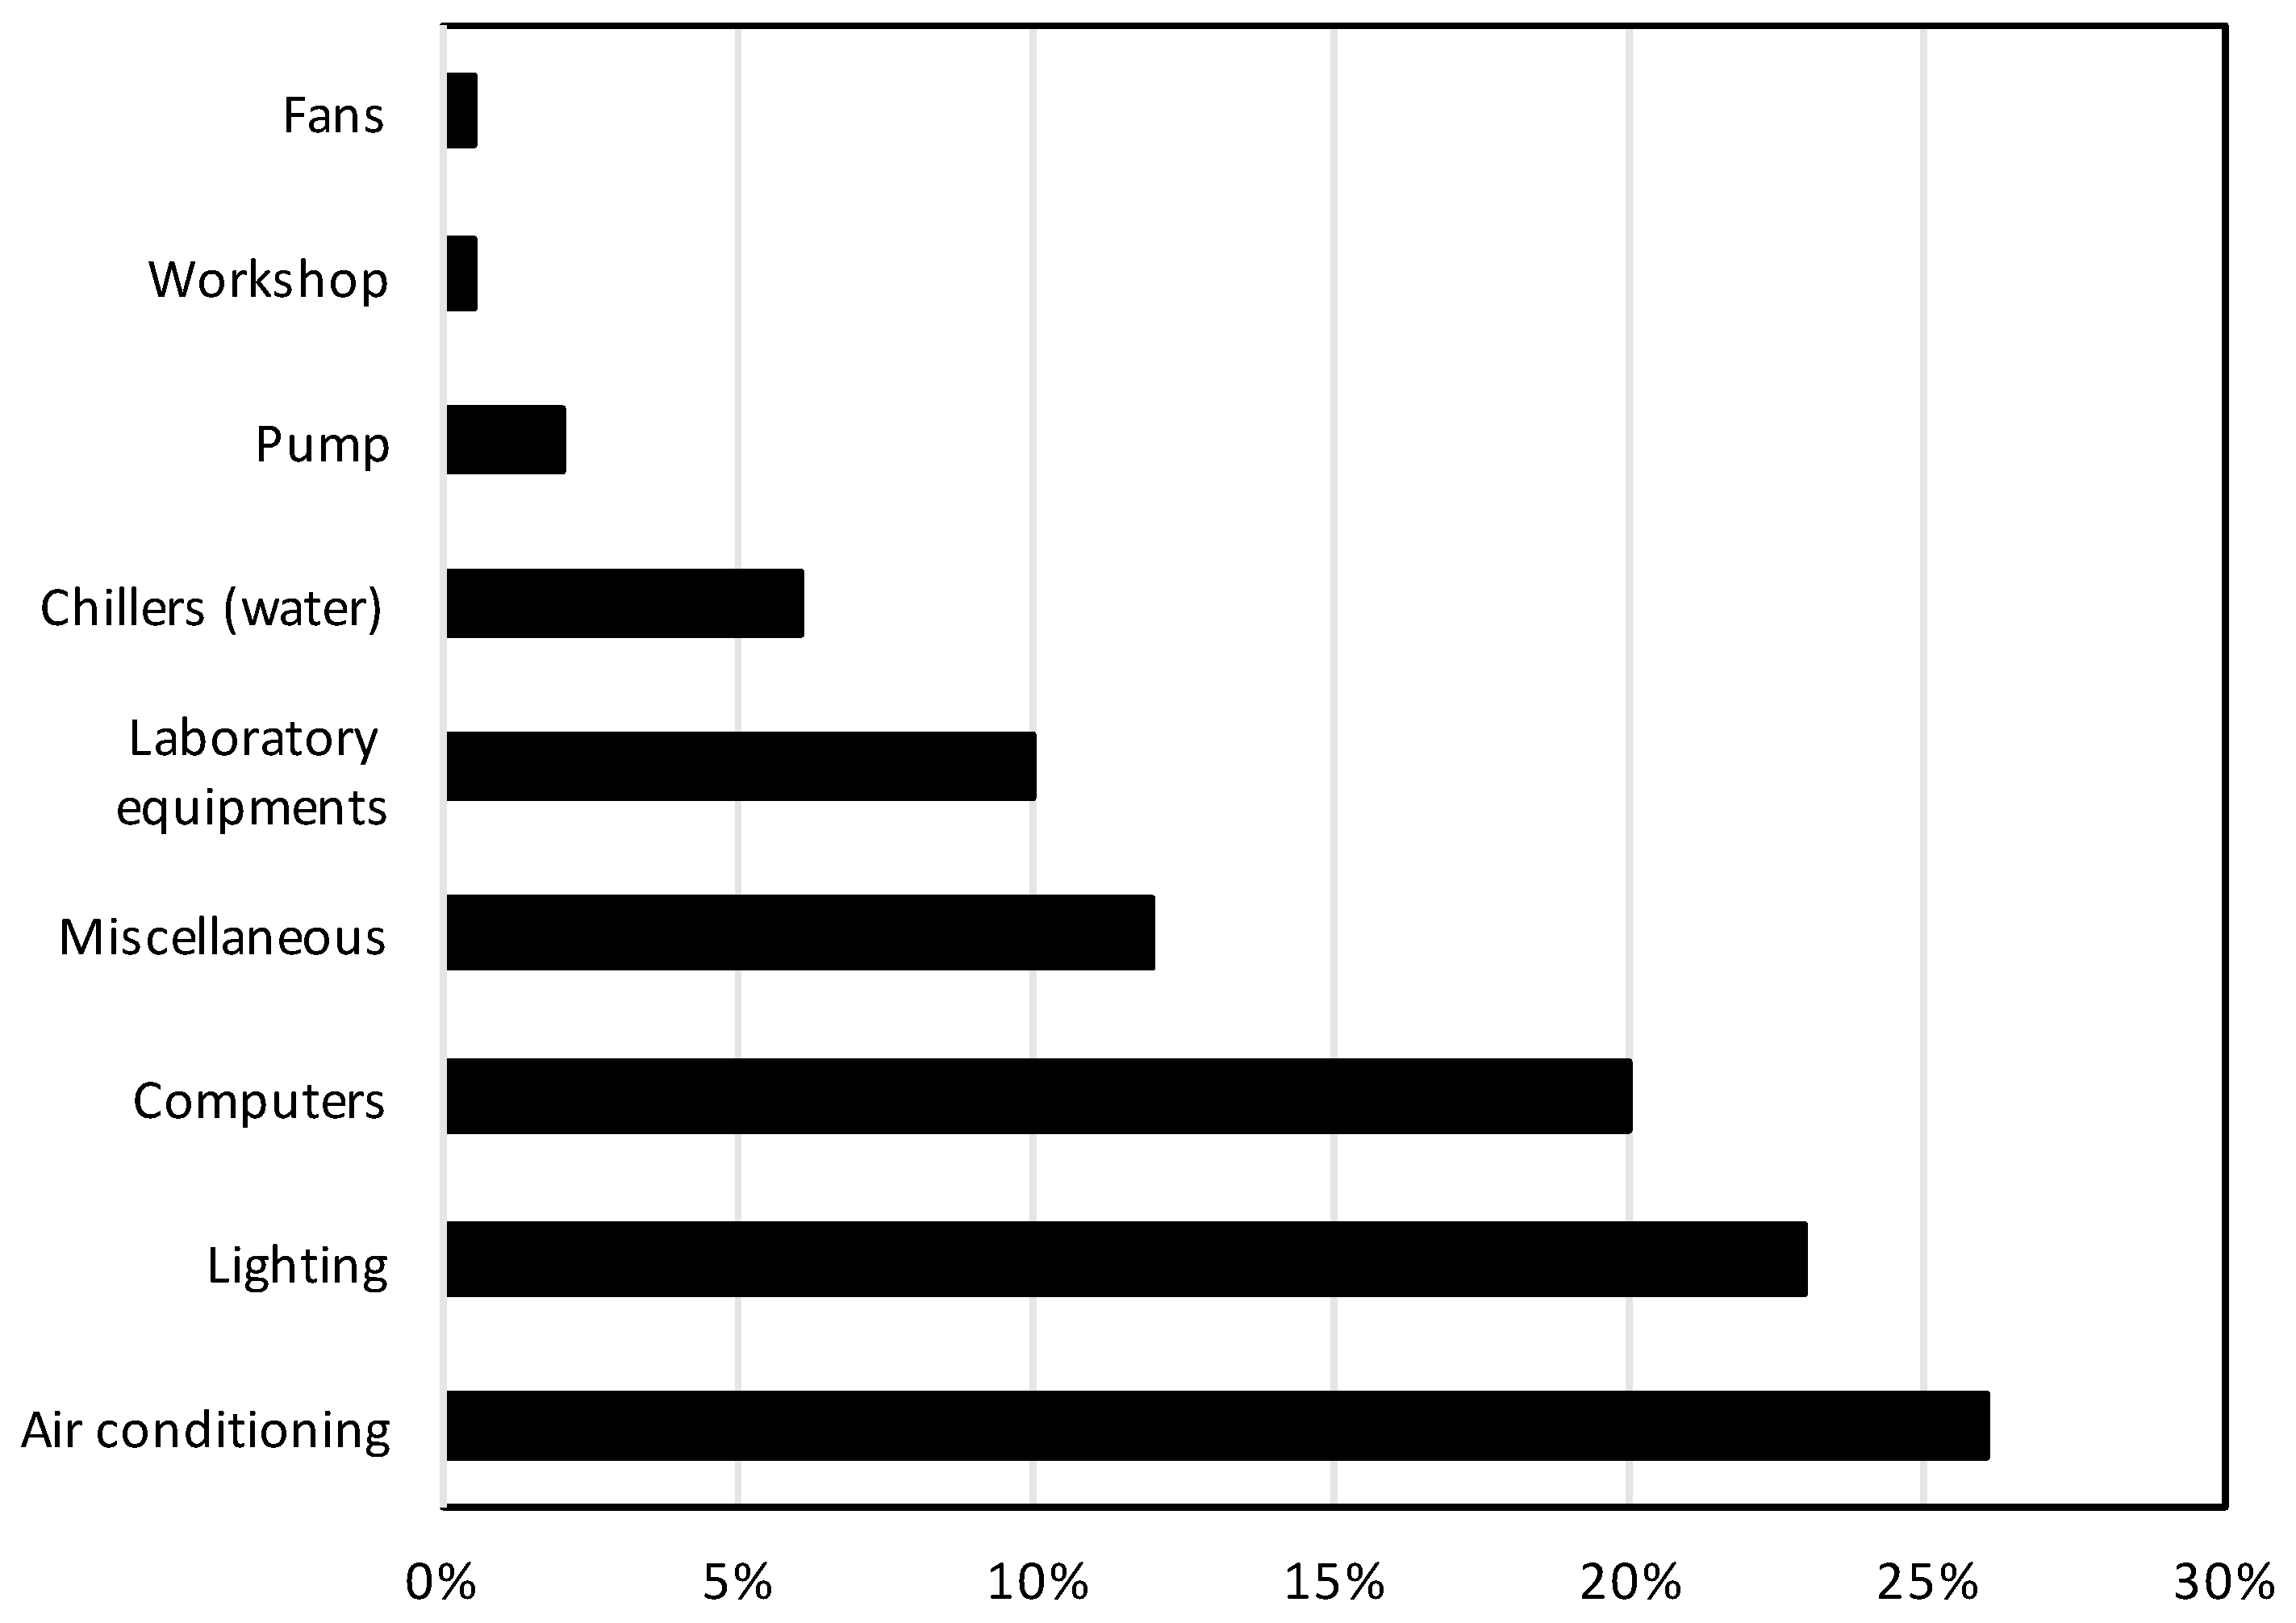
A total of 1096 luminaires distributed throughout the institute were counted. These devices correspond to an installed power of approximately 117.2 kW. In the computer category, 411 computer units (such as computers, screens, printers, etc.), make use of 107.9 kW of power. 52 air conditioning units of different capacities are responsible for 240.7 kW. Below in Table 2 and in relation to the 9 categories extracted from the data collection, indicators for daily consumption, weekly consumption and potential demand can be observed.
Results taken from Table 2 can be used for calculation of monthly consumption: time period in which electricity is billed. This can be done by multiplying the weekly energy consumption value by 4.
Based on the Monthly consumption, Figure 8 shows the energy consumption percentage for each category. It is worth to mention that actions must be taken to reduce the air conditioning and lighting percentages, since those two categories present the highest values. High energy consumption of air conditioning system is due to the fact that maximum ambient temperature is close to 30 °C during the entire year. Other authors [39,40,41] have also determined that it is the air conditioning system the piece of equipment that consumes most energy within a building. It should also be noted that in the 2006 ED, the categories for computers and air conditioning were responsible for 37% and 15% of energy consumption respectively. Lighting comprehended only 10% of the energy consumption for the REI.
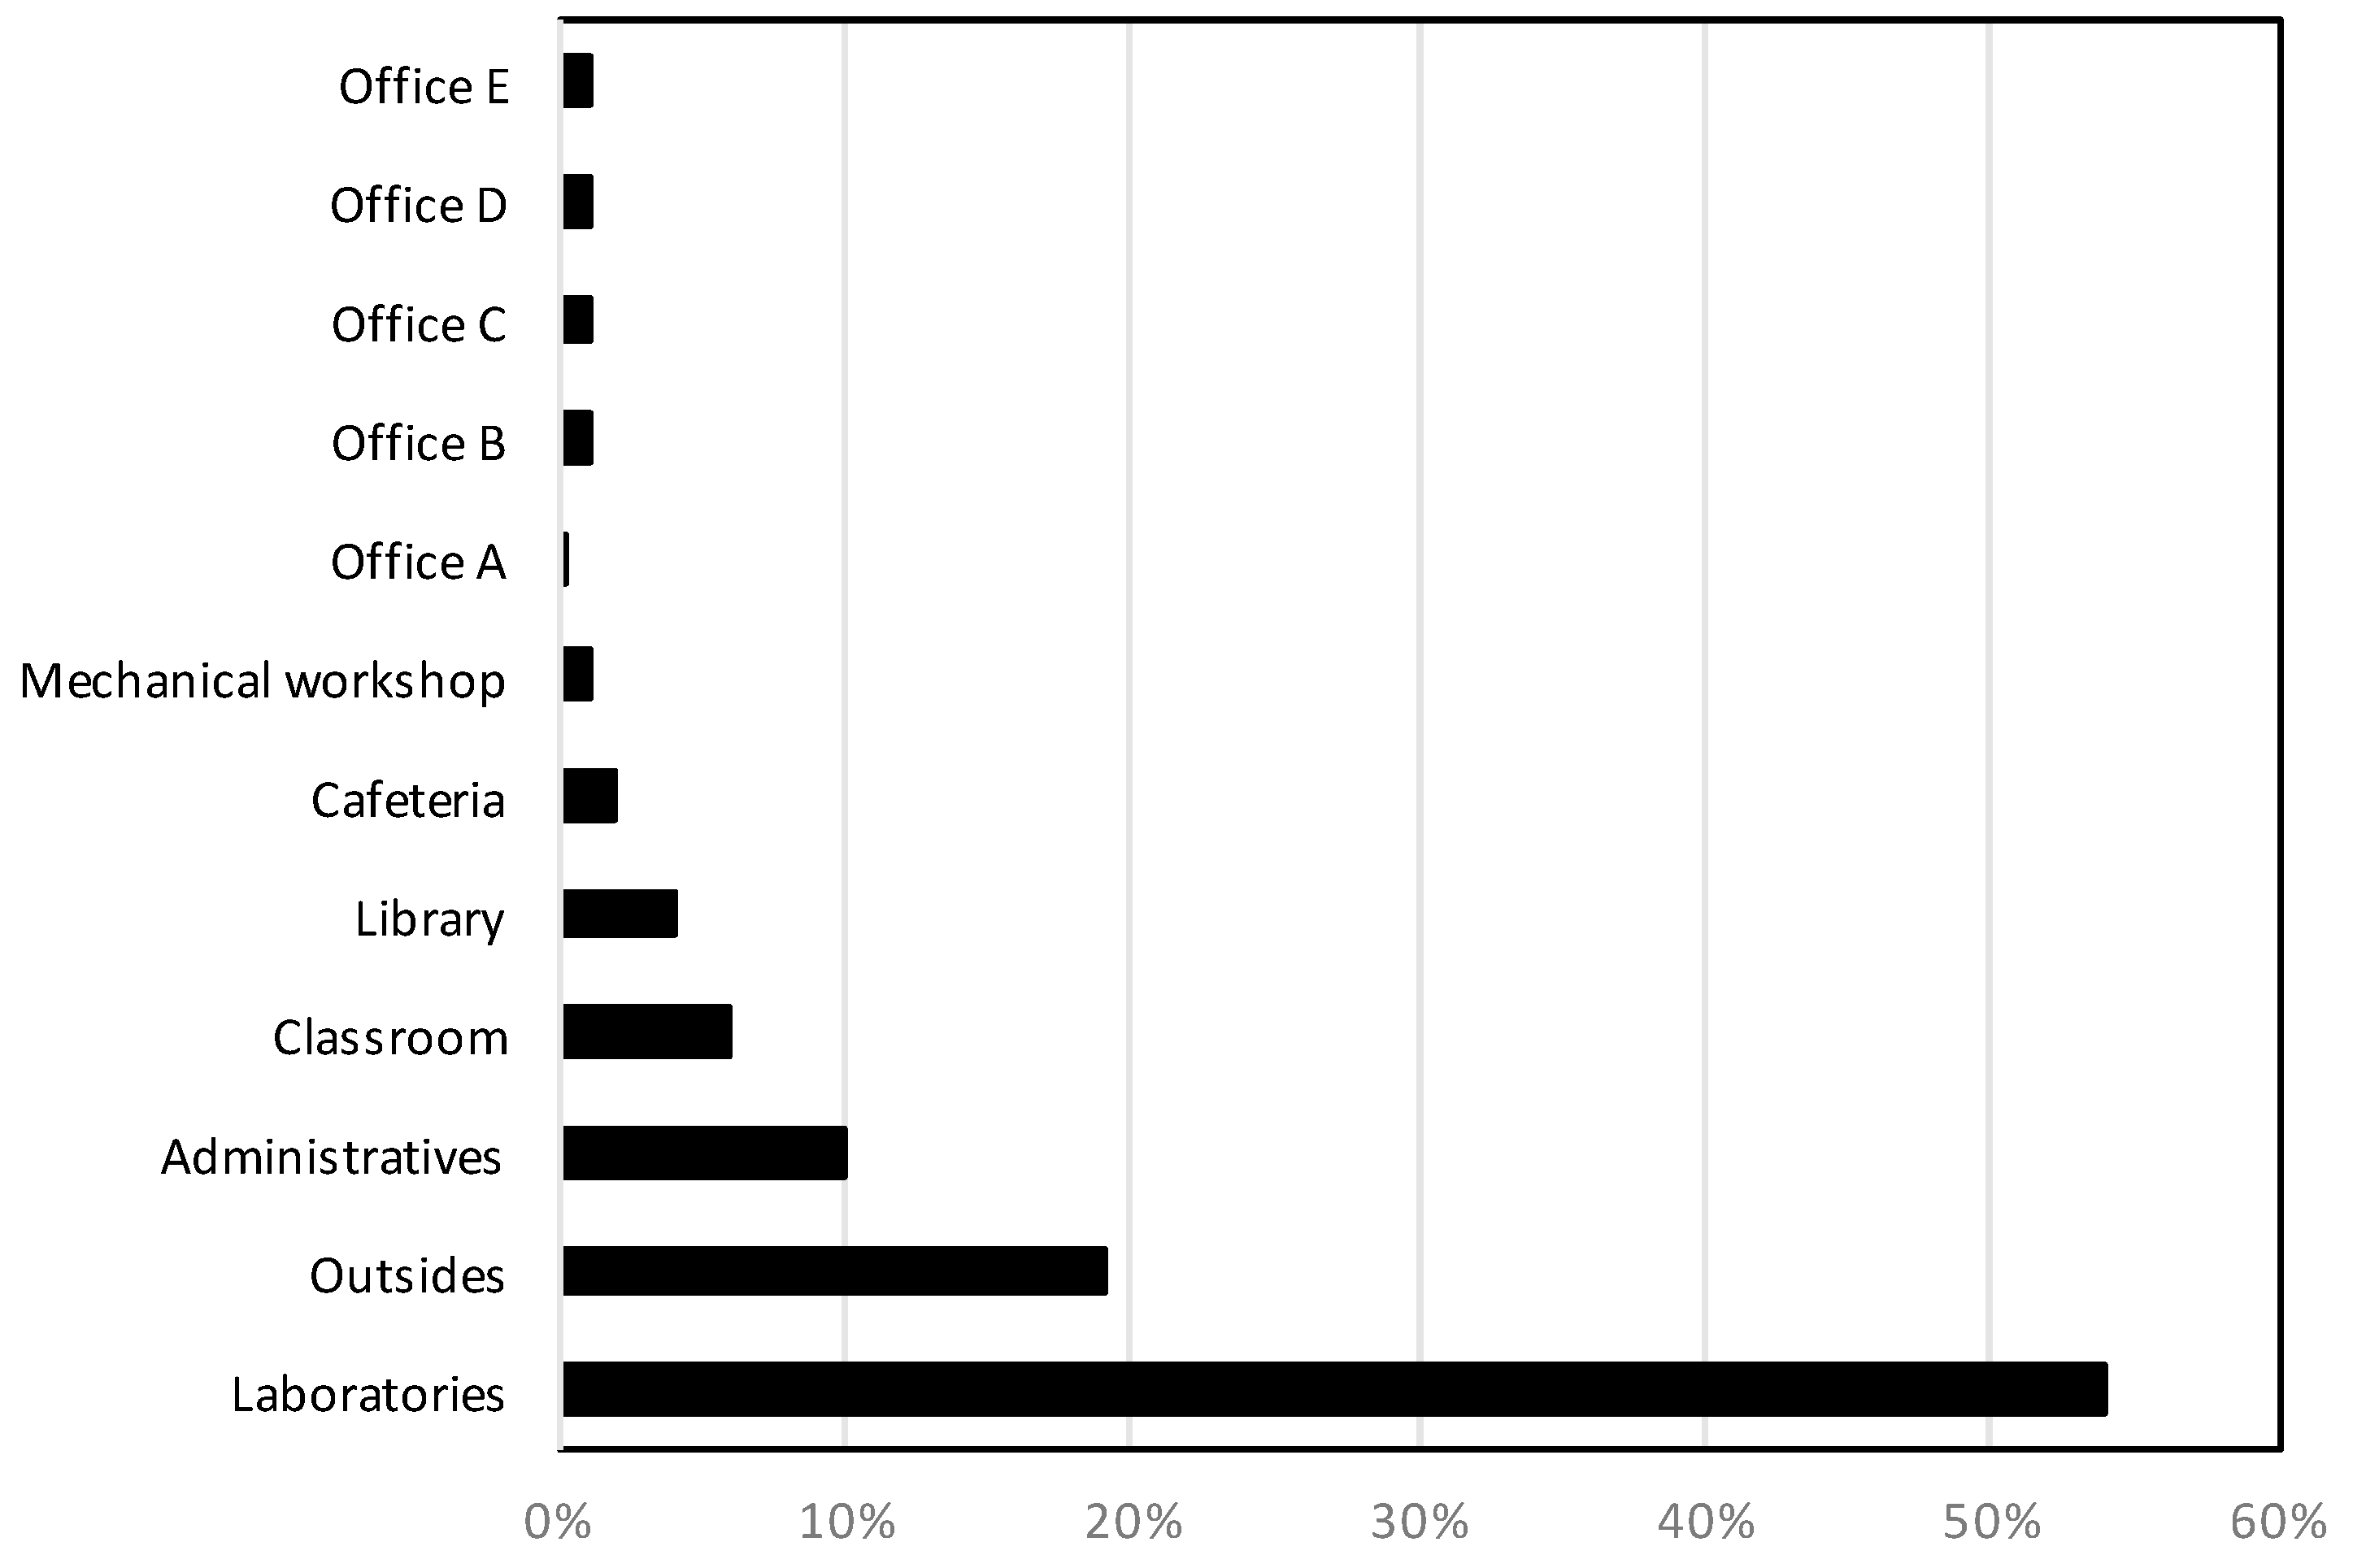
By separating buildings according to their energy consumption, it can be seen which of them present the higher consumption percentages regarding the rest. This separation was performed considering what the main activity in the building was. As a result, 12 different categories were extracted for the buildings of the REI: exteriors, laboratories, offices from A to E, administrative, mechanical workshop, classrooms, library and cafeteria. Figure 9 presents the distribution of the areas according to their percentage of consumption. The sum of the 12 categories’ energy consumption comprehends the 100%. Laboratories consume 54% of the total energy consumed in the REI.
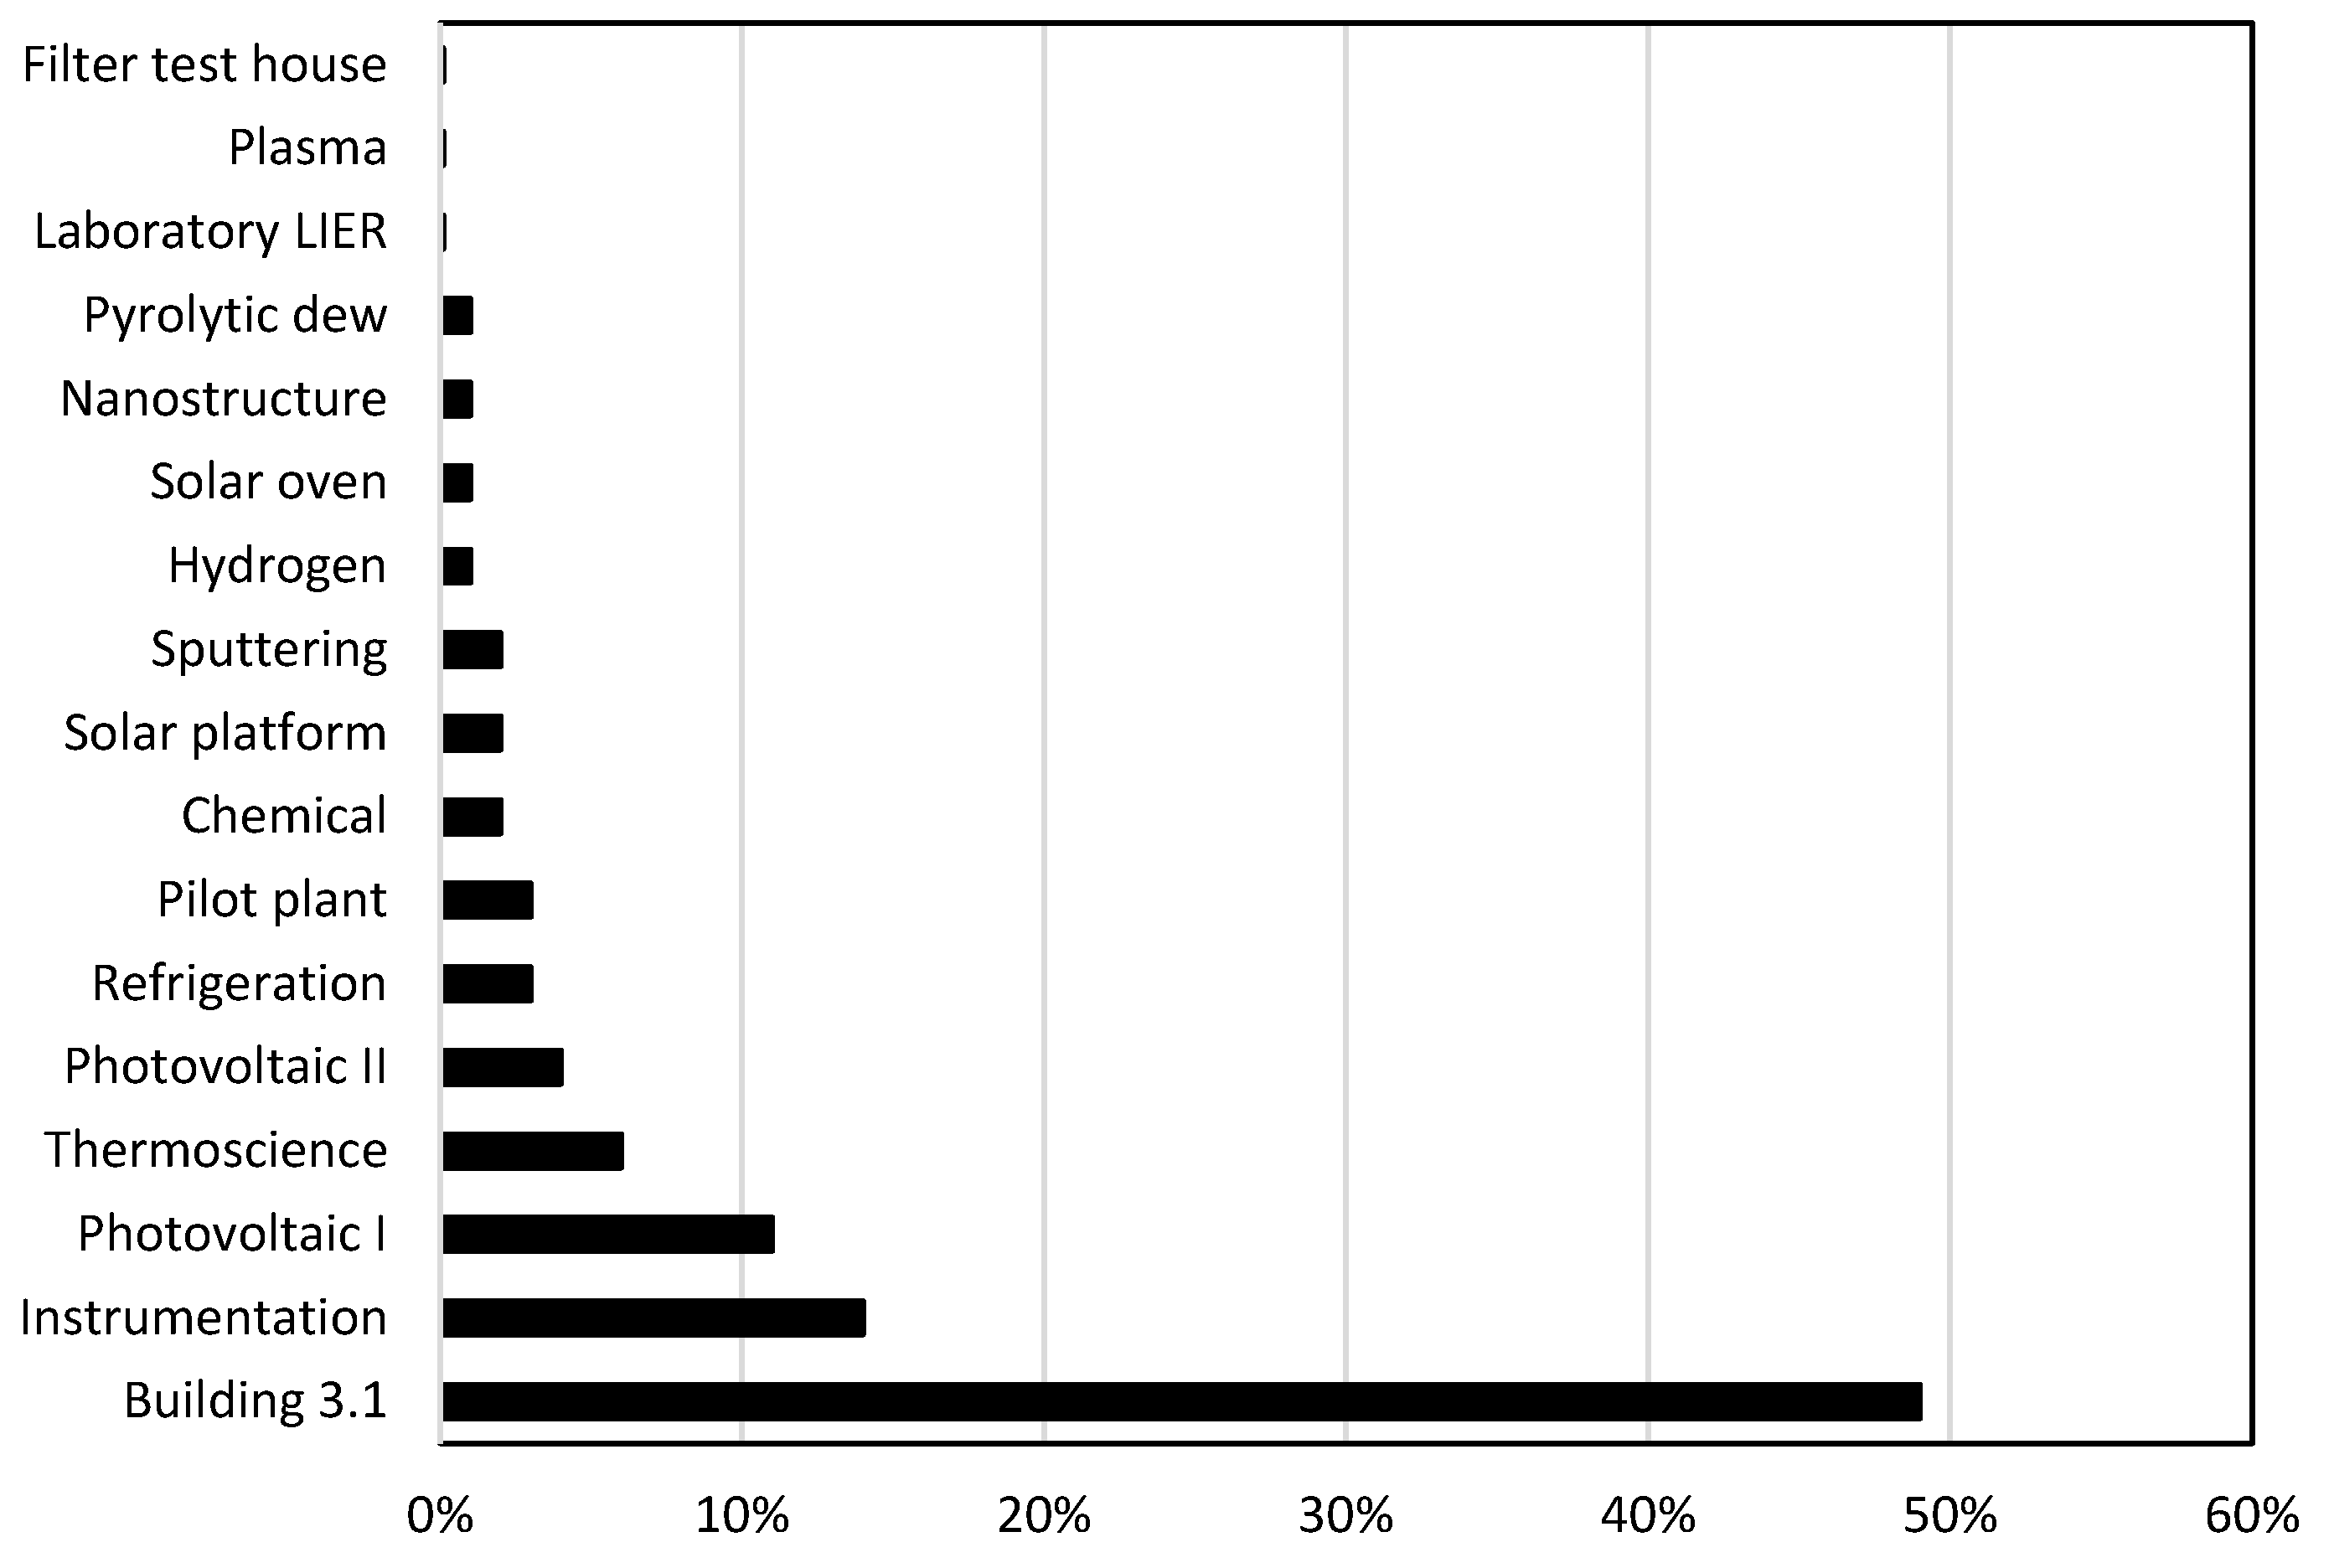
More than half of the total energy consumption goes to the laboratories, and that is consistent with the research function of the Institute. The exterior area also presents a high percentage of consumption, and this is caused by all the lighting equipment available during night-time. In Figure 10, a breakdown for the kinds of laboratories is shown for finding out which of them consumes the most power. With that information, the proposals for energy saving and efficiency can be directed, regarding this area.
In Figure 10, it can be observed that most of the energy consumption occurs in Building 3.1 (49% of total consumption) due to its large concentration of laboratories specialized in renewable energy research and innovation. This new building is fully equipped with air conditioning systems, which explains its higher consumption percentage. Moreover, most of the teams that work inside, manage experiments the entire daytime for several days a week. The rest of the laboratories were built with basis on the philosophy of not using the air conditioning systems, excluding those in which a controlled temperature environment is required; as it is the case of the instrumentation and photovoltaic laboratories.
3.4. Indicators for REI
The energy indicators serve as a basis to determine the most influential data to this research, which is characterized for its susceptibleness towards changes. These indicators also comprehend a good tool when comparing energetic behaviour between commercial buildings and similar services. Additionally, these show clearer and more precise results. The types of indicators analysed in this work can be applied to distinct commercial buildings of the country. Below are presented the general terms for the indicators.
In accordance to the content of ISO 50001, two indicators were selected, as these represent essential information on a building’s energetic performance. These indicators allow the comparison between similar buildings and also provide information on how efficient (or inefficient) the electricity consumption is in a specific building.
The most precise way of determining the consumption level of a building’s electric energy is calculated by kWh/m2 and kWh/person, monthly of annually. This means, calculating the total amount of energy used during a year by a specific area and by the users of the building. This measurement is commonly used to evaluate and to compare the building’s energy efficiency [42]. After analysing all the collected data, ECI was calculated as it is following stated:
- Surface ECI: Monthly building consumption (kWh)/constructed area (m2).
- Personal ECI: Monthly building consumption (kWh)/building user or (kWh)/person.
Taking into consideration the most current data provided by the Energy Information System (EIS) of the Secretariat of Energy (SENER) for the year 2015; the annual consumption per capita in the country was of 2.055.59 kWh/person. Considering that the last value means 171.30 kWh/person monthly [42], a comparison is made to the average value of kWh/person of the REI (obtained in Table 3). The resulting number is lower by approximately 40 kWh/person. This means that the energy consumption in the REI is above the average energy consumption level of the country, therefore, energy saving measures must be set in motion.
In relation to the indicator for energy consumption per constructed square meter, it is important to highlight that the REI presents several uses within the same facilities. Among such uses there are: offices, schools, research laboratories and even restaurants. Therefore, to use it, one of the buildings of the study must be selected, and then specify its main use.
4. Discussion
Climate condition is one the aspects that usually generates the most important variability in order to obtain the energetic behaviour of a building [43]. However, Temixco’s climate condition is tropical; hence the temperatures (minimum-average-maximum) are similar during the entire year. As a consequence, for this study the variability of energy consumption is directly related to the use of the REI.
Since the last energy diagnosis in 2006, energy consumption at the REI has increased considerably. The reason for this is the increase in size of the institution regarding its facilities and number of users. The main energy consumers are the laboratory users. Moreover, air conditioning system is the equipment responsible for the highest energy consumption because of the high temperatures recorded throughout the year. Several authors [44,45,46,47] have reported that air conditioning systems are usually the largest consumers of energy within a building.
After the information was collected and properly analysed, a set of proposals was generated. These were thought to aid in the energy and monetary saving of the institution, and also for having a positive effect on the surrounding environment. These proposals are in accordance with the trends also found in different international contexts [48,49,50,51], and state as follows:
1. Operational measures for reducing energy consumption from the miscellany item:
- Turning off and unplugging equipment that is not being used (for instance coffee machines, printers, fans, chargers, microwaves, projectors, etc.).
- Turning off lights and trying to take the most advantage as possible out of natural light.
- Disconnecting water dispensers during nighttime.
- Activating the “energy saving mode” in the devices that have integrated this function.
2. Installation of thermal insulation in walls and ceilings for buildings with air conditioning system.
The thermal resistance of the buildings envelope will increase through the installation of thermopane and insulation in the walls and ceilings. Thermal insulation is one of the most valuable tools in achieving energy conservation in buildings [52,53,54]. Numerous studies estimated the optimum thickness of thermal insulation used in external walls for different climate conditions [55,56,57,58,59,60,61,62,63,64,65].
3. Use of evaporative coolers or “cooler” instead of air conditioning systems is proposed.
Due to the climate characteristics of Temixco (see Table 1).
4. Annual maintenance on each installed equipment performed by a specialized technician.
This, according to the study conducted by CNEUE, where it is explained that air conditioning systems that go two or more years without maintenance, consume two times more energy [29].
5. The replacement of T8 light fixtures with T5 light fixtures, which have a wide range of applications such as offices and research institutes.
These also have a lifespan of 24,000 h, hence resulting in 2.7 years and a lighting efficacy of up to 104 lm/W at a temperature of 35 °C. This is congruent to the climatic conditions of the state of Morelos.
6. The replacing of lights in sports areas with LED Reflectors [66] of 50 W.
This implies a saving of 95% of the energy consumed by a single light of the 8 currently installed. In addition, these have a lifespan of more than 50,000 h which translate into 5.7 years [67,68].
7. Conducting awareness campaigns and training for people involved in the institution.
In order for them to learn about good habits, as they are considered to be the final users of electric services among the different buildings part of the REI.
8. Promoting the use of solar air conditioning created by investigators of the institution.
The solar air conditioning consists of a cooling system made up of solar collectors. These are located on a surface of around 48 m2. It works with water at a temperature between 90 and 100 °C and a mixture of lithium nitrate and ammonia, which cools a room [69].
9. Automated use of primary lighting and air conditioning.
To avoid lights and air conditioning being on when there are no users present.
By adding these kinds of proposal, some of which do not necessarily need of financial support but rather large amounts of individual contribution, the goal of having an energy efficient institute can be achieved. According to the international energy policy organizations, the adoption of energy rational usage measures saves up to 30% of annual bills. This also signifies on contributions towards the reduction of greenhouse gas production [70].
Svenfelt et al. [71] argue that in order to promote changes that actually enable the implementation of energy-saving measures, it is also important to ask who are the potential actors that can implement the proposals, as well as when and how those relevant actors can be persuaded to follow the guidelines in their turn. In such manner, the proposals can be operationalized and transmitted to a more concrete level where it becomes cleared which steps are needed first in order to achieve change.
5. Conclusions
As the REI as grown throughout history, its energy consumption has increased too. Despite that fact, their consumption patterns, although higher as for some areas, continue to be very similar in charge and current drive. These patterns also show that air conditioning systems, computing and laboratory devices or units demand and consume the most. The energy consumption variability in the Institute is more related to its usage rate than to the climate conditions. Laboratories consume 54% of the total amount of energy used in the REI. The main energy consumption goes to Building 3.1 (49% of total energy consumption), because of its large concentration of laboratories specialized in renewable energy research and innovation. Annual per capita consumption in the REI, compared to the average value of the country, is greater than 40 kWh/person. This last aspect led us to generate strategies and proposals that may help the REI to achieving greater energy efficiency. Such proposals require the supporting participation of each person who either studies or works in the institute, while some other activities require economic stimulus for its implementation. Finally, energy diagnosis (of the third level) turned out to be an adequate methodology to determine the energy consumption of an educational building.
Author Contributions
Formal Analysis, O.G.-G., M.M. and C.S.; Writing, Review and Editing, H.V.; Supervision, D.M.
Funding
Thanks to The Pacific Alliance for the Alianza Pacifico Scholarship granted to Hugo Valdés of the Universidad Catolica del Maule, who agreed to finance the collaboration on this study together with David Morillon at the UNAM.
Acknowledgments
We would like to thank the students of the Engineering in Renewable Energy (second generation) to stablish the bases of this work; and also the academics, administrative, unionized staff and students in general of REI-UNAM for their support and collaboration.
Conflicts of Interest
The authors declare no conflict of interest. The funders had no role in the design of the study; in the collection, analyses, or interpretation of data; in the writing of the manuscript, and in the decision to publish the results.
References
- International Energy Agency. Statistics: Global Energy Data at Your Fingertips, IEA 2015. Available online: http://www.iea.org/statistics (accessed on 10 September 2018).
- Allouhi, A.; El Fouih, Y.; Kousksou, T.; Jamil, A.; Zeraouli, Y.; Mourad, Y. Energy consumption and efficiency in buildings: Current status and future trends. J. Clean. Prod. 2015, 109, 118–130. [Google Scholar] [CrossRef]
- Hinge, A.; Bertoldi, P.; Waide, P. Comparing commercial building energy use around the world. In Proceedings of the 2004 ACEEE Summer Study on Energy Efficiency in Buildings, Pacific Grove, CA, USA, 22–27 August 2004. [Google Scholar]
- Fumo, N. A review on the basics of building energy estimation. Renew. Sustain. Energy Rev. 2014, 31, 53–60. [Google Scholar] [CrossRef]
- Organisation for Economic Co-operation and Development; International Energy Agency. Transition to Sustainable Buildings: Strategies and Opportunities to 2050; OECD Publishing: Paris, France, 2013. [Google Scholar]
- International Energy Agency (IEA). Key World Energy Statistics; IEA: Paris, France, 2013. [Google Scholar]
- Morillón, D.; Escobedo, A.; García, I. Retos y Oportunidades Para la Sustentabilidad Energética en Edificios de México: Consumo y Uso Final de Energía en Edificios Residenciales, Comerciales y de Servicio; Serie Investigación y Desarrollo, Instituto de Ingeniería-UNAM: México City, Mexico, 2015; ISBN 978-607-02-6285-2. [Google Scholar]
- Valderrama, C.; Cohen, A.; Lagiere, P.; Puiggali, J.R. Análisis del comportamiento energético en un conjunto de edificios multifuncionales: Caso de estudio Campus Universitario. Rev. Constr. 2011, 10, 26–39. [Google Scholar] [CrossRef]
- Yuan, S.; Hiroto, T.; Fulin, W. Evaluation on energy consumption characteristics and effect of energy conservation measures in university campus buildings in Northern China. J. Environ. Eng. 2012, 77, 605–614. [Google Scholar]
- Zhang, J.; Xu, L. Energy consumption survey in a university campus with cogeneration system: End-use consumption of electricity part 2. J. Environ. Eng. 2012, 77, 185–192. [Google Scholar] [CrossRef]
- Hong, W.-H.; Kim, J.-Y.; Lee, C.-M.; Jeon, G.-Y. Energy consumption and the power saving potential of a university in Korea: Using a field survey. J. Asian Archit. Build. Eng. 2011, 10, 445–452. [Google Scholar] [CrossRef]
- Escrivá-Escrivá, G.; Álvarez-Bel, C.; Valencia-Salazar, I. Method for modeling space conditioning aggregated daily load curves: Application to a university building. Energy Build. 2010, 42, 1275–1282. [Google Scholar] [CrossRef]
- Aljami, A. Energy audit of an educational building in a hot summer climate. Energy Build. 2012, 47, 122–130. [Google Scholar] [CrossRef]
- Desideri, U.; Leonardi, D.; Arcioni, L.; Sdringola, P. European project Educa-RUE: An example of energy efficiency paths in educational buildings. Appl. Energy 2012, 97, 384–395. [Google Scholar] [CrossRef]
- Bellia, L.; Borrelli, M.; De Masi, R.F.; Ruggiero, S.; Vanoli, G.P. University building: Energy diagnosis and refurbishment design with cost-optimal approach. Discussion about the effect of numerical modelling assumptions. J. Build. Eng. 2018, 18, 1–18. [Google Scholar] [CrossRef]
- Bourdeau, M.; Guo, X.; Nefzaoui, E. Buildings energy consumption generation gap: A post-occupancy assessment in a case study of three higher education buildings. Energy Build. 2018, 159, 600–611. [Google Scholar] [CrossRef]
- Deshko, V.I.; Shevchenko, O.M. University campuses energy performance estimation in Ukraine based on measurable approach. Energy Build. 2013, 66, 582–590. [Google Scholar] [CrossRef]
- Agdas, D.; Srinivasan, R.S.; Frost, K.; Masters, F.J. Energy use assessment of educational buildings: Toward a campus-wide sustainable energy policy. Sustain. Cities Soc. 2015, 17, 15–21. [Google Scholar] [CrossRef]
- Allab, Y.; Pellegrino, M.; Guo, X.; Nefzaoui, E.; Kindinis, A. Energy and comfort assessment in educational building: Case study in a French university campus. Energy Build. 2017, 143, 202–219. [Google Scholar] [CrossRef] [Green Version]
- SENER, Mexico. Sistema de Información Energética; SENER: Getxo, Spain, 2018. [Google Scholar]
- Katipamula, S.; Brambley, M.R. Methods for fault detection, diagnostics, and prognostics for building systems—A review, part I. HVAC&R Res. 2005, 11, 3–25. [Google Scholar]
- Katipamula, S.; Brambley, M.R. Methods for fault detection, diagnostics, and prognostics for building systems—A review, part II. HVAC&R Res. 2005, 11, 169–187. [Google Scholar]
- Zhao, H.; Magoulès, F. A review on the prediction of building energy consumption. Renew. Sustain. Energy Rev. 2012, 16, 3586–3592. [Google Scholar] [CrossRef]
- Chung, M.H.; Rhee, E.K. Potential opportunities for energy conservation in existing buildings on university campus: A field survey in Korea. Energy Build. 2014, 78, 176–182. [Google Scholar] [CrossRef]
- Ascione, F.; De Masi, R.F.; de Rossi, F.; Fistola, R.; Sasso, M.; Vanoli, G.P. Analysis and diagnosis of the energy performance of buildings and districts: Methodology, validation and development of Urban Energy Maps. Cities 2013, 35, 270–283. [Google Scholar] [CrossRef]
- Geng, Y.; Ji, W.; Lin, B.; Hong, J.; Zhu, Y. Building energy performance diagnosis using energy bills and weather data. Energy Build. 2018, 172, 181–191. [Google Scholar] [CrossRef]
- Ahmad, M.W.; Mourshed, M.; Mundow, D.; Sisinni, M.; Rezgui, Y. Building energy metering and environmental monitoring—A state-of-the-art review and directions for future research. Energy Build. 2016, 120, 85–102. [Google Scholar] [CrossRef]
- CONUEE. Comisión Nacional para el Uso Eficiente de la Energía. ACCIONES Y PROGRAMAS. 2016. Available online: http://goo.gl/W4mS89 (accessed on 24 October 2016).
- Nejat, P.; Jomehzadeh, F.; Taheri, M.M.; Gohari, M.; Majid, M.Z.A. A global review of energy consumption, CO2 emissions and policy in the residential sector (with an overview of the top ten CO2 emitting countries). Renew. Sustain. Energy Rev. 2015, 43, 843–862. [Google Scholar] [CrossRef]
- Xing, Y.; Hewitt, N.; Griffiths, P. Zero carbon buildings refurbishment—A hierarchical pathway. Renew. Sustain. Energy Rev. 2011, 15, 3229–3236. [Google Scholar] [CrossRef]
- Ibn-Mohammed, T.; Greenough, R.; Taylor, S.; Ozawa-Meida, L.; Acquaye, A. Operational vs. embodied emissions in buildings—A review of current trends. Energy Build. 2013, 66, 232–245. [Google Scholar] [CrossRef]
- Moss, K.J. Energy Management in Buildings; Routledge: Abingdon, UK, 2006. [Google Scholar]
- Síntesis, Morelos Dona Predio a la UNAM Para Energías Renovables. Available online: https://morelos.sintesis.mx/2018/08/24/morelos-predio-unam-energias-renovables/ (accessed on 26 August 2018).
- Climate-data.org. (s.f.). Available online: http://es.climatedata.org/location/31161 (accessed on 12 August 2018).
- Dorantes, R.; González, B. Programa de Conservación de Energía en el CIE; Centro de Investigación en Energía de la UNAM: México City, Mexico, 2006. [Google Scholar]
- Pérez-Lombard, L.; Ortiz, J.; Pout, C. A review on buildings energy consumption information. Energy Build. 2008, 40, 394–398. [Google Scholar] [CrossRef]
- Santamouris, M.; Papanikolaou, N.; Livada, I.; Koronakis, I.; Georgakis, C.; Argiriou, A.; Assimakopoulos, D.N. On the impact of urban climate on the energy consumption of buildings. Sol. Energy 2001, 70, 201–216. [Google Scholar] [CrossRef]
- Tornay, N.; Schoetter, R.; Bonhomme, M.; Faraut, S.; Masson, V. GENIUS: A methodology to define a detailed description of buildings for urban climate and building energy consumption simulations. Urban Clim. 2017, 20, 75–93. [Google Scholar] [CrossRef]
- Ben-Nakhi, A.E.; Mahmoud, M.A. Application of building-dynamics-based control strategies to improve air-conditioning performance in educational buildings. Adv. Build. Energy Res. 2017, 11, 153–179. [Google Scholar] [CrossRef]
- Numbi, B.P.; Malinga, S.J.; Chidzonga, R.F.; Mulangu, T.C. Energy cost saving potential in educational buildings-case study of MUT campus. In Proceedings of the International Conference on the IEEE Industrial and Commercial Use of Energy (ICUE), Cape Town, South Africa, 15–16 August 2017; pp. 1–5. [Google Scholar]
- Zhao, Z.; Yu, N. The application of advanced control technologies in air conditioning system—A review. Adv. Build. Energy Res. 2017, 11, 52–66. [Google Scholar] [CrossRef]
- SENER, AIE. Indicadores de Eficiencia Energética en México: 5 Sectores, 5 Retos. México, 2011. Available online: http://goo.gl/F9a8r8 (accessed on 11 August 2016).
- Ramos, G.; Fernández, C. Importancia del clima en la simulación energética de edificios. In Jornadas Internacionales de Investigación en Construcción: Vivienda: Pasado, Presente y Futuro: Resúmenes y Actas; Instituto Eduardo Torroja: Madrid, Spain, 2013. [Google Scholar]
- Martín-Consuegra, F.; Alonso, C.; Frutos, B.; Oteiza, I.; Cuerdo-Vilches, T. Analysis and Proposal for Energy Efficiency Measures for the Main Building of the Eduardo Torroja Institute—CSIC; Informes de la Construcción 66 (536); Instituto de Ciencias de la Construcción Eduardo Torroja (IETCC): Madrid, Spain, 2014. [Google Scholar]
- Ma, H.; Du, N.; Yu, S.; Lu, W.; Zhang, Z.; Deng, N.; Li, C. Analysis of typical public building energy consumption in northern China. Energy Build. 2017, 136, 139–150. [Google Scholar] [CrossRef]
- Jing, R.; Wang, M.; Zhang, R.; Li, N.; Zhao, Y. A study on energy performance of 30 commercial office buildings in Hong Kong. Energy Build. 2017, 144, 117–128. [Google Scholar] [CrossRef]
- Goudarzi, H.; Mostafaeipour, A. Energy saving evaluation of passive systems for residential buildings in hot and dry regions. Renew. Sustain. Energy Rev. 2017, 68, 432–446. [Google Scholar] [CrossRef]
- Erhorn, H.; Mroz, T.; Mørck, O.C.; Schmidt, F.; Schoff, L.; Thomsen, K.E. The energy concept adviser—A tool to improve energy efficiency in educational buildings. Energy Build. 2008, 40, 419–428. [Google Scholar] [CrossRef]
- Dascalaki, E.G.; Sermpetzoglou, V.G. Energy performance and indoor environmental quality in Hellenic schools. Energy Build. 2011, 43, 718–727. [Google Scholar] [CrossRef]
- Beusker, E.; Stoy, C.; Pollalis, S.N. Estimation model and benchmarks for heating energy consumption of schools and sport facilities in Germany. Build Environ. 2012, 49, 324–335. [Google Scholar] [CrossRef]
- Desideri, U.; Proietti, S. Analysis of energy consumption in the high schools of a province in central Italy. Energy Build. 2002, 34–10, 1003–1016. [Google Scholar] [CrossRef]
- Wang, Y.; Huang, Z.; Heng, L. Cost-effectiveness assessment of insulated exterior walls of residential buildings in cold climate. Int. J. Proj. Manag. 2007, 25, 143–149. [Google Scholar] [CrossRef]
- Ghrab-Morcos, N. CHEOPS: A simplified tool for thermal assessment of Mediterranean residential buildings in hot and cold seasons. Energy Build. 2005, 37, 651–662. [Google Scholar] [CrossRef]
- Mohsen, M.S.; Akash, B.A. Some prospects of energy savings in buildings. Energy Convers. Manag. 2001, 42, 1307–1315. [Google Scholar] [CrossRef]
- Farhanieh, B.; Sattari, S. Simulation of energy saving in Iranian buildings using integrative modelling for insulation. Renew. Energy 2006, 31, 417–425. [Google Scholar] [CrossRef]
- Al-Khawaja, M.J. Determination and selecting the optimum thickness of insulation for buildings in hot countries by accounting for solar radiation. Appl. Therm. Eng. 2004, 24, 2601–2610. [Google Scholar] [CrossRef]
- Daouas, N.; Hassen, Z.; Aissia, H.B. Analytical periodic solution for the study of thermal performance and optimum insulation thickness of building walls in Tunisia. Appl. Therm. Eng. 2010, 30, 319–326. [Google Scholar] [CrossRef]
- Ahmad, E.H. Cost analysis and thickness optimization of thermal insulation materials used in residential buildings in Saudi Arabia. In Proceedings of the 6th Saudi Engineering Conference, Dhahran, Saudi Arabia, 14–17 December 2002; Volume 1, pp. 21–32. [Google Scholar]
- Kossecka, E.; Kosny, J. Influence of insulation configuration on heating and cooling loads in a continuously used building. Energy Build. 2002, 34, 321–331. [Google Scholar] [CrossRef]
- Kaynakli, O. A study on residential heating energy requirement and optimum insulation thickness. Renew. Energy 2008, 33, 1164–1172. [Google Scholar] [CrossRef]
- Al-Sanea, S.A.; Zedan, M.F.; Al-Ajlan, S.A. Effect of electricity tariff on the optimum insulation-thickness in building walls as determined by a dynamic heat-transfer model. Appl. Energy 2005, 82, 313–330. [Google Scholar] [CrossRef]
- Ucar, A.; Balo, F. Effect of fuel type on the optimum thickness of selected insulation materials for the four different climatic regions of Turkey. Appl. Energy 2009, 86, 730–736. [Google Scholar] [CrossRef]
- Comakli, K.; Yuksel, B. Optimum insulation thickness of external walls for energy saving. Appl. Therm. Eng. 2003, 23, 473–479. [Google Scholar] [CrossRef]
- Bojic, M.; Yik, F.; Leung, W. Thermal insulation on cooling spaces in high rise residential buildings in Hong Kong. Energy Convers. Manag. 2002, 43, 165–183. [Google Scholar] [CrossRef]
- Bojic, M.; Yik, F.; Sat, P. Influence of thermal insulation position in building envelope on the space cooling of high-rise residential buildings in Hong Kong. Energy Build. 2001, 33, 569–581. [Google Scholar] [CrossRef]
- Ecolight. Catálogo de productos. México, 2016. Available online: http://goo.gl/SAbclU (accessed on 11 September 2016).
- OSRAM. Lumilux T8. 2016. Available online: http://goo.gl/zxa0pE (accessed on 11 September 2016).
- Schneider Electric. Guía de Diseño de Instalaciones Eléctricas; Capítulo M; Schneider Electric: Rueil-Malmaison, France, 2008. [Google Scholar]
- Aldecoa, J. Desarrollan Sistema de Refrigeración Solar. CONACYT-Agencia Informativa. 2016. Available online: http://www.conacytprensa.mx/ (accessed on 17 September 2018).
- Siem, G.; Griffin, M.E.S. Auditoría Energética de una Edificación Universitaria Patrimonial. Caso de Estudio: Facultad de Arquitectura y Urbanismo de la Universidad Central de Venezuela; Ambiente y Sostenibilidad; Trienal de Investigación, Facultad de Arquitectura y Urbanismo, Universidad Central de Venezuela; Universidad Central de Venezuela: Caracas, Venezuela, 2017. [Google Scholar]
- Svenfelt, Å.; Engström, R.; Svane, Ö. Decreasing energy use in buildings by 50% by 2050—A backcasting study using stakeholder groups. Technol. Forecast. Soc. Chang. 2011, 78, 785–796. [Google Scholar] [CrossRef]
Figure 1.
For Mexico: (a) Total final consumption by source, (b) Share of oil products final consumption by sector [1].
Figure 1.
For Mexico: (a) Total final consumption by source, (b) Share of oil products final consumption by sector [1].

Figure 2.
(a) Installations of the REI. (b) General layout of the REI (2016). Construction area 14,700 m2.
Figure 2.
(a) Installations of the REI. (b) General layout of the REI (2016). Construction area 14,700 m2.

Figure 3.
Energy consumption (kWh) and the power demand (kW) for the period from August 2013 to March 2016.
Figure 3.
Energy consumption (kWh) and the power demand (kW) for the period from August 2013 to March 2016.

Figure 4.
Energy consumption (kWh) and the power demand (kW) for the period from January 2003 to March 2006 [35].
Figure 4.
Energy consumption (kWh) and the power demand (kW) for the period from January 2003 to March 2006 [35].

Figure 5.
Energy and demand charges in Mexican pesos for the period from August 2013 to March 2016.

Figure 6.
Instantaneous charge profile of the REI during the week 26 April 2016 to 3 May 2016.

Figure 7.
Current profile of the REI for the three phases during the week of 26 April 2016 to 3 May 2016.
Figure 7.
Current profile of the REI for the three phases during the week of 26 April 2016 to 3 May 2016.

Figure 8.
Monthly percentage of equipment energy consumption.

Figure 9.
Consumption percentage by area.

Figure 10.
Breakdown for the types of laboratories and their monthly consumption percentage.


Table 1.
Monthly average values of: maximum temperature (°C), minimum temperature (°C), average temperature (°C) and precipitation (mm) [34].
Table 1.
Monthly average values of: maximum temperature (°C), minimum temperature (°C), average temperature (°C) and precipitation (mm) [34].
| Weather Conditions | J | F | M | A | M | J | J | A | S | O | N | D |
|---|---|---|---|---|---|---|---|---|---|---|---|---|
| Maximum temperature (°C) | 29.1 | 30.8 | 33.3 | 34.8 | 34.1 | 31.6 | 30.3 | 30.1 | 29.5 | 29.7 | 29.7 | 28.9 |
| Minimum temperature (°C) | 12.1 | 13.1 | 15.2 | 16.9 | 17.8 | 17.6 | 16.7 | 16.4 | 16.5 | 15.2 | 13.4 | 12.2 |
| Average temperature (°C) | 20.6 | 21.9 | 24.2 | 25.8 | 25.9 | 24.6 | 23.5 | 23.2 | 23 | 22.4 | 21.5 | 20.5 |
| Precipitation (mm) | 14 | 4 | 4 | 12 | 61 | 198 | 169 | 177 | 185 | 73 | 18 | 5 |
Table 2.
Daily and weekly energy and installed demand for the different categories.
| Categories | Daily Energy (kWh) | Weekly Energy (kWh) | Installed Demand (kW) |
|---|---|---|---|
| Air conditioners | 839.20 | 4884.04 | 240.67 |
| Pumps | 60.03 | 327.51 | 17.29 |
| Computers | 688.28 | 3758.93 | 107.91 |
| Chillers (water) | 187.26 | 1007.59 | 18.51 |
| Laboratory equipment | 694.99 | 1929.09 | 116.46 |
| Miscellaneous | 398.90 | 2336.45 | 64.55 |
| Workshop | 23.68 | 71.03 | 23.68 |
| Fans | 11.23 | 52.40 | 2.94 |
| Lighting | 851.94 | 4202.60 | 117.17 |
Table 3.
Electricity Consumption Indicators (ECI) for buildings of REI-UNAM.
| Buildings of REI-UNAM | Surface ECI (kWh/Constructed Area (m2)) | Personal ECI (kWh/Building User) |
|---|---|---|
| Administration | 71.87 | 47.23 |
| Library | 280.42 | 470.71 |
| Cafeteria | 136.45 | 52.53 |
| Courts | 11.63 | 58.18 |
| Filters test house | 1.06 | 2.82 |
| Vigilance stand | 652.55 | 469.83 |
| CEMIE | 118.25 | 170.72 |
| Cubicles A | 77.82 | 60.45 |
| Cubicles B | 61.26 | 52.21 |
| Cubicles C | 54.47 | 47.66 |
| Cubicles D | 71.00 | 63.14 |
| Cubicles E | 172.31 | 161.54 |
| Management office | 114.05 | 184.23 |
| Building 3.1 | 1697.43 | 112.19 |
| Outsides | 0.39 | 1205.73 |
| Solar oven | 9.79 | 58.75 |
| Lab. Photovoltaic I | 752.73 | 376.36 |
| Lab. Photovoltaic II | 542.88 | 232.66 |
| Lab. Hydrogen | 64.56 | 69.94 |
| Lab. Instrumentation | 4424.41 | 557.48 |
| Lab. Nanostructures | 52.83 | 66.04 |
| Lab. Metallic oxides | 28.47 | 21.35 |
| Lab. Plasma | 22.80 | 20.90 |
| Lab. Chemical I | 51.79 | 274.47 |
| Lab. Refrigeration and heat pump | 83.53 | 71.60 |
| Lab. Pyrolytic dew | 74.65 | 74.65 |
| Lab. Sputtering | 622.72 | 259.47 |
| Lab. Thermoscience | 941.60 | 1279.64 |
| Lab. LIER | 8.17 | 26.95 |
| Lobby | 46.84 | 312.27 |
| Pilot plant | 1082.61 | 582.94 |
| Solar platform | 7.83 | 262.07 |
| Postgrad | 348.98 | 23.06 |
| STUNAM | 89.93 | 214.03 |
| Garage | 20.70 | 117.26 |
| Tonatiuh | 4.37 | 9.91 |
| AVERAGE | 560.93 | 224.19 |
© 2018 by the authors. Licensee MDPI, Basel, Switzerland. This article is an open access article distributed under the terms and conditions of the Creative Commons Attribution (CC BY) license (http://creativecommons.org/licenses/by/4.0/).
Share and Cite
MDPI and ACS Style
González-Galvez, O.; Morales, M.; Seefoó, C.; Morillón, D.; Valdés, H. Energy Diagnosis of University Buildings: Renewable Energy Institute from UNAM. Buildings 2018, 8, 136. https://0-doi-org.brum.beds.ac.uk/10.3390/buildings8100136
AMA Style
González-Galvez O, Morales M, Seefoó C, Morillón D, Valdés H. Energy Diagnosis of University Buildings: Renewable Energy Institute from UNAM. Buildings. 2018; 8(10):136. https://0-doi-org.brum.beds.ac.uk/10.3390/buildings8100136
Chicago/Turabian StyleGonzález-Galvez, Oscar, Miguel Morales, Carla Seefoó, David Morillón, and Hugo Valdés. 2018. "Energy Diagnosis of University Buildings: Renewable Energy Institute from UNAM" Buildings 8, no. 10: 136. https://0-doi-org.brum.beds.ac.uk/10.3390/buildings8100136
Note that from the first issue of 2016, this journal uses article numbers instead of page numbers. See further details here.