1. Introduction
The increasing demand for compact electronic devices necessitated the development of novel cooling technology. The miniaturisation of electronic components, integrating advanced materials like graphene and novel architectures, has notably increased processing power and energy efficiency. These escalating challenges are addressed by employing advanced cooling fluids with superior thermal conductivity, micro- and nanoscale cooling techniques, and the exploration of unconventional cooling materials [
1,
2,
3]. Cooling fluids are significant in managing the heat generated by electronic components during operation [
4]. Efficient heat dissipation is critical for guaranteeing the optimal performance and longevity of micro and nano electronic devices. Besides heat dissipation applications, heat-trapping and thermal energy management-based applications are also necessary in many industries. The areas where heat trapping finds application include thermal energy storage, building insulation, space crafts, and geothermal systems [
5,
6]. Of various types of heat transfer fluids, nanofluids, introduced by Choi in the 1990s [
7], have a decisive role in the advancement of electronic systems. The last decade witnessed the emergence of nanoparticle-incorporated ionic fluids for heat transfer applications, spawning a novel class of nanofluids termed ionanofluids [
8,
9].
Ionanofluids are the engrossing fusion of nanotechnology and fluid dynamics, exhibiting interesting thermal properties suitable for diverse industrial and electronic applications [
10,
11,
12]. Nanoparticle incorporation into the base fluid enhances the heat transfer capabilities of ionanofluids by merging the advantages of nanofluids with those of ionic liquids [
10,
13,
14]. Their superior thermal conductivity, wider temperature range, and lower volatility make them suitable for heat dissipation [
8,
15]. The lesser agglomeration of nanoparticles in ionic liquids is attributed to the greater stability of ionanofluids, ensuring their prolonged and reliable performance. Besides the tuneable properties of an ionanofluid, its reduced corrosivity gives longevity to cooling systems. Moreover, its electrical conduction ability makes it suitable for applications requiring simultaneous thermal and electrical performance [
15]. These properties of ionanofluids help in elevating the efficiency of solar collectors, batteries, and cooling systems. Despite the cost of ionic liquids, research is going on to develop promising heat transfer fluids for efficient thermal system management.
The heat transfer properties of ionanofluids can be understood by employing the organic liquid solution theory that extends from classical solution principles to systems comprising nanoscale particles dispersed in organic solvents [
16,
17]. This theoretical framework considers thermodynamic and colloidal interactions between nanoparticles and the organic liquid, accounting for nanoparticle size, surface chemistry, and charge interactions with solvent molecules. It elucidates the thermophysical properties of the nanofluid or ionanofluid, including thermal conductivity and viscosity alterations due to nanoparticle presence. The theory addresses colloidal stability mechanisms such as electrostatic and steric stabilisation to prevent nanoparticle aggregation. It also investigates phase behaviour and stability under varying conditions, providing insights into phase transitions and their impacts on solution performance [
17]. The greater viscosity of ionic liquids [
18] offers greater stability to ionanofluids. Among various classes of nanoparticles, carbon and its allotrope have gained significant attention [
19,
20,
21,
22,
23]. Soot, a byproduct of combustion, has been reported to contain allotropes of carbon at varying compositions depending on the nature and source of soot formation [
24,
25,
26].
The presence of carbon and its allotropes has prompted researchers to transform the futile soot for fruitful applications. We have extensively studied the thermal-induced dynamics in soot and its application as a light emitter, yield enhancer, and catalyst in seed germination [
27]. Besides these applications, the potential of different soot and carbon allotropes (CAs) in tuning the thermal diffusivity of different base fluids is also studied using laser-induced thermal lens spectroscopy [
24,
27]. Photothermal techniques are proven sensitive and nondestructive methods for materials’ thermal and optical characterisation [
28,
29,
30].
Photopyroelectric (PPE) technique, placed at the convergence of photonics and pyroelectricity, presents significant potential for diverse applications [
31]. Compared to other photothermal methods, PPE technology presents unique advantages and characteristics. Traditional photothermal techniques, such as photoacoustic and photothermal radiometry methods, typically generate acoustic or thermal signals due to light absorption in materials [
28,
32]. In contrast, PPE technique, exploits the pyroelectric effect in materials, creating an electric charge in response to temperature changes induced by incident light. The technique is suitable for solids and is excellent for liquids, as it provides excellent thermal contact at the liquid–pyroelectric sensor (PS) interface [
33]. PPE technique, finds applications in broader areas, from nondestructive testing and imaging in materials science to medical diagnostics and environmental monitoring [
34,
35]. In materials testing, PPE technique enables the characterisation of optical and thermal properties with high sensitivity, while in medical diagnostics, it finds utility in analysing structural changes in biological samples [
34,
35,
36,
37]. The present paper investigates the nanocarbon-effected thermal effusivity and thermal diffusivity tuning of an ionanofluid by the sensitive and nondestructive photothermal technique—photopyroelectric calorimetry. Studies are also performed with the industrially significant form of carbon allotropes—carbon nanotubes and graphene.
3. Materials and Methods
Soot samples with carbon nanoparticles are synthesised by the incomplete combustion of hydrocarbons from camphor and diesel [
27,
39]. To remove the impurities, a liquid phase oxidation purification procedure is implemented on the collected soot particles as described in the literature [
39,
40]. A mixture comprising concentrated nitric acid and sulphuric acid (99.9%, Sigma-Aldrich, Burlington, MA, USA) is prepared in a 3:1 ratio. Subsequently, the samples are introduced to the mixture and sonicated for 30 min using a Elma S30H Elmasonic ultrasonicator (Singen, Germany). The sonicated solution is filtered through Whatman Filter paper 41 (Whatman International Ltd., Maidstone, UK) with a pore size of approximately 25 μm, followed by five washes with distilled water and quenching with ice-cooled water. To neutralise the acidic solution, sodium hydroxide is added until the pH reaches a neutral level. The sample undergoes an additional five washes with double-distilled water and is filtered using Whatman Filter paper 42 (Whatman International Ltd., Maidstone, UK) with a pore size of 2.5 μm. The resulting soot sample, obtained after purification, is subsequently subjected to various characterisation techniques. The multiwalled carbon nanotubes (CNs) and graphene (GR) are purchased commercially from Btcorp Generique Nano Private Ltd., Karnataka, India. The morphology of the CA is characterised using a Nova Nano (FEI, Hillsboro, OR, USA) Field Emission Scanning Electron Microscope (FESEM-Nova Nano, FEI, Hillsboro, OR, USA). Fourier-transform (FT) infrared (IR—Shimadzu IRAffinity-1S, Kyoto, Japan) and Raman (Horiba LabRam Microraman, Kyoto, Japan) spectroscopic analyses are conducted to study the structure and functional groups present.
In the present work, ionanofluids are prepared by a two-step method, dispersing the nanoparticles of the diesel soot (DS) and camphor soot (CS) and the carbon allotropes multiwalled carbon nanotubes (CNs) and graphene (GR) in the ionic liquid, 1-Butyl-3-methylimidazolium methyl sulfate (BMMS, Merck, Darmstadt, Germany) with unique and noteworthy properties. Ionic liquids encompass a combination of organic and/or inorganic ions, potentially featuring multiple cations or anions. The liquid exhibits electrostatic and dispersive interactions at various length scales, contributing to its markedly nonisotropic nature. As a member of the imidazolium-based ionic liquid family, BMMS exhibits low volatility, high thermal stability, and good solvating properties. This specific compound comprises a 1-butyl-3-methylimidazolium cation and a methyl sulfate anion. To obtain a stable nanofluid, 0.5 mg of the sample is dispersed in 2 mL of BMMS (250 ppm) and ultrasonicated for 30 min.
The working principle of the photopyroelectric (PPE) technique starts with the optical irradiation of a sample, which partially transforms the radiation into heat. The temperature modification of the sample is detected by a PS in direct thermal contact with the sample [
32,
35]. In PPE calorimetry, one can choose from various detection combinations to acquire at least one dynamic thermal parameter associated with the sample, such as thermal diffusivity or effusivity. These combinations involve considerations of the detection configuration (back or front), information source (PPE amplitude or phase), and scanning parameter (chopping frequency or a scan of sample thickness) [
31].
Concerning the samples that can be investigated, the PPE method can be successfully applied to any type of condensed matter material. However, liquids are the most suitable materials for PPE investigation because the sample–PS thermal contact is perfect [
33]. Considering that the samples under investigation in this paper are liquids, we expect accurate quantitative results. As mentioned above, one can select several combinations concerning the thermal parameters that can be directly measured. In this study, we employ the back configuration, where the sample receives direct irradiation, and the PS is positioned at the back side of the sample. Simultaneously, a sample thickness scan using the TWRC method [
31] is conducted to obtain the sample’s thermal diffusivity (
αs). To directly measure the samples’ thermal effusivity (
e), we utilise the front detection configuration, where the PS receives direct irradiation, and the sample, in contact with the PS, acts as a radiator. This is combined with a frequency scanning procedure [
33,
41]. The thermal conductivity (
K) and volumetric heat capacity (
C = density (
ρ) × specific heat capacity (
c)) are determined through classical relationships in Equations (5) and (6).
The experimental setups for both back and front PPE calorimetry employed in the present study are detailed in the work by D Dadarlat et al. (2022) [
31,
33]. For this investigation, the modulated incident radiation from a 100 mW YAG laser (wavelength 532 nm, Laser Quantum, SMD6000, Los Gatos, CA, USA) reaches the PS–sample assembly. The signal from the PS is processed with a Stanford Research SR 830 lock-in nanovoltmeter. Adequate LabWindows (Labview 7 express version 7.0) programs are used for frequency and thickness scanning procedures and data acquisition. In both configurations, the PS was a 10 × 10 × 0.5 mm
3 LiTaO
3 single crystal with gold electrical contacts.
In the back detection configuration, the sample’s thickness is scanned by moving the pyroelectric sensor in about a 300 μm range with a step of 12 μm by using a system based on nano-motors. The modulation frequency is kept constant at 1 Hz. The “rough” control of the sample’s thickness and the parallelism between the PS and a directly irradiated metallic foil (assuring the opacity of the sample) are performed with 3- and 6-axis micrometric stages. During the scanning procedure, the sample’s thickness variation is very rigorously controlled, but the absolute sample’s thickness is not precisely known. The initial thickness of the sample is about 1 mm, and its thickness is decreased as mentioned above with a step of 12 μm. From the whole scanning range, only the range showing a linear dependence “relative PPE phase vs. relative sample’s thickness” is kept, because only in this range the sample satisfies the thermally thick condition. In the front configuration, the sample is (about 5 mm thick) filled on a cylinder glued on the PS. The modulation frequency range employed for the study is 2–25 Hz to ensure the approximation for unidirectional heat propagation through the detection cell. In this configuration, two frequency scans are made, one scan with the sample and the second with the PS only. The measurement with the empty PS is used for normalisation, eliminating any influences on the experimental equipment. The minimum accepted signal-to-noise ratio is 100. Three measurement runs are carried out for each sample to achieve the required repeatability of the measurements.
4. Results and Discussion
The structure, morphology, optical, and thermal properties are interconnected aspects of a material that are prominent in determining how a material responds to temperature changes, conducts heat, and behaves in various applications. The morphology of the nanoparticles is examined using FESEM analysis.
Figure 1 shows the FESEM images of CS, DS, CN, and GR. When CN’s FESEM images reveal entangled nanotubes with an average diameter of 20 nm, GR exhibits a highly porous and layered nanosheet-like structure. The FESEM images of both soot samples depict agglomerated spherical carbon nanoparticles ranging in size from 20 to 60 nm, interconnected to form chain-like structures.
FTIR spectroscopy enables the identification of specific functional groups in a sample by measuring the absorption of infrared radiation at characteristic frequencies. Each functional group exhibits unique absorption bands, allowing for the determination of chemical constituents. The FTIR spectrum of the nanocarbon samples CN, GR, DS, and CS is displayed in
Figure 2. The CN’s FTIR spectrum, shown in
Figure 2a, displays the peaks at 964 cm
−1, signifying γ (C=C) vibrations, indicating the backbone of CNT, and the peak at 1333 cm
−1 corresponds to O–H/C–OH vibrations. When the peak at 1494 cm
−1 corresponds to δas/γ (C–H) vibrations, suggesting the involvement of CH
2 or CH
3 groups, that at 1661 cm
−1 represents γ (C=O) vibrations, indicating the presence of carboxyl groups (–COOH) in the CNT. The 2070 cm
−1 and 2311 cm
−1 peaks indicate e4g vibrations and O–H stretching vibrations in –COOH, respectively. The FTIR spectrum of GR, shown in
Figure 2b, exhibits peaks at 954 cm
−1 and 1074 cm
−1 representing δ (C–O–C) and γ (C–O) vibrations, respectively, revealing the presence of oxygen-containing functional groups. The peak at 1250 cm
−1 signifies γ (C–OH) vibrations in graphene oxide (GO), while 1374 cm
−1 indicates O–H or C–OH vibrations from tertiary alcohol. The γ (C=O) vibrations and O–H stretching vibrations in –COOH, reflecting the presence of carboxyl groups in GO, appear as peaks at 1730 cm
−1 and 2306 cm
−1, respectively. Additionally, distinctive features, respectively at 2656 cm
−1 and 2890 cm
−1, represent γ (C–H) vibrations and γ
s (C–H) vibrations in CH
2 groups [
42].
The FTIR analysis of camphor soot and diesel soot, shown in
Figure 2c,d, reveals spectra rich in characteristic peaks of CN and GR, suggesting the presence of the carbon allotropes, carbon nanotubes and graphene. In CS, peaks at 737 cm
−1 signify γ (C=O) vibrations in graphene oxide, indicating the presence of carbonyl groups. The spectrum further reveals δ/γ (C–H) vibrations at 886 cm
−1, along with γ (C–O) vibrations at 1032 cm
−1, indicative of carboxyl/alkoxy groups. The peaks at 1207 cm
−1 represent backbone peaks of carbon nanotubes having γ (C=C) vibrations, and 1286 cm
−1 suggests γ (C–O) vibrations in CNT, pointing to ester, ether, phenol, or carboxyl groups. Peaks at 1722 cm
−1 and 1930 cm
−1 correspond to γ (C=O) vibrations in CNT–COOH, denoting nonconjugated –COOH groups, respectively. The e4g vibrations at 2097 cm
−1 and O–H stretching vibrations in –COOH at 2312 cm
−1 are also observed in the spectrum. Symmetric stretching vibrations (γ
as) of CH
2 or CH
3 groups are respectively observed at 2847 cm
−1 and 2922 cm
−1. Similarly, in DS, peaks at 743 cm
−1, 904 cm
−1, 1218 cm
−1 and 1595 cm
−1, 1714 cm
−1 and 1955 cm
−1, 2010 cm
−1, 2337 cm
−1, 2846 cm
−1, and 2934 cm
−1, respectively denote γ (C=O), δ/γ (C–H), γ (C=C), γ (C=O), e4g, O–H stretching, and γ
as (C–H) vibrations in the sample. When the additional peaks at 1372 cm
−1 and 1446 cm
−1 signify O–H/C–OH in –COOH and δ
as/γ (C–H) stretching vibrations, respectively, that at 2123 cm
−1 indicate the γ (CC) e4g vibrations of the C20 ring in fullerenes [
42]. Thus, the FTIR spectra comprehensively characterise the functional groups and molecular vibrations in all the carbon samples.
Carbon allotropes exhibit distinctive Raman spectra that offer valuable understandings of their structural and electronic properties. One prominent feature of multiwalled CNTs is the presence of intermediate frequency mode (IFM) (380–1200 cm
−1), manifested as a set of peaks at lower wavenumbers. In the IFM mode of carbon nanotubes (CNTs), the predominant vibrations are attributed to Radial Breathing Modes (RBMs) [
43]. RBMs represent vibrational modes characterised by the radial expansion and contraction of the nanotube structure perpendicular to its axis. Within the context of IFM, these vibrations manifest at intermediate frequencies within the Raman spectrum of CNTs. Additionally, CNTs display the graphitic (G) band around 1550–1590 cm
−1, representing tangential modes associated with the vibrations in their graphitic structure. The G band, corresponding to the E
2g phonon mode, signifies the stretching vibrations of pairs of sp
2-bonded carbon atoms. The disorder (D) band, indicative of defects and disorder, is another essential component in the Raman spectra that appears around 1350 cm
−1.
The Raman spectral peak intensity ratio of the D band (
ID) to G bands (
IG) serves as a metric for assessing structural quality [
43,
44]. Along with the D and G band, graphene has a prominent band called the 2D band, which appears around 2700–2800 cm
−1 and is sensitive to the number of graphene layers. In high-quality graphene, the D band is typically weak. The Raman spectrum of CN, GR, CS, and DS is displayed in
Figure 3. All the samples except graphene show an IFM mode in the lower wavenumber region (<1000 cm
−1), indicating the signature peak of CNTs. Even though all samples show distinct D and G peaks, the 2D peak is absent in CNTs. A non-dispersive second-order phonon peak [
43] is observed at 2432 cm
−1 in GR and 2335 cm
−1 in CS. When GR shows a combination (D+G) band at 2906 cm
−1, DS shows a combination band of the G band and RBM, the M band, at 1765 cm
−1. The presence of signature peaks of CNTs and graphene in soot proves that they are a mixture of these important allotropes of carbon. From the
ID/
IG ratio, shown in
Figure 3e, it is evident that the soot samples exhibit more disorder or appear to be less graphitic compared to CN and GR. The microcrystalline dimensions (
La) given by the Tuinstra and Koening relation [
45,
46,
47,
48],
La (nm) = 4.35 × (
IG/
ID), provide a convenient method for estimating the average size of sp
2 carbon domains. The variation in
La for the samples is shown in
Figure 3f.
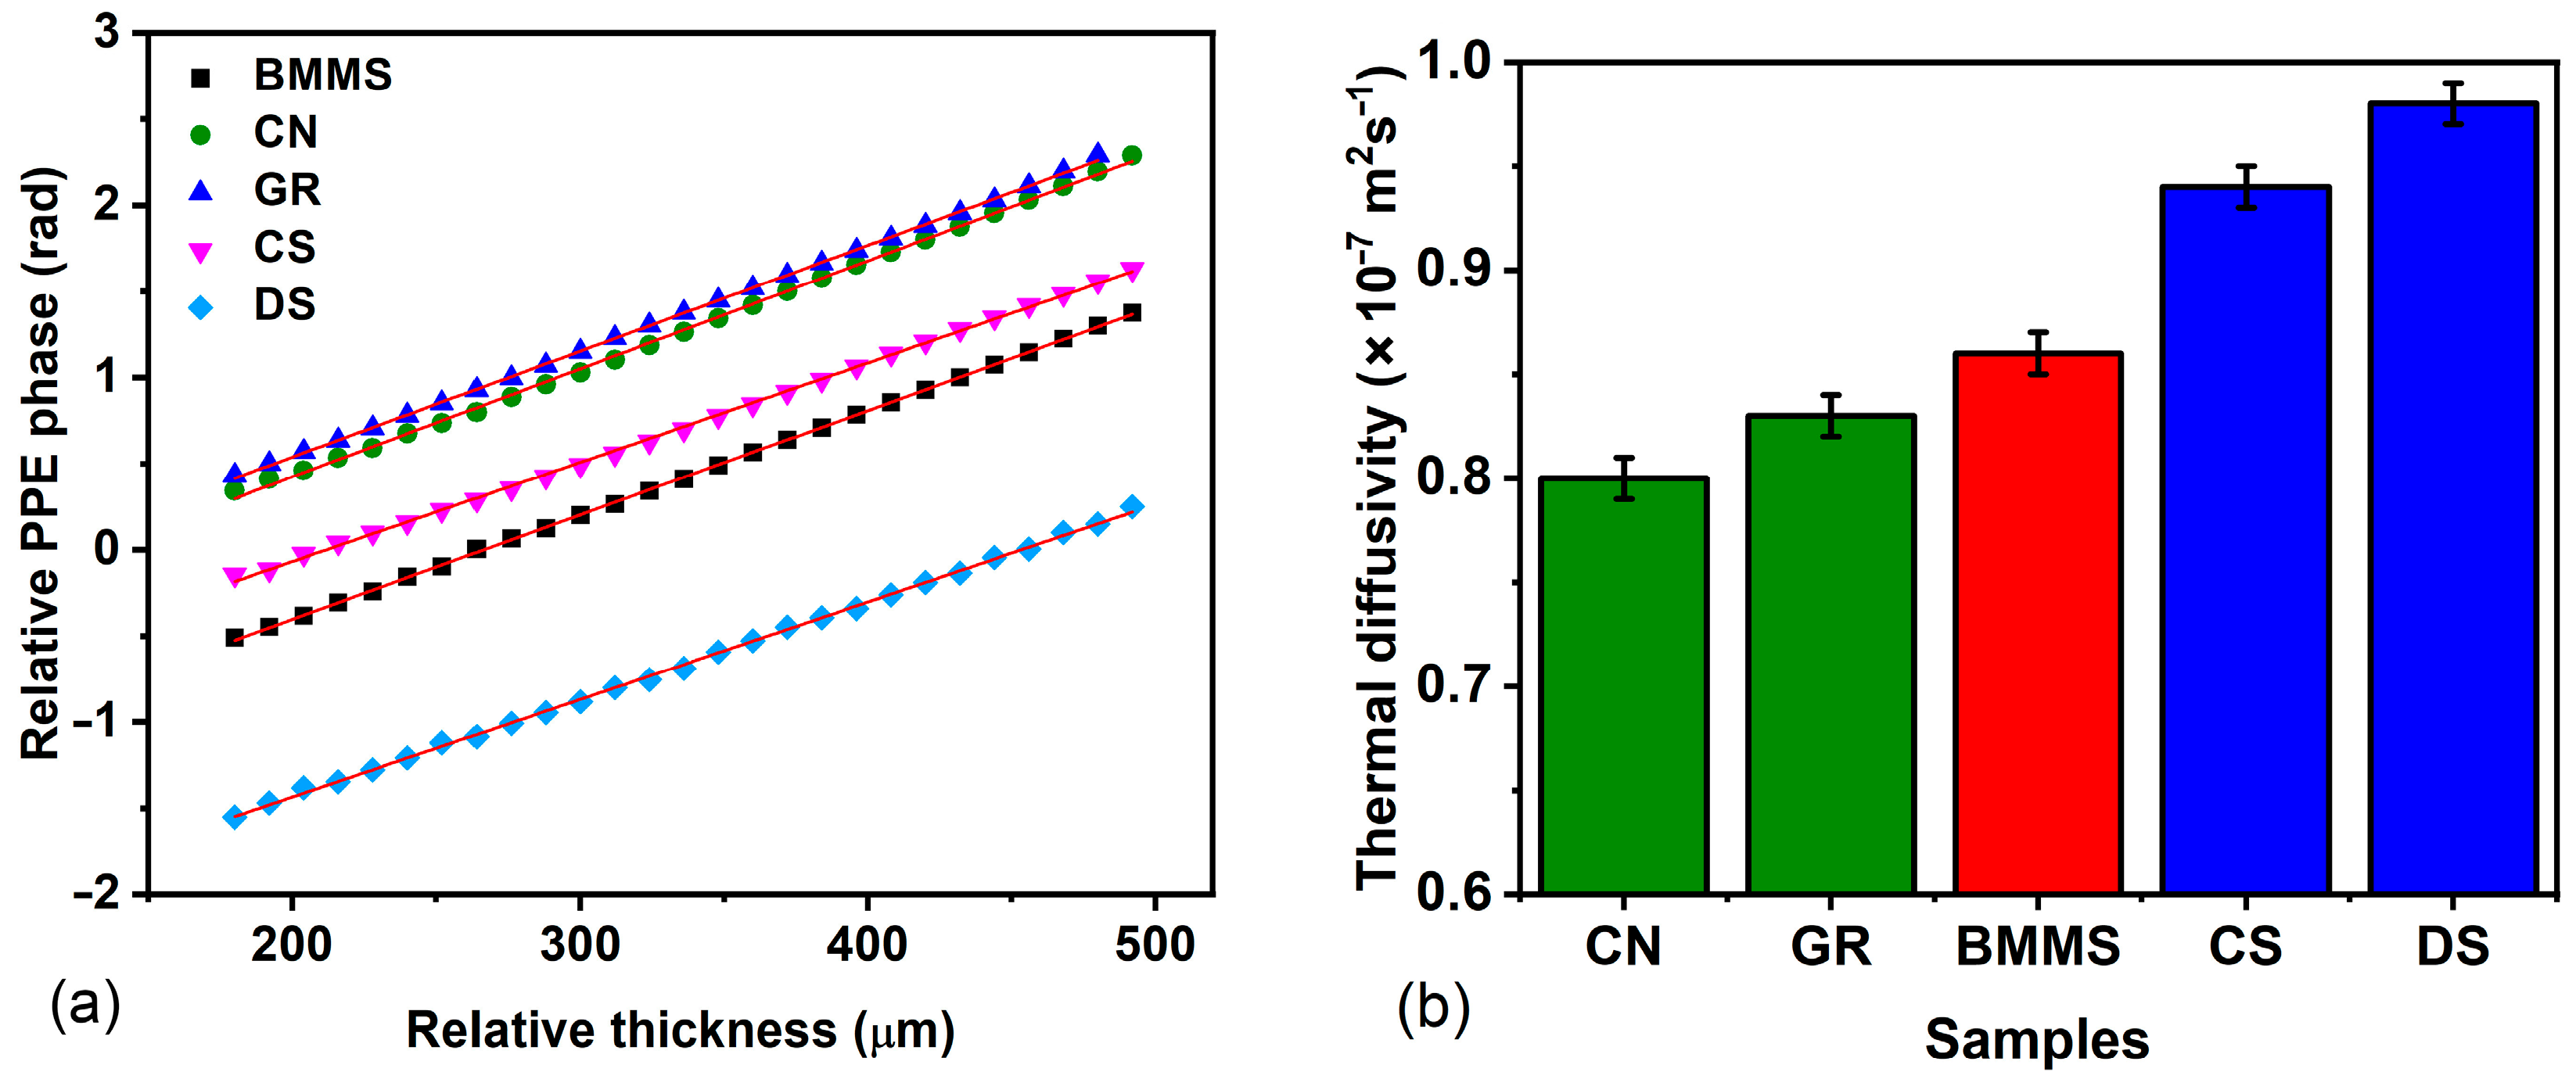
Thermal diffusivity studies of ionanofluid are highly significant as they find applications connected with heat transfer in fluids. Based on the requirement of heat dissipation or heat-trapping, the thermal properties of the nanofluid are to be tuned. The present work elucidates the thermal effusivity and thermal diffusivity tuning of the ionanofluid, by suitably incorporating any of CN, GR, CS, or DS. For determining the
αs value of the sample by the thickness scan PPE method, the variation in the phase of the signal with the thickness of the sample is recorded and plotted as shown in
Figure 4a. From the slope of the plot, the thermal diffusivity of the samples is calculated using Equation (2). The experiment is validated by finding the thermal diffusivity of water, and its value is obtained as (1.55 ± 0.01) × 10
−7 m
2s
−1, which agrees well with the literature [
49]. From
Figure 4b, it can be seen that for a concentration of 250 ppm, when CN and GR lower the thermal diffusivity of the base fluid by 10.11% and 6.74%, respectively, the CS and DS enhance the thermal diffusivity of the base fluid by 5.62% and 10.11%.
Figure 3f shows that the microcrystalline size is higher for CN and GR than for the soot, CS and DS. The higher thermal diffusivity of the ionanofluids with CS and DS, as shown in
Figure 4b, can thus be attributed to the decrease in microcrystalline size computed from the Raman spectrum.
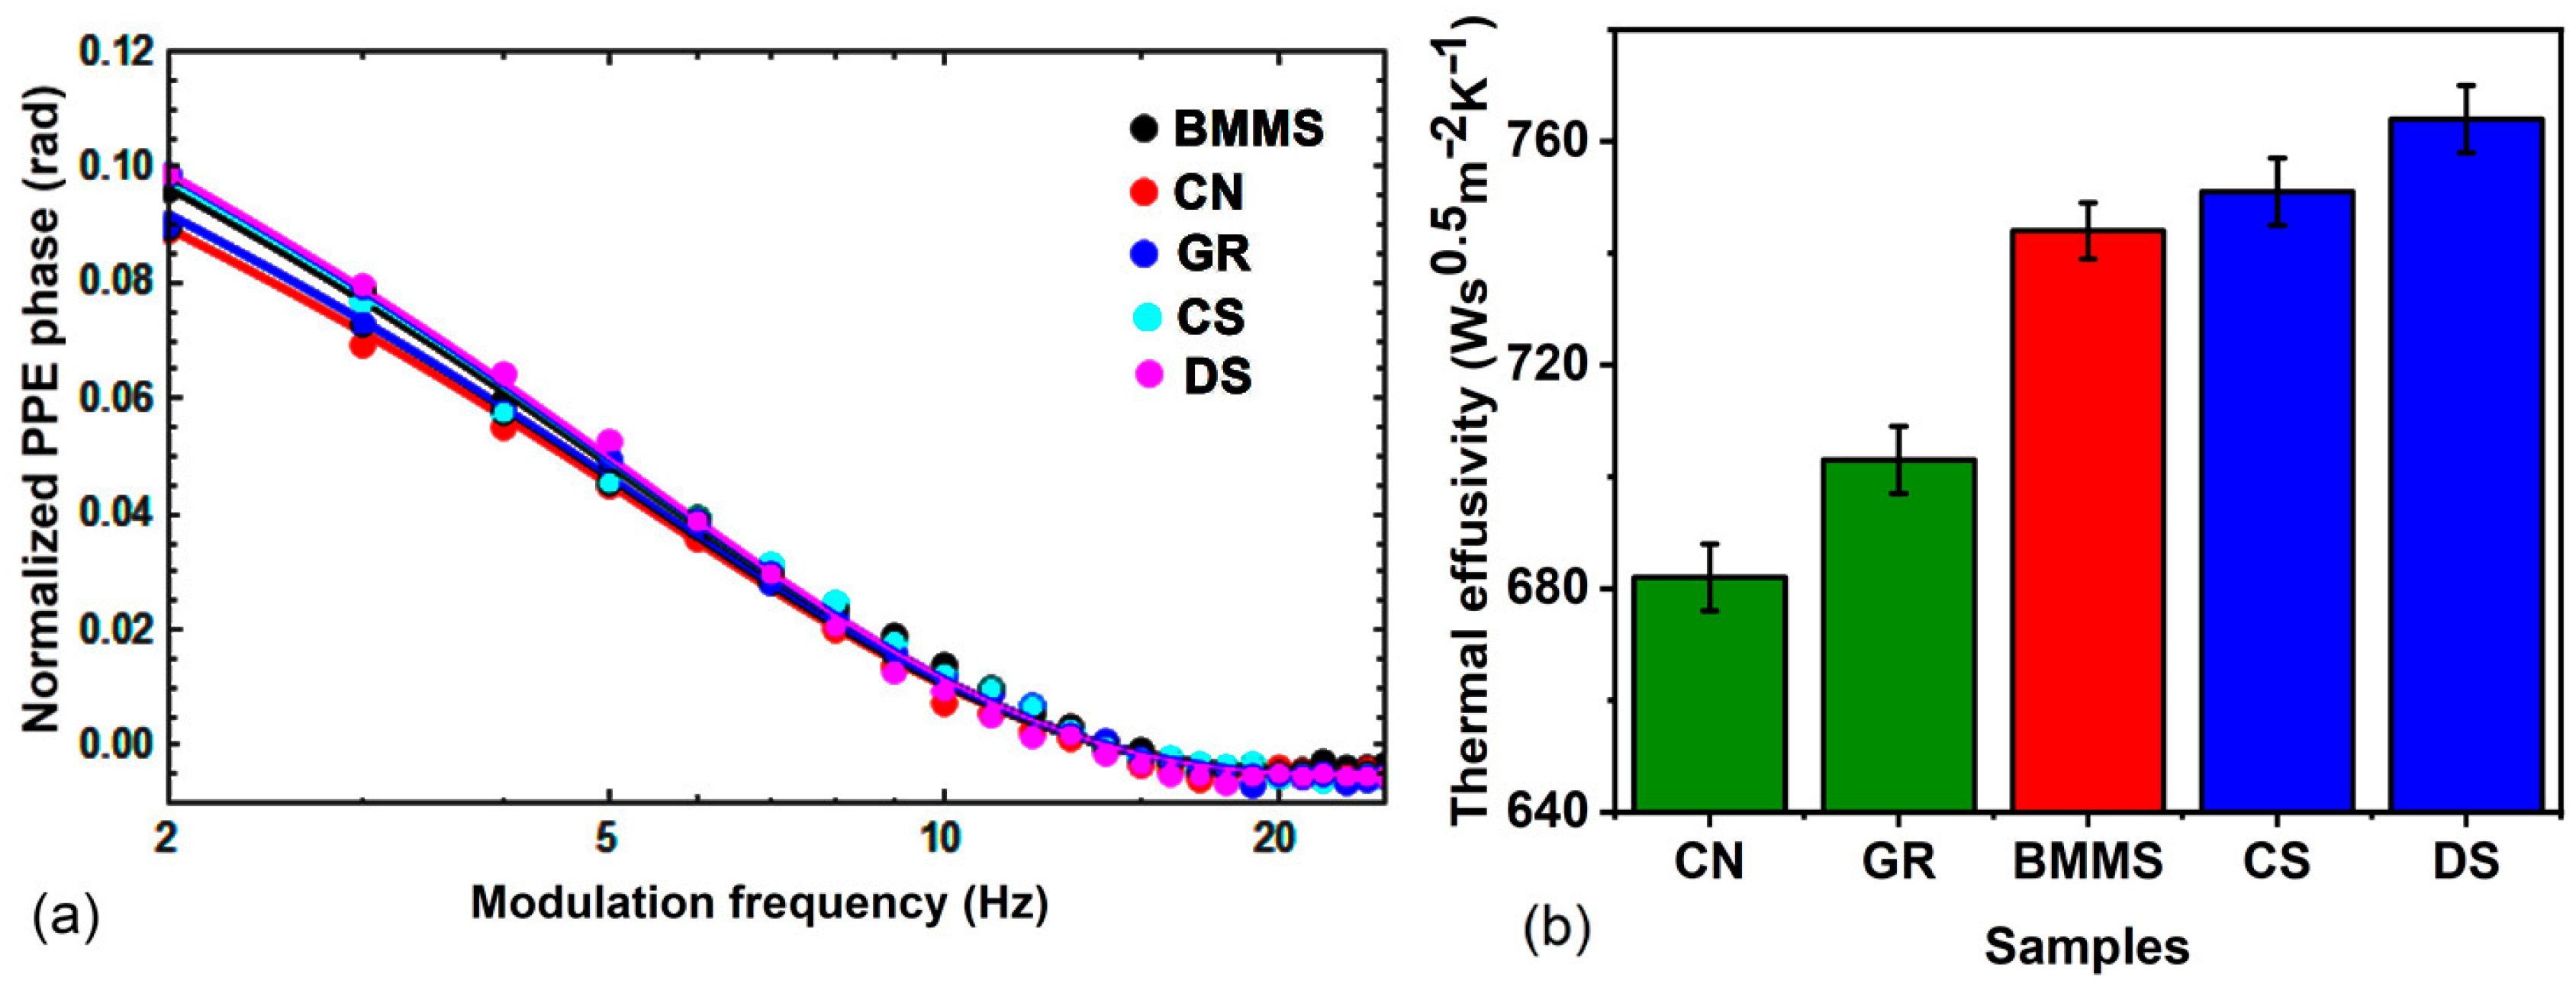
A knowledge of thermal effusivity is essential in understanding thermal energy exchange between two systems. It is crucial to point out that, despite sharing common parameters, thermal diffusivity and effusivity are distinct thermal properties with different implications [
50,
51]. When the thermal diffusivity primarily pertains to the velocity at which thermal equilibrium is achieved, the effusivity or the heat penetration coefficient refers to how rapidly a material exchanges heat with the proximity. It plays a significant role in establishing the contact temperature when two bodies come into contact. The thermal effusivity of the samples is obtained in the front PPE configuration where the variation in normalised phase with the modulation frequency of the incident radiation is recorded and is shown in
Figure 5a. The value of the thermal effusivity is obtained through a fit of the experimental data with Equation (3). From
Figure 5b, it can be understood that when the soot samples enhance the thermal effusivity, the carbon allotropes-CN and GR lower the thermal effusivity of the base fluid–ionic liquid, BMMS. The values of
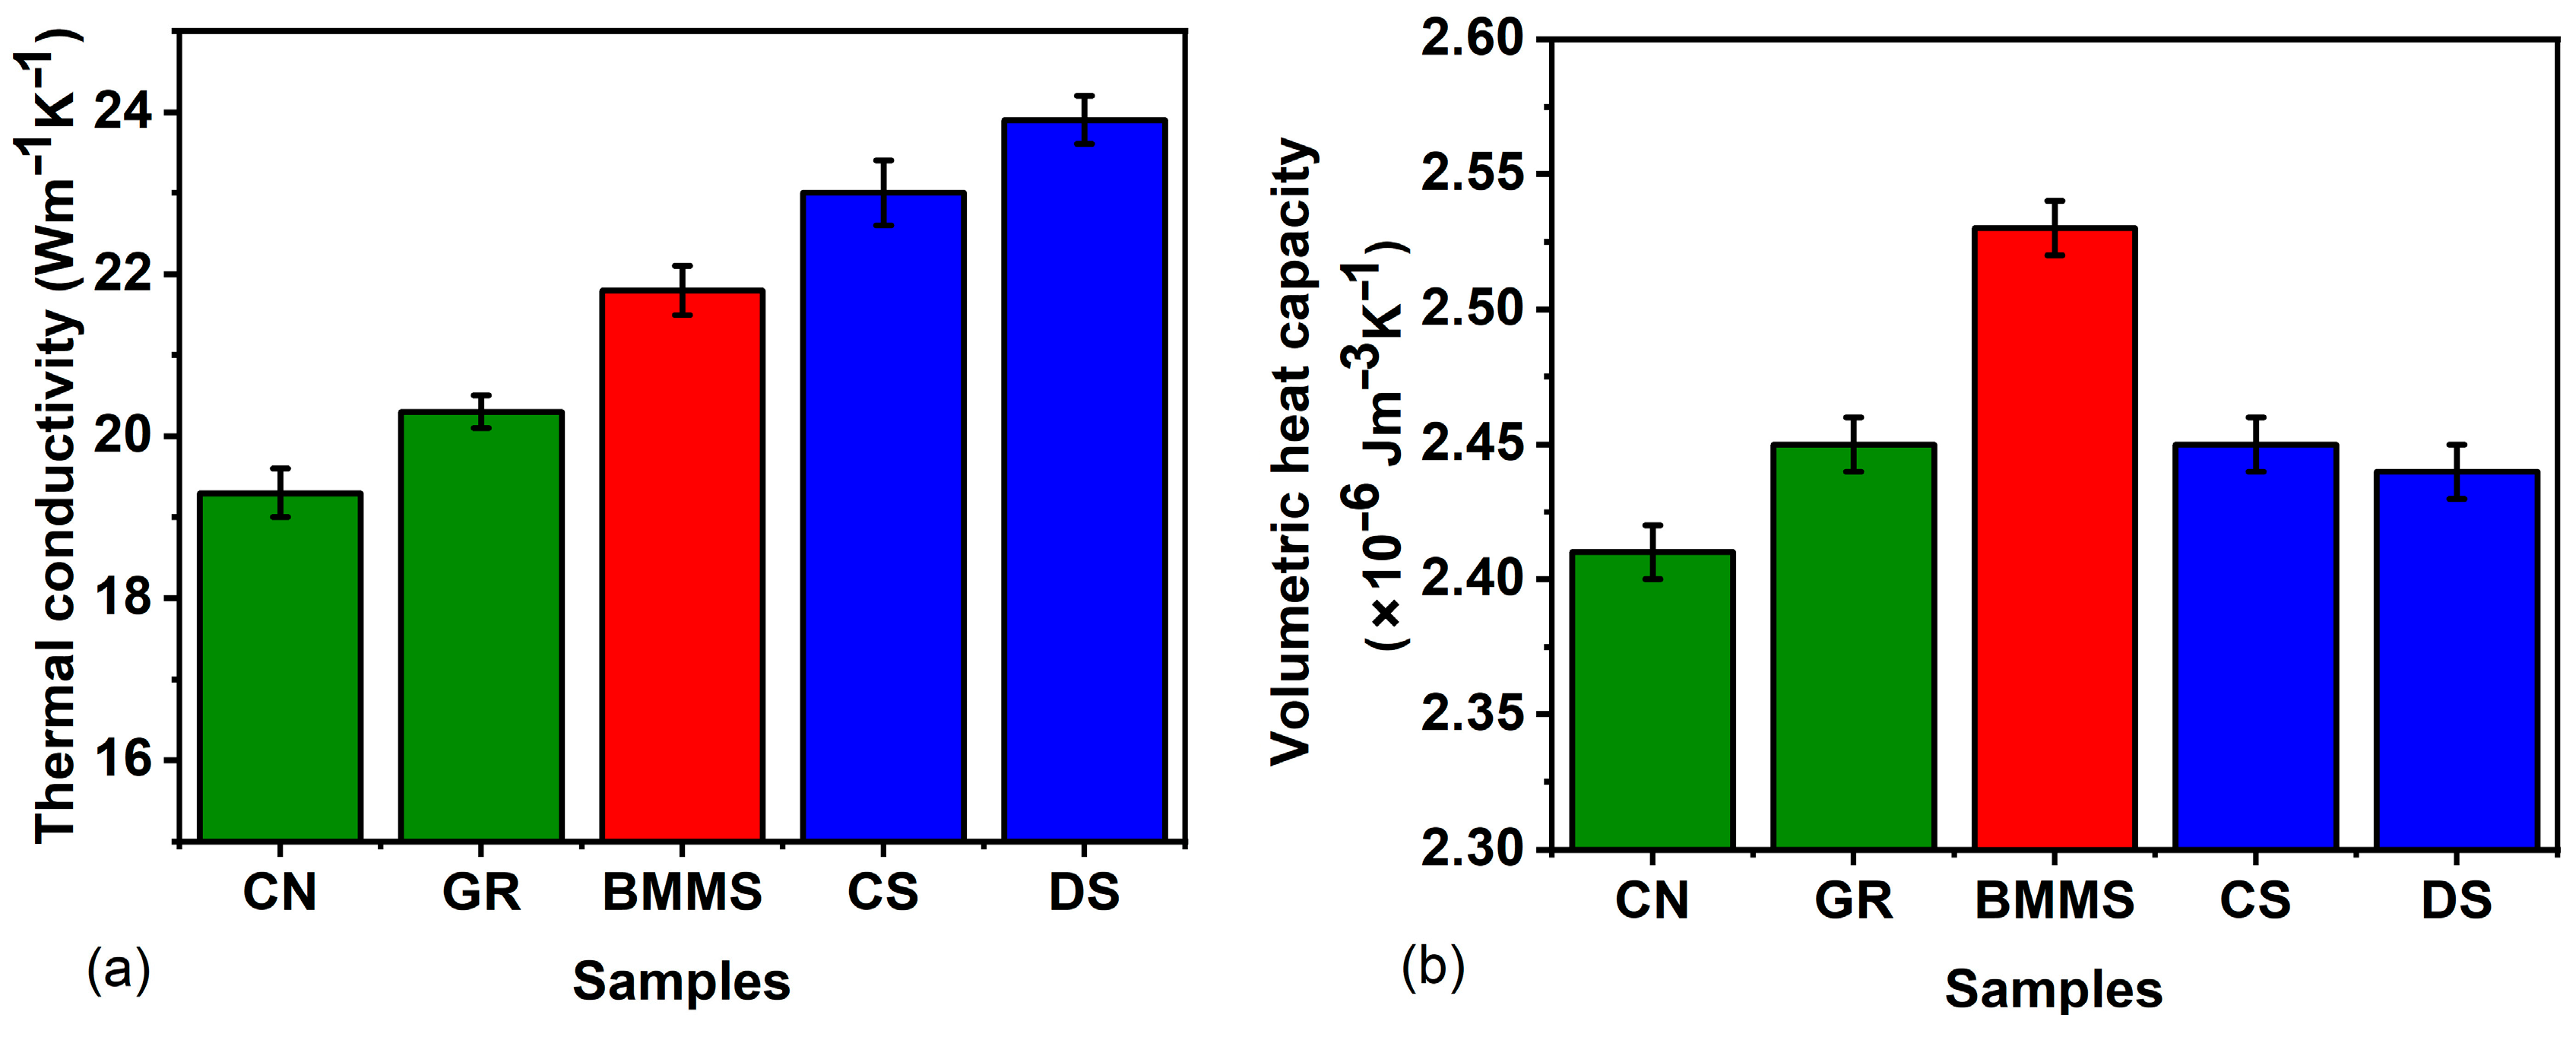
K and
C of the ionanofluids and the base fluid are shown in
Figure 6a and
Figure 6b, respectively. The variation in
K with nanoparticles is the same as that of
αs. The effect of incorporation of CN, GR, DS, and CS in the ionic liquid is found to lower the value of
C, which suggests that the amount of heat needed to increase the temperature of the unit volume of the ionanofluid by 1 °C decreases. The decrease in
C helps in the easy rise of temperature with a lesser amount of heat energy compared to the base fluid. In other words, the temperature rise is greater in the ionanofluid compared to the base fluid.
Additionally, surface geometry, including shape and curvature, can alter heat transfer mechanisms, leading to variations in thermal effusivity compared to flat surfaces [
52]. The enhancement of thermal effusivity of soot ionanofluid, evidenced by
Figure 5, can be attributed to the composition of soot containing amorphous carbon, carbon nanoparticles, CNTs, and graphene. The composition of these soot constituents depends on the nature of combustion and the source used. The presence of carbon nanoparticles and amorphous carbon, in addition to CNTs and graphene, increases the effective contact area of the soot with the base fluid, BMMS, compared to nanofluid with CN and GR. The greater the area of contact of the nanoparticles with the base fluid, the greater the thermal exchange, which results in enhanced thermal diffusivity and effusivity, as observed in
Figure 4 and
Figure 5. The presence of amorphous carbon and carbon nanoparticles also helps in triggering the energy flow through the convective heat transfer mechanism through several inter-related processes compared to the graphene sheets and CNTs. The irregular surface structures and nanoscale roughness create turbulence in the fluid flow, increasing the interfacial area and promoting efficient heat transfer. Also, the formation of thermal boundary layers at the interface between the nanoparticles and the fluid aids in transferring heat through convection. The tendency of these particles to agglomerate and cluster within the fluid also enhances convective heat transfer by inducing fluid motion and creating localised regions of high nanoparticle concentration. In addition, the turbulent flow patterns induced by the presence of these nanoparticles improve fluid mixing by continuously bringing fresh fluid into contact with the heated surfaces and facilitating convective heat transfer throughout the medium.
The coexistence of amorphous carbon and carbon nanoparticles within a medium can also significantly impact its volumetric heat capacity due to their lower volumetric heat capacities than the surrounding fluid. When dispersed within the fluid, they effectively dilute the overall heat capacity of the mixture. Also, the presence of these nanoparticles can alter the thermal conductivity of the fluid, affecting its ability to store and transfer heat. Higher thermal conductivity can lead to faster heat transfer rates, potentially influencing the effective volumetric heat capacity of the medium. The interaction between nanoparticles and the fluid results in changes to the fluid’s specific heat capacity, particularly if there are interactions that affect the fluid’s thermal properties. Thus, the coexistence of amorphous carbon and carbon nanoparticles in soot samples alter the volumetric heat capacity of the medium through a combination of dilution effects, changes in thermal conductivity, and potential modifications to the fluid’s specific heat capacity. This study thus suggests a possible method of tailoring the thermal diffusivity and effusivity of the ionanofluid through a proper selection of carbon allotropes or soot.


 ,
, 


