Changing Contents of Carbon Hybridizations in Amorphous Hydrogenated Carbon Layers (a-C:H) on Sustainable Polyhydroxybutyrate (PHB) Exhibit a Significant Deterioration in Stability, Depending on Thickness

 ,
,  and
and 
Abstract
:
1. Introduction
2. Materials and Methods
2.1. Sample Preparation and Film Deposition
2.2. Analytical Techniques
3. Results and Discussion
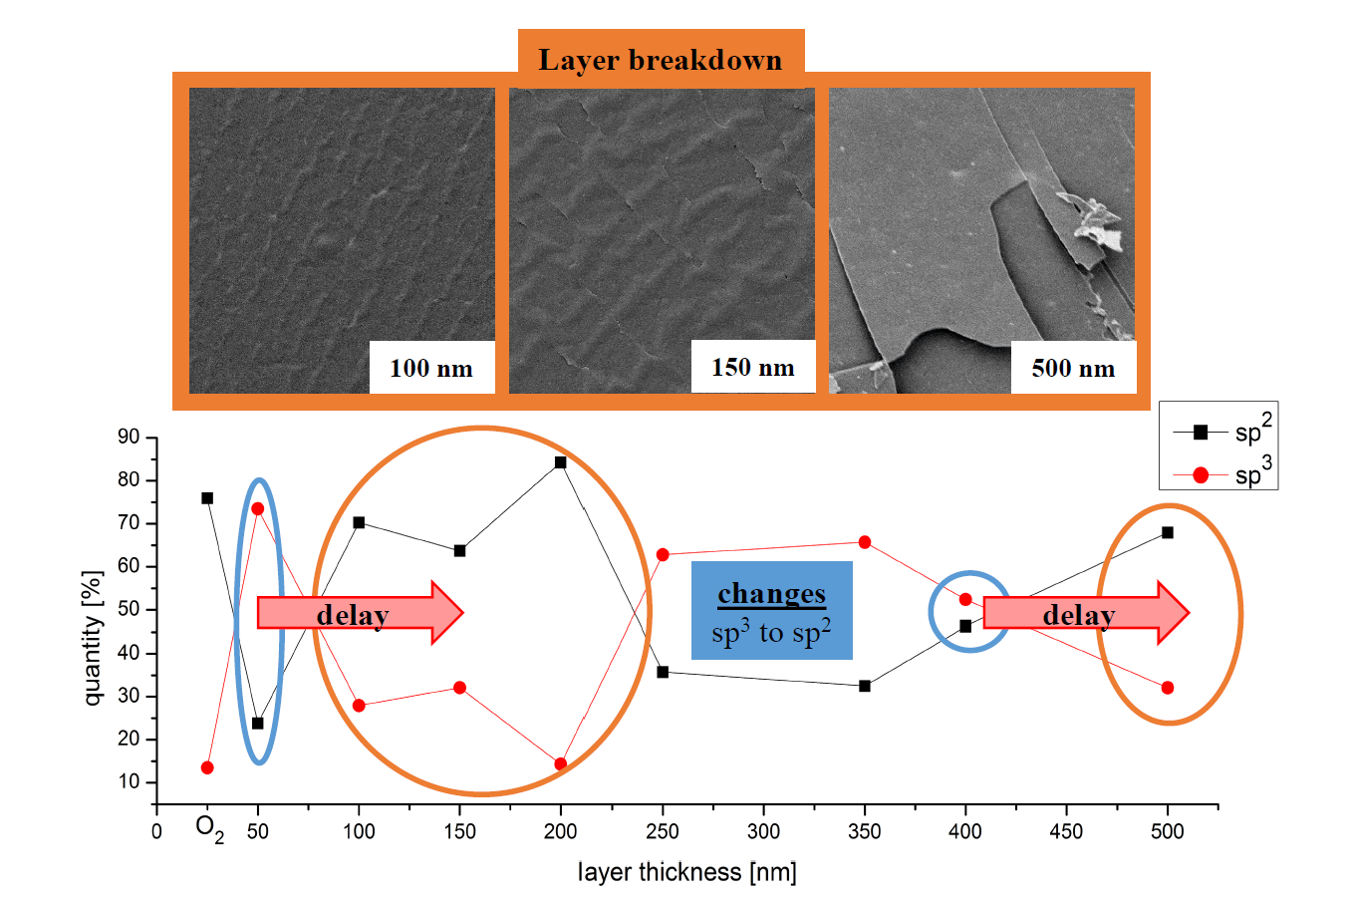
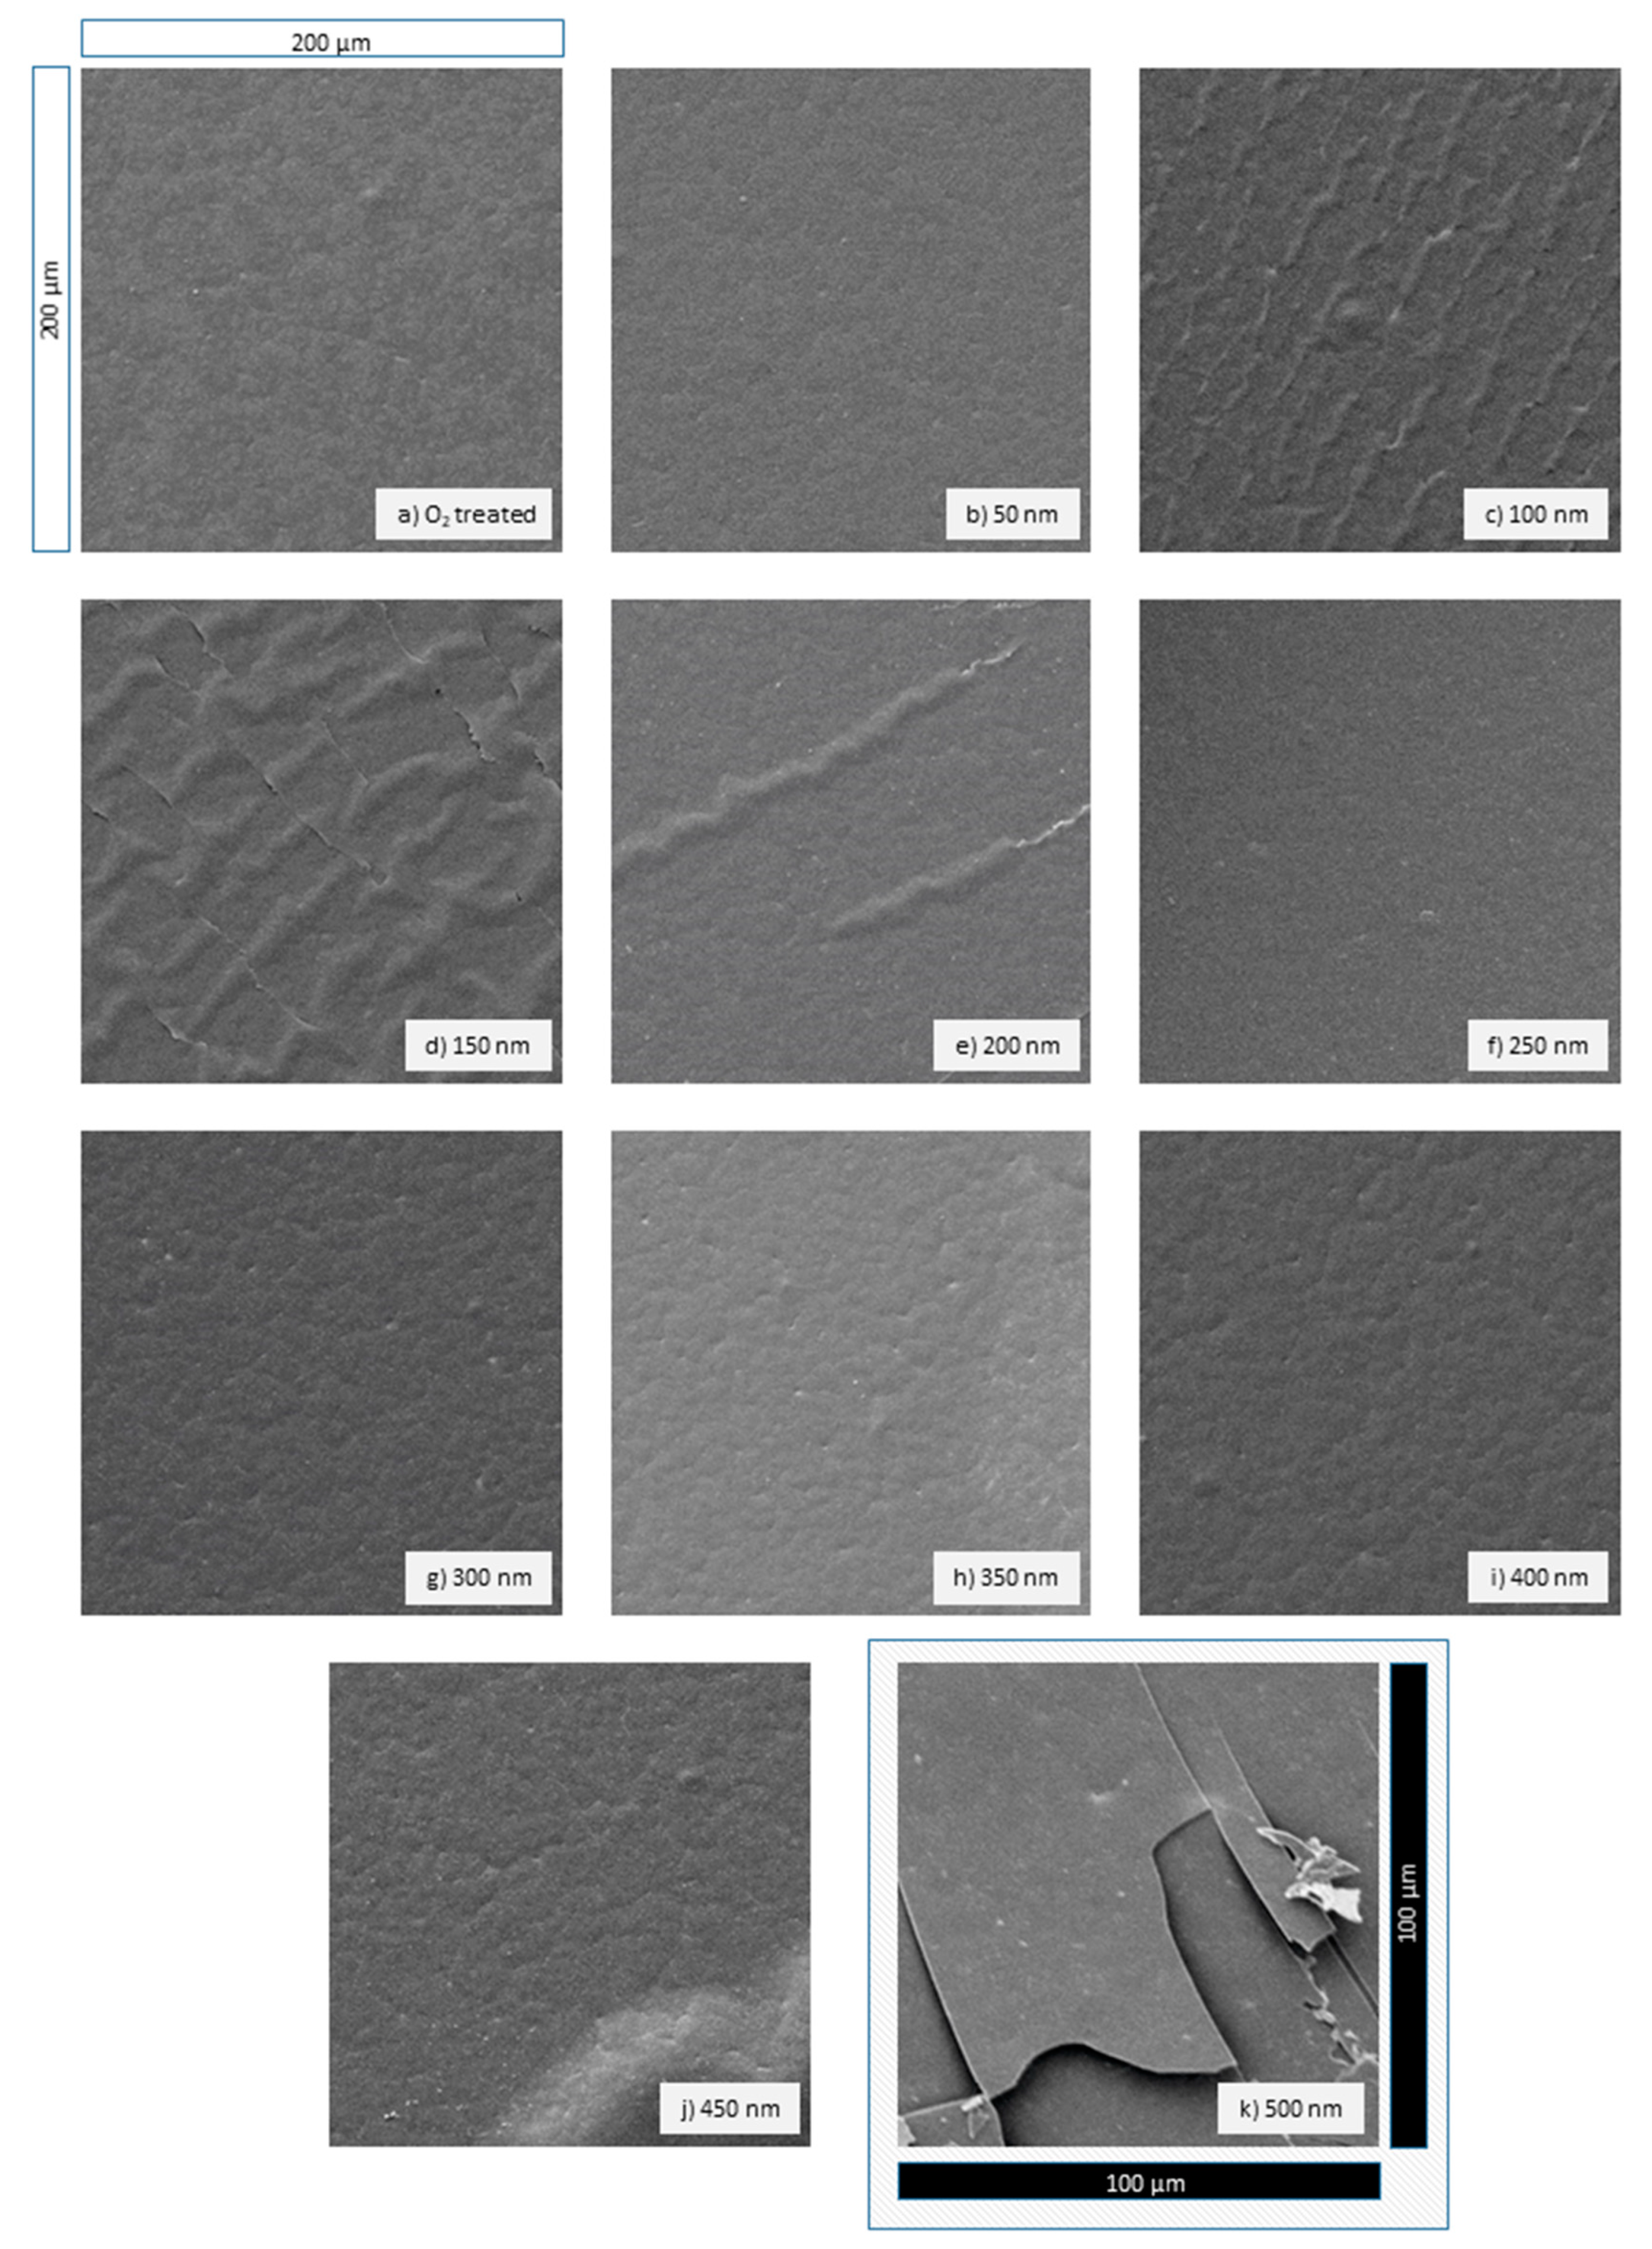
3.1. SEM Image Analysis
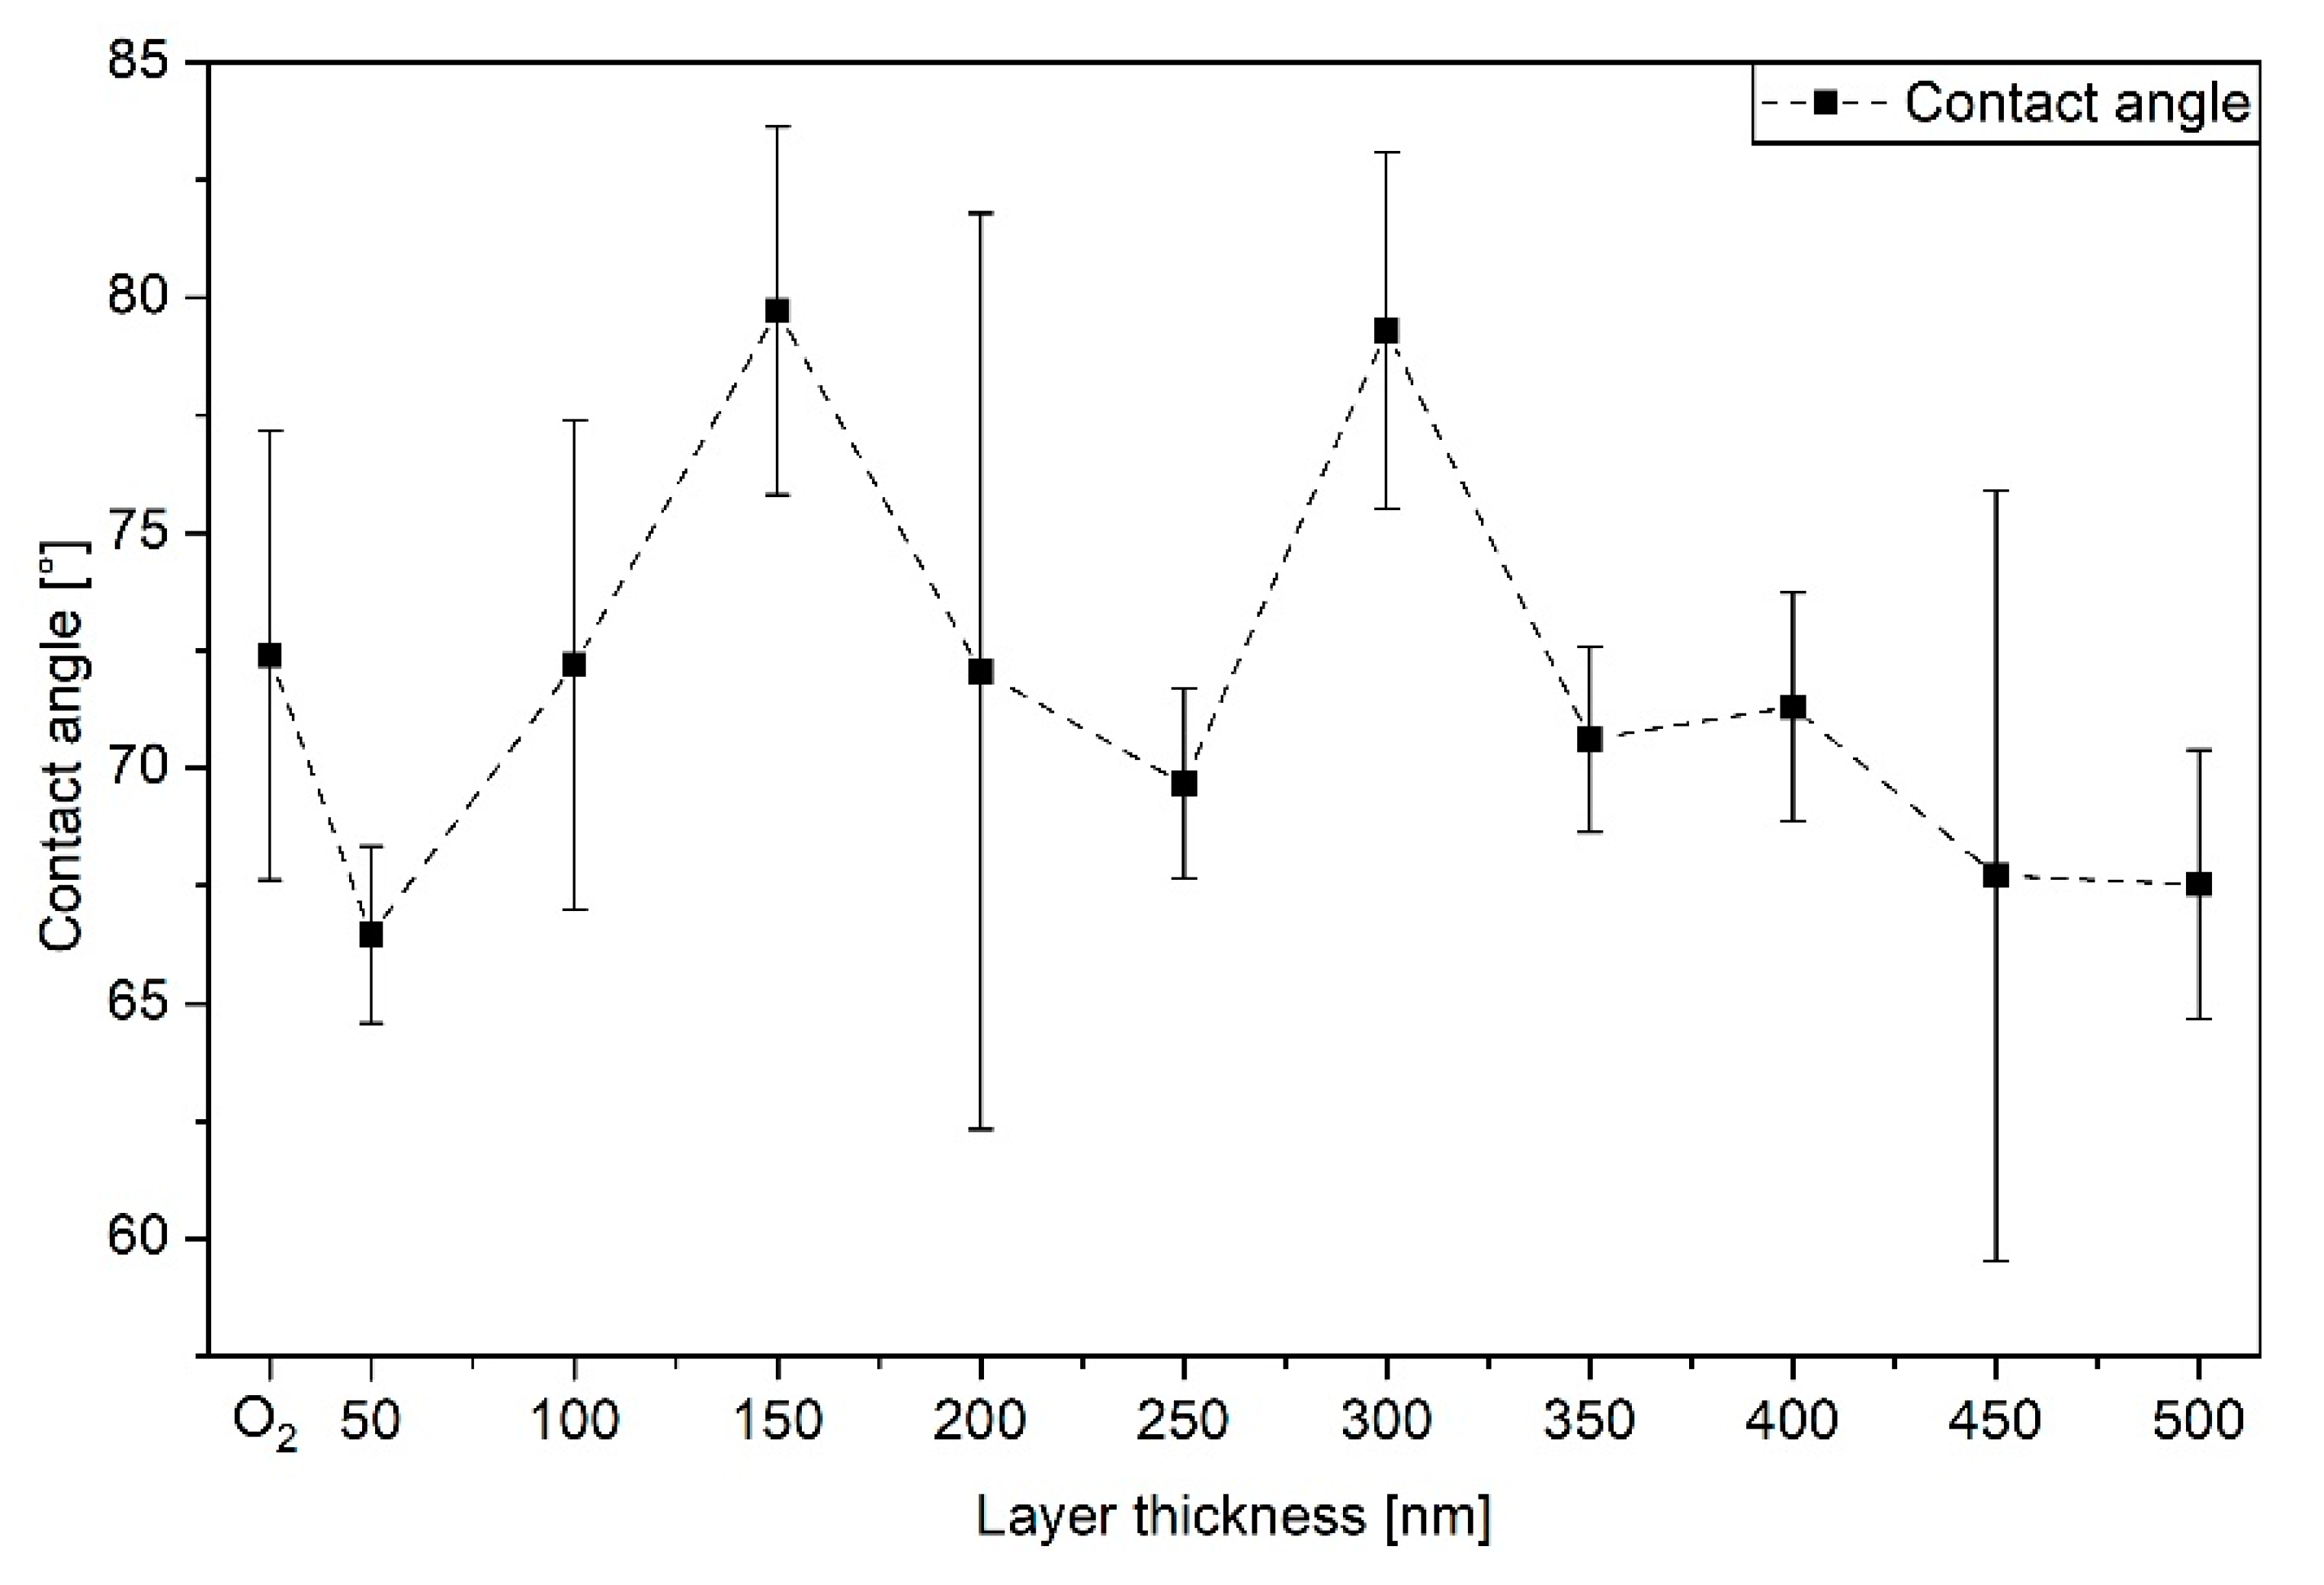
3.2. Surface Wettability by Contact Angles
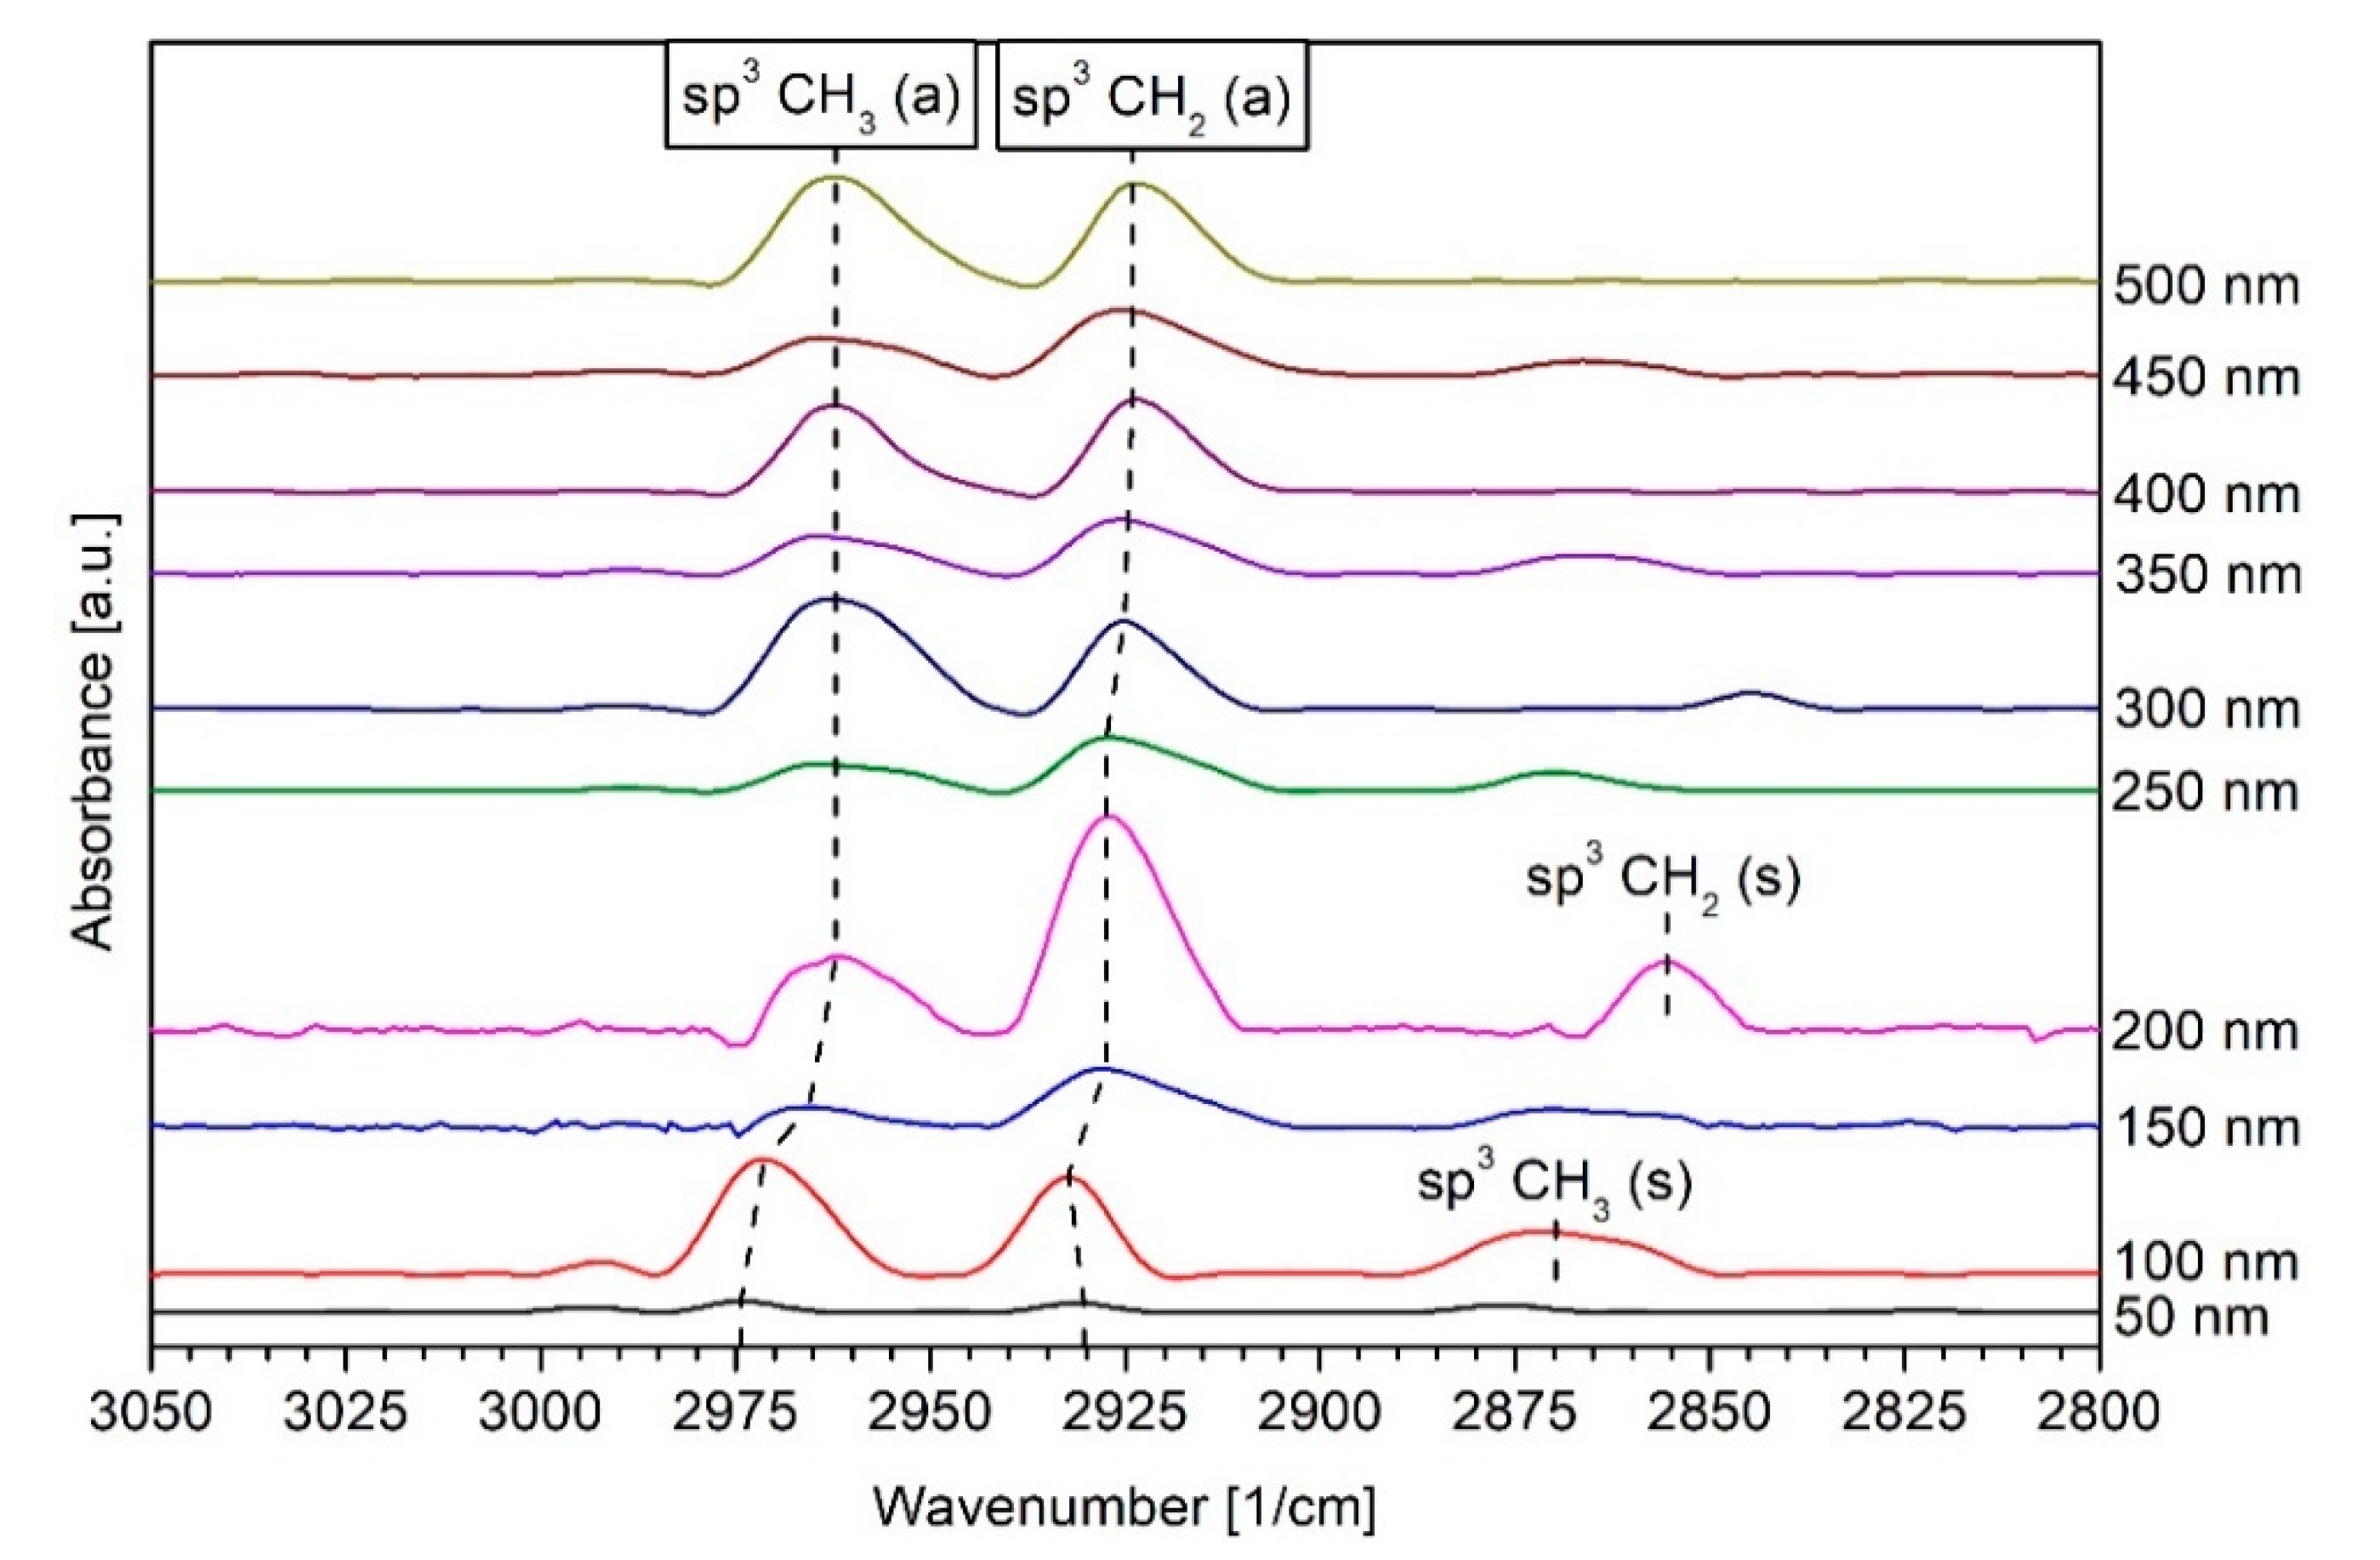
3.3. DRIFT Spectroscopy
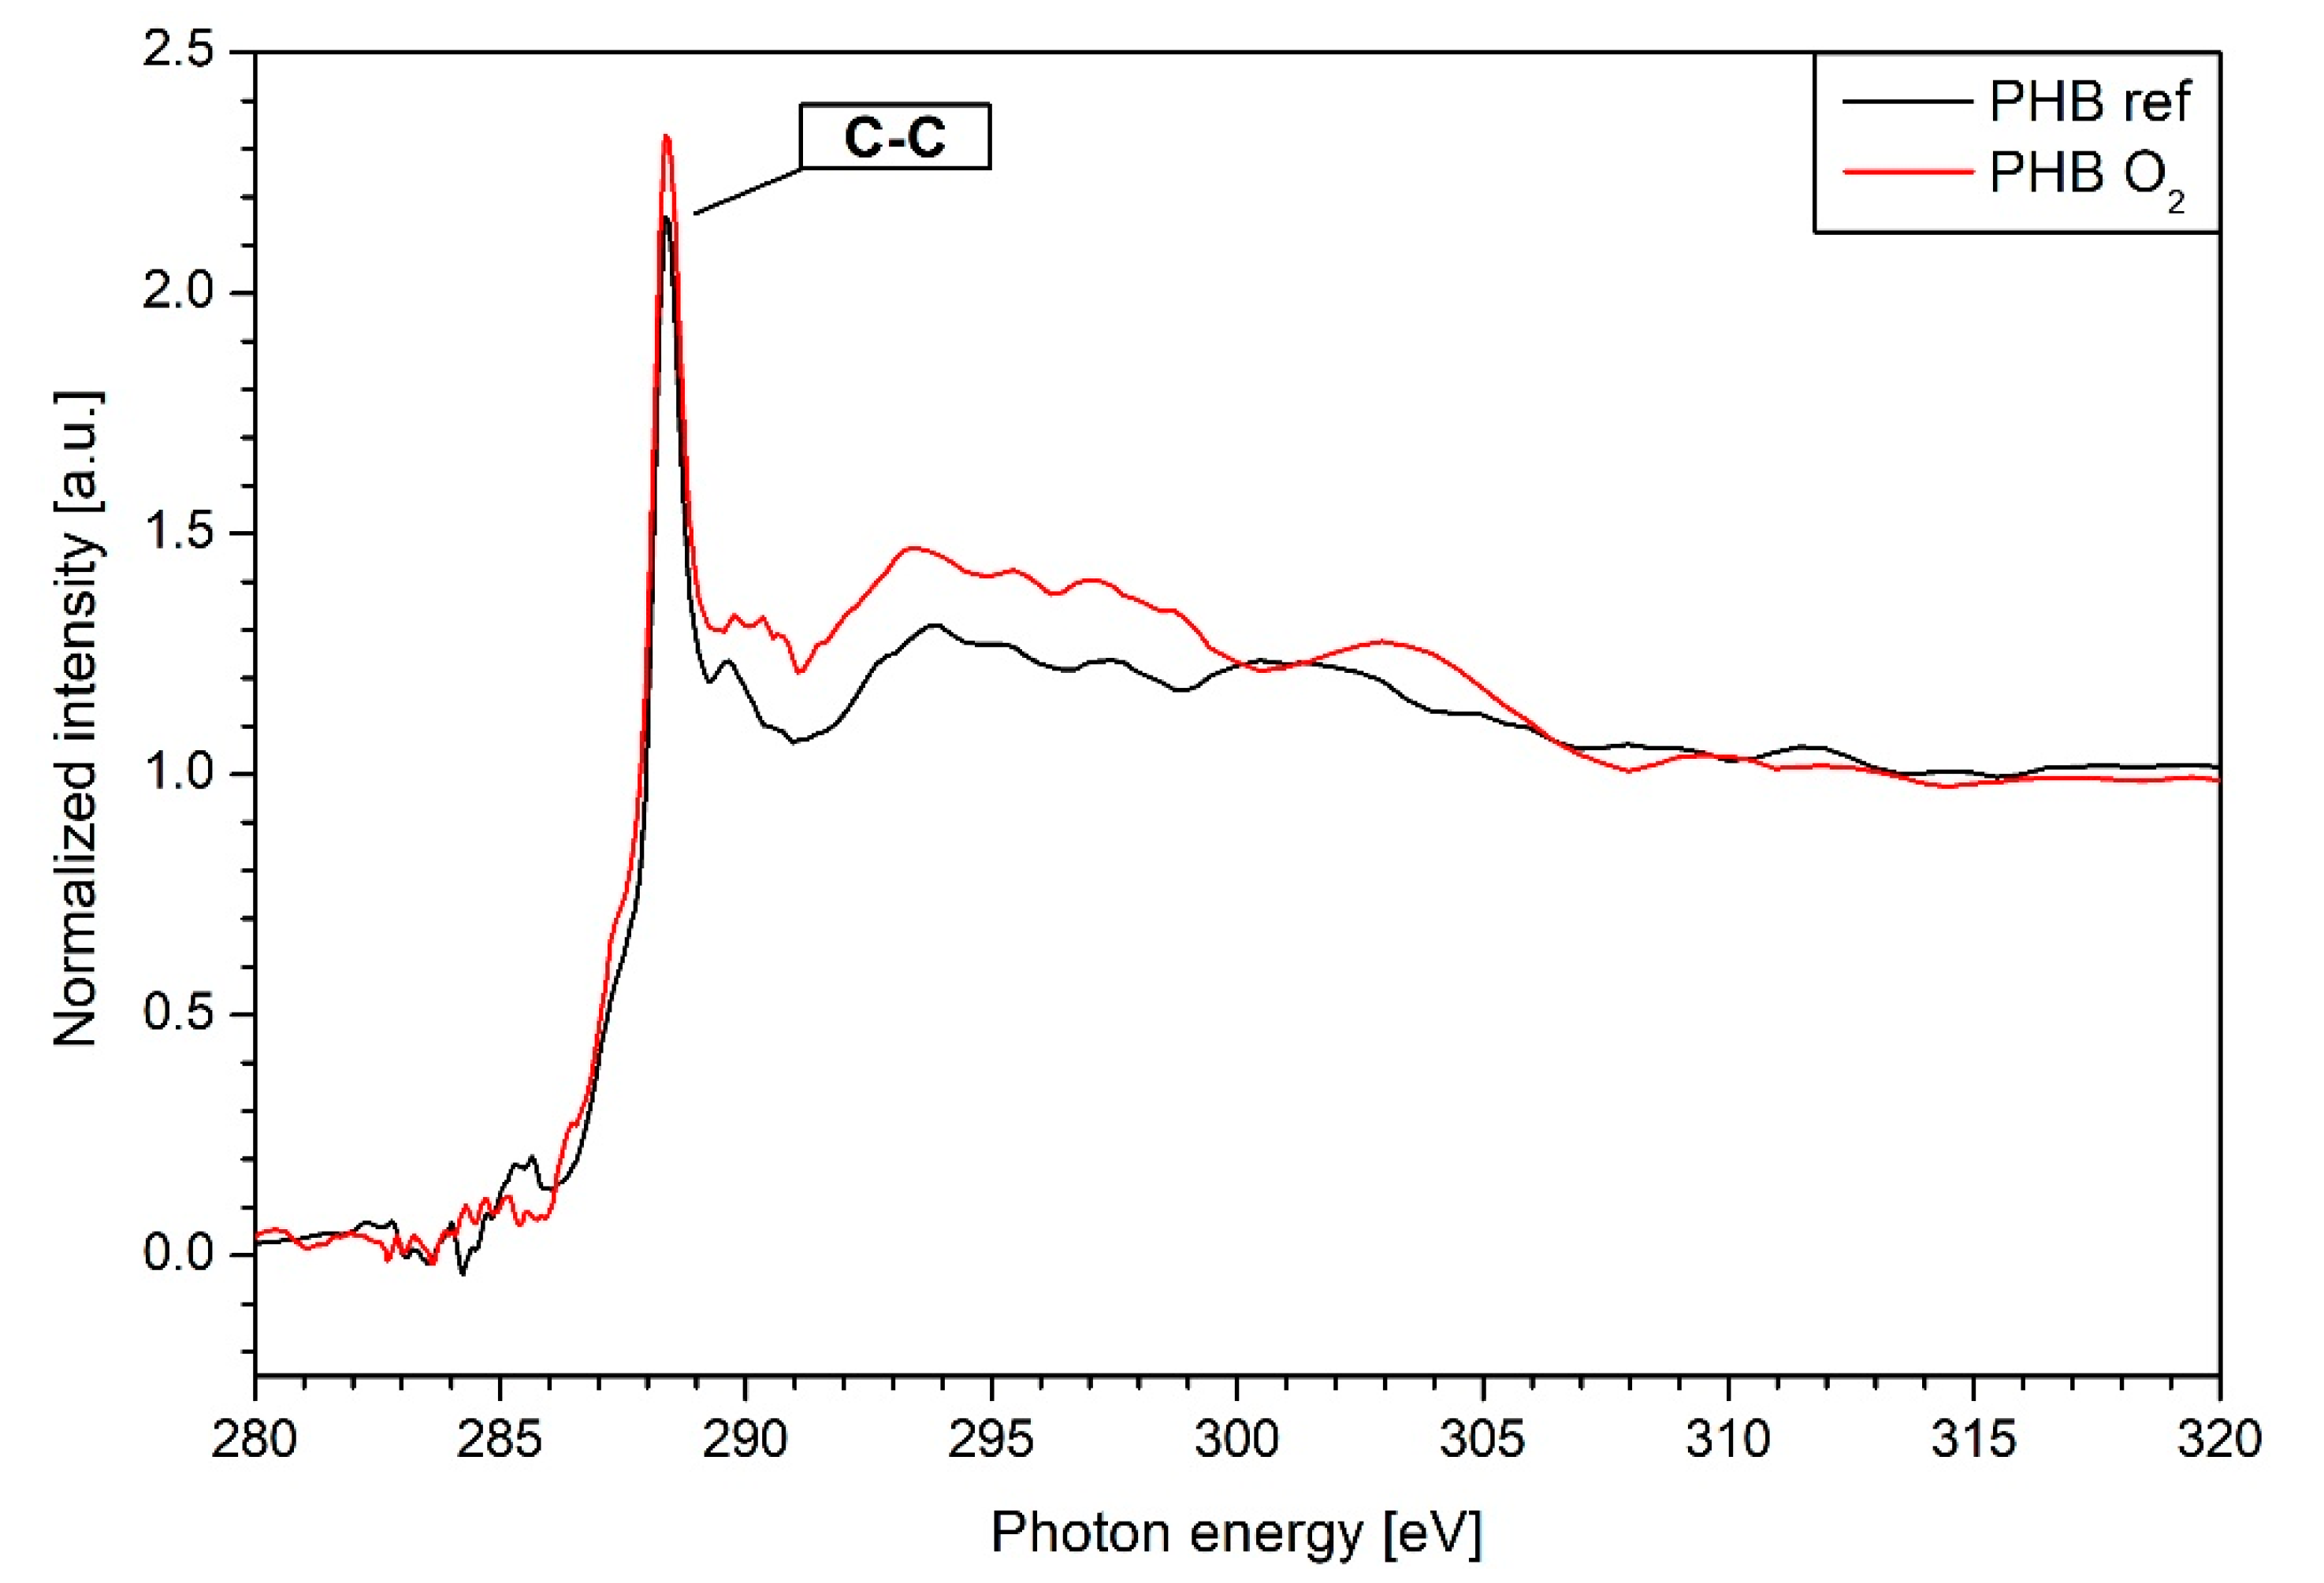
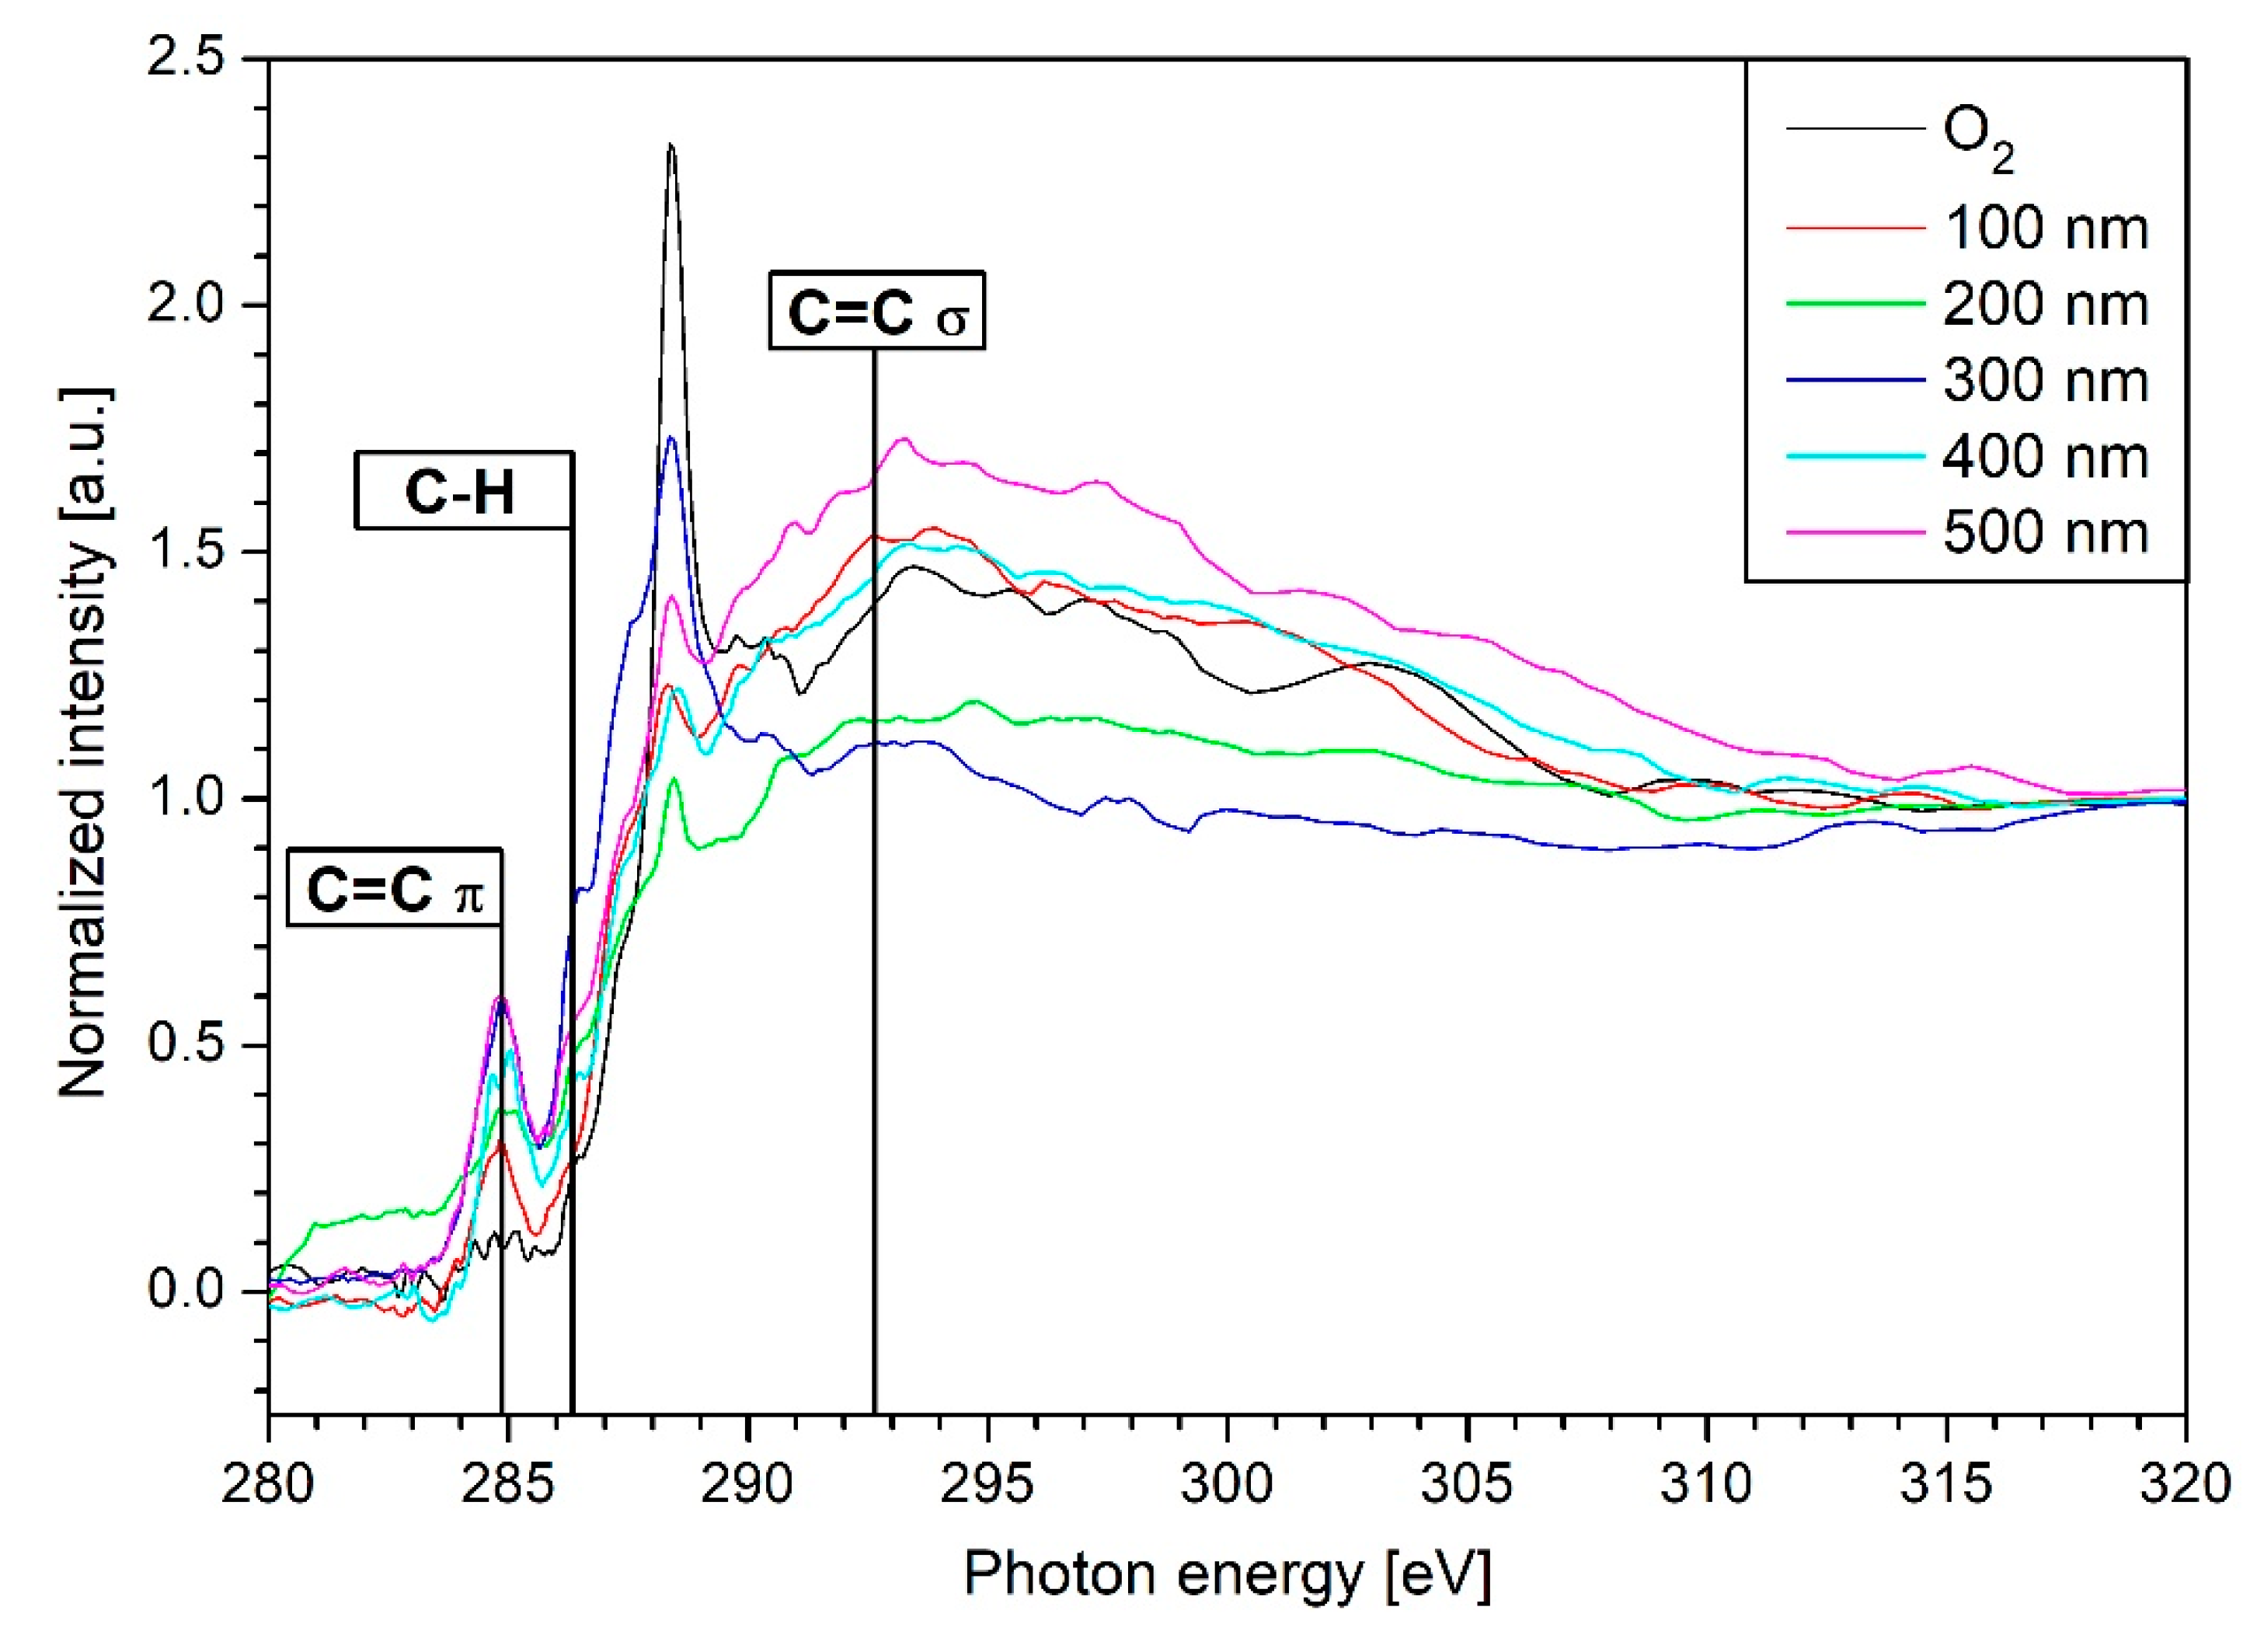
3.4. NEXAFS Results
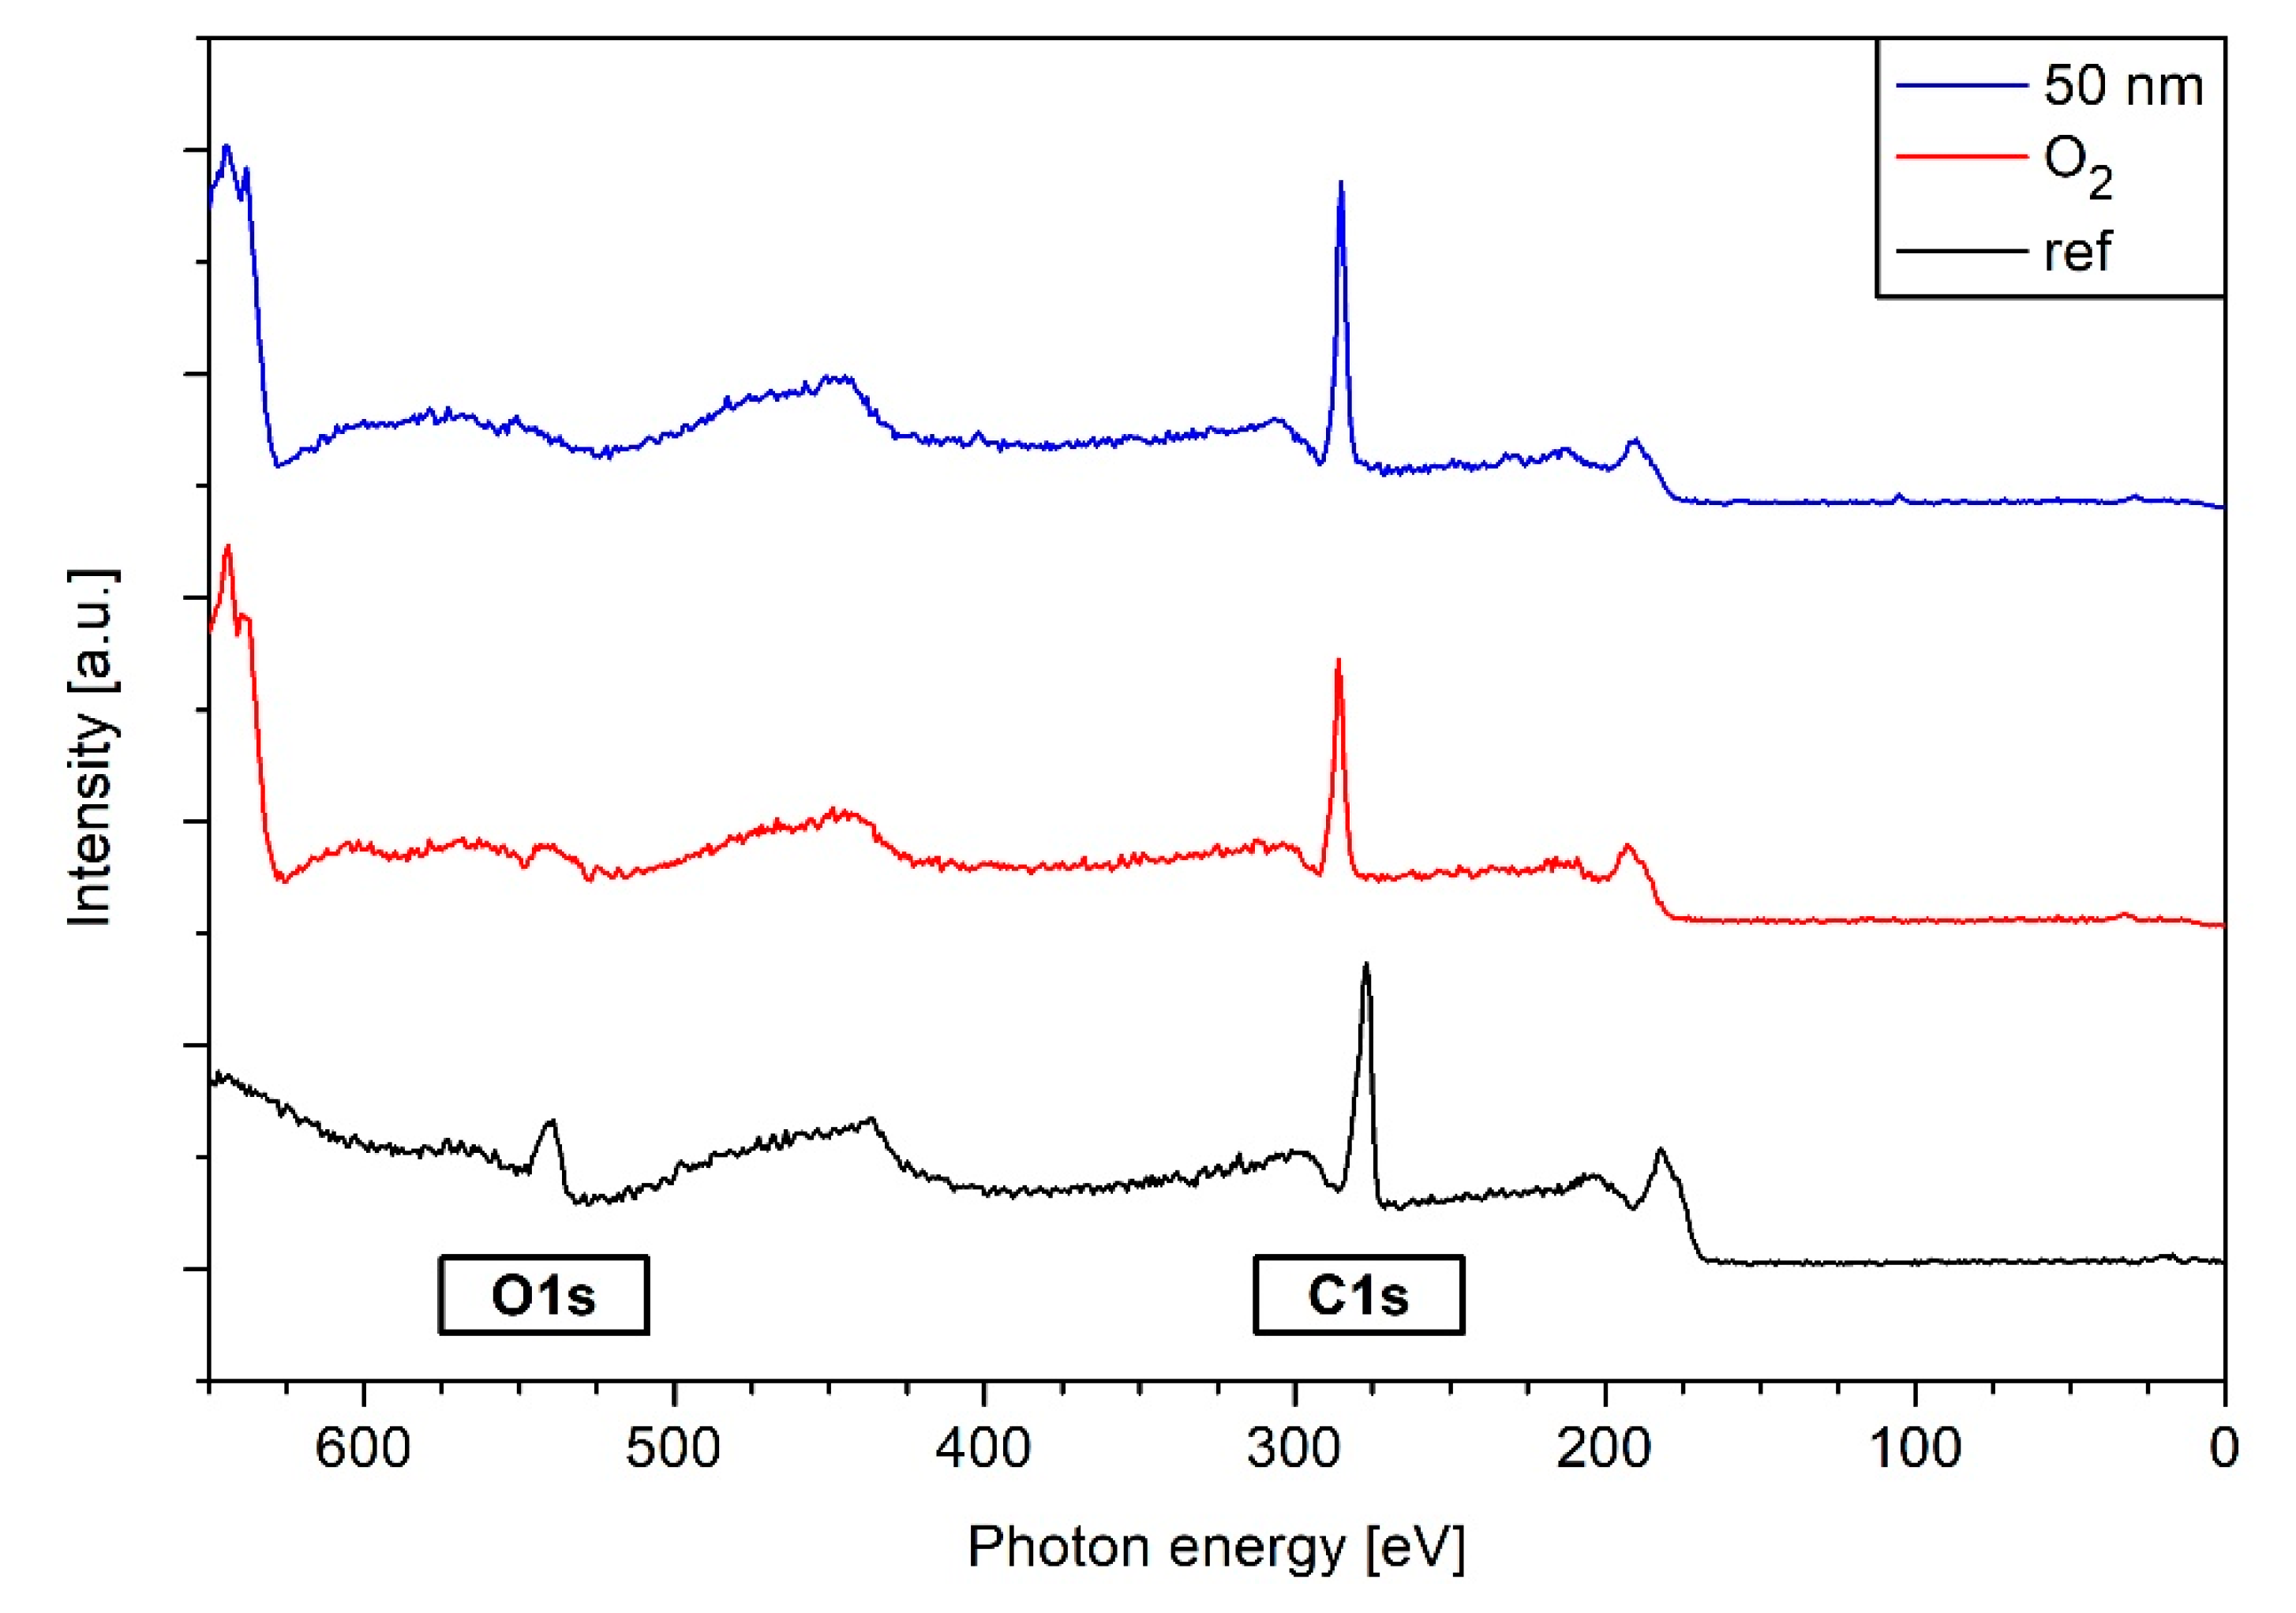
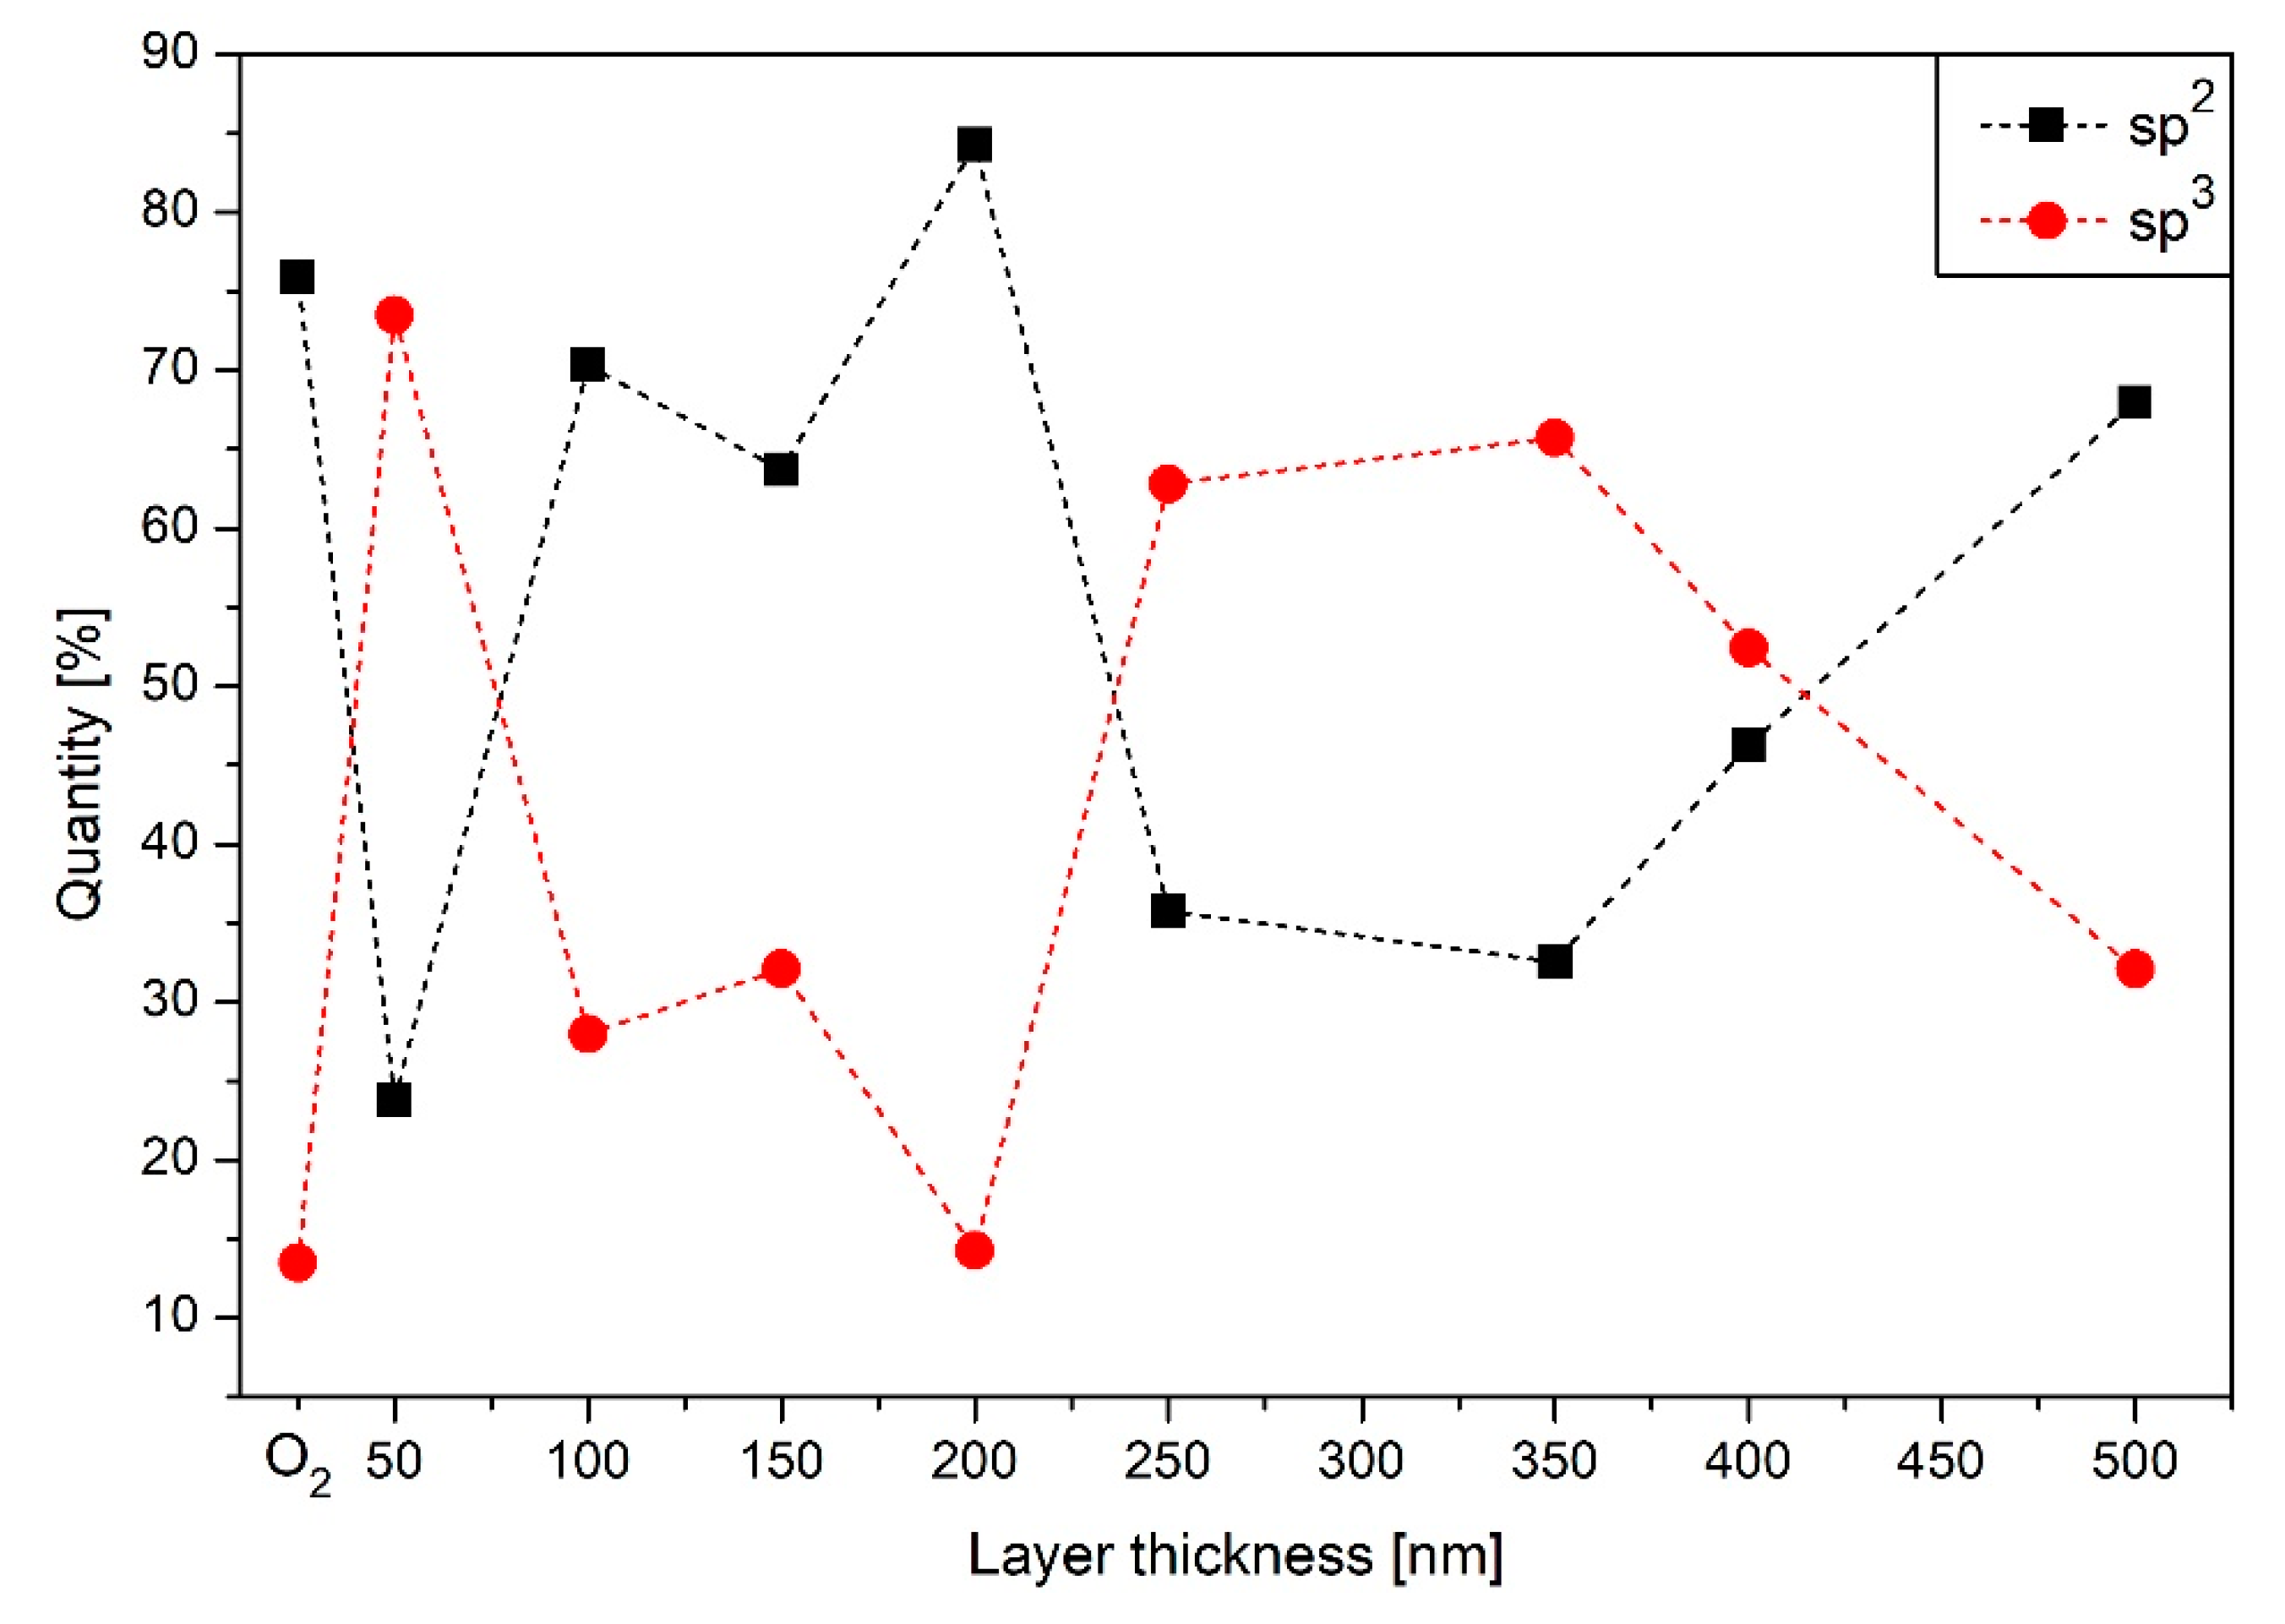
3.5. XPS Results
4. Conclusions
Author Contributions
Funding
Acknowledgments
Conflicts of Interest
References
- Ryan, P.G. Brief History of Marine Litter Research. In Book Marine Anthropogenic Litter; Bergmann, M., Gutow, L., Klages, M.A., Eds.; Springer International Publishing: Cham, Germany, 2015; pp. 1–25. [Google Scholar]
- Andrady, A.L.; Neal, M.A. Applications and societal benefits of plastics. Philos. Trans. R. Soc. B Biol. Sci. 2009, 364, 1977–1984. [Google Scholar] [CrossRef]
- Sabbatini, L. Polymer Surface Characterization; De Gruyter: Berlin, Germany; Boston, MA, USA, 2014; ISBN 978-3110275087. [Google Scholar]
- Grill, A. Plasma-deposited diamondlike carbon and related materials. IBM J. Res. Dev. 1999, 43, 147–162. [Google Scholar] [CrossRef]
- Rohrbeck, M.; Körsten, S.; Fischer, C.B.; Wehner, S.; Kessler, B. Diamond-like carbon coating of a pure bioplastic foil. Thin Solid Film. 2013, 545, 558–563. [Google Scholar] [CrossRef]
- Rohrbeck, M.; Fischer, C.; Wehner, S.; Meier, J.; Manz, W. DLC-coated pure bioplastic foil. Vákuum Forsch. Und Prax. 2014, 26, 42–47. [Google Scholar] [CrossRef]
- Schink, C.; Catena, A.; Heintz, K.; Görls, H.; Beresko, C.; Ankerhold, G.; von der Au, M.; Meermann, B.; Van Malderen, S.J.M.; Vanhaecke, F.; et al. Attaching photochemically active ruthenium polypyridyl complex units to amorphous hydrogenated carbon (a-C:H) layers. Adv. Mater. Interfaces 2019, 6, 1801308. [Google Scholar] [CrossRef]
- Bito, K.; Hasebe, T.; Maegawa, S.; Kitagawa, T.; Matsumoto, T.; Suzuki, T.; Hotta, A. Micropatterning of a 2-methacryloyloxyethyl phosphorylcholine polymer surface by hydrogenated amorphous carbon thin films for endothelialization and antithrombogenicity. Acta Biomater. 2019, 87, 187–196. [Google Scholar] [CrossRef] [PubMed]
- Dufils, J.; Faverjon, F.; Héau, C.; Donnet, C.; Benayoun, S.; Valette, S. Evaluation of a variety of a-C:H coatings on PEEK for biomedical implants. Surf. Coat. Technol. 2017, 313, 96–106. [Google Scholar] [CrossRef]
- Ishikawa, T.; Choi, J. The effect of microstructure on the tribological properties of a-C:H films. Diam. Relat. Mater. 2018, 89, 94–100. [Google Scholar] [CrossRef]
- Ray, S.C.; Mukherjee, D.; Sarma, S.; Bhattacharya, G.; Mathur, A.; Roy, S.; McLaughlin, J. Functional diamond like carbon (DLC) coatings on polymer for improved gas barrier performance. Diam. Relat. Mater. 2017, 80, 59–63. [Google Scholar] [CrossRef]
- Ahn, W.S.; Park, S.J.; Lee, S.Y. Production of Poly(3-Hydroxybutyrate) by Fed-Batch Culture of Recombinant Escherichia coli with a Highly Concentrated Whey Solution. Appl. Environ. Microbiol. 2000, 66, 3624–3627. [Google Scholar] [CrossRef]
- Robertson, J. Diamond-like amorphous carbon. Mater. Sci. Eng. R Rep. 2002, 37, 129–281. [Google Scholar] [CrossRef] [Green Version]
- Robertson, J. Plasma Deposition of Diamond-Like Carbon. Jpn. J. Appl. Phys. 2011, 50, 01AF01-1–01AF01-8. [Google Scholar] [CrossRef]
- Koidl, P.; Wild, C.; Dischler, B.; Wagner, J.; Ramsteiner, M. Plasma Deposition, Properties and Structure of Amorphous Hydrogenated Carbon Films. Mater. Sci. Forum. 1990, 52, 41–70. [Google Scholar] [CrossRef]
- Aldeeb, M.A.; Morgan, N.; Abouelsayed, A.; Amin, K.M.; Hassaballa, S.; Hassablla, S. Correlation of acetylene plasma discharge environment and the optical and electronic properties of the hydrogenated amorphous carbon films. Diam. Relat. Mater. 2019, 96, 74–84. [Google Scholar] [CrossRef]
- Grill, A. Diamond-like carbon coatings as biocompatible materials—An overview. Diam. Relat. Mater. 2003, 12, 166–170. [Google Scholar] [CrossRef]
- Couderc, P.; Catherine, Y. Structure and physical properties of plasma-grown amorphous hydrogenated carbon films. Thin Solid Film. 1987, 146, 93–107. [Google Scholar] [CrossRef]
- Paul, R.; Das, S.N.; Dalui, S.; Gayen, R.N.; Roy, R.K.; Bhar, R.; Pal, A.K.; Das, S. Synthesis of DLC films with different sp2/sp3 ratios and their hydrophobic behaviour. J. Phys. D Appl. Phys. 2008, 41, 1–7. [Google Scholar] [CrossRef]
- Fischer, C.B.; Rohrbeck, M.; Wehner, S.; Richter, M.; Schmeißer, D. Interlayer formation of diamond-like carbon coatings on industrial polyethylene. Appl. Surf. Sci. 2013, 271, 381–389. [Google Scholar] [CrossRef]
- Catena, A.; McJunkin, T.; Agnello, S.; Gelardi, F.M.; Wehner, S.; Fischer, C.B. Surface morphology and grain analysis of successively industrially grown amorphous hydrogenated carbon films (a-C:H) on silicon. Appl. Surf. Sci. 2015, 347, 657–667. [Google Scholar] [CrossRef]
- Catena, A.; Agnello, S.; Rösken, L.M.; Bergen, H.; Recktenwald, E.; Bernsmann, F.; Busch, H.; Cannas, M.; Gelardi, F.M.; Hahn, B.; et al. Characteristics of industrially manufactured amorphous hydrogenated carbon (a-C:H) depositions on high-density polyethylene. Carbon 2016, 96, 661–671. [Google Scholar] [CrossRef]
- Catena, A.; Kunze, M.R.; Agnello, S.; Gelardi, F.M.; Wehner, S.; Fischer, C.B. Amorphous hydrogenated carbon (a-C:H) depositions on polyoxymethylene: Substrate influence on the characteristics of the developing coatings. Surf. Coat. Technol. 2016, 307, 658–665. [Google Scholar] [CrossRef]
- Armaroli, T.; Bécue, T.; Gautier, S. Diffuse Reflection Infrared Spectroscopy (Drifts). Oil Gas Sci. Technol. 2004, 59, 215–237. [Google Scholar] [CrossRef]
- Günzler, H.; Gremlich, H.U. IR Spectroscopy: An Introduction; Wiley-VCH: Weinheim, Germany, 2002. [Google Scholar]
- Nefedov, A.; Wöll, C. Advanced Applications of NEXAFS Spectroscopy for Functionalized Surfaces. In Book Surface Science Techniques; Bracco, G., Holst, B., Eds.; Springer: Berlin/Heidelberg, Germany, 2013; pp. 277–303. [Google Scholar]
- Watts, B.; Thomsen, L.; Dastoor, P.C. Methods in carbon K-edge NEXAFS: Experiment and Analysis. J. Chem. Phys. 2014, 140, 105–120. [Google Scholar] [CrossRef]
- Mei, H.; Huang, R.; Chung, J.Y.; Stafford, C.M.; Yu, H.H. Buckling modes of elastic thin films on elastic substrates. Appl. Phys. Lett. 2007, 90, 151902. [Google Scholar] [CrossRef]
- Volinsky, A.A. Experiments with in-situ thin film telephone cord buckling delamination propagation. MRS Proc. 2002, 749. [Google Scholar] [CrossRef] [Green Version]
- Davis, C.A. A simple model for the formation of compressive stress in thin films by ion bombardment. Thin Solid Film. 1993, 226, 30–34. [Google Scholar] [CrossRef]
- Banerjee, D.; Mukherjee, S.; Chattopadhyay, K. Controlling the surface topology and hence the hydrophobicity of amorphous carbon thin films. Carbon 2010, 48, 1025–1031. [Google Scholar] [CrossRef]
- Feng, L.; Li, S.; Li, Y.; Li, H.; Zhang, L.; Zhai, J.; Song, Y.; Liu, B.; Jiang, L.; Zhu, D. Super-Hydrophobic Surfaces. Adv. Mater. 2002, 14, 1857–1860. [Google Scholar] [CrossRef]
- Barthlott, W.; Neinhuis, C. Purity of the sacred lotus, or escape from contamination in biological surfaces. Planta 1997, 202, 1–8. [Google Scholar] [CrossRef]
- Piazza, F.; Morell, G. Wettability of hydrogenated tetrahedral amorphous carbon. Diam. Relat. Mater. 2009, 18, 43–50. [Google Scholar] [CrossRef]
- Tay, B.K.; Sheeja, D.; Lau, S.P.; Guo, J. Study of surface energy of tetrahedral amorphous carbon films modified in various gas plasma. Diam. Relat. Mater. 2003, 12, 2072–2076. [Google Scholar] [CrossRef]
- Ostrovskaya, L.; Perevertailo, V.; Ralchenko, V.; Dementjev, A.; Loginova, O. Wettability and surface energy of oxidized and hydrogen plasma-treated diamond films. Diam. Relat. Mater. 2002, 11, 845–850. [Google Scholar] [CrossRef]
- Ostrovskaya, L. Studies of diamond and diamond-like film surfaces using XAES, AFM and wetting. Vacuum 2002, 68, 219–238. [Google Scholar] [CrossRef]
- Werder, T.; Walther, J.H.; Jaffe, R.L.; Halicioglu, T.; Koumoutsakos, P. On the Water-Carbon Interaction for Use in Molecular Dynamics Simulations of Graphite and Carbon Nanotubes. J. Phys. Chem. B 2003, 107, 1345–1352. [Google Scholar] [CrossRef]
- Zhou, Y.; Wang, B.; Song, X.; Li, E.; Li, G.; Zhao, S.; Yan, H. Control over the wettability of amorphous carbon films in a large range from hydrophilicity to super-hydrophobicity. Appl. Surf. Sci. 2006, 253, 2690–2694. [Google Scholar] [CrossRef]
- Bismarck, A.; Brostow, W.; Chiu, R.; Lobland, H.E.H.; Ho, K.K. Effects of surface plasma treatment on tribology of thermoplastic polymers. Polym. Eng. Sci. 2008, 48, 1971–1976. [Google Scholar] [CrossRef]
- Catena, A.; Guo, Q.; Kunze, M.R.; Agnello, S.; Gelardi, F.M.; Wehner, S.; Fischer, C.B. Morphological and Chemical Evolution of Gradually Deposited Diamond-Like Carbon Films on Polyethylene Terephthalate: From Subplantation Processes to Structural Reorganization by Intrinsic Stress Release Phenomena. ACS Appl. Mater. Interfaces 2016, 8, 10636–10646. [Google Scholar] [CrossRef]
- Tomasella, E.; Thomas, L.; Dubois, M.; Meunier, C. Structural and mechanical properties of a-C. Diam. Relat. Mater. 2004, 13, 1618–1624. [Google Scholar] [CrossRef]
- Veres, M.; Koos, M.; Pócsik, I. IR study of the formation process of polymeric hydrogenated amorphous carbon film. Diam. Relat. Mater. 2002, 11, 1110–1114. [Google Scholar] [CrossRef]
- Ristein, J.; Stief, R.T.; Ley, L.; Beyer, W. A comparative analysis of a-C:H by infrared spectroscopy and mass selected thermal effusion. J. Appl. Phys. 1998, 84, 3836–3847. [Google Scholar] [CrossRef]
- Flett, M.S.C. Characteristic Frequencies of Chemical Groups in the Infrared, 1st ed.; Elsevier Publishing Co.: Amsterdam, The Netherlands; London, UK; New York, NY, USA, 1963. [Google Scholar]
- Rao, C.N.R. Chemical Applications of Infrared Spectroscopy, 1st ed.; Academic Press: New York, NY, USA; London, UK, 1963. [Google Scholar]
- Brüster, B.; Amozoqueño, C.; Grysan, P.; Peral, I.; Watts, B.; Raquez, J.-M.; Dubois, P.; Addiego, F. Resolving Inclusion Structure and Deformation Mechanisms in Polylactide Plasticized by Reactive Extrusion. Macromol. Mater. Eng. 2017, 302, 1700326. [Google Scholar] [CrossRef]
- Stöhr, J. NEXAFS Spectroscopy; Springer Series in Surface Sciences 25; Springer: Berlin/Heidelberg, Germany, 1992. [Google Scholar]
- Díaz, J.; Anders, S.; Zhou, X.; Moler, E.J.; Kellar, S.A.; Hussain, Z. Analysis of the π* and σ* bands of the x-ray absorption spectrum of amorphous carbon. Phys. Rev. B 2001, 64, 125204. [Google Scholar] [CrossRef]
- Diaz, J.; Monteiro, O.R.; Hussain, Z. Structure of amorphous carbon from near-edge and extended x-ray absorption spectroscopy. Phys. Rev. B 2007, 76, 094201. [Google Scholar] [CrossRef]
- Dhez, O.; Ade, H.; Urquhart, S.; Urquhart, S. Calibrated NEXAFS spectra of some common polymers. J. Electron Spectrosc. Relat. Phenom. 2003, 128, 85–96. [Google Scholar] [CrossRef]
- Solomon, J.; Madix, R.; Stôhr, J. Orientation and absolute coverage of benzene, aniline, and phenol on Ag(110) determined by NEXAFS and XPS. Surf. Sci. 1991, 255, 12–30. [Google Scholar] [CrossRef]
- Tai, F.C.; Lee, S.C.; Wei, C.H.; Tyan, S.L. Correlation between ID⁄IG Ratio from Visible Raman Spectra and sp2/sp3 Ratio from XPS Spectra of Annealed Hydrogenated DLC Film. Mater. Trans. 2006, 47, 1847–1852. [Google Scholar] [CrossRef]
- Dietrich, P.M.; Horlacher, T.; Girard-Lauriault, P.L.; Gross, T.; Lippitz, A.; Min, H.; Wirth, T.; Castelli, R.; Seeberger, P.H.; Unger, W.E.S. Adlayers of Dimannoside Thiols on Gold: Surface Chemical Analysis. Langmuir 2011, 27, 4808–4815. [Google Scholar] [CrossRef]
- Schlebrowski, T.; Beucher, L.; Bazzi, H.; Hahn, B.; Wehner, S.; Fischer, C. Prediction of a-C:H layer failure on industrial relevant biopolymer polylactide acide (PLA) foils based on the sp2/sp3 ratio. Surf. Coat. Technol. 2019, 368, 79–87. [Google Scholar] [CrossRef]


© 2019 by the authors. Licensee MDPI, Basel, Switzerland. This article is an open access article distributed under the terms and conditions of the Creative Commons Attribution (CC BY) license (http://creativecommons.org/licenses/by/4.0/).
Share and Cite
Schlebrowski, T.; Beucher, L.; Bazzi, H.; Hahn, B.; Wehner, S.; Fischer, C.B. Changing Contents of Carbon Hybridizations in Amorphous Hydrogenated Carbon Layers (a-C:H) on Sustainable Polyhydroxybutyrate (PHB) Exhibit a Significant Deterioration in Stability, Depending on Thickness. C 2019, 5, 52. https://0-doi-org.brum.beds.ac.uk/10.3390/c5030052
Schlebrowski T, Beucher L, Bazzi H, Hahn B, Wehner S, Fischer CB. Changing Contents of Carbon Hybridizations in Amorphous Hydrogenated Carbon Layers (a-C:H) on Sustainable Polyhydroxybutyrate (PHB) Exhibit a Significant Deterioration in Stability, Depending on Thickness. C. 2019; 5(3):52. https://0-doi-org.brum.beds.ac.uk/10.3390/c5030052
Chicago/Turabian StyleSchlebrowski, Torben, Lucas Beucher, Hadi Bazzi, Barbara Hahn, Stefan Wehner, and Christian B. Fischer. 2019. "Changing Contents of Carbon Hybridizations in Amorphous Hydrogenated Carbon Layers (a-C:H) on Sustainable Polyhydroxybutyrate (PHB) Exhibit a Significant Deterioration in Stability, Depending on Thickness" C 5, no. 3: 52. https://0-doi-org.brum.beds.ac.uk/10.3390/c5030052