
Nanocomposite of Ellagic Acid with Multi-Walled Carbon Nanotubes for the Simultaneous Voltammetric Detection of Six Biomolecules


Department of Physical and Environmental Sciences, University of Toronto Scarborough, 1265 Military Trail, Toronto, ON M1C 1A4, Canada
*
Author to whom correspondence should be addressed.
C 2021, 7(2), 43; https://0-doi-org.brum.beds.ac.uk/10.3390/c7020043
Submission received: 18 March 2021
/
Revised: 21 April 2021
/
Accepted: 23 April 2021
/
Published: 3 May 2021
(This article belongs to the Collection Feature Papers in the Science and Engineering of Carbons)
Abstract
:In this proof-of-concept study, a highly sensitive electrochemical sensor using a graphite paste electrode modified with ellagic acid and multi-walled carbon nanotubes (MGPE/MWCNTs-EA) was developed for the simultaneous determination of six biomolecules: ascorbic acid (AA), dopamine (DA), uric acid (UA), tryptophan (Trp), xanthine (XA), and caffeine (CA). Differential pulse voltammetry (DPV) was performed at a potential range from 0.1–1.2 V vs. Ag/AgCl in phosphate electrolyte (pH 2.0). The modified GPE enabled the simultaneous determination of biomolecules under investigation in human urine and blood serum samples with detection limits ranging from 11–91 nM with recoveries of 94.0–106.0%. The electrochemical performance of the modified GPE for the analytes was stable and reproducible and checked with standard high performance liquid chromatography technique. The data suggested that the modified GPE provided a promising platform for routine quantitative determination of the biomolecules under investigation in quality control studies of real samples collected from food and pharmaceutical products.
1. Introduction
The quantitative determination of small molecules such as ascorbic acid (AA), dopamine (DA), uric acid (UA), tryptophan (Trp), xanthine (XA) and caffeine (CA) is generally performed using separation methods such high performance liquid chromatography (HPLC), ultra-performance liquid chromatography, and capillary electrophoresis [1,2,3,4,5,6,7,8,9,10]. These sophisticated methods have high costs with time-consuming procedures and require trained technicians for operation and data interpretation [11,12]. Indeed, all sample solutions should be clean without any suspension materials and color because of the limitations of expensive columns in HPLC and UPLC with optical detectors. In addition, in order to detect these biomolecules individually and simultaneously, several other methods such as spectrofluorimetry [13,14], mass spectrometry [15,16], and electrochemistry [17,18] have been reported. Among them, spectroscopic methods have been sensitive with a low detection limit in individual determinations but not for simultaneous determination of two or three analytes. In comparison with separation and spectroscopic techniques, electrochemical methods offer advantages such as low cost, rapid procedures, and simple systems that can be operated for individual and simultaneous determinations without any limitations on the color of sample solutions [19,20]; however, for better results, the analytes should be redox-active on the surface of the working electrodes (WEs). For this purpose, WEs were modified using different organic/inorganic compounds, nanomaterials, and nanocomposite structures to develop sensors with higher selectivity, sensitivity, and precision for simultaneous determination of more than three biomolecules without extensive use of sample preparation and separation techniques [19,20]. Without a modified WE, the oxidation peak current of AA would overlap with those of DA and UA. In addition, the oxidation peak current of Trp and CA would overlap with that of XA because of the similar chemical structure and electrochemical behaviour of these biomolecules. Therefore, simultaneous voltametric determination of these biomolecules has not been achieved in one measurement before, to the best of our knowledge.
AA is a vitamin soluble in water that is essential for biological metabolism [21], such as the amelioration of burns, injuries, the synthesis of collagen, blood vessels, cartilage, bones, and tendons [22,23]. This important vitamin cannot be synthesized in the human body and must be taken from external sources [24]. A suitable amount of AA can enhance Fe(III) absorption from a high non-heme iron availability by converting Fe(II) to Fe(III) and chelating with Fe(III) in the stomach’s acidic environment. On the other hand, high doses of AA can cause disturbances [25,26] and the extra amount is removed from the blood via the kidney through urine [27]. DA, as a neurotransmitter, is an important organic compound from the catecholamines family, and plays a principal role in mammals and the human central nervous system [28]. The risk of neurological diseases such as Schizophrenia, Parkinson’s, gout, brain ischemia, and kidney failure is increased with low or high levels of DA [29,30]. UA, as a primary end-product of purine metabolism, is a nitrogenous compound in urine and serum. Several diseases such as gout, hyperuricemia, pneumonia, and Lesch-Nyhan syndrome have been found to be increased with abnormal levels of UA [31,32] and it is very important that UA concentration is kept at a certain level in the body. Trp is an essential α-amino acid in humans with numerous physiological roles in human growth and metabolism. Similar to AA, Trp cannot be synthesized in the human body, and thus must be obtained through diet. An abnormal level of Trp can induce different diseases such as Alzheimer’s, dizziness, hallucinations, and certain cancers [33]. XN is a product of purine degradation in human body organisms and biological fluids [34]. An abnormal concentration of Trp in human tissues has pathological effects in people with hypertryptophanemia, a rare genetic disorder. With the lack of xanthine oxidase, the XA level in the human body has been found to be increased in this disorder and could cause kidney failure [1]. CA is a natural alkaloid belonging to the methylxanthine class; it is a stimulant drug that prevents sleep and can be found in coffee, chocolate, and tea, among others. Different physiological effects, such as gastric acid secretion, diuresis, stimulation of the central nervous system [2,3], trembling, nausea, nervousness, and seizures; and [4] mutation effects such as inhibition of DNA [5], prevent the absorption of minerals, especially iron [6], with excessive levels of CA.
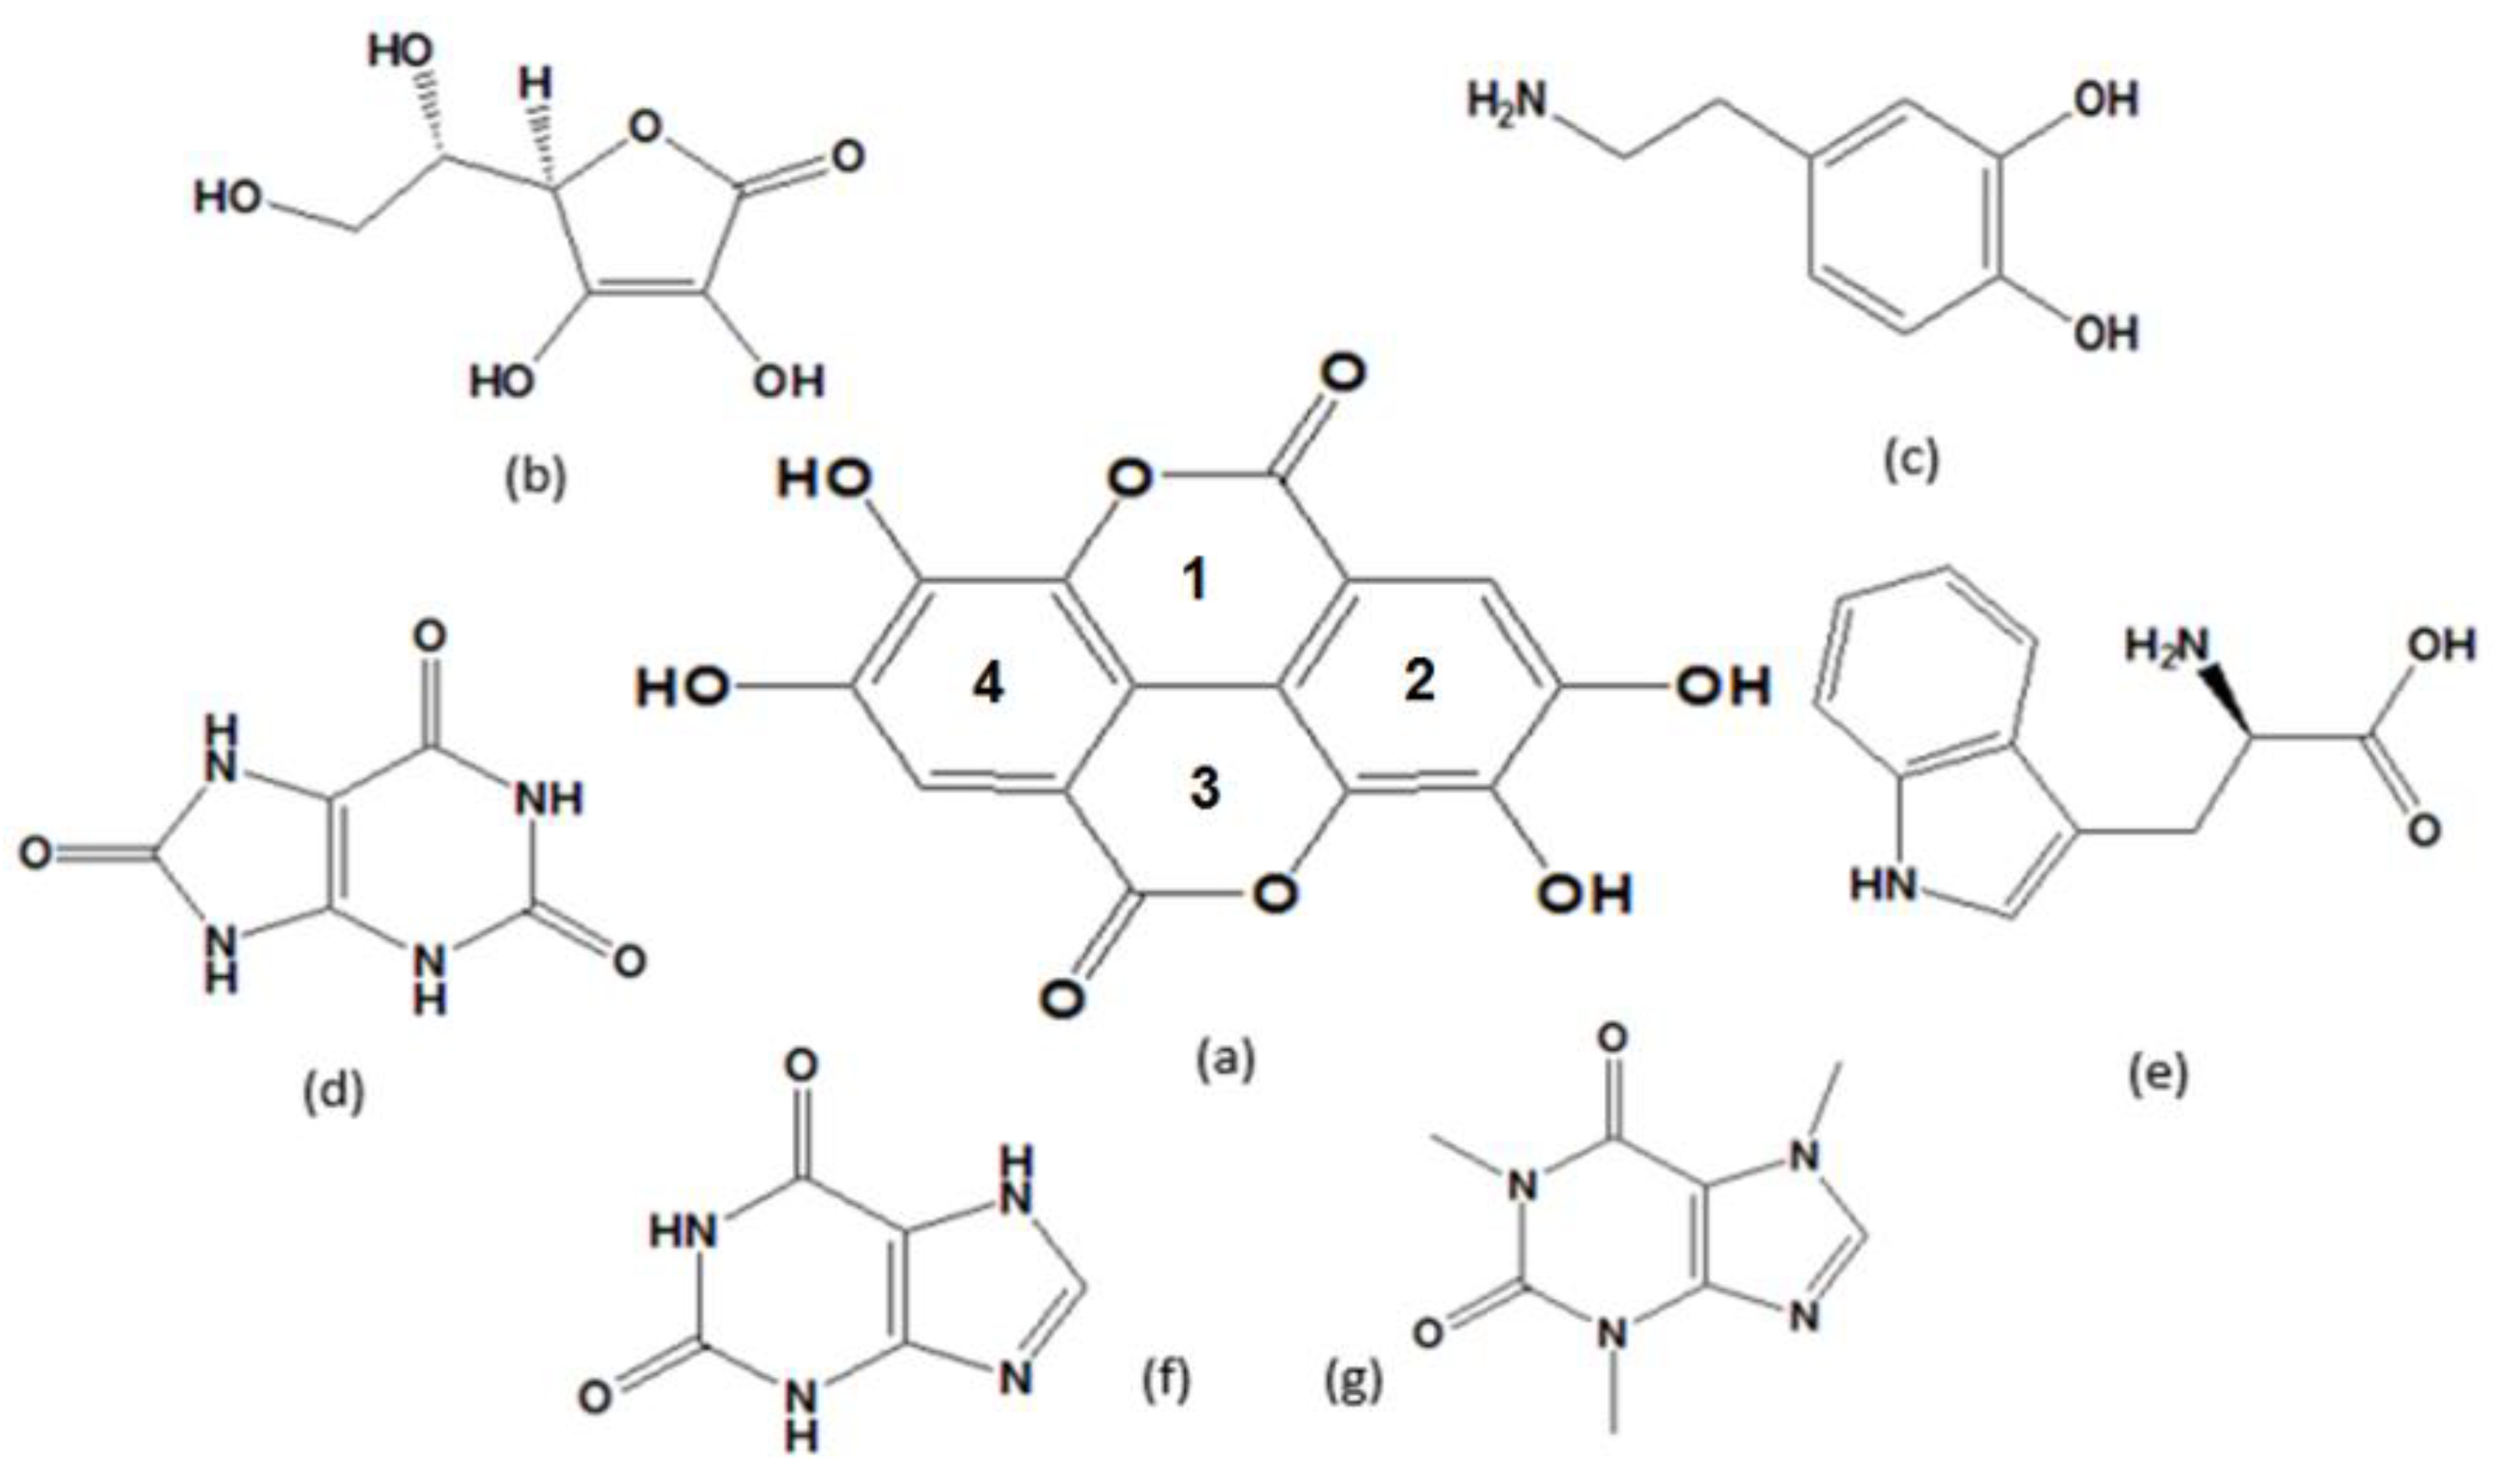
The pharmacological importance of these biomolecules demonstrates that they can usually co-exist in biological fluids and thus, their simultaneous detection would be of great significance to clinical diagnostic studies. However, voltammetric detection of UA and DA typically suffers from interference of AA and the voltammetric detection of XA would suffer from interference of Trp and CA, because these biomolecules show similar chemical structures and electrochemical behaviours. These problems can be solved by the modification of bare WEs. There is currently a lot of research attention on finding new nanocomposites to increas the selectivity and sensitivity of electrochemical sensors by decreasing the over-potential and enhancing the peak current of analytes [35]. In our previous works, various modified electrodes were used for simultaneous determination of three [36,37,38], four [39,40], five [17], and six [41] biomolecules. In the present study, an electrochemical method was developed for simultaneous determination of six biomolecules: AA, DA, UA, Trp, XN, and CA using ellagic acid (2,3,7,8-Tetrahydroxy-chromeno(4,3-cde)chromene-5,10-dione, EA (see chemical structures of the modifier and target biomolecules in Scheme 1 and multi-walled carbon nanotubes (MWCNTs) for modification of graphite paste electrode (GE). EA is a naturally occurring polyphenol that has a fused four-ring [42]. Over the past few years, due to its diverse properties such as antioxidant and antiviral [43,44], anti-cancer [45], anticoagulant [46], and chemo-preventive activities [47,48,49], EA has gained significant interest. Therefore, we used MGPE/MWCNTs-EA as a surface nanocomposite for the simultaneous electrochemical determination of biomolecules under investigation. Finally, a nanocomposite-modified electrode was used for the determination of analytes in real samples. The electrochemical results were compared with ones obtained from high performance liquid chromatography (HPLC) as the gold standard method.
Reagents and Solutions
Ascorbic acid (AA), dopamine (DA), uric acid (UA), tryptophan (Trp), xanthine (XA) and caffeine (CA) were obtained from Merck Company (Kenilworth, NJ, USA). Ellagic acid (EA) was obtained from Sigma-Aldrich Company (Oakville, ON, Canada). The multi-wall carbon nanotubes (MWCNTs), with nanotube diameters, OD = 20–30 nm, wall thickness = 1–2 nm, length = 0.5–2 μm and purity 95% from were purchased from Aldrich. Phosphate electrolyte and buffer and solutions (PBS) were prepared from H3PO4 (0.1 M), and pH range was adjusted to 2.0–8.0 with 0.1 M H3PO4 and NaOH. All solutions were prepared with ultra-pure Milli-Q water at a resistivity of 18.2 MΩ cm. All measurements were performed in compliance with relevant laws and institutional guidelines.
2. Instrumentation
Electrochemical measurements were performed with an Autolab electrochemical analyzer (Metrohm-Autolab B.V., Utrecht, The Netherlands). All electrochemical experiments were carried out on a conventional three-electrode cell at room temperature. A platinum electrode and a silver/silver chloride electrode (Ag/AgCl) were used as the counter and reference electrodes, and MGPE/EA as the working electrode. A Metrohm pH meter, model 744 (Metrohm-Autolab B.V., Utrecht, The Netherlands), was used for pH measurements.
Preparation of MGPE/MWCNTs-EA
The modified graphite paste electrode (MGPE) was prepared by carefully hand mixing 3 mg of EA, 3 mg of MWCNTs, and 3 drops of paraffin oil using a mortar and pestle for 5 min and then 194 mg graphite powder was added to the mixture step by step and mixed for 15 min to obtain a uniform paste. This paste was packed into the end of the glass cylinder tube with 2 mm diameter and a copper wire was used as electrical contact. Finally, the MGPEs were polished on a weighing paper. Before each measurement, for the elimination of any cross-contamination effects, the electrode surface was easily and rapidly renewed, and a few potential cycles in a cyclic voltammetric regime within the range of −0.5–1.5 V (vs. Ag/AgCl) at a scan rate of 50 mV/s were applied in the PBS (pH 2.0) until a stable voltammogram was obtained. The RSD% of this procedure was smaller than 5%, which was acceptable. The electrodes were stored in ultra-pure water at RT when not in use. The MGPE/EA and MGPE/MWCNTs were prepared with the same route for comparison studies.
3. Results and Discussion
3.1. Characterization
3.2. Electrochemical Behavior of the Modified Electrodes
Figure S1A shows CVs for the MGPE/MWCNTs-EA, MGPE/MWCNTs, MGPE/EA, and GPE. At the MGPE/MWCNTs-EA, the peak current was greater than the one recorded with MGPE/EA, indicating more efficient charge transfer property of the MWCNTs in the modified graphite paste electrode surface (syngeneic effect). The oxidation peaks of EA can be assigned to oxidation of catechol moieties, 3′,4′-dihydroxyl electron-donating groups, at rings 2 and 4 (see Scheme 1) that undergo a two-electron procession. Electrochemical measurements of the MGPE/MWCNTs-EA, MGPE/MWCNTs, MGPE/EA, and GPE were analyzed for the anodic peak current (Ipa) of the respective cyclic voltammograms obtained in the presence of 1.0 mM of [Fe(CN)6]3− in 0.1 M KCl of supporting electrolyte (Figure S1B–E). As shown in Figure S1, all assays were performed using cyclic voltammetry between potentials of −1.0 to 1.1 V for MGPE/MWCNTs-EA, MGPE/MWCNTs, MGPE/EA, and GPE at various scan rates. For a reversible process, the Randles-Sevcik equation can be used:
where Ipa refers to the anodic peak current, DR is diffusion coefficient, n is the number of electrons exchanged, A is the surface area of the electrode, C0 is the concentration of [Fe(CN)6]3−, v and is the scan rate. For [Fe(CN)6]3−, n = 1, D = 7.6 × 10⁻⁶ cm s−1, the effective area could be calculated from the slope of the Ipa vs. v1/2 relation (see Figure S1F) [21]. The effective surface area for MGPE/MWCNTs-EA, MGPE/MWCNTs, MGPE/EA, and GPE were 0.44, 0.38, 0.32, and 0.15 cm2, respectively. Based on the results, the effective surface area was about 5-fold larger than that of the GPE. Therefore, the results indicated that the presence of EA and both MWCNTs and EA greatly improved the electro-active area of the electrode and contributed to an increase in the conductivity of the modified graphite paste electrode in comparison with other modified electrodes and the unmodified electrode. Another evidence for comparison is the faradaic electrochemical impedance spectroscopy that was performed for the above four GPE, MGPE/EA, MGPE/MWCNTs, and MGPE/MWCNTs-EA electrodes in the presence of ferro/ferricynaide redox couple.
Ipa = 2.69 × 10⁵n3/2AC0DR1/2v1/2
Figure 2 shows the Nyquist plots for these electrodes and the Randles equivalent circuit that was used for fitting the EIS data using NOVA software (Metrohm, Utrecht, The Netherlands).
The Randles equivalent circuit consisted of a solution resistance (Rs) (21.3 Ω in this work), a charge transfer resistance (Rct), a double-layer capacitance (Cdl), and Warburg impedance (ZW) (inset in Figure S3). Nyquist plots showed a semicircle with Rct of 1832 Ω for GPE. After modification with EA, MWCNTs, and MWCNTs-EA, the Rct decreased to 1187, 689, and 499 Ω, respectively, thus, a significantly lower Rct was obtained for MGPE/MWCNTs-EA in comparison with GPE, MGPE/EA, and MGPE/MWCNTs.
3.3. Electrochemical Behavior of AA, DA, UA, Trp, XN, and CA
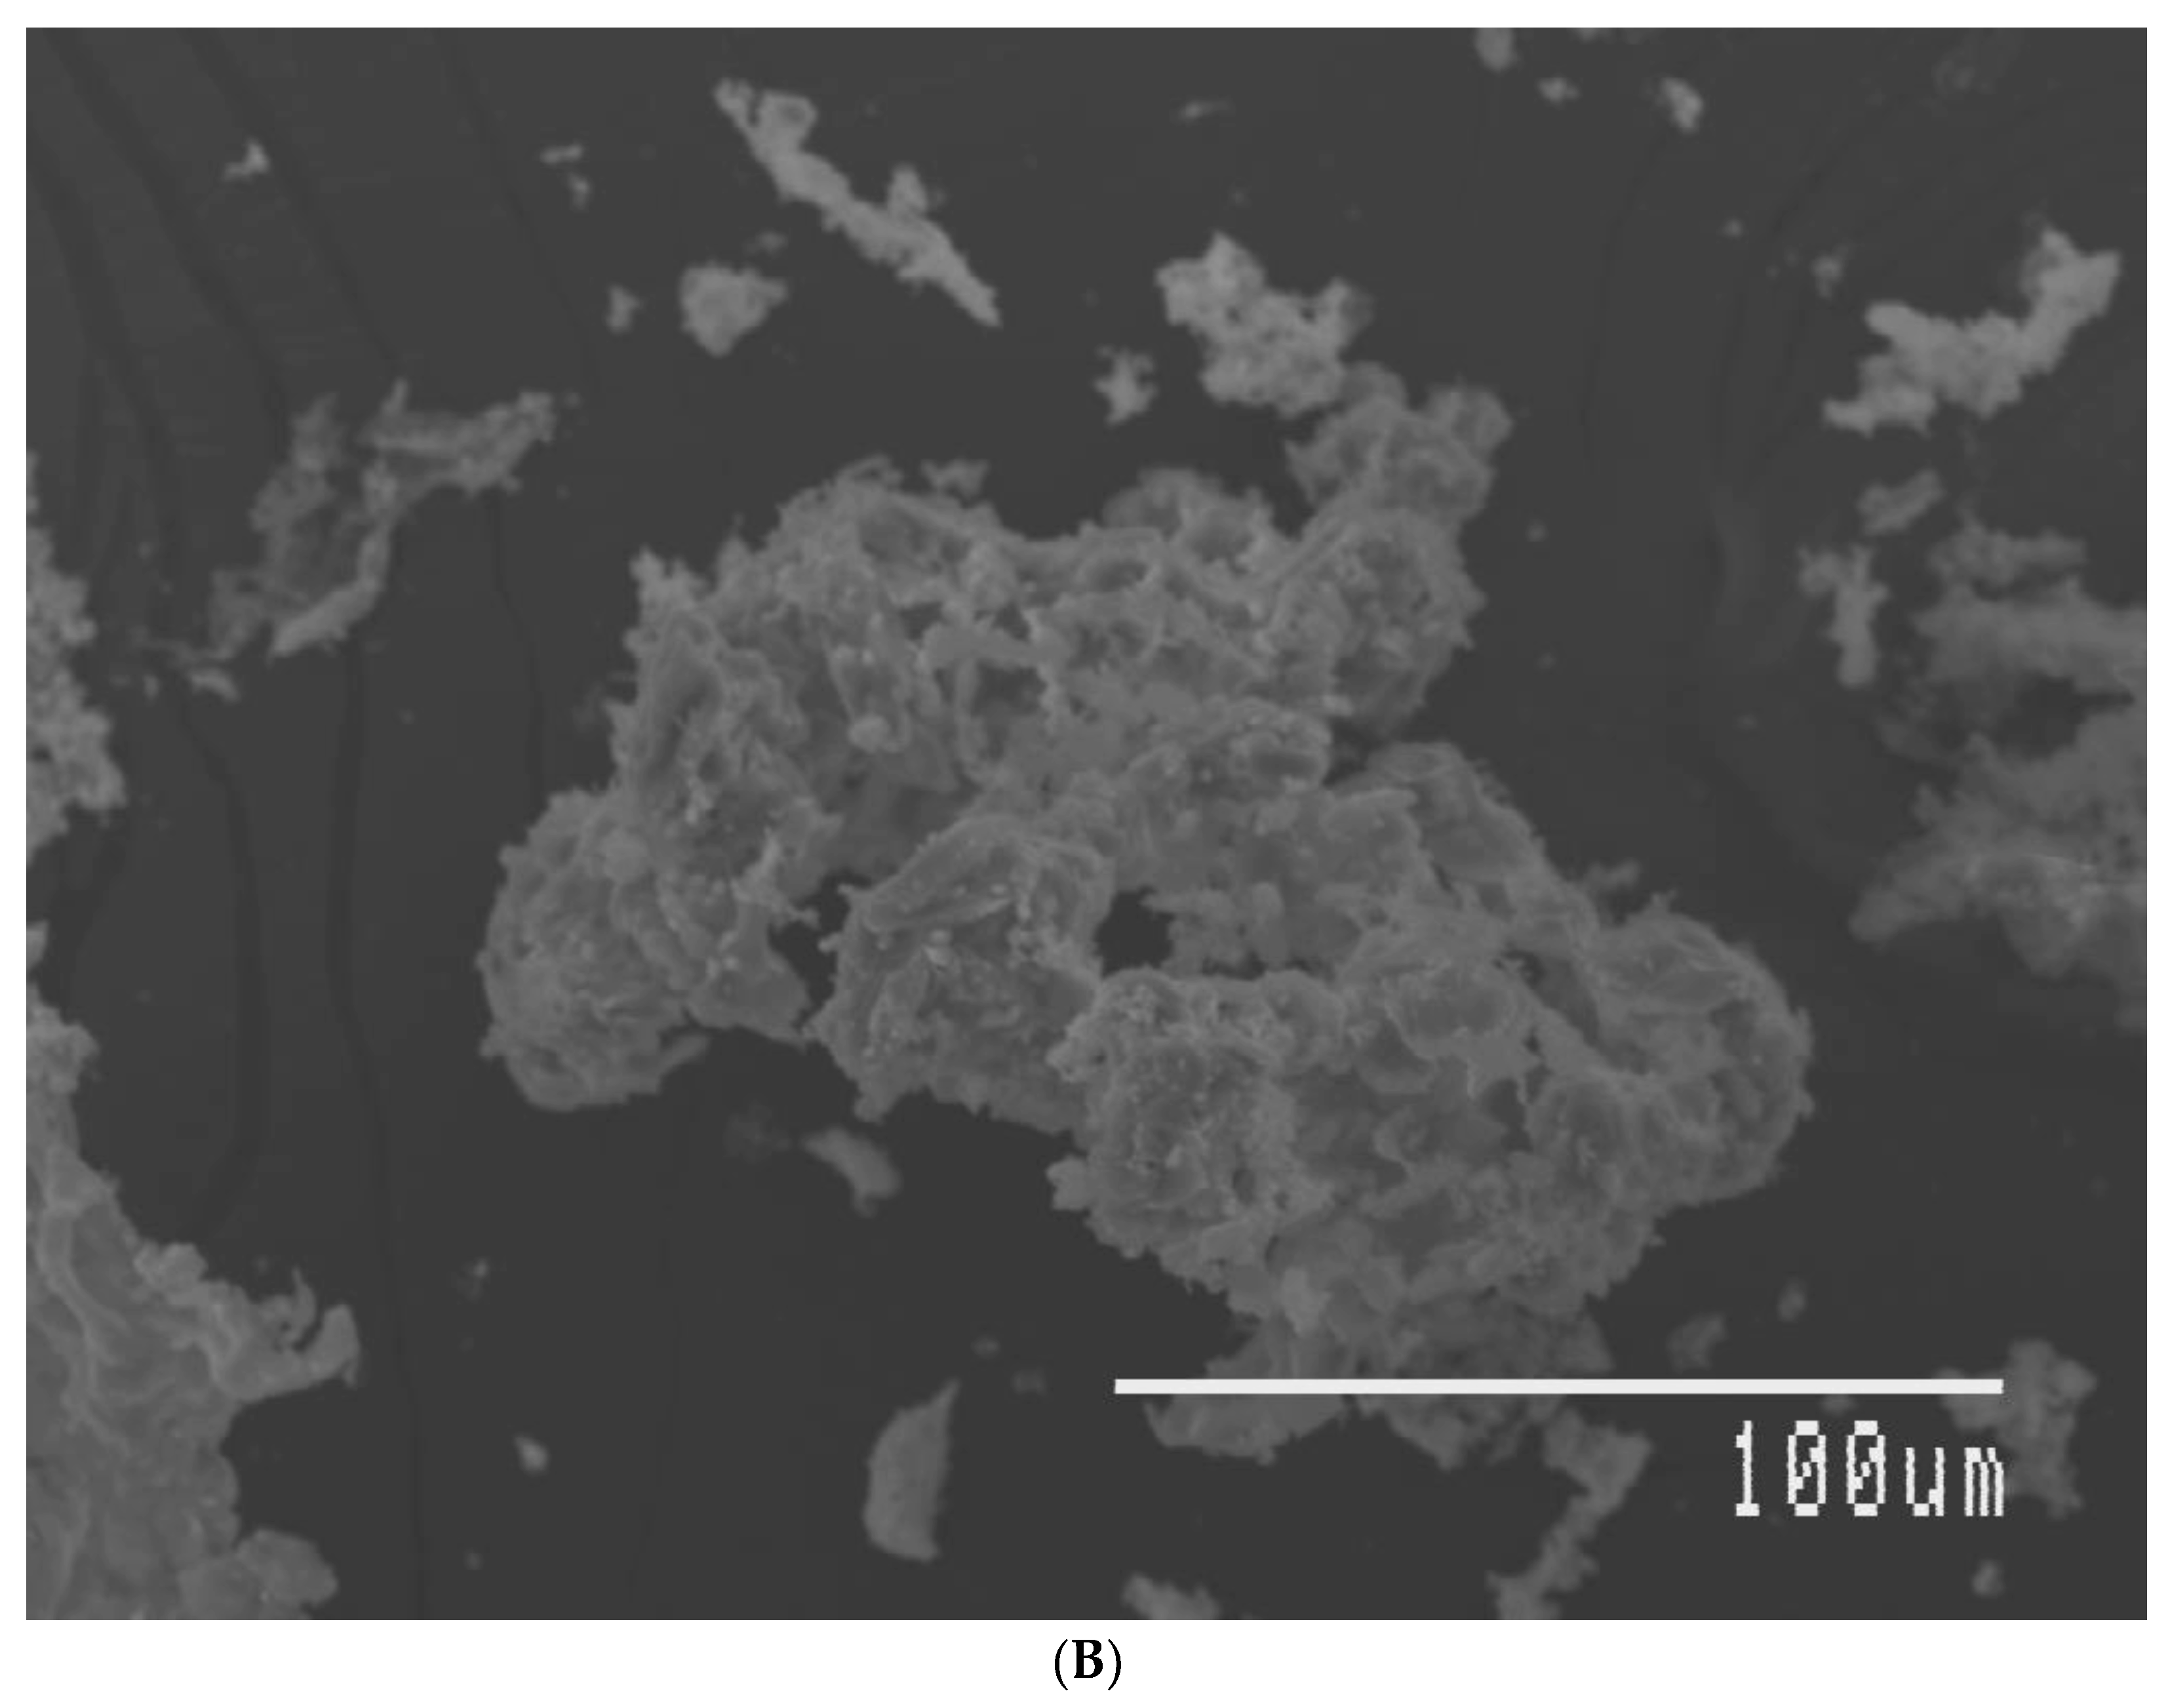
Figure 3A shows the DPVs of a mixture of 15.0 μM AA, 22 μM DA, 15.0 μM UA, Trp, XN, and 22 μM CA at the surface of the modified graphite paste electrode, MGPE/EA, MGPE/MWCNTs, and GPE in 0.1 M PBS (pH 2.0). As shown in Figure 3A(a), there are six well-defined oxidation peaks at potentials of 0.35, 0.42, 0.57, 0.87, 0.95, and 1.11 V at the MGPE/MWCNTs-EA surface for AA, DA, UA, Trp, XN and CA, respectively. In Figure 3A(b), the MGPE/MWCNTs show four oxidation peaks for AA, DA, UA, and CA and a broad oxidation peak for Trp and XN. The MGPE/EA shows three broad oxidation peaks: the first broad peak is for AA-DA-UA, the second for Trp-XA, and the third for CA (see Figure 3A(c)). For the bare GPE in Figure 3A(d), the first broad peak is for the mixture AA-DA-UA, the second board peak is for Trp-XA, and the third peak is for CA. The oxidation peaks of AA, DA, UA, Trp, XN, and CA on the surface of GPE/MWCNT were significantly low and no distinguishable current peaks were detected. In addition, bare GPE and MGPE/EA was unable to show six well-defined oxidation peaks for AA, DA, UA, Trp, XN, and CA.
Thus, these results indicated that MGPE/MWCNTs-EA significantly improved the separation of oxidation peak potentials and enhanced peak currents with a considerable enhancement in the anodic peak current of AA, DA, UA, Trp, XN, and CA in comparison with GPE and GPE-MWCNTs. These results clearly show the synergic effect of MWCNTs and EA for electrooxidation of the biomolecules under investigation.
Moreover, the selective senary detection of the biomolecules under investigation on the MGPE/MWCNTs-EA electrode was studied by comparing the DPV responses of the simultaneous and individual measurements of these six compounds. The results are displayed in Figure 3B, indicating that the oxidation processes of these six compounds were independent and therefore, simultaneous determination of AA, DA, UA, Trp, XN, and CA on the modified graphite paste electrode was possible without any significant interference and crosstalk between the biomolecules. The resulting selectivity and sensitivity of the six anodic peak currents was sufficient to achieve accurate simultaneous determination of these biomolecules in mixed samples.
3.4. Influence of pH on the Simultaneous Electrooxidation of AA, DA, UA, Trp, XN, and CA
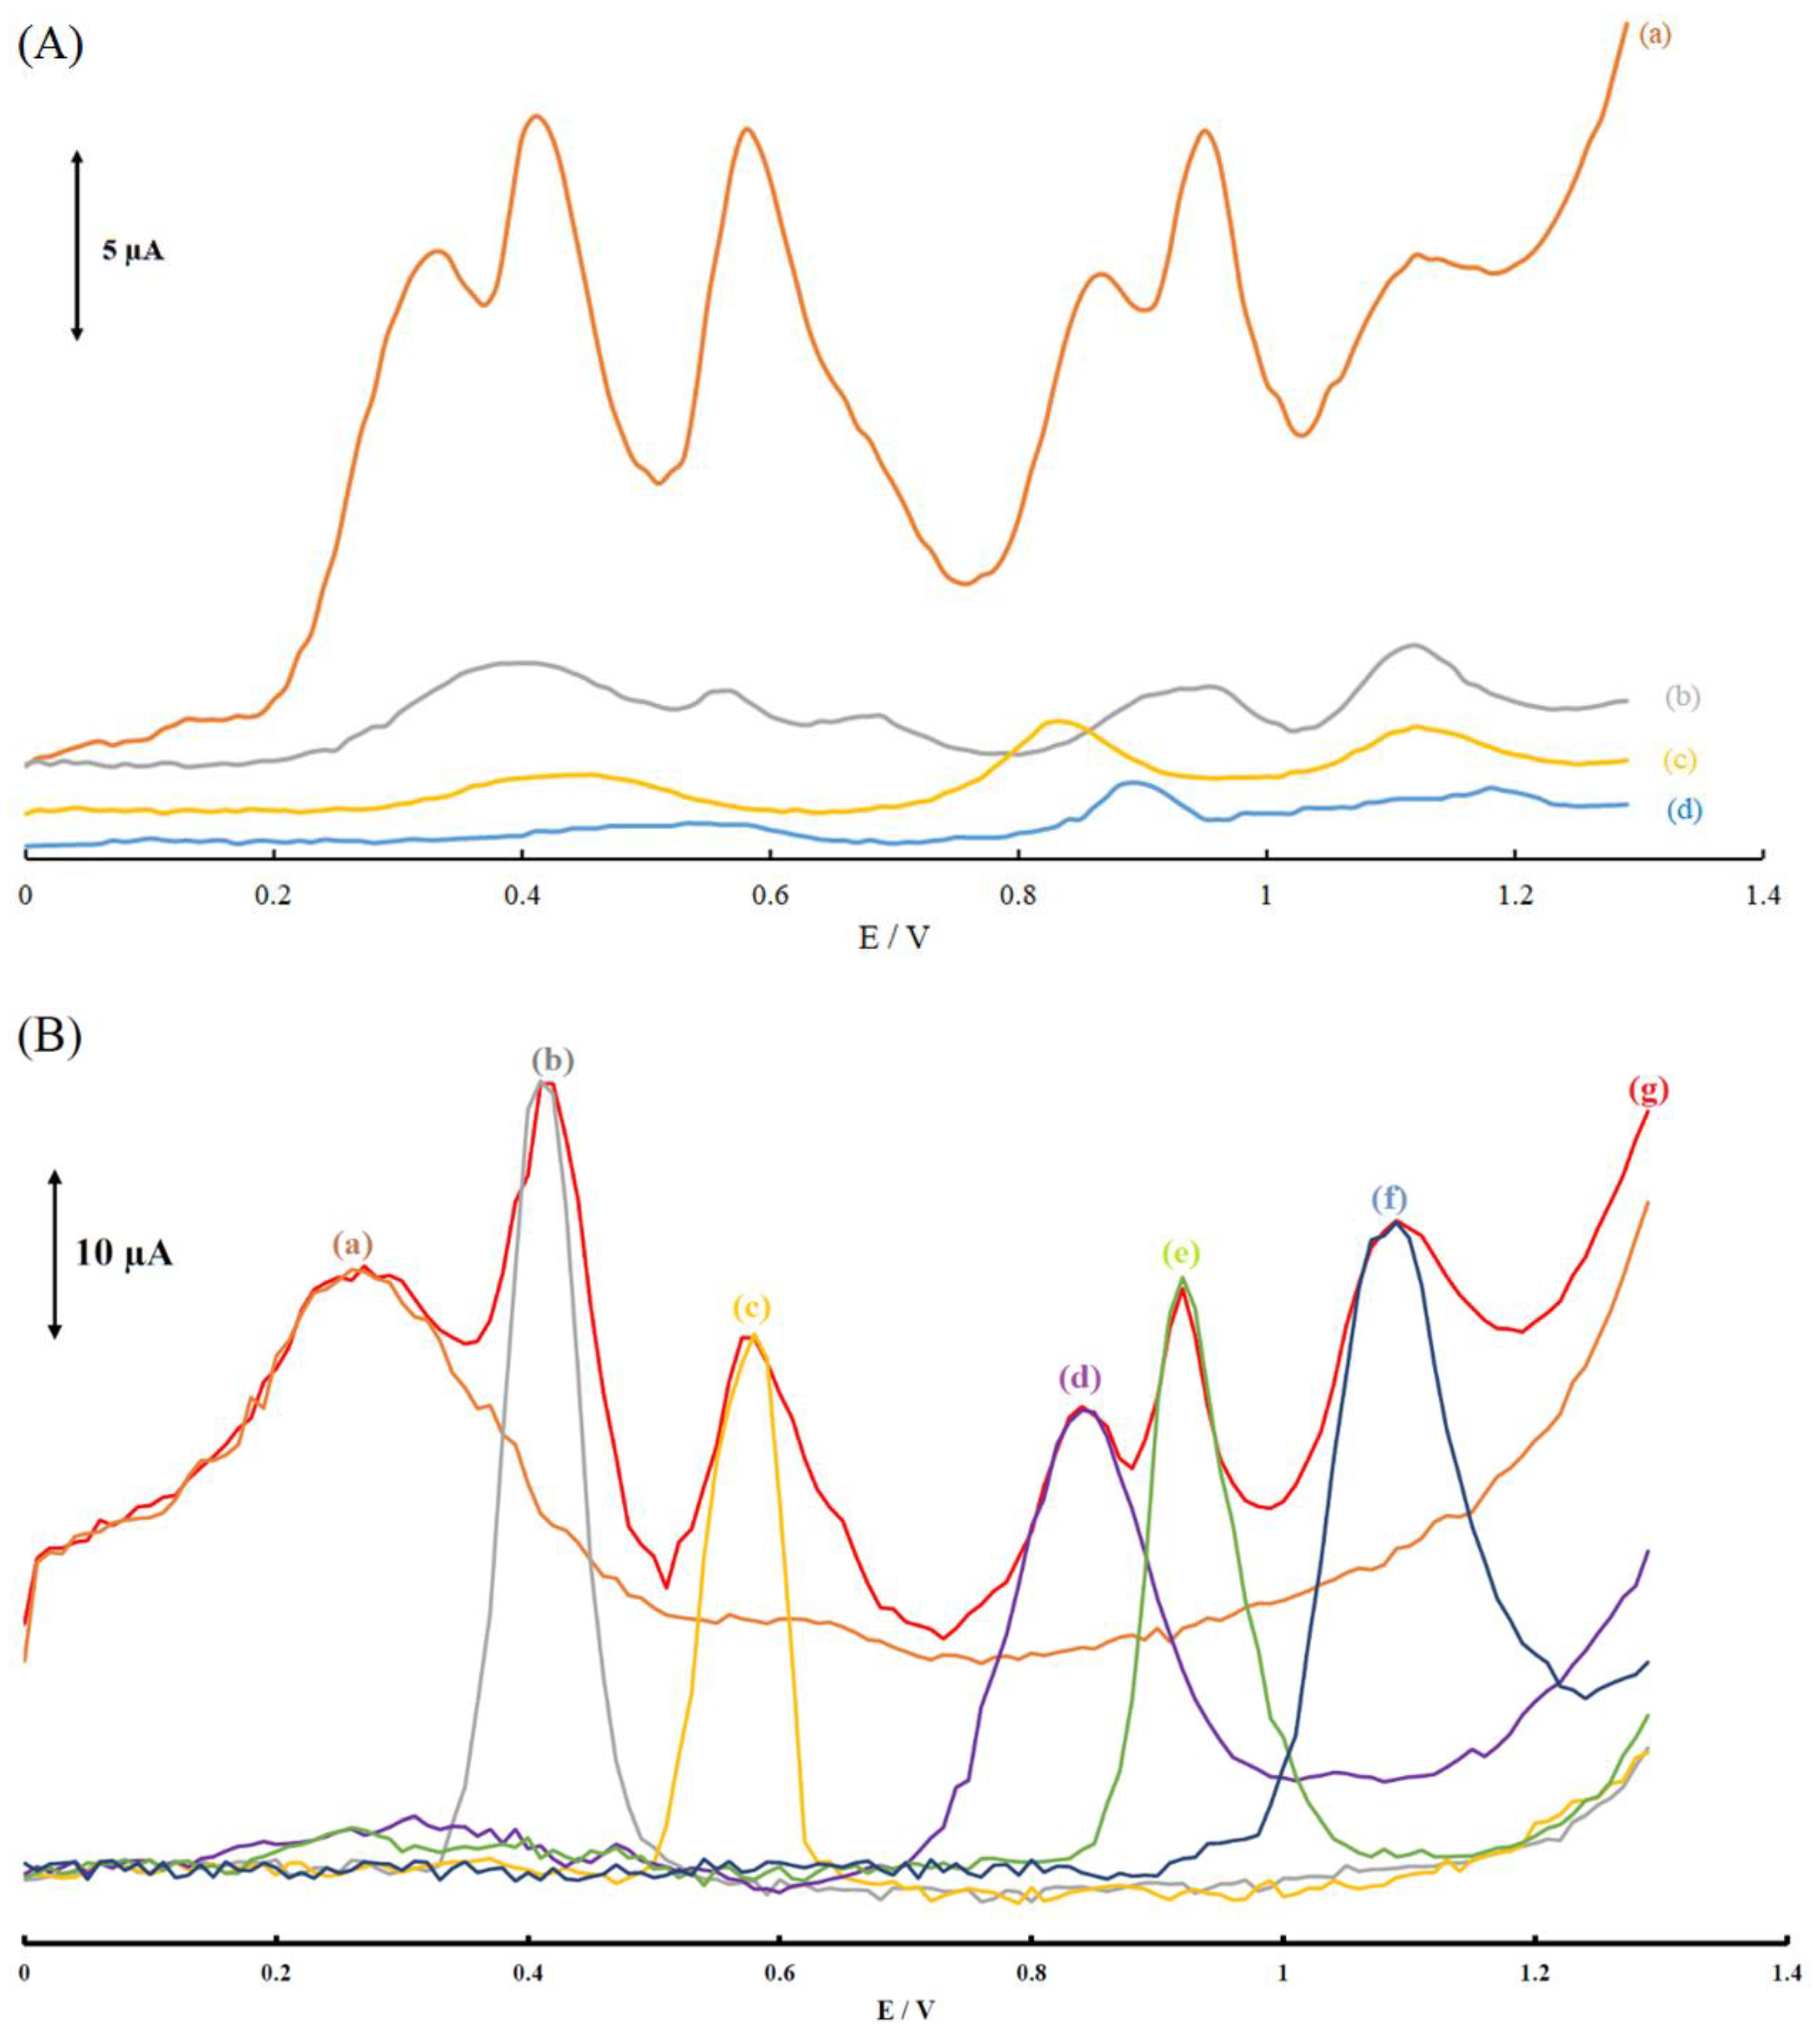
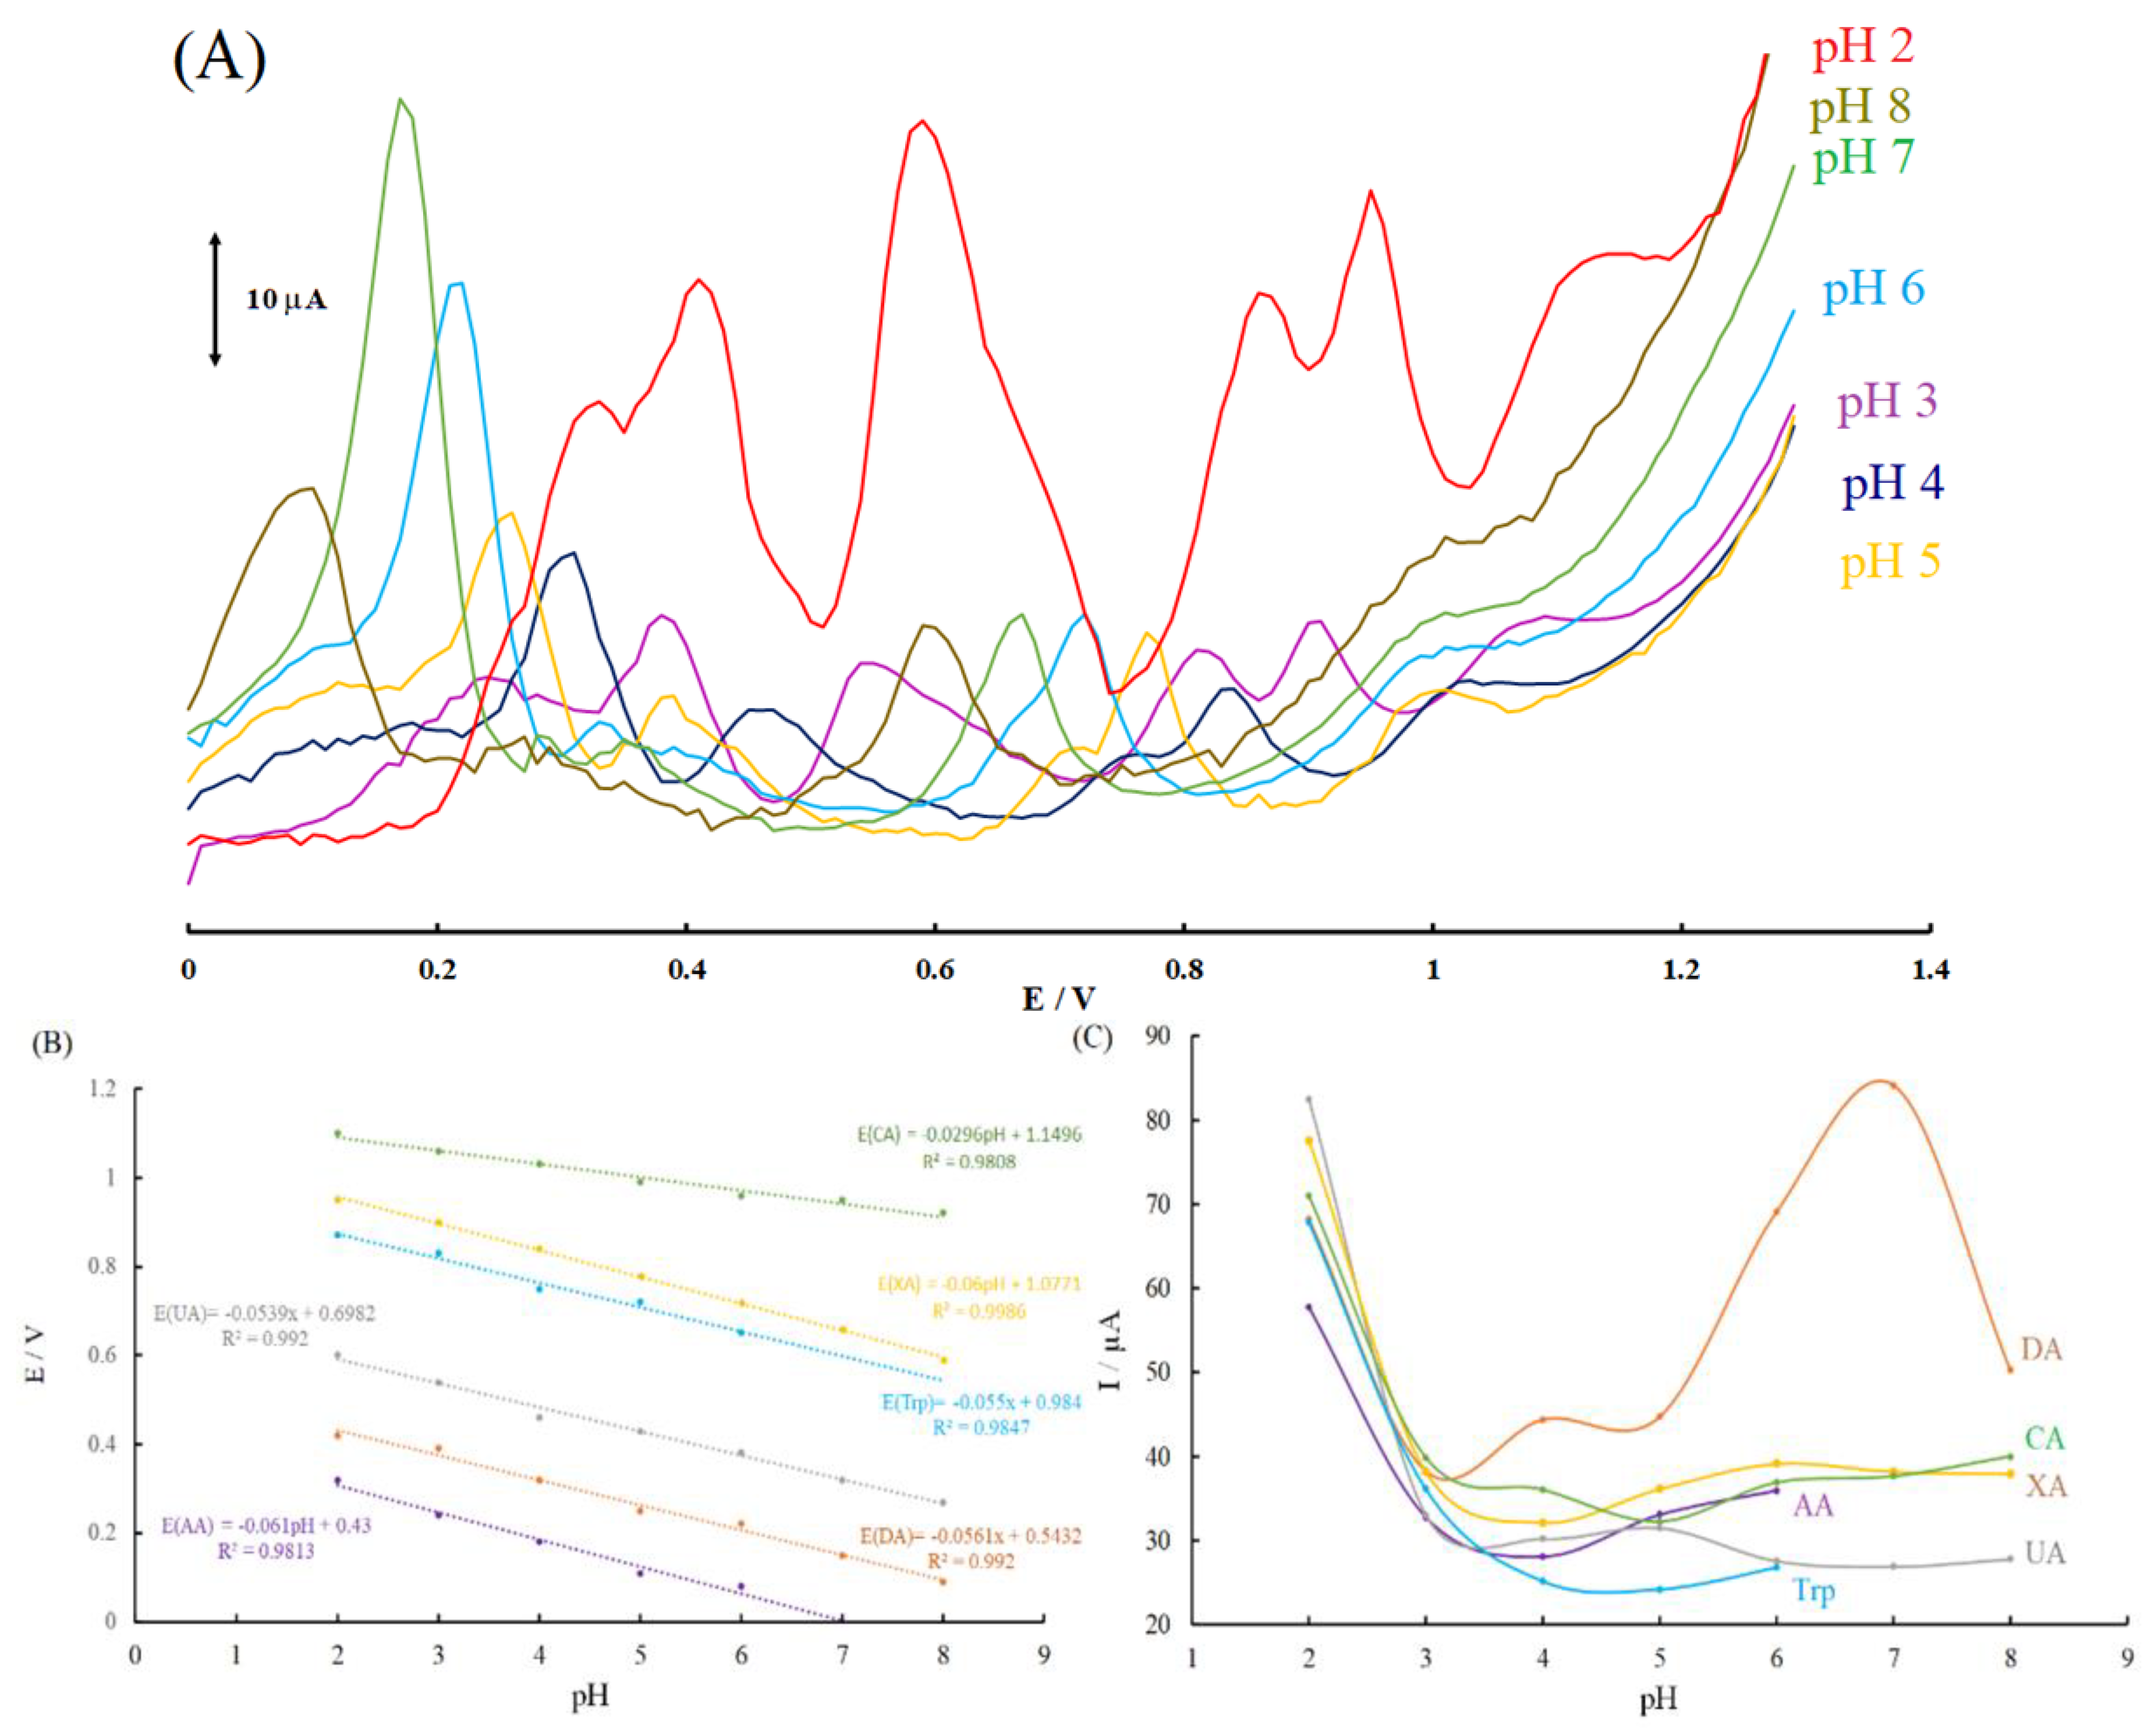
Based on literature, the acidity of the electrolyte had a significant influence on the electro-oxidation of biomolecules, such as the biomolecules under investigation. This is because protons take part in the electrode reaction of biomolecules. Thus, the effect of pH on the nanocomposite-modified electrode, modified graphite paste electrode, and signal must be carefully investigated at pH levels ranging from 2.0–8.0. The results are shown in Figure 4A.
The effect of pH on the peak potentials of the biomolecules under investigation is shown in Figure 4B. Based on this figure, the peak potential for all of the biomolecules decreased linearly with increase in pH in the electrolyte solution from 2.0–8.0. This result indicated the proton transfer in the electrode processes and agreed with previously reported results for the oxidation of several biomolecules in modified electrodes [17,38,39,40]. Generally, the anodic peak potentials were moved to lower potentials for analytes such as AA, DA, UA, Trp, XN, and CA, which agree with the theoretical slope of 0.059 V/pH (where m and n are the numbers of protons and electrons, respectively; the other parameters have the usual meaning). According to these results, the slopes for the oxidation process of AA, DA, UA, Trp, and XN are as 0.061, 0.0561, 0.0539, 0.0539, and 0.06 V/pH, respectively. These results show that a redox reaction for AA, DA, UA, Trp, and XN contain an equal number of protons and electrons (m = n). Therefore, the following electrooxidation reaction can be suggested for them, as shown in Equations (2)–(6).


Unlike the mentioned analytes, the CA is an exception, because the anodic peak potential of CA did not significantly shift with increasing pH and the slope amount, 0.0296 V/pH, is lower and approximately half of the theoretical Nernstian value than AA, DA, UA, Trp, and XN. This amount can be assigned a redox process involving m = 1 and n = 2. The same result was reported in literature [50,51,52] with a similar amount, but as mentioned before, the CA is an exception among biomolecules due to its redox reaction. In addition, Wang et al. [53] recently reported that there was no change in the Ep of CA with increasing pH conditions, which revealed that no proton was involved in the oxidation reaction of CA. Based on the evidence above and previous studies [50,51,52,53], we hypothesized that an equal number of protons and electrons were involved in the oxidation of CA. According to equation 7, the oxidation of CA corresponded to an overall 4H+ and 4e− oxidation, following a two-step mechanism. The first mechanism was the slow 2H+ and 2e− oxidation of the C-8–N-9 bonds of caffeine, resulting in 8-oxy-caffeine; followed by the fast 2e− and 2H+ oxidation to 4,5-dihydroxy-8-oxy-caffeine [53]. Therefore, the fact that CA oxidation involved two electrons and two protons at MGPE/EA could be due to the first step of this mechanism being a rate determining step.

It was observed in Figure 4C that Ip for biomolecules under investigation decreased from pH 2 to 3 and was stable in pH 3–8 for AA, UA, Trp, XN, and CA. For DA, the peak current was stable in pH 3–5 and then increased with increasing pH from 5 to 7 and then decreased until pH 8.0. Considering all of the results thus far, it is clear that for simultaneous determination of the biomolecules under investigation in the modified graphite paste electrode, the acidic media at pH 2.0 was the most suitable one for senary detection purposes. At low pH, there were two main advantages: well-defined high peak currents and clear peak separations.
3.5. Interference Studies
One of the important problems in simultaneous determination is the interference caused by redox-active molecules, which can be oxidized under the same conditions, in biological samples. Among all biomolecules, significant interference was observed between the biomolecules under investigation, as their oxidation peak potentials are near each other and they mainly coexist in real biological samples. Therefore, to study these interfering biomolecules and their effects, the spiking technique was used on the simultaneous quantification of these biomolecules. In all control assays, the concentration of only one species was changed, while the concentrations of the other species were kept constant. The results are shown in Figure S2a–f.
Figure S2a shows that the peak current of AA increased by increasing AA concentration when the concentrations of DA, UA, Trp, XN, and CA were kept constant. Although the charge current was enhanced after AA was oxidized, the peak currents of DA, UA, Trp, XN, and CA did not change (± 5%). Similarly, as shown in Figure S2b–e, when keeping the concentrations of the other five compounds constant, the oxidation peak currents of DP or UA or Trp or XN or CA were almost linearly proportional to the five spiked concentrations, while those of the other five compounds did not change. These results indicated that the sensor was selective for the simultaneous determination of biomolecules under investigation in the presence of other biomolecules that co-exist in the real biological samples.
3.6. Calibration Curves
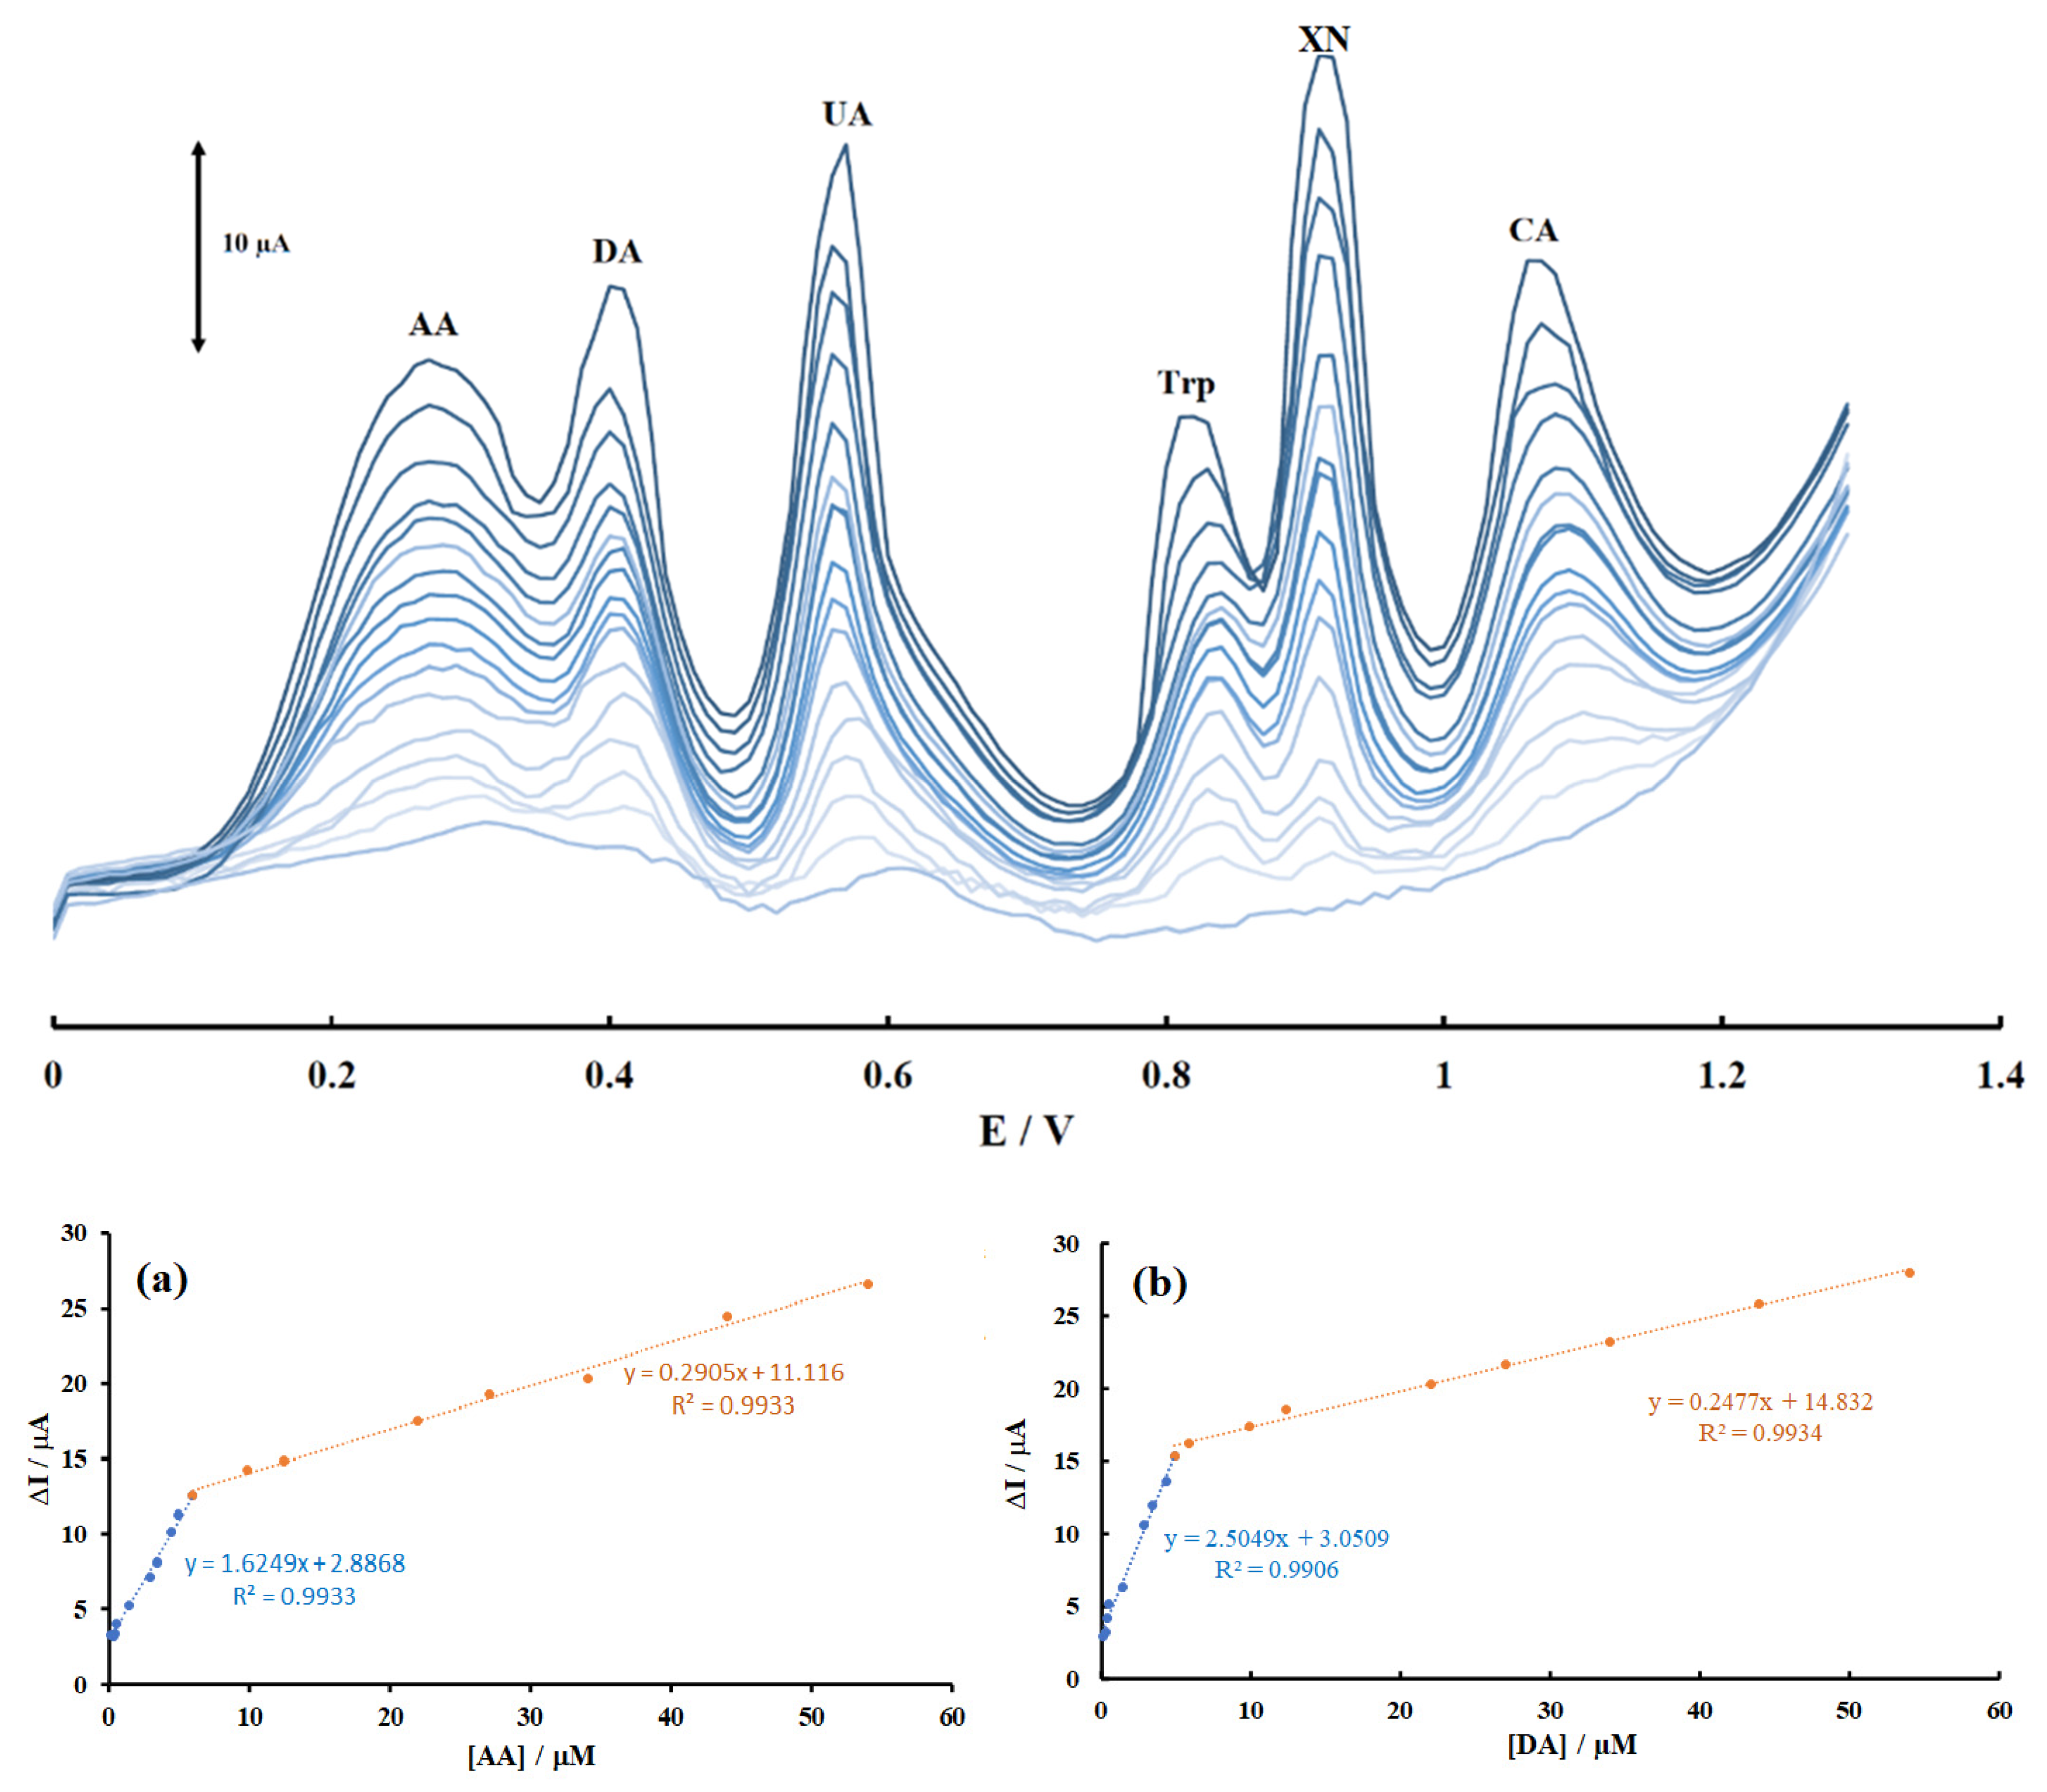
DPV was performed to investigate the relationship between the peak current and concentration of AA, DA, UA, Trp, XN, and CA. The dependence of peak currents on the concentrations of biomolecules under investigation is shown in Figure 5. The results for linear ranges and detection limits of the analytes are summarized in Table S1. Based on Table S1, the calibration curves were linear in two segmented ranges of substrate concentration. LOD values were assessed using the equation YLOD = XB + 3SB, where YLOD is the signal for the detection limit; XB represents the blank signal, and SB represents the standard deviation of the blank signal. The theoretical LODs of the sensor for AA, DA, UA, Trp, XN, and CA were 91, 9.9, 13, 11, 14, and 78 nM, respectively. Based on Figure 5a–f, the calibration curves for AA, DA, UA, Trp, XN, and CA clearly had two linear segments with different slopes, corresponding to two different ranges of substrate concentrations. The difference in the slopes of the calibration curves was due to the different activity of the electrode surface with low and high concentrations of the analytes. In the low concentrations of the analytes, due to a high number of active sites on the surface of electrode, the slope of the first calibration curve was high. While in the higher concentration range of the biomolecules, due to decreasing active sites on the surface of electrode, the slope of the second segment of calibration curve decreased, too. The decreasing of sensitivity (slope) in the second linear range can be attributed to possible kinetic limitations.
A comparison study of the MGPE/MWCNTs-EA with other modified electrodes reported in literature for the simultaneous determination of biomolecules under investigation is shown in Table 1. Based on Table 1, the modified graphite paste electrode seems to provide a favorable alternative for the simultaneous determination of biomolecules under investigation with better or satisfactory results than those described in the literature [49,54,55,56,57,58,59].
The analytical performance of our modified graphite paste electrode was also compared with reported standard method (high performance liquid chromatography); the results are shown in Table 2. Based on the results in Table 2, we conclude that there was good agreement between the results obtained with our electrochemical method and the standard one.
3.7. Stability and Reproducibility
The stability and reproducibility of the modified graphite paste electrode were investigated for ten successive determinations (n = 10). Differential pulse voltammograms of a mixture of AA (1.9 μM), DA (22 μM), UA, Trp and XN (14.9 μM), and CA (22 μM) in 0.1 M PBS (pH 2.0) in the modified graphite paste electrode are shown in Figure S3. The relative standard deviation of results was calculated as 0.07%, 0.06%, 0.08%, 0.16%, 0.06%, and 0.61% for AA, DA, UA, Trp, XN, and CA, respectively. Thus, the electrochemical signals of biomolecules on the MGPE/MWCNTs-EA had excellent stability and reproducibility. The long-term stability of MGPE/MWCNTs-EA was also tested by recording DPVs of the modified graphite paste electrode in a period of 30 days for simultaneous determination of AA, DA, UA, Trp, XN, and CA. Based on the results period, the MGPE/MWCNTs-EA was used extensively and its response was recorded twice a week for the same concentrations of biomolecules under investigation. The ΔIpa values AA, DA, UA, Trp, XN, and CA were retained at 94.3%, 96.6%, 97.2%, 94.6%, 95.1%, and 94.7%, respectively. These results can be attributed to excellent repeatability and stability of the modified graphite paste electrode response for simultaneous determination of these biomolecules.
3.8. Chronoamperometric Studies
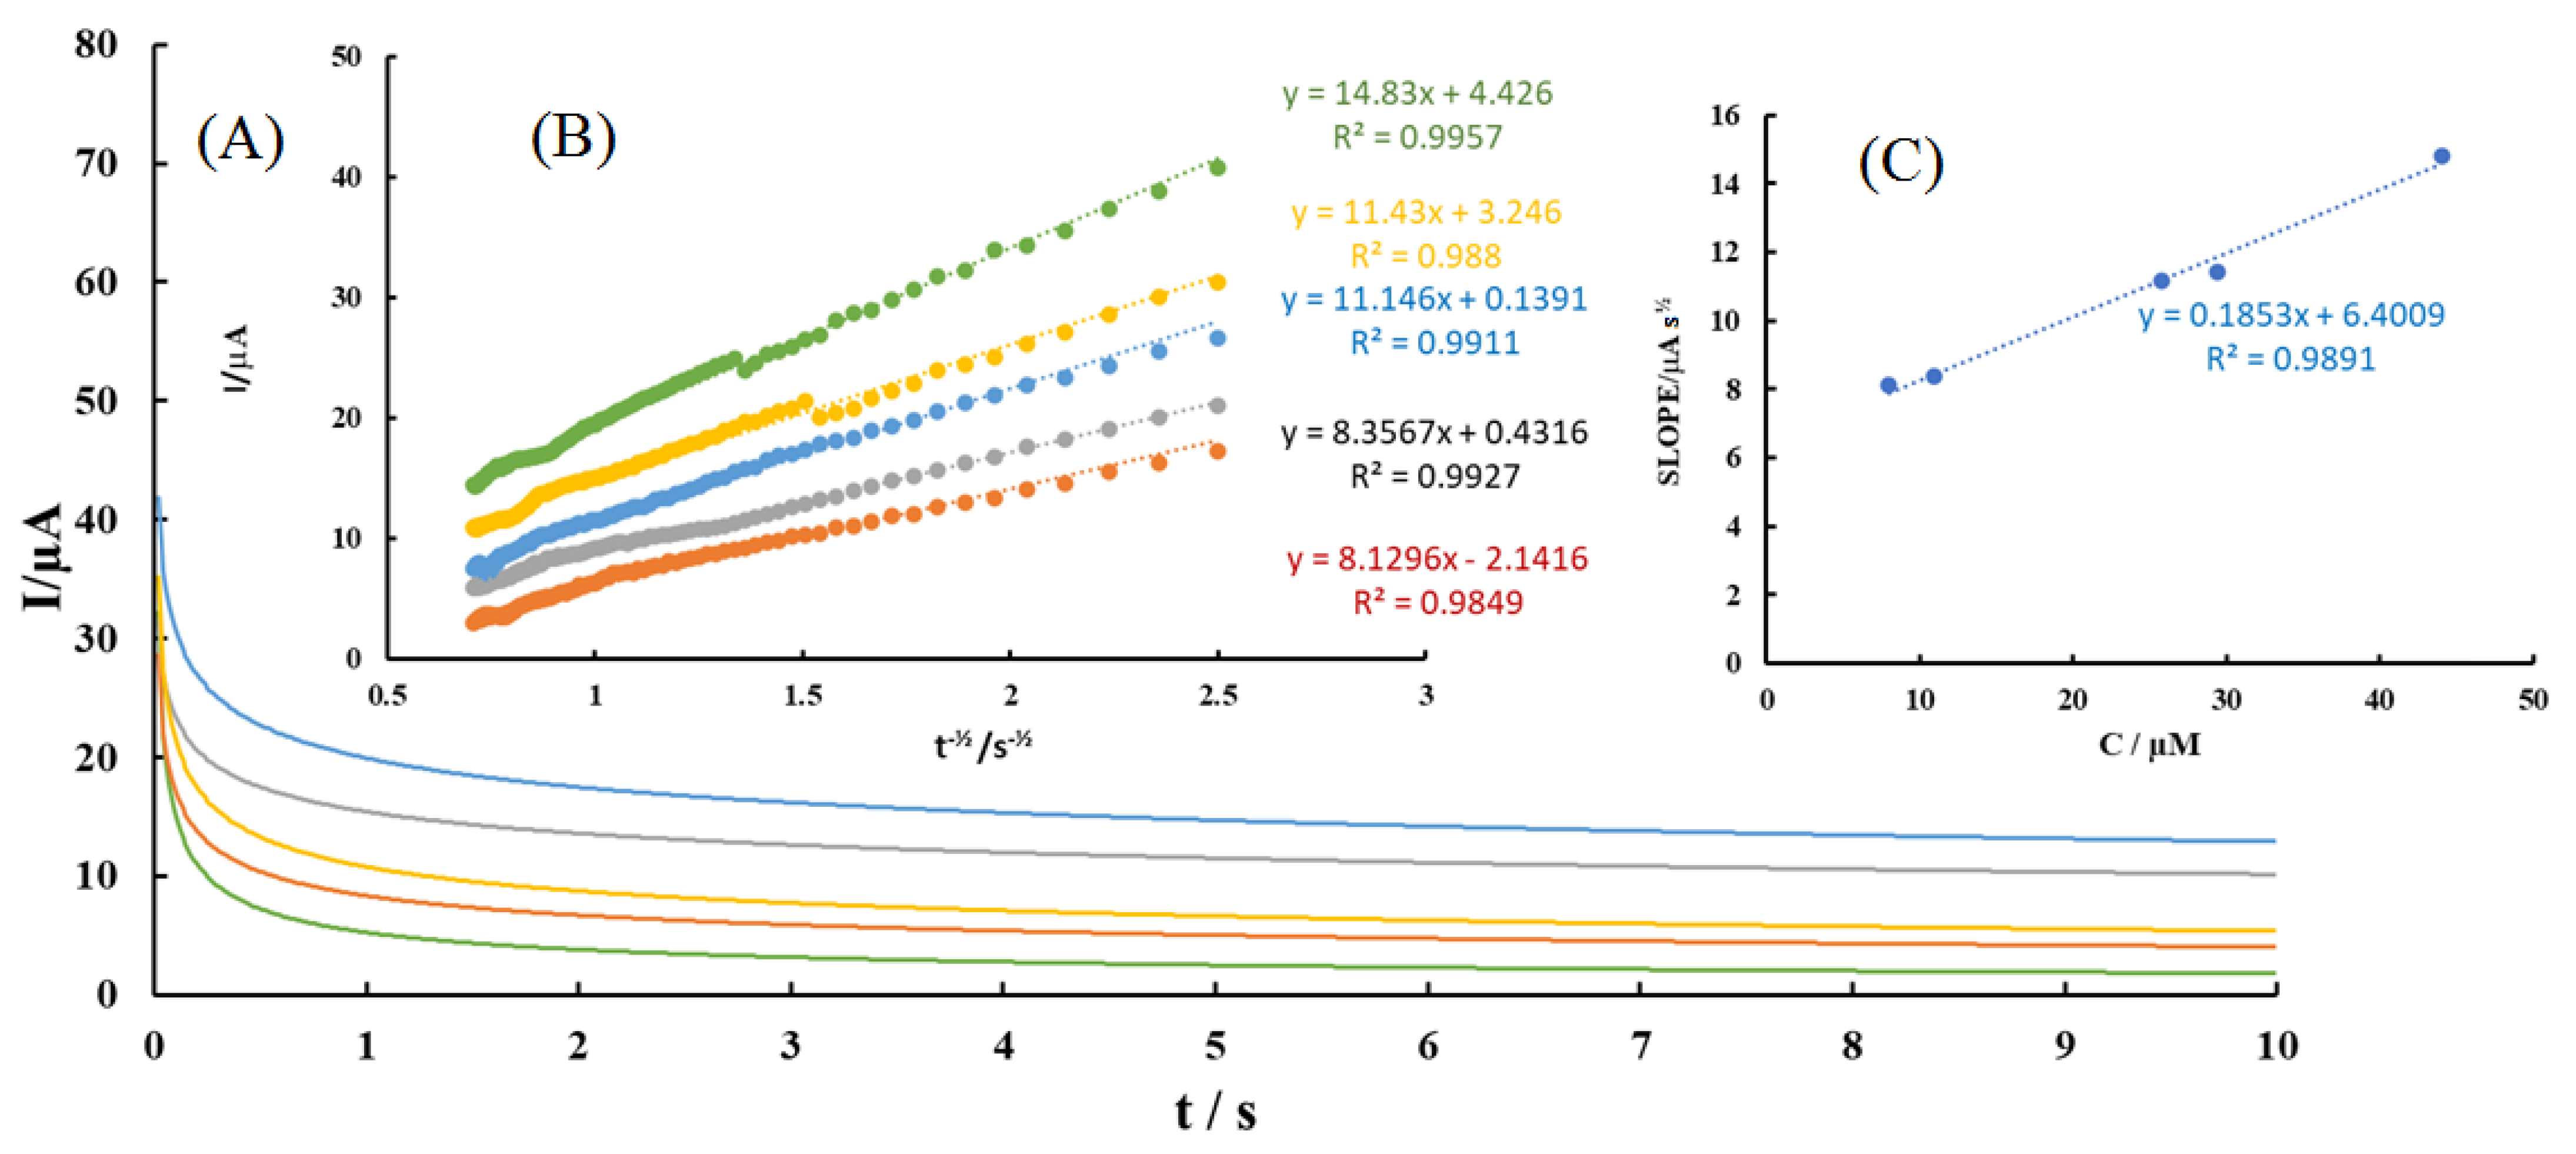
Chronoamperometry was employed to investigate the electrochemical behavior of various concentrations of AA, DA, UA, Trp, XN, and CA in the modified graphite paste electrode by setting the working electrode potential at 0.4, 0.47, 0.62, 0.92, 1, and 1.18 V vs. Ag/AgCl in 0.1 M PBS (pH 2.0). A typical chronoamperogram for AA is shown in Figure 6. The chronoamperograms for DA, UA, Trp, XN, and CA were shown in Figures S4–S8, respectively). The D for an electroactive compound can be calculated using the Cottrell equation (I = nFAD1/2Cbπ−1/2 t−1/2). For example, under diffusion control, a plot of I vs. t−1/2 for AA was linear (see Figure S5B), and the slope (nFAD1/2Cbπ−1/2) of the linear region of the Cottrell’s plot can be used to calculate the D for AA, DA, UA, Trp, XN, and CA. The values of DAA, DDA, DUA, DTrp, DXN, and DCA were found to be 3.07 × 10⁻⁵, 2.96 × 10⁻⁵, 4.82 × 10⁻⁵, 4.04 × 10⁻⁵, 1.51 × 10⁻⁵, and 6.24 × 10⁻⁵ cm2 s−1, respectively.
3.9. Real Sample Analysis
To evaluate the practical applicability of our electrochemical approach, the modified graphite paste electrode was utilized for the simultaneous determination of AA, DA, UA, Trp, XN, and CA in human serum and blood plasma. The samples were diluted with 0.1 M PBS (pH 2.0) and DPVs were recorded using the standard addition method; the results were confirmed with the literature results obtained using the HPLC standard method [59,60,61,62,63]. As depicted in Table 2, acceptable recovery values were obtained, which indicated the applicability of MGPE/MWCNTs-EA as a promising tool for individual and simultaneous trace amount determination of AA, DA, UA, Trp, and XN in real samples.
4. Conclusions
The proof-of-concept study demonstrates a simple and affordable MGPE/MWCNTs-EA system for sensitive and selective simultaneous determination of AA, DA, UA, Trp, XN, and CA. The modified graphite paste electrode not only improved electrochemical catalytic activities toward the oxidation of the biomolecules under investigation, but also decreased the overpotentials of the AA, DA, UA, Trp, XN, and CA. The nanocomposite-modified electrode was compared to the previously reported modified electrodes for the simultaneous determination of similar biomolecules and the results indicated that the nanocomposite-modified electrode provided a promising platform for the simultaneous determination of biomolecules under investigation with highly sensitive results in real samples.
Supplementary Materials
The following figures and tables are available online at https://0-www-mdpi-com.brum.beds.ac.uk/article/10.3390/c7020043/s1. Table S1. Analytical parameters for the simultaneous determination of AA, DA, UA, Trp, XN, and CA using MGPE/MWCNTs-EA. Figure S1. (A) Electrochemical studies of different electrodes in pH 2.0 PBS (1) GPE, (2) MGPE/MWCNTs, (3) MGPE/EA, and (4) MGPE/MWCNTs-EA. (B) MGPE/MWCNTs-EA, (C) MGPE/MWCNTs, (D) MGPE/EA, and (E) GPE in 1 mM [Fe(CN)6]3− prepared in 0.1 M KCl with different scan rate (F) the plot of peak current vs. the square root of scan rate for MGPE/MWCNTs-EA, MGPE/MWCNTs, MGPE/EA, and GPE. Figure S2. Differential pulse voltammograms at MGPE/MWCNTs-EA in 0.1 M PBS (pH 2.0) (A) containing DA (14.9 μM), UA (9.9 μM), TrP, XN, and CA (4.9 μM) and different concentrations of AA (from inner to outer): (2.5, 7.4, 9.9, 12.4, 17.4 and 22.0 μM); (B) containing AA (2.5 μM), UA, Trp, XN and CA (4.9 μM each) and different concentrations of DA (from inner to outer): (7.4, 9.9, 17.4, 22.0, 27.0 and 34 μM); (C) containing AA (2.5 μM), DA (14.9 μM), Trp, XN, CA (4.9 μM each) and different concentrations of UA (from inner to outer): (4.9, 9.9, 17.4, 24.9, 29.9 and 34.0 μM); (D) containing AA (2.5 μM), DA (14.9 μM), UA, CA (4.9 μM each) XN (9.9 μM) and different concentrations of Trp (from inner to outer): (2.5, 4.9, 7.4, 9.9, 12.4, 17.4, 22.0 and 27.0 μM); (E) containing AA (2.5 μM), DA (14.9 μM), UA, CA (4.9 μM each), Trp (9.9 μM), and different concentrations of XN (from inner to outer): (7.4, 9.9, 12.4, 17.4, 20.5, 22.0 and 27.0 μM); and (F) containing AA (2.5 μM), DA, Trp (9.9 μM) UA, XN (4.9 μM each) and different concentrations of CA (from inner to outer): (7.4, 9.9, 12.4, 14.9, 17.4 and 22.0 μM). Figure S3. The stability of repetitive measurements of DPV using MGPE/MWCNTs-EA in 0.1 M PBS (pH 2.0) containing 14.9 μM AA, 22.0 μM DA, 14.9 μM UA, 14.9 μM Trp, 14.9 μM XN, and 22.0 μM CA with the plot of ΔI vs. number of consecutive measurements. Figure S4. (A) Typical chronoamperograms obtained at MGPE/MWCNTs-EA in 0.1 M PBS (pH 2.0) for different concentrations of DA at 14.4 µM (orange), 25.6 µM (green), 35.0 µM (gray), 39.0 µM (yellow), and 54.0 µM (blue); (B) Plots of I vs. t−1/2 obtained from chronoamperograms; (C) Plot of the slope of the linear dynamic range against DA concentration. Figure S5. (A) Typical chronoamperograms obtained at MGPE/MWCNTs-EA in 0.1 M PBS (pH 2.0) for different concentrations of UA at 8.4 µM (orange), 22.2 µM (blue), 33.4 µM (yellow), 39.2 µM (green), and 50.45 µM (gray); (B) Plots of I vs. t−1/2 obtained from chronoamperograms; (C) Plot of the slope of the linear dynamic range against UA concentration. Figure S6. (A) Typical chronoamperograms obtained at MGPE/MWCNTs-EA in 0.1 M PBS (pH 2.0) for different concentrations of Trp at 11.9 µM (orange), 18.4 µM (green), 24.0 µM (red), 28.7 µM (gray) and 43.9 µM (blue); (B) Plots of I vs. t−1/2 obtained from chronoamperograms; (C) Plot of the slope of the linear dynamic range against Trp concentration. Figure S7. (A) Typical chronoamperograms obtained at MGPE/MWCNTs-EA in 0.1 M PBS (pH 2.0) for different concentrations of CA at 15.9 µM (green), 23.6 µM (orange), 35.6 µM (gray), 45.8 µM (yellow) and 54.9 µM (blue); (B) Plots of I vs. t−1/2 obtained from chronoamperograms; (C) Plot of the slope of the linear dynamic range against CA concentration. Figure S8. (A) Typical chronoamperograms obtained at MGPE/MWCNTs-EA in 0.1 M PBS (pH 2.0) for different concentrations of XN at 5.9 µM (orange), 16.9 µM (yellow), 20.4 µM (blue), 24.8 µM (green) and 39.7 µM (gray); (B) Plots of I vs. t−1/2 obtained from chronoamperograms; (C) Plot of the slope of the linear dynamic range against XN concentration.
Author Contributions
Conceptualization, N.S., M.N., and K.K.; methodology, N.S. and M.N.; software, N.S. and M.N.; validation, N.S. and M.N.; formal analysis, N.S. and M.N.; investigation, N.S. and M.N.; resources, K.K.; data curation, N.S. and M.N.; writing—Original draft preparation, N.S. and M.N.; writing—Review and editing, N.S., M.N., and K.K.; supervision, M.N. and K.K.; project administration, K.K.; funding acquisition, K.K. All authors have read and agreed to the published version of the manuscript.
Funding
This research was funded by the Canada Research Chair Tier-2 award (Project No. 950-231116), the Ontario Ministry of Research, Innovation and Science (Project No. 35272), Discovery Grant (Project No. 3655) from the Natural Sciences and Engineering Research Council of Canada (NSERC), and the Canada Foundation for Innovation (Project No. 35272).
Institutional Review Board Statement
Not applicable.
Informed Consent Statement
Not applicable.
Data Availability Statement
The data presented in this study are available on request from the corresponding author. The data are not publicly available due to pending patent applications.
Acknowledgments
We thank Tony Adamo and TRACES Center (University of Toronto Scarborough) for the analytical instrumentation support. We would also like to thank Robert Temkin and Centre for the Neurobiology of Stress (University of Toronto Scarborough) for technical support in our TEM studies.
Conflicts of Interest
The authors declare no conflict of interest.
References
- Li, S.; Zhou, J.; Noroozifar, M.; Kerman, K. Gold-platinum core-shell nanoparticles with thiolated polyaniline and multi-walled carbon nanotubes for the simultaneous voltammetric determination of six drug molecules. Chemosensors 2021, 9, 24. [Google Scholar] [CrossRef]
- Spataru, N.; Sarada, B.V.; Tryk, D.A.; Fujishima, A. Anodic voltammetry of xanthine, theophylline, theobromine and caffeine at conductive diamond electrodes and its analytical application. Electroanalysis 2002, 14, 721–728. [Google Scholar] [CrossRef]
- Kan, X.; Liu, T.; Li, C.; Zhou, H.; Xing, Z.; Zhu, A. A novel electrochemical sensor based on molecularly imprinted polymers for caffeine recognition and detection. J. Solid State Electrochem. 2002, 16, 3207–3213. [Google Scholar] [CrossRef]
- Okonny, U.L.P.; Wang, S.X.; Stubbs, R.J.; Guzman, N.A. Determination of caffeine and its metabolites in urine by capillary electrophoresis–mass spectrometry. Electrophoresis 2005, 26, 2652–2663. [Google Scholar] [CrossRef] [PubMed]
- Mandel, H.G. Update on caffeine consumption, disposition and action. Food Chem. Toxicol. 2002, 40, 1231–1234. [Google Scholar] [CrossRef]
- Mazer, M.; Perrone, J. Acetaminophen-induced nephrotoxicity: Pathophysiology, clinical manifestations, and management. J. Med. Toxicol. 2008, 4, 2–6. [Google Scholar] [CrossRef] [PubMed] [Green Version]
- Nurminen, M.L.; Niittynen, L.; Korpela, R.; Vapaatalo, H. Coffee, caffeine and blood pressure: A critical review. Eur. J. Clin. Nutr. 1999, 53, 831–839. [Google Scholar] [CrossRef] [PubMed] [Green Version]
- Kerrigan, S.; Lindsey, T. Fatal caffeine overdose: Two case reports. Forensic Sci. Int. 2005, 153, 67–69. [Google Scholar] [CrossRef]
- Cheemalapati, S.; Palanisamy, S.; Mani, V.; Chen, S.M. Simultaneous electrochemical determination of dopamine and paracetamol on multiwalled carbon nanotubes/graphene oxide nanocomposite-modified glassy carbon electrode. Talanta 2003, 117, 297–304. [Google Scholar] [CrossRef]
- Turak, F.; Guzel, R.; Dinc, E. Simultaneous determination of ascorbic acid and caffeine in commercial soft drinks using reversed-phase ultraperformance liquid chromatography. J. Food Drug Anal. 2017, 25, 285–292. [Google Scholar] [CrossRef] [PubMed] [Green Version]
- Czauderna, M.; Kowalczyk, J. Quantification of allantoin, uric acid, xanthine and hypoxanthine in ovine urine by high-performance liquid chromatography and photodiode array detection. J. Chromatogr. B Biomed. Sci. Appl. 2000, 744, 129–138. [Google Scholar] [CrossRef]
- Alves, A.C.; Meinhart, A.D.; Teixeira Filho, J.; Godoy, H.T. Development of a method for simultaneous analysis of caffeine and taurine in energy drinks by micellar electrokinetic chromatography with diode-array detector. Food Sci. Technol. 2019, 39, 673–682. [Google Scholar] [CrossRef] [Green Version]
- Khoshayand, M.R.; Abdollahi, H.; Shariatpanahi, M. Simultaneous spectrophotometric determination of paracetamol, ibuprofen and caffeine in pharmaceuticals by chemometric methods. Spectrochim. Acta Part A 2008, 70, 491–499. [Google Scholar] [CrossRef]
- Wang, H.Y.; Sun, Y.; Tang, B. Study on fluorescence property of dopamine and determination of dopamine by fluorimetry. Talanta 2002, 57, 899–907. [Google Scholar] [CrossRef]
- Zou, J.; Zhang, H.; Ding, M.; Shang, Z. Large phase ratio spontaneous extraction followed by GC-MS for the determination of caffeine in beverages. Chromatographia 2010, 71, 323–326. [Google Scholar] [CrossRef]
- Ni, Y.; Liu, C.; Kokot, S. Simultaneous kinetic spectrophotometric determination of acetaminophen and phenobarbital by artificial neural networks and partial least squares. Anal. Chim. Acta 2000, 419, 185–196. [Google Scholar] [CrossRef]
- Shahbakhsh, M.; Noroozifar, M. Copper polydopamine complex/multiwalled carbon nanotubes as novel modifier for simultaneous electrochemical determination of ascorbic acid, dopamine, acetaminophen, nitrite and xanthine. J. Solid State Electrochem. 2018, 22, 3049–3057. [Google Scholar] [CrossRef]
- Amiri-Aref, M.; Raoof, J.B.; Ojani, R. A highly sensitive electrochemical sensor for simultaneous voltammetric determination of noradrenaline, acetaminophen, xanthine and caffeine based on a flavonoid nanostructured modified glassy carbon electrode. Sens. Actuat. B 2014, 192, 634–641. [Google Scholar] [CrossRef]
- Primo, E.N.; Gutierrez, F.A.; Luque, G.L. Comparative study of the electrochemical behavior and analytical applications of (bio)sensing platforms based on the use of multi-walled carbon nanotubes dispersed in different polymers. Anal. Chim. Acta 2013, 805, 19–35. [Google Scholar] [CrossRef]
- Hossieny, I.; Temerk, Y. Sensitive electrochemical sensor for simultaneous determination of uric acid and xanthine in human biological fluids based on the nano-boron doped ceria modified glassy carbon paste electrode. J. Electroanal. Chem. 2016, 780, 176–186. [Google Scholar]
- Levine, M. New concepts in the biology and biochemistry of ascorbic acid. N. Engl. J. Med. 1986, 314, 892–902. [Google Scholar] [CrossRef] [PubMed]
- Wu, G.-H.; Wu, Y.-F.; Liu, X.-W.; Rong, M.-C.; Chen, X.-M.; Chen, X. An electrochemical ascorbic acid sensor based on palladium nanoparticles supported on graphene oxide. Anal. Chim. Acta 2012, 745, 33–37. [Google Scholar] [CrossRef] [PubMed]
- Gupta, V.K.; Jain, A.K.; Shoora, S.K. Multiwall carbon nanotube modified glassy carbon electrode as voltammetric sensor for the simultaneous determination of ascorbic acid and caffeine. Electrochim. Acta 2013, 93, 248–253. [Google Scholar] [CrossRef]
- Wang, G.; Chen, Z.; Chen, L. Mesoporous silica-coated gold nanorods: Towards sensitive colorimetric sensing of ascorbic acid via target-induced silver overcoating. Nanoscale 2011, 3, 1756–1759. [Google Scholar] [CrossRef]
- Hallberg, L. Bioavailability of dietary iron in man. Annu. Rev. Nutr. 1981, 1, 123–147. [Google Scholar] [CrossRef] [PubMed]
- Johnston, C.S. Biomarkers for establishing a tolerable upper intake level for vitamin C. Nutr. Rev. 1999, 57, 71–77. [Google Scholar] [CrossRef]
- Matei, N.; Birghila, S.; Popescu, V.; Dobrinas, S.; Soceanu, A.; Oprea, C.; Magearu, V. Kinetic study of vitamin C degradation from pharmaceutical products. Rom. J. Phys. 2008, 53, 343–351. [Google Scholar]
- Zhang, M.; Liao, C.; Yao, Y.; Liu, Z.; Gong, F.; Yan, F. High-Performance Dopamine Sensors Based on Whole-Graphene Solution-Gated Transistor. Adv. Funct. Mater. 2014, 24, 978–985. [Google Scholar] [CrossRef]
- Zhang, X.; Gu, S.; Ding, Y. Simultaneous detection of roxithromycin and dopamine using a sensor platform based on poly (sulfosalicylic acid) and its application in human serum studies. Anal. Methods 2014, 6, 3316–3321. [Google Scholar] [CrossRef]
- Han, H.S.; Lee, H.K.; You, J.M.; Jeong, H.; Jeon, S. Electrochemical biosensor for simultaneous determination of dopamine and serotonin based on electrochemically reduced GO-porphyrin. Sens. Actuat. B 2014, 190, 886–895. [Google Scholar] [CrossRef]
- Lario, B.Á.; Vicente, J.M. Uric acid and evolution. Rheumatology 2010, 49, 2010–2015. [Google Scholar] [CrossRef] [Green Version]
- Ensafi, A.A.; Taei, M.; Khayamian, T. A differential pulse voltammetric method for simultaneous determination of ascorbic acid, dopamine, and uric acid using poly (3-(5-chloro-2-hydroxyphenylazo)-4,5-dihydroxynaphthalene-2,7-disulfonic acid) film modified glassy carbon electrode. J. Electroanal. Chem. 2009, 633, 212–220. [Google Scholar] [CrossRef]
- Lian, W.; Ma, D.J.; Xu, X.; Chen, Y.; Wu, Y.L. Rapid high-performance liquid chromatography method for determination of tryptophan in gastric juice. J. Dig. Dis. 2012, 13, 100–106. [Google Scholar] [CrossRef]
- Yamamoto, T.; Moriwaki, Y.; Takahashi, S. Effect of ethanol on metabolism of purine bases (hypoxanthine, xanthine, and uric acid). Clin. Chim. Acta 2005, 356, 35–57. [Google Scholar] [CrossRef] [PubMed]
- Zheng, X.; Zhou, X.; Ji, X.; Lin, R.; Lin, W. Simultaneous determination of ascorbic acid, dopamine and uric acid using poly(4-aminobutyric acid) modified glassy carbon electrode. Sens. Actuat. B 2013, 178, 359–365. [Google Scholar] [CrossRef]
- Ganesh, H.V.S.; Noroozifar, M.; Kerman, K. Epigallocatechin Gallate-Modified Graphite Paste Electrode for Simultaneous Detection of Redox-Active Biomolecules. Sensors 2018, 18, 23. [Google Scholar] [CrossRef] [PubMed] [Green Version]
- Bahmanzadeh, S.; Noroozifar, M. Fabrication of modified carbon paste electrodes with Ni-doped Lewatit FO36nano ion exchange resin for simultaneous determination of epinephrine, paracetamol and tryptophan. J. Electroanal. Chem. 2018, 809, 153–162. [Google Scholar] [CrossRef]
- Shahbakhsh, M.; Narouie, S.; Noroozifar, M. Modified glassy carbon electrode with Polydopamine-multiwalled carbon nanotubes for simultaneous electrochemical determination of biomolecules in biological fluids. J. Pharm. Biomed. Anal. 2018, 161, 66–72. [Google Scholar] [CrossRef] [PubMed]
- Omara Shastan, Z.; Ganesh, H.; Noroozifar, M.; Kerman, K. Carbon ceramic microelectrodes modified with buckyballs for simultaneous determination of redox-active biomolecules. RSC Adv. 2018, 8, 5960–5966. [Google Scholar] [CrossRef] [Green Version]
- Tohidinia, M.; Farsadrooh, M.; Bahmanzadeh, S.; Sabbaghi, N.; Noroozifar, M. Poly(quercetin)-bismuth nanowires as a new modifier for simultaneous voltammetric determination of dihydroxybenzene isomers and nitrite. RSC Adv. 2018, 8, 1237–1245. [Google Scholar] [CrossRef] [Green Version]
- Li, S.; Noroozifar, M.; Kerman, K. Nanocomposite of ferricyanide-doped chitosan with multi-walled carbon nanotubes for simultaneous senary detection of redox-active biomolecules. J. Electroanal. Chem. 2019, 849, 113376. [Google Scholar] [CrossRef]
- Landete, J.M. Ellagitannins, ellagic acid and their derived metabolites: A review about source, metabolism, functions and health. Food Res. Int. 2011, 44, 1150–1160. [Google Scholar] [CrossRef]
- Ogawa, Y.; Kanatsu, K.; Iino, T.; Kato, S.; Jeong, Y.I.; Shibata, N.; Takada, K.; Takeuchi, K. Protection against dextran sulfate sodium-induced colitis by microspheres of ellagic acid in rats. Life Sci. 2002, 71, 827. [Google Scholar] [CrossRef]
- Priyadarsini, K.I.; Khopde, S.M.; Kumar, S.S.; Mohan, H. Free radical studies of ellagic acid, a natural phenolic antioxidant. J. Agri. Food Chem. 2002, 50, 2200. [Google Scholar] [CrossRef] [PubMed]
- Larrosa, M.; Tomas-Barberan, F.A.; Espın, J.C. The dietary hydrolysable tannin punicalagin releases ellagic acid that induces apoptosis in human colon adenocarcinoma Caco-2 cells by using the mitochondrial pathway. J. Nutr. Biochem. 2006, 17, 611. [Google Scholar] [CrossRef] [PubMed]
- Smart, R.C.; Huang, M.T.; Chang, R.L.; Sayer, J.M.; Jerina, D.M.; Conney, A.H. Disposition of the naturally occurring antimutagenic plant phenol, ellagic acid, and its synthetic derivatives, 3-O-decylellagic acid and 3,3′-di-O-methylellagic acid in mice. Carcinogenesis 1986, 7, 1663. [Google Scholar] [CrossRef]
- Paivarinta, E.; Pajari, A.M.; Torronen, R.; Mutanen, M. Ellagic Acid and Natural Sources of Ellagitannins as Possible Chemopreventive Agents Against Intestinal Tumorigenesis in the Min Mouse. Nutr. Cancer 2006, 54, 79. [Google Scholar] [CrossRef]
- Bisen, P.S.; Bundela, S.S.; Sharma, A. Ellagic Acid—Chemopreventive Role in Oral Cancer. J. Cancer Sci. Ther. 2012, 4, 023. [Google Scholar] [CrossRef]
- Noroozifar, M.; Khorasani-Motlagh, M.; Hassani-Nadiki, H.; Hadavi, M.S.; Foroughi, M.M. Modified fluorine-doped tin oxide electrode with inorganic ruthenium red dye-multiwalled carbon nanotubes for simultaneous determination of a dopamine, uric acid, and tryptophan. Sens. Actuat. B 2014, 204, 333–341. [Google Scholar] [CrossRef]
- Minh, T.T.; Phong, N.H.; Van Duc, H.; Khieu, D.Q. Microwave synthesis and voltammetric simultaneous determination of paracetamol and caffeine using an MOF-199-based electrode. J. Mater. Sci. 2018, 53, 2453–2471. [Google Scholar] [CrossRef]
- Mekassa, B.; Tessema, M.; Chandravanshi, B.S. Simultaneous determination of caffeine and theophylline using square wave voltammetry at poly (l-aspartic acid)/functionalized multi-walled carbon nanotubes composite modified electrode. Sens. Biosens. Res. 2017, 16, 46–54. [Google Scholar] [CrossRef]
- Švorc, L.U.; Tomčík, P.; Svítková, J.; Rievaj, M.; Bustin, D. Voltammetric determination of caffeine in beverage samples on bare boron-doped diamond electrode. Food Chem. 2012, 135, 1198–1204. [Google Scholar] [CrossRef] [PubMed]
- Wang, Y.; Wu, T.; Bi, C.-Y. Simultaneous determination of acetaminophen, theophylline and caffeine using a glassy carbon disk electrode modified with a composite consisting of poly (Alizarin Violet 3B), multiwalled carbon nanotubes and graphene. Microchim. Acta 2016, 183, 731–739. [Google Scholar] [CrossRef]
- Wang, C.; Yuan, R.; Chai, Y.; Chen, S.; Hu, F.; Zhang, M. Simultaneous determination of ascorbic acid, dopamine, uric acid and tryptophan on gold nanoparticles/overoxidized-polyimidazole composite modified glassy carbon electrode. Anal. Chim. Acta 2012, 741, 15–20. [Google Scholar] [CrossRef]
- Narouei, F.H.; Tammandani, H.K.; Ghalandarzehi, Y.; Sabbaghi, Y.; Noroozifar, M. An Electrochemical Sensor based on conductive polymers/Graphite Paste Electrode for Simultaneous Determination of Dopamine, Uric acid and Tryptophan in Biological Samples. Int. J. Electrochem. Sci. 2017, 12, 7739–7753. [Google Scholar] [CrossRef]
- Habibi, B.; Abazari, M.; Pournaghi-Azar, M.H. Simultaneous determination of codeine and caffeine using single-walled carbon nanotubes modified carbon-ceramic electrode. Coll. Surf. B Biointerfaces 2014, 114, 89–95. [Google Scholar] [CrossRef] [PubMed]
- Wang, Y. Nitrogen-doped carbon nanotubes decorated poly (L-Cysteine) as a novel, ultrasensitive electrochemical sensor for simultaneous determination of theophylline and caffeine. Talanta 2018, 178, 449–457. [Google Scholar] [CrossRef]
- Noroozifar, M.; Khorasani-Motlagh, M.; Taheri, A. Preparation of silver hexacyanoferrate nanoparticles and its application for the simultaneous determination of ascorbic acid, dopamine and uric acid. Talanta 2010, 80, 1657–1664. [Google Scholar] [CrossRef] [PubMed]
- Srdjenovic, B.; Djordjevic-Milic, V.; Grujic, N.; Injac, R.; Lepojevic, Z. Simultaneous HPLC Determination of Caffeine, Theobromine, and Theophylline in Food, Drinks, and Herbal Products. J. Chromatogr. Sci. 2008, 46, 144–149. [Google Scholar] [CrossRef] [Green Version]
- Cooper, N.; Khosravan, R.; Erdmanna, C.; Fiene, J.; Lee, J.W. Quantification of uric acid, xanthine and hypoxanthine in human serum by HPLC for pharmacodynamic studies. J. Chromatogr. B 2006, 837, 1–10. [Google Scholar] [CrossRef]
- Benedetto, G.E.D.; Fico, D.; Pennetta, A.; Malitesta, C.; Nicolardi, G.; Lofrumento, D.D.; Nuccio, F.D.; Pesa, V.L. A rapid and simple method for the determination of 3,4-dihydroxyphenylacetic acid, norepinephrine, dopamine, and serotonin in mouse brain homogenate by HPLC with fluorimetric detection. J. Pharm. Biomed. Anal. 2014, 98, 266–270. [Google Scholar] [CrossRef] [PubMed]
- Emadi-Konjin, P.; Verjee, Z.; Levin, A.V.; Adeli, K. Measurement of intracellular vitamin C levels in human lymphocytes by reverse phase high performance liquid chromatography (HPLC). Clin. Biochem. 2005, 38, 450–456. [Google Scholar] [CrossRef] [PubMed]
- Dario, M.F.; Freire, T.B.; Pinto, C.A.S.D.O.; Prado, M.S.A.; Baby, A.R.; Velasco, M.V.R. Tryptophan and kynurenine determination in human hair by liquid chromatography. J. Chromatogr. B 2017, 1065–1066, 59–62. [Google Scholar] [CrossRef] [PubMed]
Scheme 1.
Chemical structures of (a) ellagic acid, (b) ascorbic acid, (c) dopamine, (d) uric acid, (e) tryptophan, (f) xanthine, (g) caffeine.
Scheme 1.
Chemical structures of (a) ellagic acid, (b) ascorbic acid, (c) dopamine, (d) uric acid, (e) tryptophan, (f) xanthine, (g) caffeine.

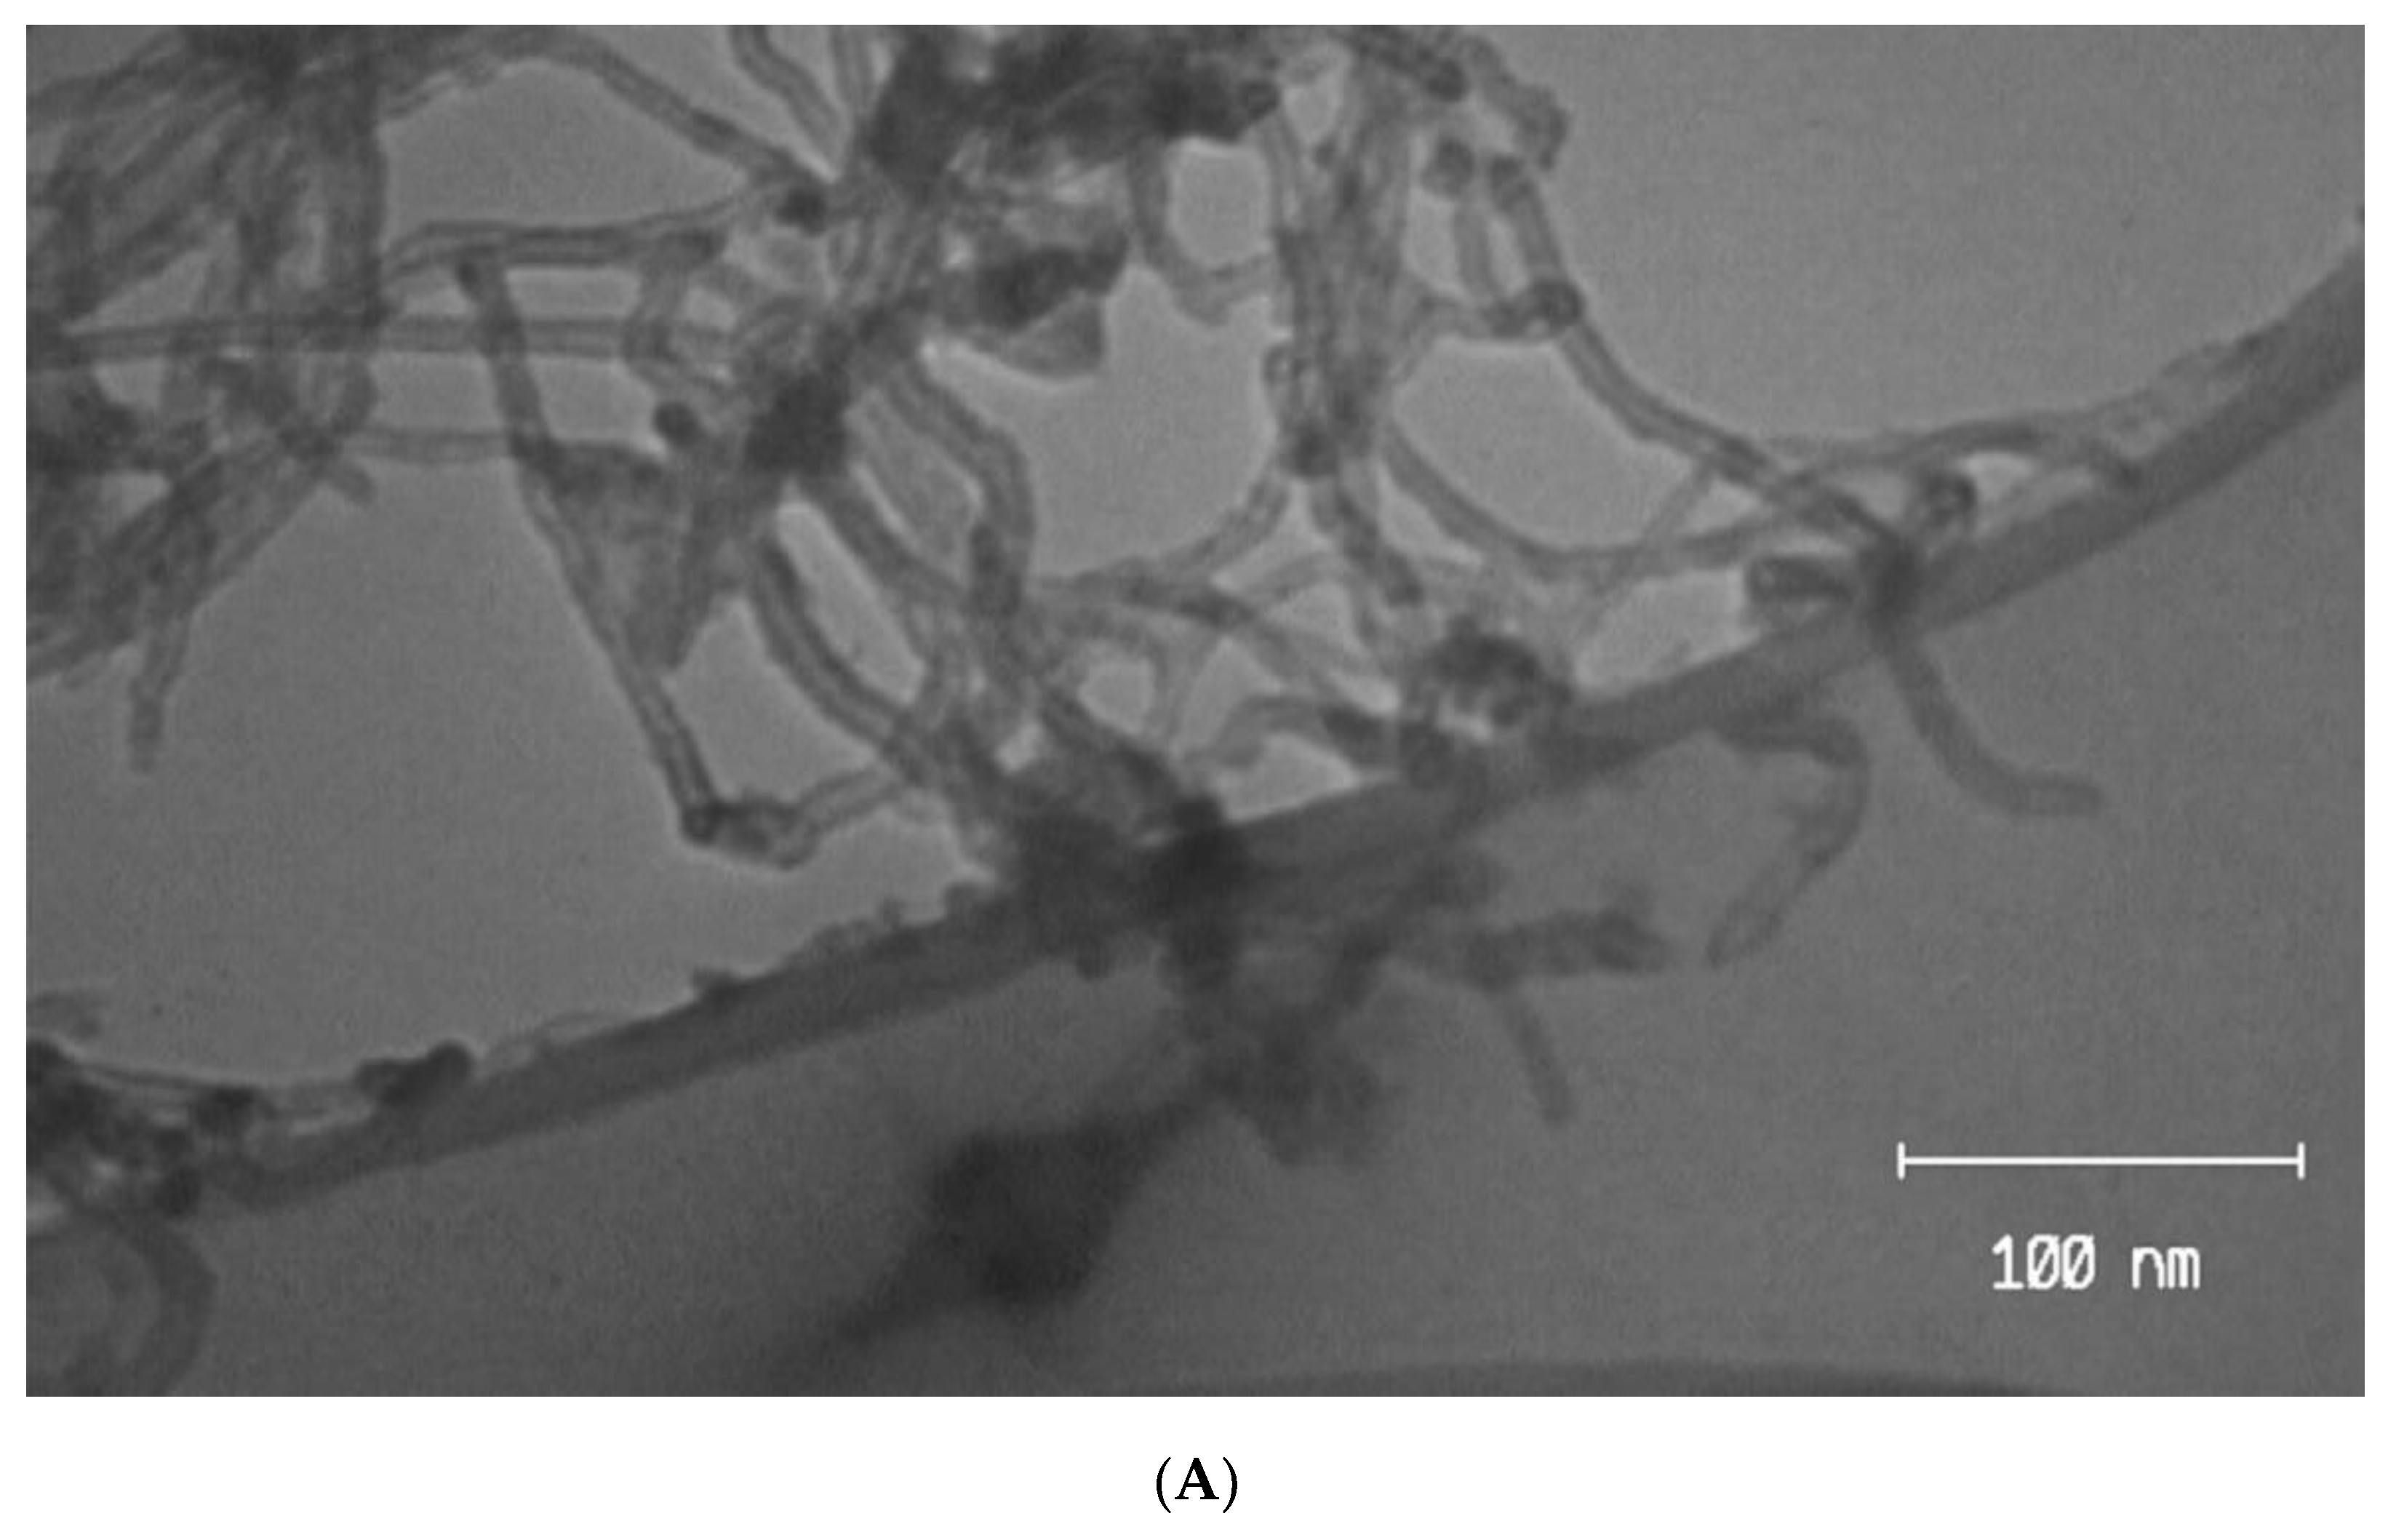
Figure 1.
(A) TEM image of MWCNTs-EA and (B) SEM of GPE/MWCNTs-EA.


Figure 2.
Nyquist plots of the GPE, MGPE/EA, MGPE/MWCNTs, MGPE/MWCNTs-EA. Electrochemical measurements were performed in 10 mM [Fe(CN)6]3−/4− prepared in 0.1 M KCl. EIS was analyzed over a frequency range from 0.1 Hz to 10 kHz (inset shows the typical Randles equivalent circuit model used to fit the EIS results in the present work).

Figure 3.
(A) Differential pulse voltammograms of (a) MGPE/MWCNTs-EA; (b) MGPE/MWCNTs; (c) MGPE/EA; (d) GPE in 0.1 M PBS (pH 2.0) containing (14.9 μM) AA, (22 μM) DA, (14.9 μM) UA, (14.9 μM) Trp, (14.9 μM) XN and (22 μM) CA. (B) Differential pulse voltammograms of MGPE/MWCNTs-EA in PBS (pH 2.0) and in the presence of (a) 14.9 μM AA; (b) 22 μM DA; (c) 14.9 μM UA; (d) 14.9 μM Trp; (e) 14.9 μM XN; (f) 22 μM CA and (g) a mixed solution of (a–f).

Figure 4.
(A) Differential pulse voltammograms of AA, DA, UA, Trp, XN, and CA on the modified graphite paste electrode surfaces in different pH conditions; (B) the dependence of anodic peak potentials on pH; (C) the dependence of anodic peak currents on pH.
Figure 4.
(A) Differential pulse voltammograms of AA, DA, UA, Trp, XN, and CA on the modified graphite paste electrode surfaces in different pH conditions; (B) the dependence of anodic peak potentials on pH; (C) the dependence of anodic peak currents on pH.

Figure 5.
Differential pulse voltammograms of the mixtures of AA, DA, UA, Trp, XN, and CA in the modified graphite paste electrode in PBS (pH 2.0). The concentrations of analytes ranged from inner to outer parts of calibration curves as follows: (0.099–5.9) and (5.9–54) μM for AA, DA, Trp, CA, (0.099–4.9) and (4.9–54) μM for UA and (0.099–7.9) and (7.9–54) μM for XN with calibration plots of (a) AA in the mixture; (b) DA in the mixture; (c) UA in the mixture; (d) Trp in the mixture; (e) XN in the mixture; and (f) CA in the mixture under optimal conditions.


Figure 6.
(A) Typical chronoamperograms obtained at MGPE/MWCNTs-EA in 0.1 M PBS (pH 2.0) for different concentrations of AA at 7.97 μM (green),10.94 μM (orange), 25.75 μM (dark blue), 29.44 μM (gray), and 44.01 μM (blue); (B) Plots of I vs. t−1/2 obtained from chronoamperograms; (C) Plot of the slope of the linear dynamic range against AA concentration.


Table 1.
Comparison of the modified graphite paste electrode with other modified electrodes in the literature for the individual and simultaneous determination of AA, DA, UA, Trp, XN, and CA.
Table 1.
Comparison of the modified graphite paste electrode with other modified electrodes in the literature for the individual and simultaneous determination of AA, DA, UA, Trp, XN, and CA.
| Electrode | Linear Range/µM | Detection Limit/µM | Ref. | ||||||||||
|---|---|---|---|---|---|---|---|---|---|---|---|---|---|
| CPE-MWCNTs | _ | 2.00–170.0 | 0.40–100.0 | 0.60–100.0 | _ | _ | _ | 0.36 | 0.27 | 0.065 | _ | _ | [47] |
| CBNB/ CNT/GCE | 20–400 | 0.05–2.75 | 1.0–45 | 0.025–4.8 | _ | _ | 5.71 | 1.7 × 10⁻² | 0.42 | 0.11 | _ | _ | [52] |
| nano-B-CeO2/ GCPE | _ | _ | 0.42–11.9 | _ | 0.07–2.02 | _ | _ | _ | 5.39 × 10⁻³ | _ | 2.36 × 10⁻³ | _ | [33] |
| PTh/GPE | _ | 10–180 | 6-180 | 6–180 | _ | _ | _ | 1 | 0.57 | 0.61 | _ | _ | [53] |
| SWCNT/ CCE | _ | _ | _ | _ | _ | _ | _ | _ | _ | _ | _ | 0.25 | [54] |
| PLCY/N-CNT/GCE | _ | _ | _ | _ | _ | 0.4-300 | _ | _ | _ | _ | _ | 0.20 | [55] |
| GC/CNT-AgHCFNP | 4.0–78 | 2.4–130 | 2.0–15 | _ | _ | _ | 4.2 × 10⁻² | 1.4 × 10⁻² | 0.6 | _ | _ | _ | [56] |
| FC/Chi-MWCNT-GPE | 10–2057 | 0.99–94.1 | 0.99–193.7 | 0.99–198.9 | 1–191.3 | 10–2439.0 | 5.26 | 0.0011 | 0.0027 | 0.0037 | 0.0073 | 2.05 | [41] |
| MGPE/ MWCNTs-EA | 0.099–54 | 0.099–54 | 0.099–54 | 0.099–54 | 0.099–54 | 0.099–54 | 0.091 | 0.0099 | 0.013 | 0.011 | 0.014 | 0.078 | This Work |
Table 2.
Simultaneous determination of AA, DA, UA, Trp, XN, and CA in human serum and urine samples with the electrochemical sensor in comparison with the reported literature results using the standard HPLC method [59,60,61,62,63].
| Sample | Target | Detected (µM) ± SD * (n = 3) | Spike (µM) | Found (µM) ± SD * (n = 3) | Recovery (%) | Standard (HPLC) Method [59,60,61,62,63] | ||
|---|---|---|---|---|---|---|---|---|
| Detected (µM) ± SD * (n = 3) | Found (µM) ± SD * (n = 3) | Recovery (%) | ||||||
| Serum | AA | _ | 4.0 | 3.92 ± 0.26 | 98.0 | _ | 3.90 ± 0.26 | 97.5 |
| _ | 15.0 | 14.75 ± 1.0 | 98.3 | _ | 14.84 ± 1.03 | 98.9 | ||
| _ | 35.0 | 34.3 ± 1.45 | 98.0 | _ | 34.70 ± 1.96 | 99.1 | ||
| DA | _ | 4.0 | 4.03 ± 0.09 | 100.7 | _ | 3.99 ± 0.09 | 99.8 | |
| _ | 15.0 | 14.90 ± 0.99 | 99.3 | _ | 15.50 ± 0.46 | 103.3 | ||
| _ | 35.0 | 35.10 ± 2.0 | 100.2 | _ | 35.10 ± 1.47 | 100.3 | ||
| UA | 7.7 ± 0.4 | 4.0 | 11.8 ± 0.5 | 102.5 | 7.9 ± 0.2 | 12.1 ± 0.3 | 105.0 | |
| 7.7 ± 0.4 | 15.0 | 22.8 ± 0.3 | 100.6 | 7.9 ± 0.2 | 22.8 ± 0.6 | 99.3 | ||
| 7.7 ± 0.4 | 35.0 | 43.1 ± 0.6 | 101.1 | 7.9 ± 0.2 | 43.2 ± 0.4 | 100.8 | ||
| Trp | 1.2 ± 0.1 | 4.0 | 5.1 ± 0.2 | 97.5 | 1.0 ± 0.5 | 5.2 ± 0.1 | 105.0 | |
| 1.2 ± 0.1 | 15.0 | 16.7 ± 0.8 | 103.3 | 1.0 ± 0.5 | 16.3 ± 0.5 | 102.0 | ||
| 1.2 ± 0.1 | 35.0 | 36.1 ± 0.1 | 99.7 | 1.0 ± 0.5 | 35.9 ± 0.2 | 99.7 | ||
| XN | _ | 4.0 | 3.94 ± 0.17 | 98.5 | _ | 4.05 ± 0.21 | 101.2 | |
| _ | 15.0 | 15.30 ± 1.11 | 102.0 | _ | 15.25 ± 0.55 | 101.7 | ||
| _ | 35.0 | 35.94 ± 2.60 | 102.7 | _ | 35.40 ± 1.34 | 101.1 | ||
| CA | 4.5 ± 0.3 | 4.0 | 8.5 ± 0.3 | 100.0 | 4.7 ± 0.1 | 8.8 ± 0.6 | 107.5 | |
| 4.5 ± 0.3 | 15.0 | 20.2 ± 0.7 | 104.6 | 4.7 ± 0.1 | 19.9 ± 0.4 | 102.6 | ||
| 4.5 ± 0.3 | 35.0 | 39.8 ± 0.4 | 100.8 | 4.7 ± 0.1 | 40.2 ± 0.2 | 102.0 | ||
| Urine | AA | _ | 4.0 | 4.06 ± 0.22 | 101.5 | _ | 4.11 ± 0.33 | 102.8 |
| _ | 15.0 | 14.89 ± 1.45 | 99.3 | _ | 15.09 ± 0.61 | 100.6 | ||
| _ | 35.0 | 34.85 ± 2.44 | 99.6 | _ | 34.95 ± 0.26 | 99.9 | ||
| DA | _ | 4.0 | 3.89 ± 0.20 | 97.3 | _ | 3.96 ± 0.25 | 99.0 | |
| _ | 15.0 | 15.5 ± 0.96 | 103.3 | _ | 15.02 ± 0.75 | 100.1 | ||
| _ | 35.0 | 35.90 ± 1.70 | 102.6 | _ | 35.50 ± 1.36 | 101.4 | ||
| UA | 1.4 ± 0.9 | 4.0 | 5.40 ± 0.7 | 100.0 | 1.8 ± 0.5 | 5.7 ± 0.1 | 97.5 | |
| 1.4 ± 0.9 | 15.0 | 16.9 ± 0.5 | 103.3 | 1.8 ± 0.5 | 17.0 ± 0.2 | 101.3 | ||
| 1.4 ± 0.9 | 35.0 | 35.7 ± 0.3 | 98.0 | 1.8 ± 0.5 | 37.4 ± 0.6 | 101.7 | ||
| Trp | 1.0 ± 0.2 | 4.0 | 4.9 ± 0.3 | 97.5 | 0.7 ± 0.2 | 4.5 ± 0.4 | 95.0 | |
| 1.0 ± 0.2 | 15.0 | 16.9 ± 0.7 | 106.0 | 0.7 ± 0.2 | 16.7 ± 0.2 | 106.0 | ||
| 1.0 ± 0.2 | 35.0 | 37.1 ± 0.8 | 103.1 | 0.7 ± 0.2 | 35.9 ± 0.1 | 100.5 | ||
| XN | _ | 4.0 | 3.93 ± 0.19 | 98.2 | _ | 4.04 ± 0.11 | 101.0 | |
| _ | 15.0 | 14.85 ± 0.88 | 99.0 | _ | 14.93 ± 0.77 | 99.5 | ||
| _ | 35.0 | 34.50 ± 1.10 | 98.6 | _ | 35.50 ± 1.05 | 101.4 | ||
| CA | 3.8 ± 0.2 | 4.0 | 8.0 ± 0.3 | 105.0 | 3.3 ± 0.5 | 7.1 ± 0.4 | 95.0 | |
| 3.8 ± 0.2 | 15.0 | 17.9 ± 0.6 | 94.0 | 3.3 ± 0.5 | 19.1 ± 0.7 | 105.3 | ||
| 3.8 ± 0.2 | 35.0 | 39.2 ± 0.2 | 101.1 | 3.3 ± 0.5 | 38.9 ± 0.3 | 101.7 | ||
Publisher’s Note: MDPI stays neutral with regard to jurisdictional claims in published maps and institutional affiliations. |
© 2021 by the authors. Licensee MDPI, Basel, Switzerland. This article is an open access article distributed under the terms and conditions of the Creative Commons Attribution (CC BY) license (https://creativecommons.org/licenses/by/4.0/).
Share and Cite
MDPI and ACS Style
Sabbaghi, N.; Noroozifar, M.; Kerman, K. Nanocomposite of Ellagic Acid with Multi-Walled Carbon Nanotubes for the Simultaneous Voltammetric Detection of Six Biomolecules. C 2021, 7, 43. https://0-doi-org.brum.beds.ac.uk/10.3390/c7020043
AMA Style
Sabbaghi N, Noroozifar M, Kerman K. Nanocomposite of Ellagic Acid with Multi-Walled Carbon Nanotubes for the Simultaneous Voltammetric Detection of Six Biomolecules. C. 2021; 7(2):43. https://0-doi-org.brum.beds.ac.uk/10.3390/c7020043
Chicago/Turabian StyleSabbaghi, Najmeh, Meissam Noroozifar, and Kagan Kerman. 2021. "Nanocomposite of Ellagic Acid with Multi-Walled Carbon Nanotubes for the Simultaneous Voltammetric Detection of Six Biomolecules" C 7, no. 2: 43. https://0-doi-org.brum.beds.ac.uk/10.3390/c7020043
Note that from the first issue of 2016, this journal uses article numbers instead of page numbers. See further details here.