
Effect of Porosity and Surface Chemistry on CO2 and CH4 Adsorption in S-Doped and S-/O-co-Doped Porous Carbons


Laboratorio de Materiales Avanzados, Departamento de Química Inorgánicak, Instituto Universitario de Materiales (IUMA), Universidad de Alicante, 03690 San Vicente del Raspeig, Spain
*
Author to whom correspondence should be addressed.
C 2022, 8(3), 41; https://0-doi-org.brum.beds.ac.uk/10.3390/c8030041
Submission received: 7 July 2022
/
Revised: 1 August 2022
/
Accepted: 5 August 2022
/
Published: 15 August 2022
(This article belongs to the Special Issue Carbons for Health and Environmental Protection)
Abstract
:The aim of this study was to determine the adsorption performance of a petroleum pitch-based activated carbon (PPAC1:3) before and after a post-treatment with H2S. In the first step, a microporous activated carbon (PPAC1:3) with a highly developed porous structure was produced through a chemical activation route with KOH. Afterward, the synthesized activated carbon was thermally treated yielding two different series of functionalized activated carbons: (i) a series of carbons were treated directly with H2S at elevated temperatures (600 °C and 800 °C), and (ii) a series of carbons were generated by combining an oxidation treatment with plasma followed by H2S treatment at elevated temperatures (600 °C and 800 °C). The chemical and structural characteristics of the S-doped and S-/O-co-doped porous carbons were investigated by means of different experimental techniques, such as XRD, RAMAN, FESEM, XPS, TPD, N2, and CO2 adsorption, and finally tested in CO2 and CH4 adsorption at atmospheric and high pressure. The functionalized porous carbons possessed specific surface areas of 2420–2690 m2/g, total pore volume of 1.05–1.18 cm3/g, and sulfur content up to 2.55 atom % (the sulfur content of the original carbon was 0.19%). After a careful analysis of the carbon dioxide and methane uptake at atmospheric (0.1 MPa) and high pressure (4 MPa), adsorption results confirm that the microporous structure is the main structural parameter defining the adsorption performance and, to a lower extent, the surface chemistry. Overall, a significant improvement in the total uptake can be appreciated after the H2S treatment.
1. Introduction
As a result of increasing energy consumption, society is confronting important consequences associated with global warming issues due to the release of greenhouse gases (such as CO2 and CH4) into the atmosphere [1]. As a result, climate change is accelerating, with drastic weather events already occurring and the full scope of the climate crisis’s impacts, with more to come [2]. To mitigate global warming and the associated climatic changes, researchers are concentrating their efforts on the development of alternative energy sources (e.g., solar, wind, geothermal, tidal). However, at the same time, there must be a major reduction in global net greenhouse gas (GHG) emissions, as well as a move toward ‘green’ energy sources, to meet the Paris Agreement’s temperature targets [3]. Due to these reasons, the development of novel, low-cost CO2 capture systems is required. Additionally, the global economy’s transportation sector must shift away from conventional fossil fuels toward cleaner, renewable fuels, such as natural gas (CH4) and hydrogen (H2). Although not a carbon-neutral fuel, natural gas can be generated in a sustainable manner from biomass, its combustion generating much less CO2 and other pollutants compared to other energy sources [4,5].
The challenge with storing or capturing CO2, CH4, or H2 is due to their gaseous nature at ambient temperatures and the difficulty to condensate them at a reasonable cost [6,7,8,9]. Therefore, the challenge becomes both economic and practical—how to store and transport these gases in the most cost-effective and space-efficient manner possible. Currently, industrial CO2 capture is mostly accomplished by reacting liquid amines with water to generate aqueous ammonium bicarbonates, whereas commercial systems for natural gas/CH4 and H2 storage depend on expensive compression or liquefaction approaches. The high cost of liquid amine capture is mostly due to its poor CO2 capacity and the energy required to regenerate the amine from ammonium bicarbonate [10,11].
Chemical (chemisorption) or physical (physisorption) adsorption onto a suitable solid material is a promising alternative technique for gas storage. Physisorption has distinguishing benefits over chemisorption in that the adsorbate can be easily regenerated by lowering the pressure or raising the temperature. Microporous adsorbents, such as porous polymers [12], porous inorganic membranes [13], metal–organic frameworks [14,15,16], and zeolites [17], provide potential storage options, but they are limited in their lifecycles, owing to heat instability or unwanted reactivity with concomitant species, such as water. Although the capacities reported on MOFs are extremely high, the drawbacks in the application of these materials are (at times) their low stability in the presence of moisture and the high costs associated with their production. These aspects direct the attention of the researchers toward activated carbons, classical well-known adsorbents exhibiting high surface areas and well-developed porosity [18]. Another important feature of these materials is the relative easiness of their surface modifications via the incorporation of heteroatoms. Porous carbons offer a comparatively affordable storage medium with high thermal and chemical stability. Additionally, the porosity of the carbons may be modified to be selective for certain adsorbate and adsorption circumstances [11,19,20,21,22].
The fundamental properties of activated carbons that make them useful as adsorbents are the large volume of micropores and highly extended surface areas [23]. It has been demonstrated that a pore volume smaller than 2 nm is essential for high CO2 and CH4 adsorption capacities, particularly at ambient temperatures, due to the improved adsorption potential in pores with similar sizes to the adsorbate molecules (the kinetic diameter of the CO2 molecule is 0.33 nm and CH4 is 0.38 nm) [24,25,26]. To maximize the volume of small pores, the well-known activation with KOH has often been utilized on a variety of carbonaceous precursors [27]. Thus, phenolic resin, polysaccharides, and biomass, as well as soft-templated produced carbons, hard-templated produced carbons, and petroleum wastes could be activated using this chemical agent [25]. Numerous efforts have been made to increase the surface area of the specific material since a highly porous structure is required for high adsorption capacity. Meanwhile, it is necessary to increase adsorption efficiency and the contact between gas and carbon material, which is critical for carbon material adsorption [22].
At this point, it is important to highlight that carbonaceous materials often contain rich surface chemistry with different heteroatoms, including hydrogen, oxygen, nitrogen, sulfur, boron, phosphor, and halogens, which are present predominantly as surface functional groups at the edges of the graphene layers or in the aromatic rings [28]. The presence of heteroatoms alters the properties of carbon materials [22,25], and may result in an improvement in their performances, e.g., gas adsorption [29,30,31], lithium batteries [32,33], fuel cells [34,35], supercapacitors [36], and so on.
Due to their spontaneous production on the carbon surface when exposed to air, the oxygen functional groups have been the most thoroughly researched [19]. Their nature and quantity can be further modified by oxidative treatments carried out in either the gaseous or liquid phase. Nitrogen doping is also very well-known, as its presence increases the performance of carbon materials used in supercapacitors, adsorption, and catalysis, among other applications [37,38,39]. Meanwhile, due to their wide variety of possible uses, sulfur-doped carbons have witnessed a tremendous increase in popularity in recent years [40]. For example, the heterogeneous catalysis used in ORR reactions, where S-doping increases not only the catalytic performance, but also the selectivity of oxygen reduction; anodes for Li-ion batteries, and electrodes for supercapacitors are some of the electrochemical applications where S-doping is useful. It has been demonstrated that such doped carbons are effective in adsorption applications, such as CH4 and CO2, hazardous gases, desulfurization, and photocatalysis [1,29,41]. In terms of gas adsorption, the surface polarity caused by the electronegativity difference between the heteroatom and carbon might increase the interactions between gas molecules and the carbon surface, resulting in improved adsorption properties [22]. Sulfur-doped carbons are synthesized either directly by the pyrolysis of sulfur-rich precursors at various temperatures, or indirectly using carbon adsorbent exposed to sulfur vapor/gas precursors, such as H2S, SO2, CS2, or dimethyl disulfide [41,42].
Based on these premises, the aim of this manuscript was to evaluate the effects of sulfur functional groups (incorporated using post-synthesis treatments) on the performance of carbon materials for CO2 and CH4 adsorption at atmospheric and high pressure. In an initial step, a microporous activated carbon (PPAC1:3) was produced by the activation with KOH of a petroleum pitch residue. In a subsequent step, sulfur functionalities were introduced through a thermal treatment at high temperatures with H2S either to the original carbon or samples previously treated with plasma. These two series of S-doped activated carbon samples were tested in the physisorption of carbon dioxide and methane at atmospheric and high pressure. The objective of this work is to analyze the combined effect of porosity and surface chemistry (sulfur and oxygen functionalities) on CO2 and CH4 adsorption. The synthesized materials possess small micropores, important for CO2 and CH4 adsorption, and high sulfur content in various configurations. The effects of the porous structure and surface functional groups on the measured adsorption capacity will be discussed.
2. Materials and Methods
2.1. Preparation of Petroleum Pitch-Based Activated Carbons
Activated carbon (PPAC1:3) was produced using petroleum pitch as a carbon precursor. Initially, the original petroleum pitch (PP) was pyrolyzed at 460 °C under a nitrogen atmosphere (1 MPa) for 90 min (pyrolysis yield 52%). The pyrolyzed material was pulverized into a fine powder using a ball mill (500 µm particle size). In the following step, the mesophase pitch was mixed with KOH as a chemical activating agent (pitch/KOH ratio 1:3) in a ball mill until a homogenous mixture was formed. The carbon sample was activated at 700 °C for 2 h in a nitrogen flow of 100 mL/min. Finally, the synthesized carbon was washed with HCl (37%) and distilled water until neutral pH and dried at 75 °C overnight. The yield of activation for the activated carbon was 52%.
2.2. Plasma Treatment
Plasma Tucano COL-1B-MF was used to oxidize the PPAC 1:3 sample. This equipment has two gas lines, each with a flow regulator and a needle valve. The equipment works with 13.56 MHz of radio frequency (RF) and 500 W of power supply. The chamber where the sample is introduced has a volume of 5.5 L and a diameter of 15 cm. The sample was treated for 180 s with 100% O2 and its weight was noted before and after the treatment. The plasma-oxidized samples were labeled PPAC1:3P.
2.3. H2S Post-Treatment Experiments
PPAC1:3 and PPAC1:3P samples were subjected to a flow of 1000 ppm H2S in N2 (30 mL/min) using a U-shaped quartz reactor. The thermal treatment was conducted for a total of 6 h at two temperatures (600 °C and 800 °C). The primary objective of this step was to incorporate sulfur functionalities in the original and oxidized carbon PPAC1:3 and PPAC1:3P.
2.4. Sample Characterization
Gas adsorption measurements were used to characterize the textural properties of the synthesized samples: N2 at −196 °C and CO2 at 0 °C. More specifically, N2 adsorption at cryogenic temperatures has been applied to evaluate the micro-/mesoporous network, while CO2 adsorption has been used to evaluate the narrow microporous structure. In addition, the Brunauer−Emmett−Teller (BET) equation was applied to the N2 adsorption data to estimate the apparent BET surface area (SBET). The Dubinin−Radushkevich (DR) equation was applied to the N2-adsorption data to determine the total micropore volume (<2 nm) and to the CO2 adsorption isotherms to determine the narrow micropore volume (pores size <0.7 nm). Mesoporosity (Vmeso) has been estimated as the difference between the total pore volume at a relative pressure of 0.95 and the total micropore volume. Pore size distribution profiles were obtained after the application of the QSDFT model to the nitrogen adsorption data. Before the adsorption measurements, samples were submitted to an outgassing treatment under ultra-high vacuum (UHV) conditions at 250 °C for 4 h.
Field emission scanning electron microscopy (FESEM) images were recorded in ZEISS equipment (Merlin VP compact model) equipped with an EDX microanalyzer Quantax 400 from Bruker.
X-ray diffraction (XRD) patterns of the prepared materials were obtained using Bruker equipment, model D8-Advance, provided with a copper anode and a Göebel mirror to avoid the necessity of removing the Cu Kβ radiation with a Ni filter. Hence, the Cu Kα radiation was used. The samples were scanned between 3° and 60° with a pre-set time of 3 s, an angular speed of 1° min−1, and a step of 0.05. RAMAN spectroscopy was carried out in a Raman Jasco NRS-5100 equipment using a 532 nm laser and a 600-lines-per-mm slit between 0 and 4000 cm−1. TPD profiles were obtained using a U-shaped reactor inside an electric furnace, connected to a quadrupole mass spectrometer. About 100 mg of a sample was introduced into it and heat treated from room temperature up to 1000 °C, using a heat ramp of 5 °C min−1 under a flow of helium. The masses (m/z) monitored for all samples were 28 (CO), 44 (CO2) 48 (SO), and 64 (SO2).
X-ray photoelectron spectroscopy (XPS) was performed with a K-ALPHA spectrometer (Thermo Scientific, Waltham, MA, USA). Each spectrum was recorded using Al-Kα radiation (1486.6 eV), monochromatized by a twin crystal monochromator, generating a focused X-ray spot with a diameter of 400 nm, at 3 mA × 12 kV. The alpha hemispherical analyzer was set to the constant energy mode with survey scan pass energies of 200 eV to access the whole energy band and 50 eV in a narrow scan to selectively evaluate the specific elements. Charge compensation was accomplished using a system flood gun that produced both low-energy electrons and argon ions. The powder samples were compressed and affixed to the sample holder before being put in the vacuum chamber. Before capturing the spectrum, the samples were kept in the analysis chamber until a residual pressure of ca. 5 × 10⁻⁷ N m−2 was established. After subtracting the S-shaped background, the quantitative analysis was determined by calculating the integral of each peak and fitting the experimental curve to a combination of Lorentzian (30%) and Gaussian (70%) lines. Scanning energy from 279.08 to 302.08 eV for carbon; from 525.08 to 545.08 eV for oxygen; from 392.08 to 410.08 eV for nitrogen, and from 157.08 to 175.08 eV for sulfur was carried out.
2.5. Atmospheric Pressure and High-Pressure CH4 and CO2 Adsorption Measurements
Atmospheric pressure and high-pressure CH4 and CO2 adsorption measurements were performed in a home-built manometric system [43]. Before the adsorption measurements, samples were outgassed under an ultra-high vacuum (UHV) setting at 250 °C for 4 h. Adsorption isotherms were obtained at 25 °C and up to 0.1 MPa and 4.0 MPa, for both CH4 and CO2.
3. Results and Discussion
3.1. Textural Characterization
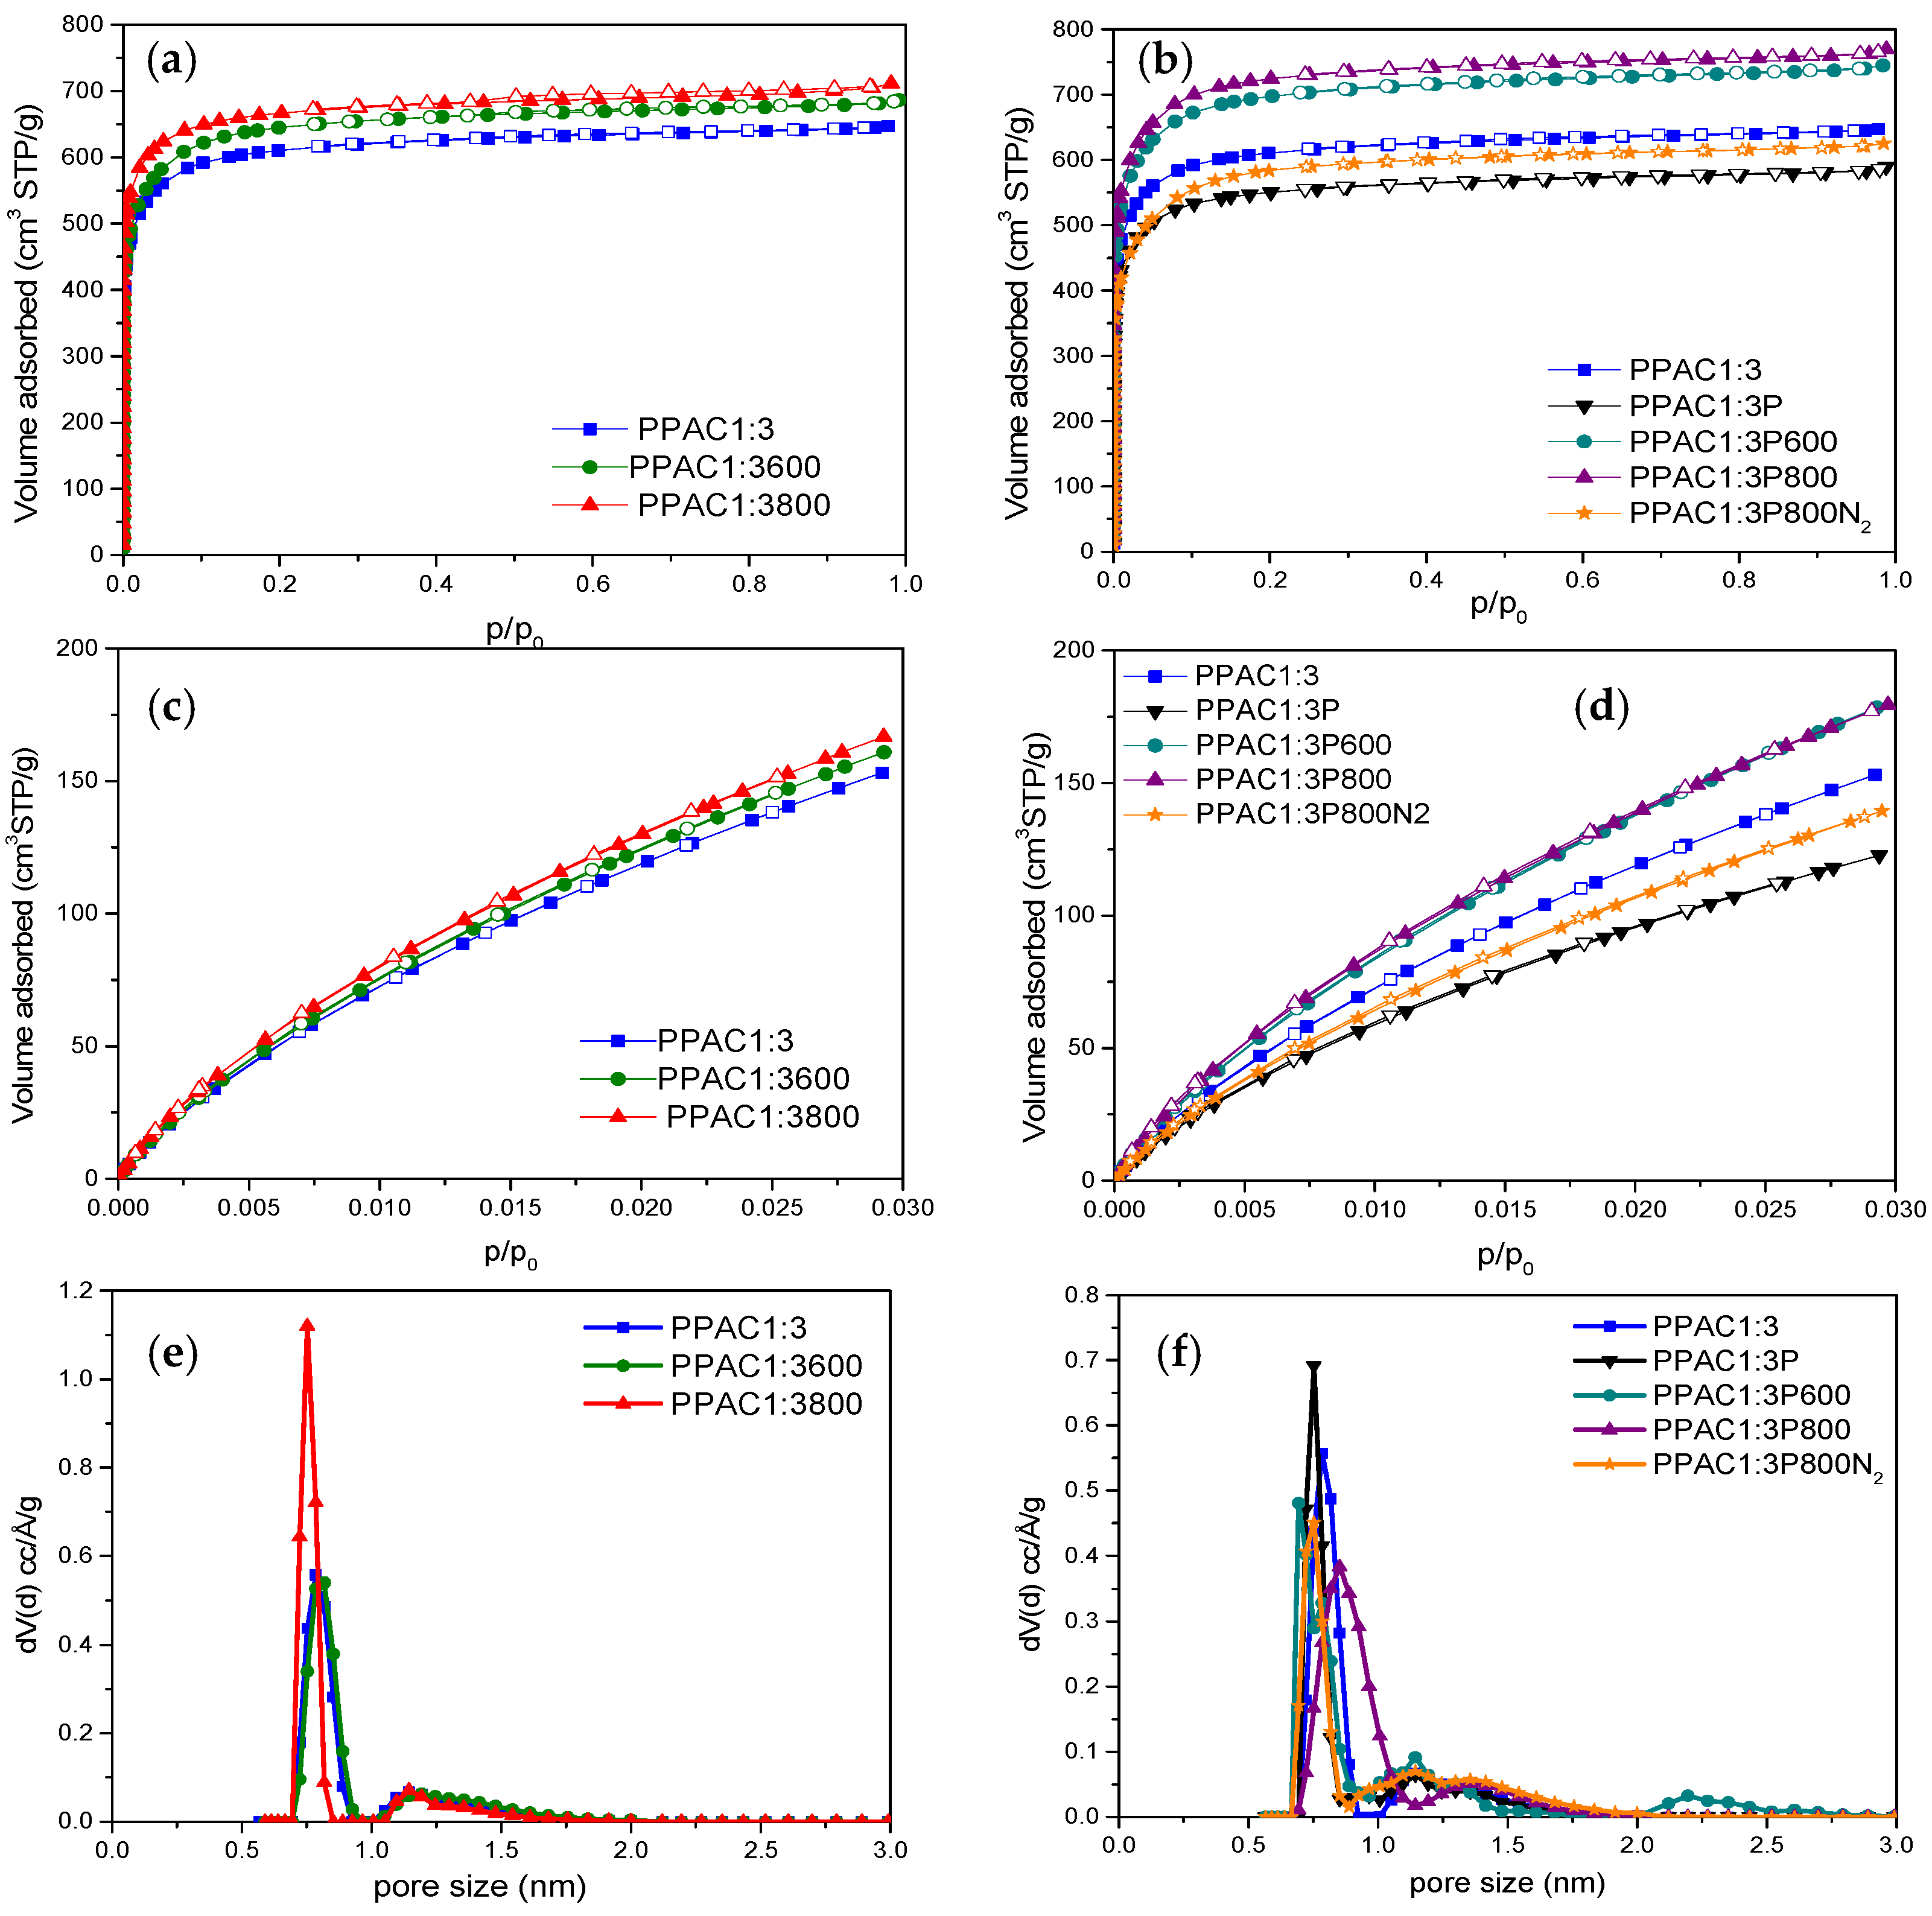
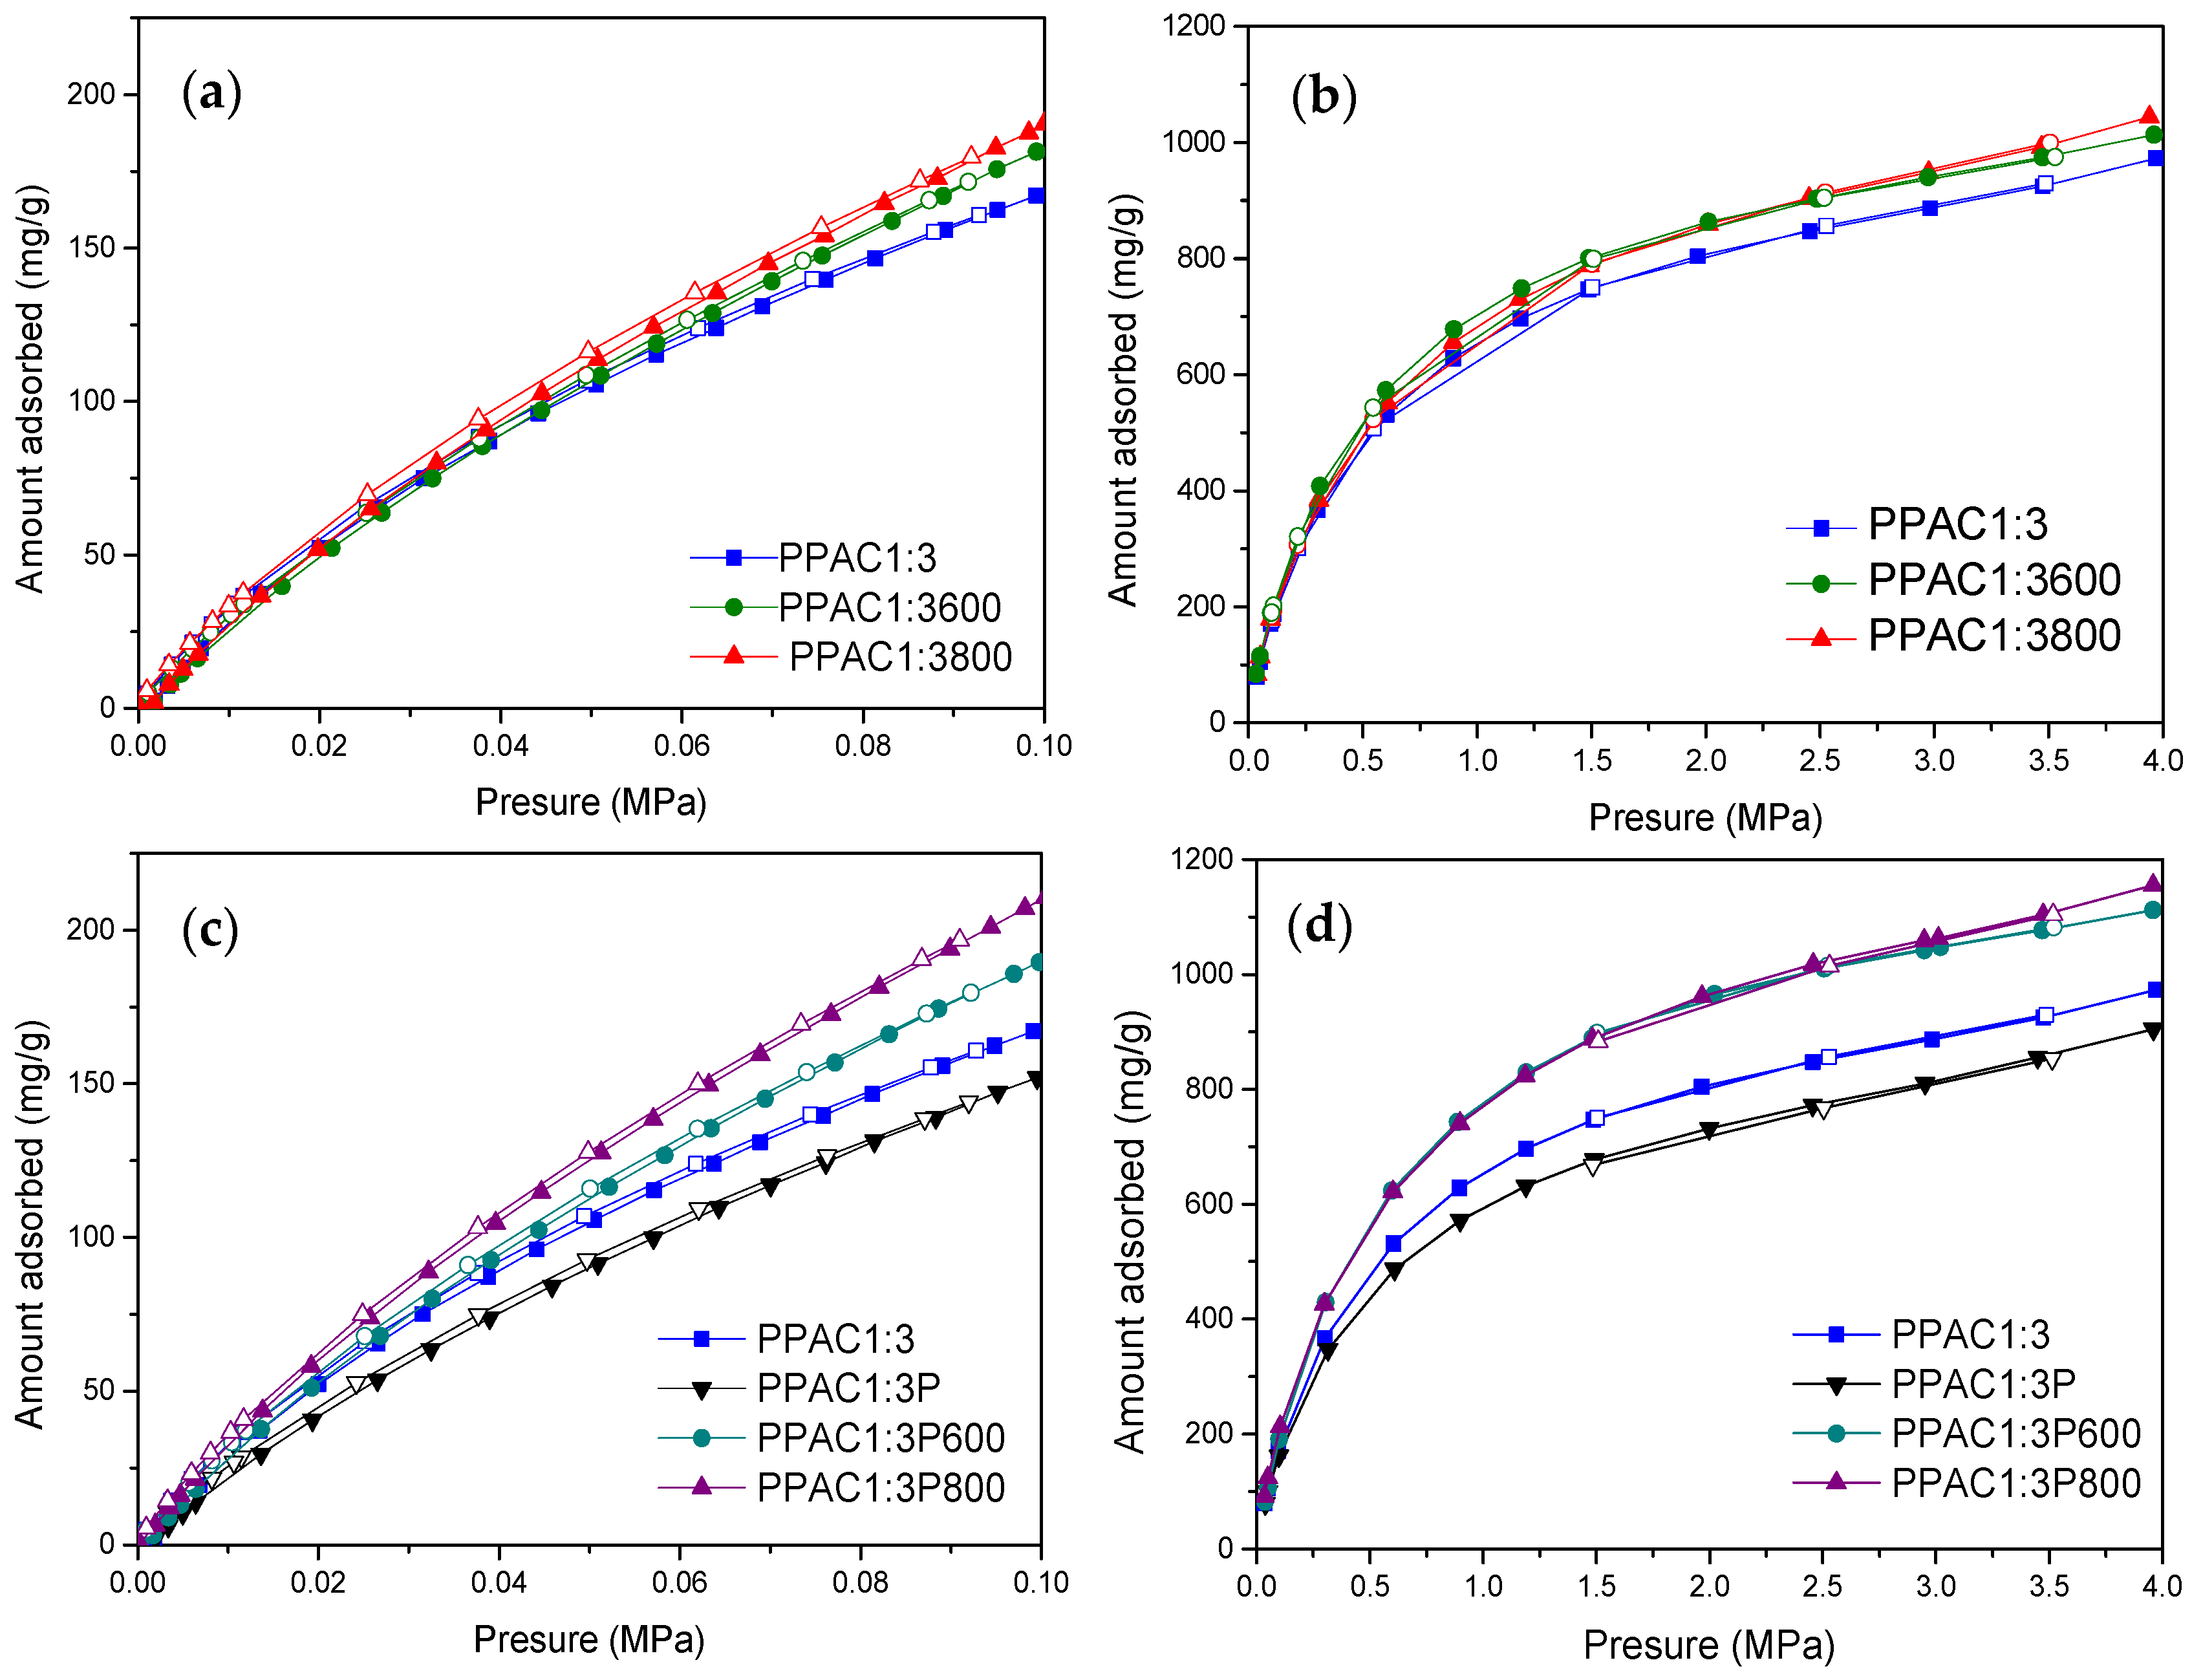
The porous structures of the synthesized carbon materials were evaluated using gas adsorption measurements (N2 at −196 °C and CO2 at 0 °C). Figure 1 compares the adsorptions of these two probes N2 (1a,b) and CO2 (1c,d), for non-oxidized (PPAC1:3) and plasma-oxidized (PPAC1:3P) samples, both treated with H2S at high temperatures. Textural characteristics are reported in Table 1. As it can be appreciated, all samples exhibited a type I N2 adsorption isotherm, according to the IUPAC classification, indicating the microporous nature of the synthesized samples. The exclusive presence of microporosity can be verified from the pore size distribution (PSD) profiles obtained after the application of the QSDFT model to the nitrogen adsorption data (Figure 1e,f). As it can be appreciated, the amount of N2 and CO2 adsorbed increases in all cases after the heat treatment with H2S for 6 h at 600 °C and 800 °C, Figure 1a,c. However, this increase is much larger for the samples pre-oxidized with plasma before being exposed to H2S, Figure 1b,d.
Table 1 reports the textural parameters for the different samples evaluated. In general, the BET surface area and the micropore volume (V0) increase with the temperature of the thermal treatment. However, these changes are more significant for the pre-oxidized samples, e.g., the oxidized sample PPAC1:3P800 shows the highest BET surface area (2692 m2/g), i.e., 16% higher than the original sample PPAC1:3.
An additional sample (PPAC1:3P800N2) was prepared following the same protocol but replacing H2S with N2 in the last thermal treatment. The main goal of this sample was to confirm that the increases in the BET surface area and micropore volume were not due to the effect of the thermal treatment itself and/or to the plasma treatment but rather to the H2S atmosphere used during the thermal treatment. As presented in Table 1, the BET surface area of the original sample (PPAC1:3) decreases after the plasma treatment (2049 m2/g vs. 2325 m2/g). The decreased BET surface area after the oxidation treatment must be attributed either to the partial collapse of the microporous structure during the plasma treatment or to the partial inhibition of nitrogen adsorption in small micropores due to the newly created oxygen functional groups at the pore mouth [44]. The subsequent thermal treatment without H2S at 800 °C (under N2 atmosphere) does not give rise to significant changes in the BET surface area, i.e., there is a slight increase to 2148 m2/g but far away from the value obtained in the same temperature conditions, but using H2S (2692 m2/g) (Figure 1b,d). These findings confirm the promoting effect of H2S in the development of the porosity of PPAC1:3 samples, preferentially after a pre-oxidation treatment with plasma.
A similar tendency can be observed for the CO2 adsorption isotherms. While changes in the porous texture are minimal in the original PPAC1:3 sample after the thermal treatment with H2S (samples PPAC1:3x00), significant variations take place in the pre-oxidized samples. As described above for nitrogen, the plasma treatment becomes detrimental for the porous structure with a significant decrease in the narrow micropore volume (Vn). Either the porous network deteriorates after the plasma treatment or the presence of oxygen functionalities at the pore mouth alter the adsorption performance. However, a subsequent thermal treatment with H2S promotes the development of the narrow microporosity with a total narrow micropore volume close to 0.99 cm3/g in the sample PPAC1:3P800. Overall, these results confirm that a thermal treatment with H2S at high temperatures has a dual role in the carbon materials, i.e., to modify the surface chemistry (as will be shown below) and to promote the development of the porosity, preferentially in samples pre-oxidized in plasma conditions.
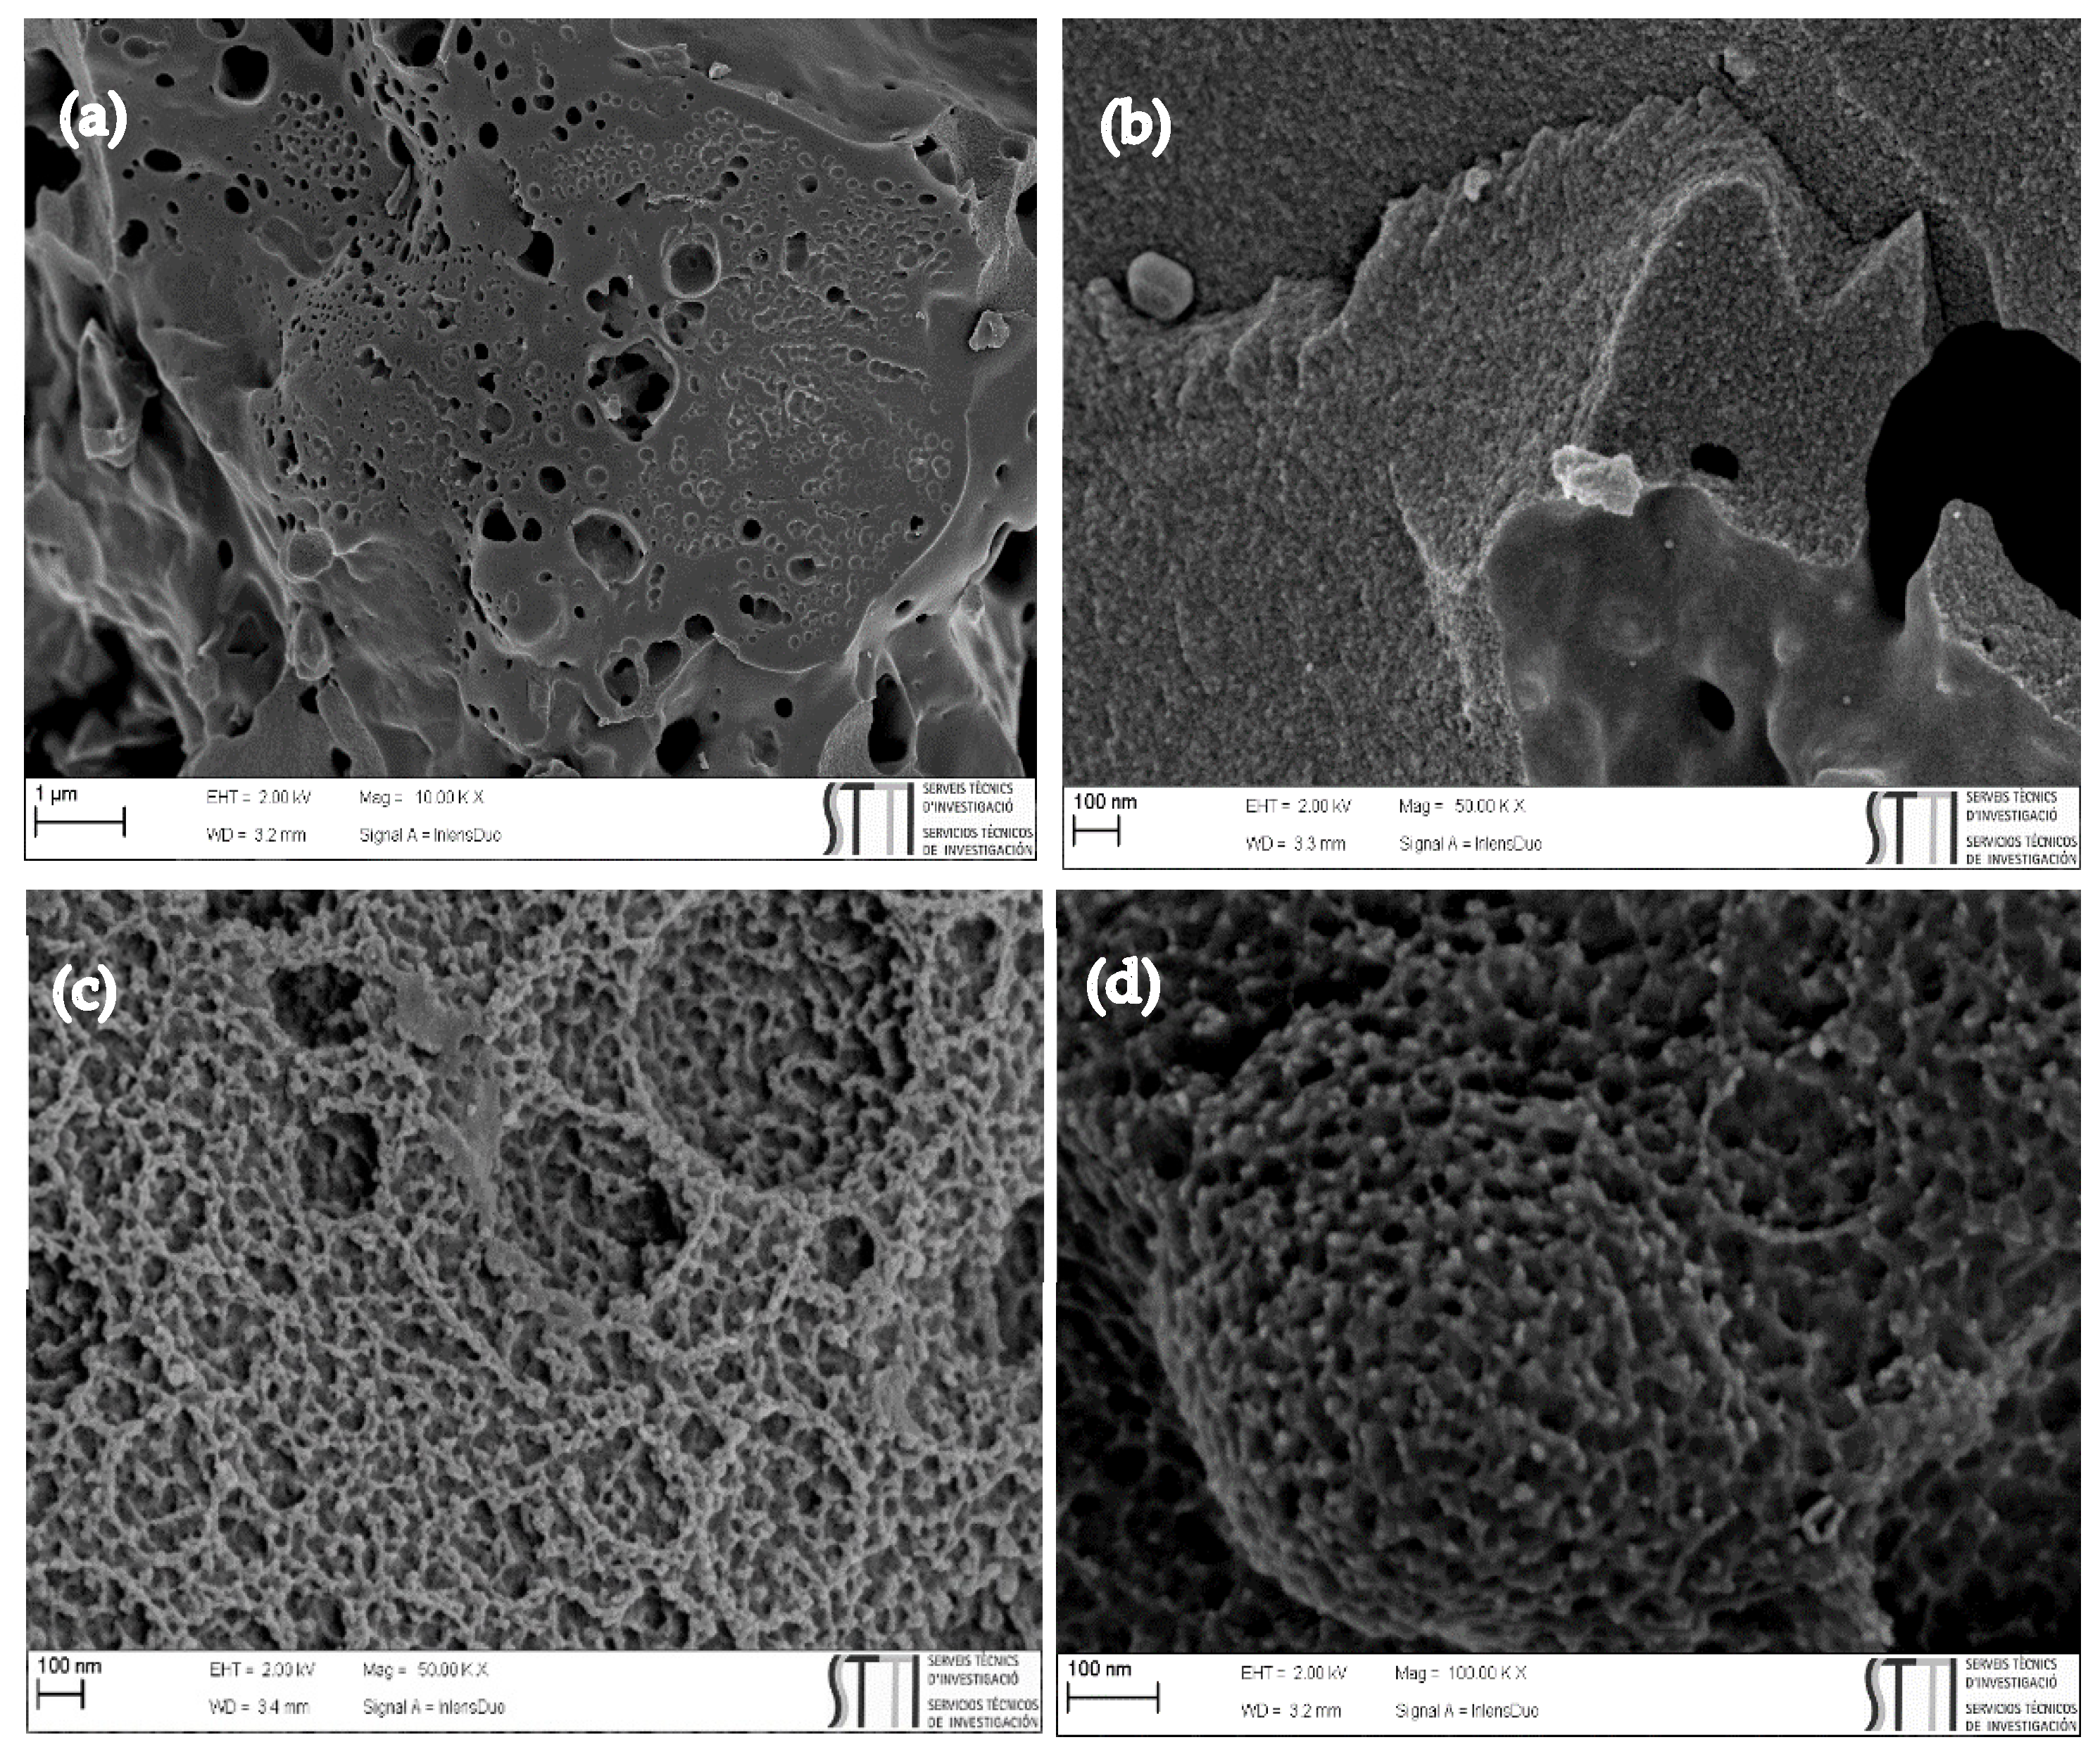
The morphology of the original and S-/O-co-doped activated carbons was evaluated using field-emission scanning electron microscopy (FESEM). Figure 2 shows some representative images of the samples treated at the highest temperature (800 °C), with and without plasma. As it can be appreciated, all carbons possess an amorphous morphology with large holes or cavities due to the removal of the KOH used during the activation step. Neither the plasma treatment nor the thermal treatment with H2S gives rise to appreciable changes in the morphology of the synthesized carbons.
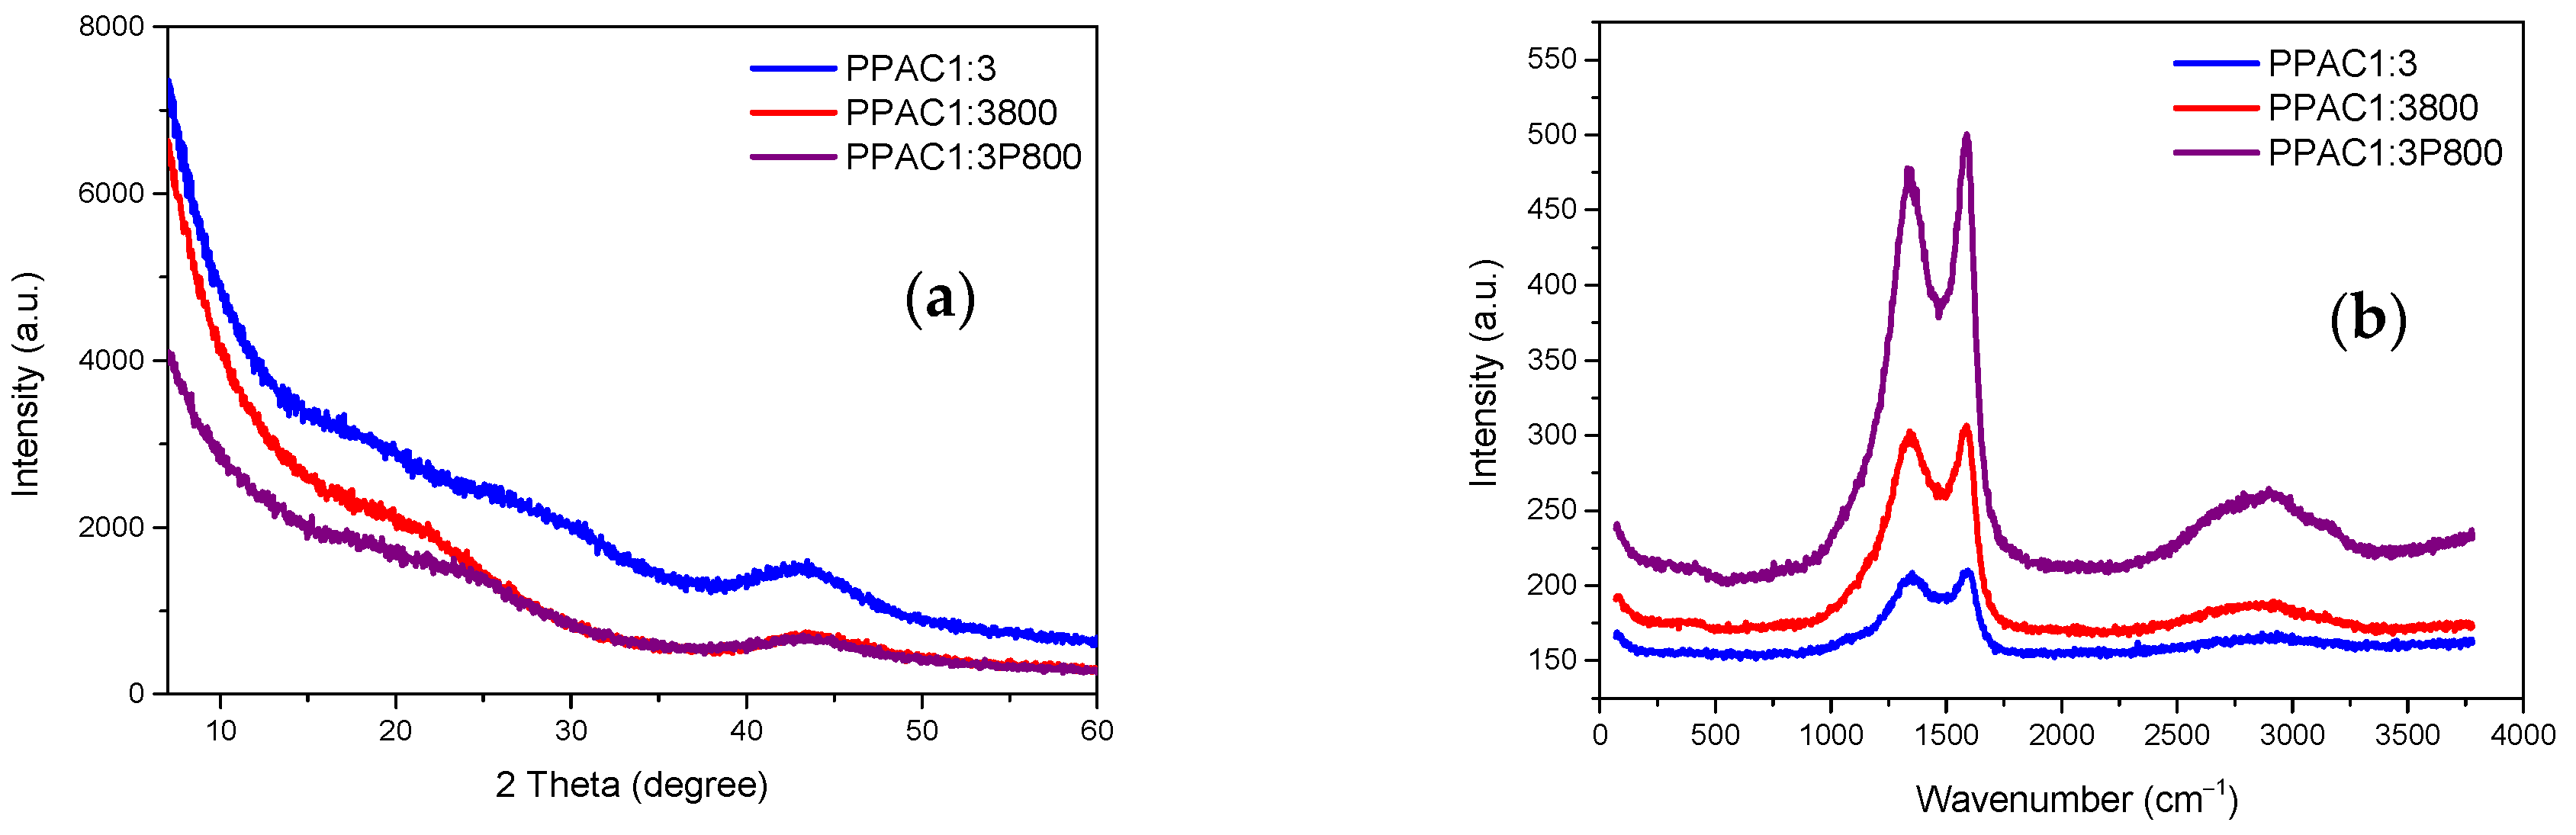
The crystallographic and vibrational characteristics of the synthesized carbon materials have been evaluated by means of X-ray diffraction and Raman spectroscopy measurements. Due to the similarity in the results obtained among the samples, only samples treated at the highest temperature (800 °C) were compared. As expected, all three samples evaluated are amorphous in nature with a broad XRD signal with maxima at 20–30° and 45°. These contributions resemble the (002) and (100) reflections of graphite and must be associated with the stacking of graphite layers and the in-plane structures of graphitic crystallites (Figure 3a). The Raman spectra for the three samples are dominated by two intense bands at 1605 and 1350 cm−1, attributed to vibrational modes of sp2- and sp3-bonded carbon atoms. More specifically, the first band corresponds to the C-C bond stretching of pairs of sp2 carbon atoms with E2g symmetry, and the second band corresponds to the lattice breathing mode with A1g symmetry. It is well-known in the literature that the intensity ratio ID/IG provides useful information about the degree of the structural disorder. This ratio is rather similar for the three samples evaluated (ID/IG: 0.99, 0.98, and 0.95 for PPAC1:3, PPAC1:3800, and PPAC1:3P800, respectively). Only a slight decrease in the ID/IG ratio is appreciated after the plasma treatment and/or after the thermal treatment with H2S, most probably associated with a certain graphitization of the samples at these high temperatures. The higher graphitic characteristics after the different H2S treatments are also reflected in the second order Raman line at 2700 cm−1, with a significant increase in the sample PPAC1:3P800, as appreciated in Figure 3b.
3.2. Evaluation of the Surface Chemistry
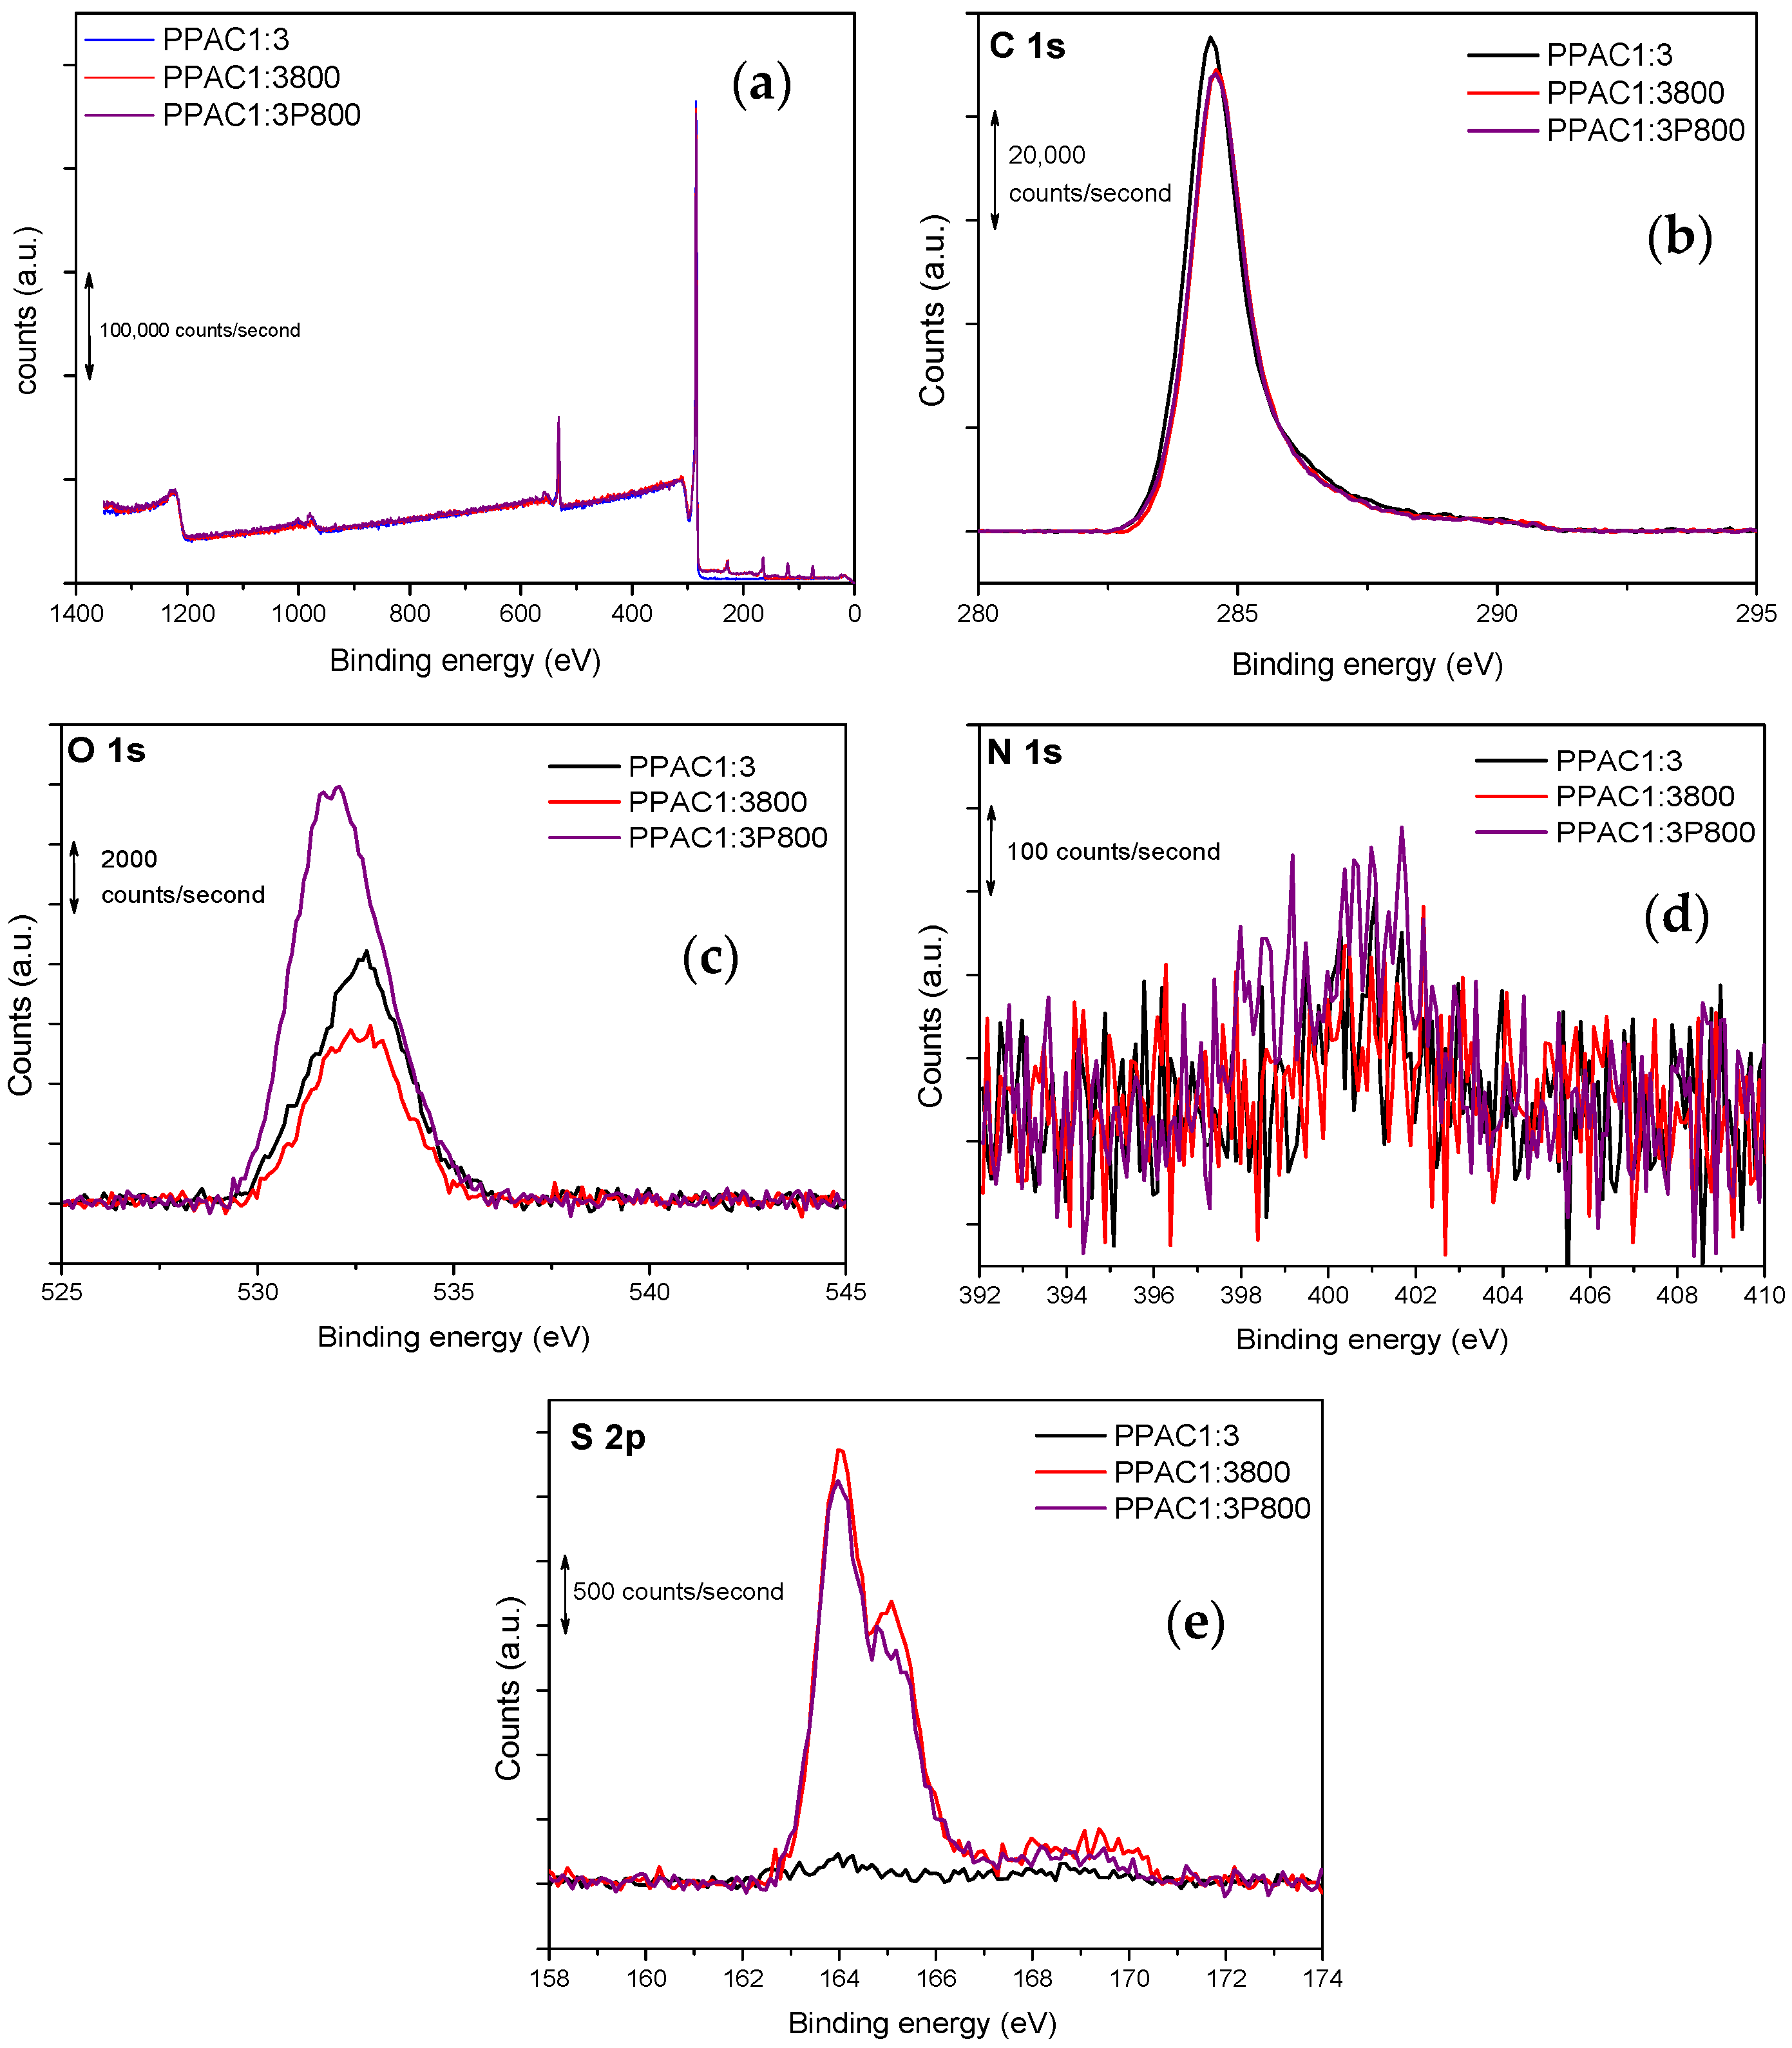
Both the porosity and the surface chemistry influence the adsorption characteristics of activated carbons. Typically, surface functional groups are bound to aromatic sheet edges and corners. The surface behavior of carbon relies on the size and form of graphene sheets, the existence and position of surface functionalities, and π-electrons. X-ray photoelectron spectroscopy (XPS) examination enables us to determine the elemental composition of the surface layers of the synthesized activated carbons (with an analytical depth of about 10–12 nm) and the nature of the surface species. Figure 4 shows some representative XPS spectra obtained for the samples treated at 800 °C. The XPS survey demonstrates that heteroatoms have been effectively incorporated into porous carbons (preferentially sulfur and oxygen).
The quantification of the percentages of C, O, N, and S from the XPS data are summarized in Table 2. The original petroleum pitch-based activated carbon does not have rich surface chemistry. In fact, oxygen content does not exceed 5.5 at. % and the sulfur and nitrogen content are very small (0.19 at. % and 0.30 at. %, respectively). As expected, the plasma treatment increases the number of oxygen functionalities up to 21 at. %. For both series of samples (oxidized and non-oxidized), the subsequent thermal treatment with H2S gives rise to a reduction in the amount of oxygen functional groups at the expense of sulfur functionalities. Oxygen content after the H2S treatment is around 4.5 at. % for the non-oxidized samples and around 9.50 at. % for the oxidized samples. On the contrary, sulfur content increases from 0.19 at. % in the original PPAC1:3 sample up to 2.5 at. % and 2.2 at. % for samples PPAC1:3800 and PPAC1:3P800, respectively. Nitrogen content is relatively small in all samples with values around 0.3 at. % for the non-oxidized samples and ca. 0.5 at. % for the plasma-treated samples.
A careful analysis of the XPS core levels for C1s, O1s, N1s, and S2p is reported in Figure 4. Due to the similarity between the XPS spectra of the synthesized samples, it is important to mention that only the spectra for samples PPAC1:3800 and PPAC1:3P800 are deconvoluted, as shown in Figure S1 (in Supplementary Materials). The XPS spectra of the C1s give rise to a wide contribution in the 283–291 eV range in all samples. In the case of the C1s peak, four contributions can be deconvoluted in both samples, with the primary contribution at 284.6 eV and three declining shoulders at 285.8, 287.1, and 289.4 eV. According to the literature, the main contribution corresponds to C-C and C=C bonds, while the shoulders must be attributed to C-N or C-S at 285.8 eV, C=O at 287.1 eV, and O-C=O at 289.4 eV [45,46]. The XPS spectra of O1s were deconvoluted in three main contributions at 531.75, 533.0, and 534.5 eV. Previous studies described in the literature have assigned these groups to the carbonyl oxygen of quinones (C=O at 531.0–531.9 eV), and carbonyl oxygen atoms in esters, anhydrides, and oxygen atoms in hydroxyl groups (C-O at 532.3–532.8 eV) [47,48]. In the case of the sample PPAC1:3800, the N1s signal shows only one well-defined contribution at 400.5 eV, while the sample PPAC1:3P800 contains two contributions at 398.7 and 401.0 eV. These contributions correspond to pyridinic-N and pyrrolic/pyridinic-N functional groups, respectively [47]. However, their contributions are very small. Finally, the XPS S 2p for both samples was deconvoluted into two different sulfur species, the peak at 164–166 eV corresponding to C–S–C and the peak at 167–170 eV to C–SOx–C (x = 2, 3, 4), in the form of sulfate or sulfonate [45].
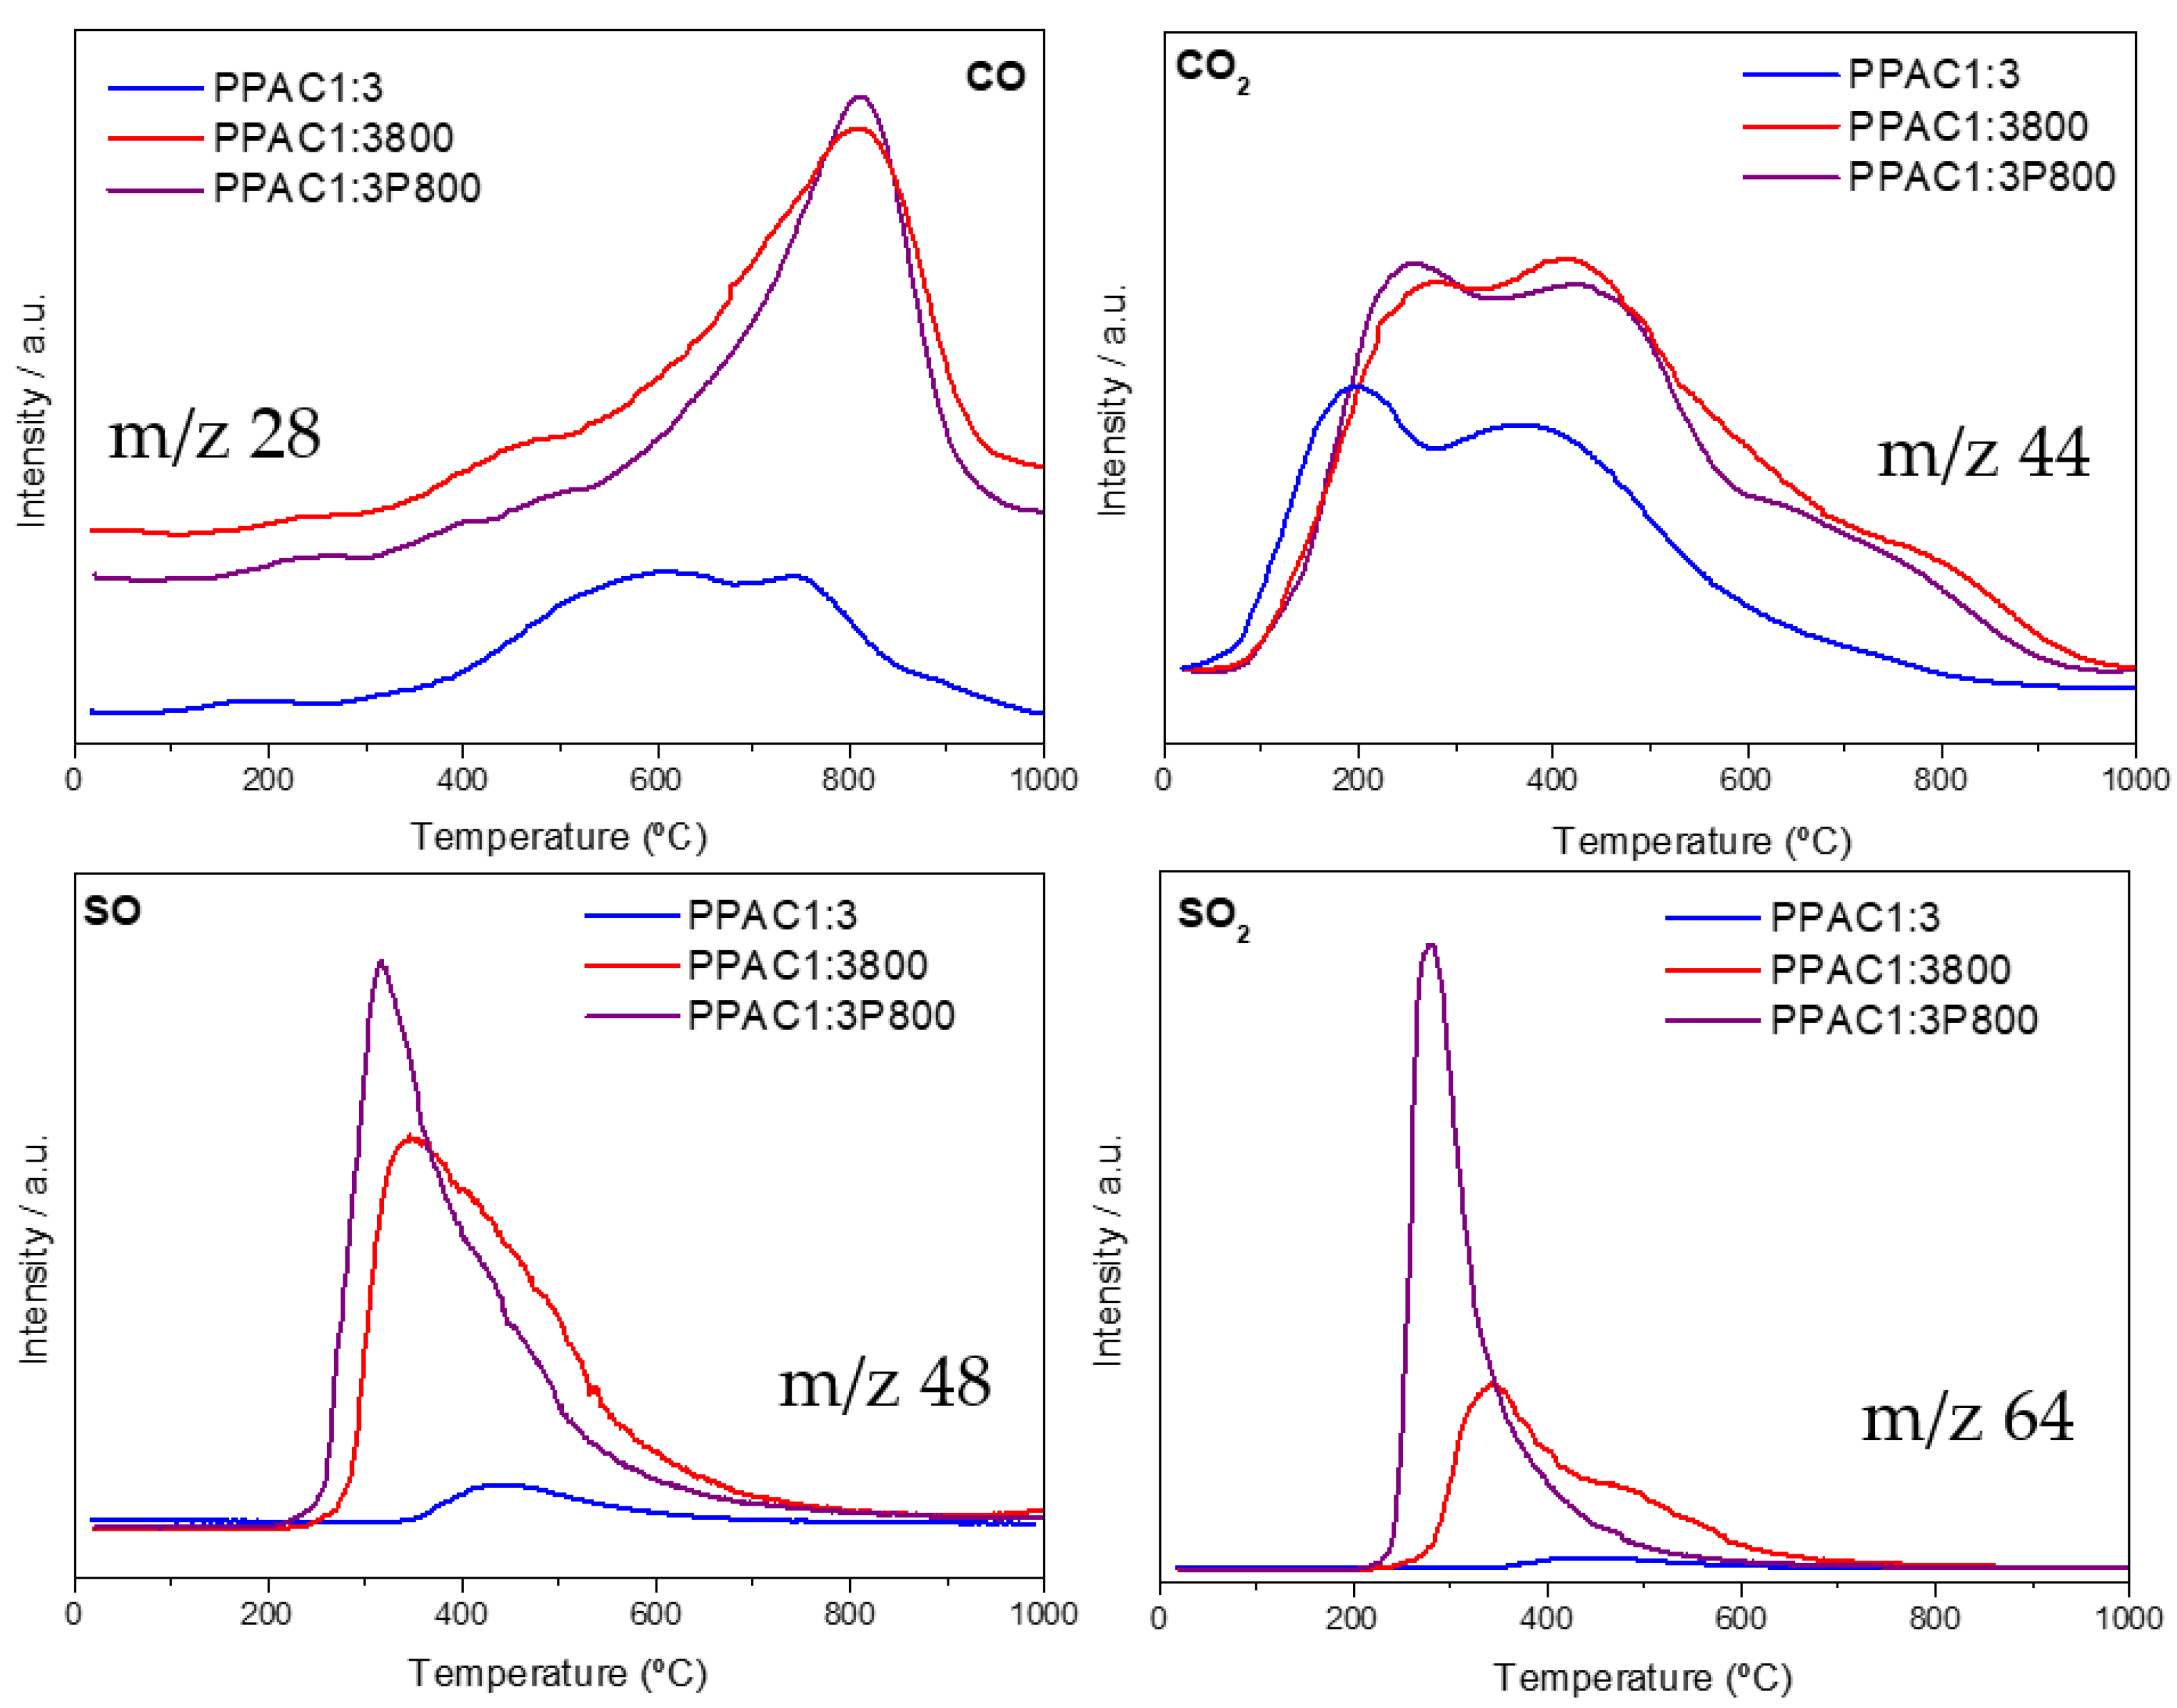
Another approach to evaluate the surface chemistry of the synthesized carbons was based on the analysis of the gases that evolved after a temperature-controlled decomposition treatment (TPD). Figure 5 shows the evolution profiles for carbon monoxide (CO, m/z 28), carbon dioxide (CO2, m/z 44), sulfur monoxide (SO, m/z 48), and sulfur dioxide (SO2, m/z 64) for the three representative samples up to 1000 °C in an inert atmosphere.
The TPD profile for CO shows a broad contribution in the temperature range of 400–1000 °C due to the decomposition of the basic and neutral functional groups, such as quinones, ethers, carbonyls, anhydrides, and phenols [49]. This profile is rather broad for the original PPAC1:3 carbon, while sharp and well-defined peaks can be appreciated for the modified samples (PPAC1:3800 and PPAC1:3P800); these contributions are slightly shifted to higher temperatures (maximum at 800 °C). A similar scenario takes place for CO2 with similar profiles for the three samples. In all cases, there is a broad decomposition profile with two well-defined maxima at 250 °C and 450 °C, attributed to the decompositions of the more acidic oxygen functional groups, e.g., carboxylic groups or lactone groups, and a shoulder above 600 °C (for the modified carbons). These results confirm that the synthesized samples exhibit a wide variety of oxygen functional groups, both acidic and basic functionalities, with the amount of these groups being higher for the H2S-treated samples [50].
The nature of the sulfur-containing functionalities on the representative samples was also studied using TPD. In this case, the TPD profiles are highly sensitive to the thermal treatment suffered. The SO and SO2 profiles (m/z 48 and 64) exhibit sharp peaks at 280 °C, the intensity of these peaks being larger for sample PPAC1:3P800. This observation is in close agreement with the amount of sulfur quantified by XPS measurements. This contribution could be attributed to the decomposition of C-SO2-C and C-SO-C groups [51]. The TPD profile is rather similar to sample PPAC1:3800, although the peaks have lower intensity and are slightly broader (an additional contribution appears at around 500 °C). The additional shoulder at a high temperature must be linked to the heterogeneity of the sulfur species and their existence as sulfoxides, sulfones, and thioesters [1].
3.3. Gas Adsorption Isotherms at Atmospheric and High Pressure
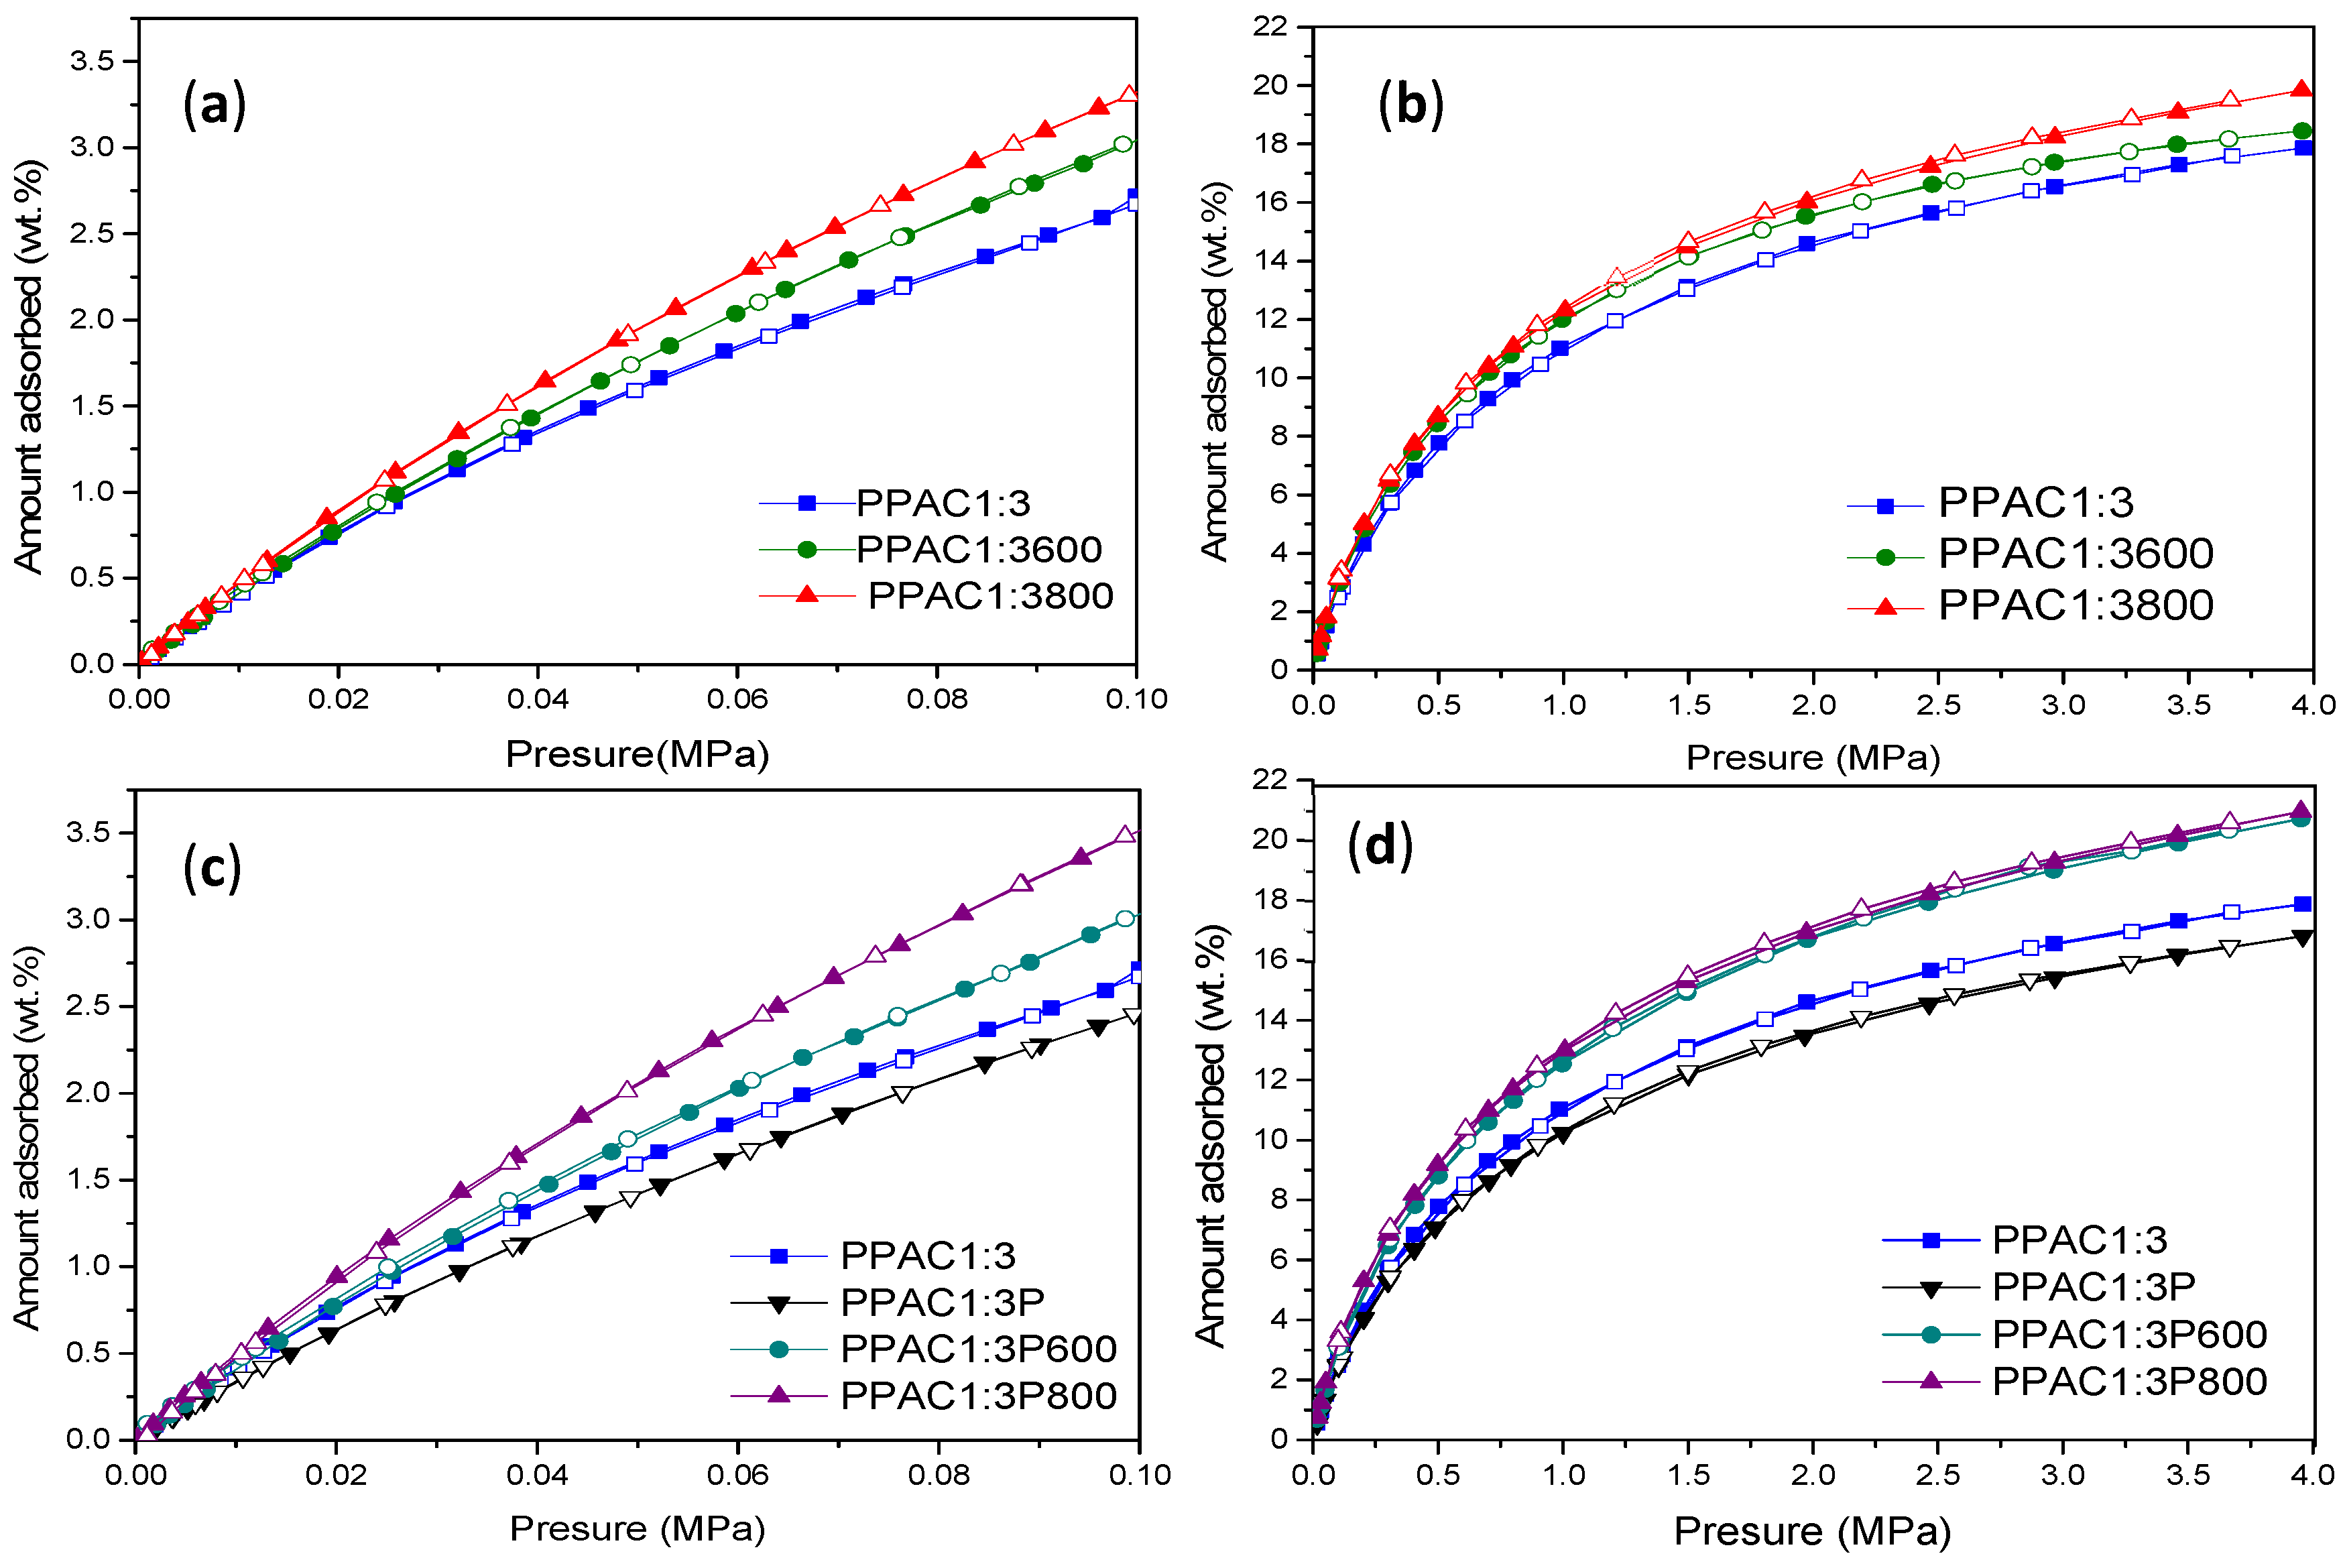
In a final step, the adsorption performance of the sulfur-doped samples has been tested for two different probe molecules, CO2 and CH4. Figure 6 and Figure 7 compare the adsorption performances at atmospheric and high pressure for both series of samples, PPAC1:3 and PPAC1:3P. As described above in the textural characterization section, plasma-treated samples exhibit larger differences in the adsorption performance among samples due to the combined effects of an improved 3D network and richer surface chemistry.
3.3.1. Adsorption of CO2 at Atmospheric Pressure and High Pressure
Figure 6 shows the CO2 isotherms at atmospheric and high pressure for the H2S-treated samples (oxidized and non-oxidized). In general, the adsorption performance of the synthesized samples is very good with values as high as 1100–1200 mg/g at 4 MPa for H2S-treated samples [24,25]. This excellent performance is mainly attributed to a highly developed porous structure upon the H2S treatment, although some contributions from the surface functionalities cannot be ruled out at this point. Even at atmospheric pressure (0.1 MPa), the amount adsorbed at 25 °C (ca. 210 mg/g) is much higher than that reported in the literature for S-/N-co-doped activated carbons prepared using KOH as the activating agent [52,53]. As expected, the adsorption performance is rather similar for the non-oxidized samples both at low and high pressures, due to their similar porous structure. The excess uptake for non-oxidized samples reaches up to 1040 mg/g at 4.0 MPa.
These results anticipate that the effect of the surface chemistry, if any, must be rather small. For the oxidized samples the differences in the adsorption uptake among samples are much larger, in close agreement with the N2 adsorption data described above. Overall, these results confirm that the adsorption performances of the S- and O-/S-modified carbon materials are mainly defined by the porous structures with an upper uptake as high as 1160 mg/g at 25 °C and 4 MPa for the plasma-treated samples. In any case, the thermal treatment with H2S has a promoting effect, i.e., sample PPAC1:3800 has 14% and sample PPAC1:3P800 has 26% higher adsorption capacity than the original sample (PPAC1:3) at atmospheric pressure. These results are among the best described in the literature for CO2 adsorption under mild-pressure conditions (adsorption values are reported in Table 3) [54].
3.3.2. Adsorption of CH4 at Atmospheric Pressure and High Pressure
In a similar manner, excess CH4 adsorption has been measured both at atmospheric and high pressure for the non-oxidized and oxidized samples. In the case of methane, differences in the total uptake are significant for both sets of samples, although much larger for plasma-treated samples. In both cases, the thermal treatment with H2S gives rise to a significant improvement in the CH4 uptake (25% and 44% improvement at atmospheric pressure and 10% and 25% at high pressure, for non-oxidized and oxidized samples, respectively). The excess uptake at 4 MPa reaches values as high as 20–21 wt.%. These values are again among the best reported in the literature and perfectly correlate with the excellent textural properties of the synthesized samples [55].
The amount of methane adsorbed at atmospheric and at high pressure in the evaluated samples is reported in Table 4.
3.3.3. Effect of the Porous Structure
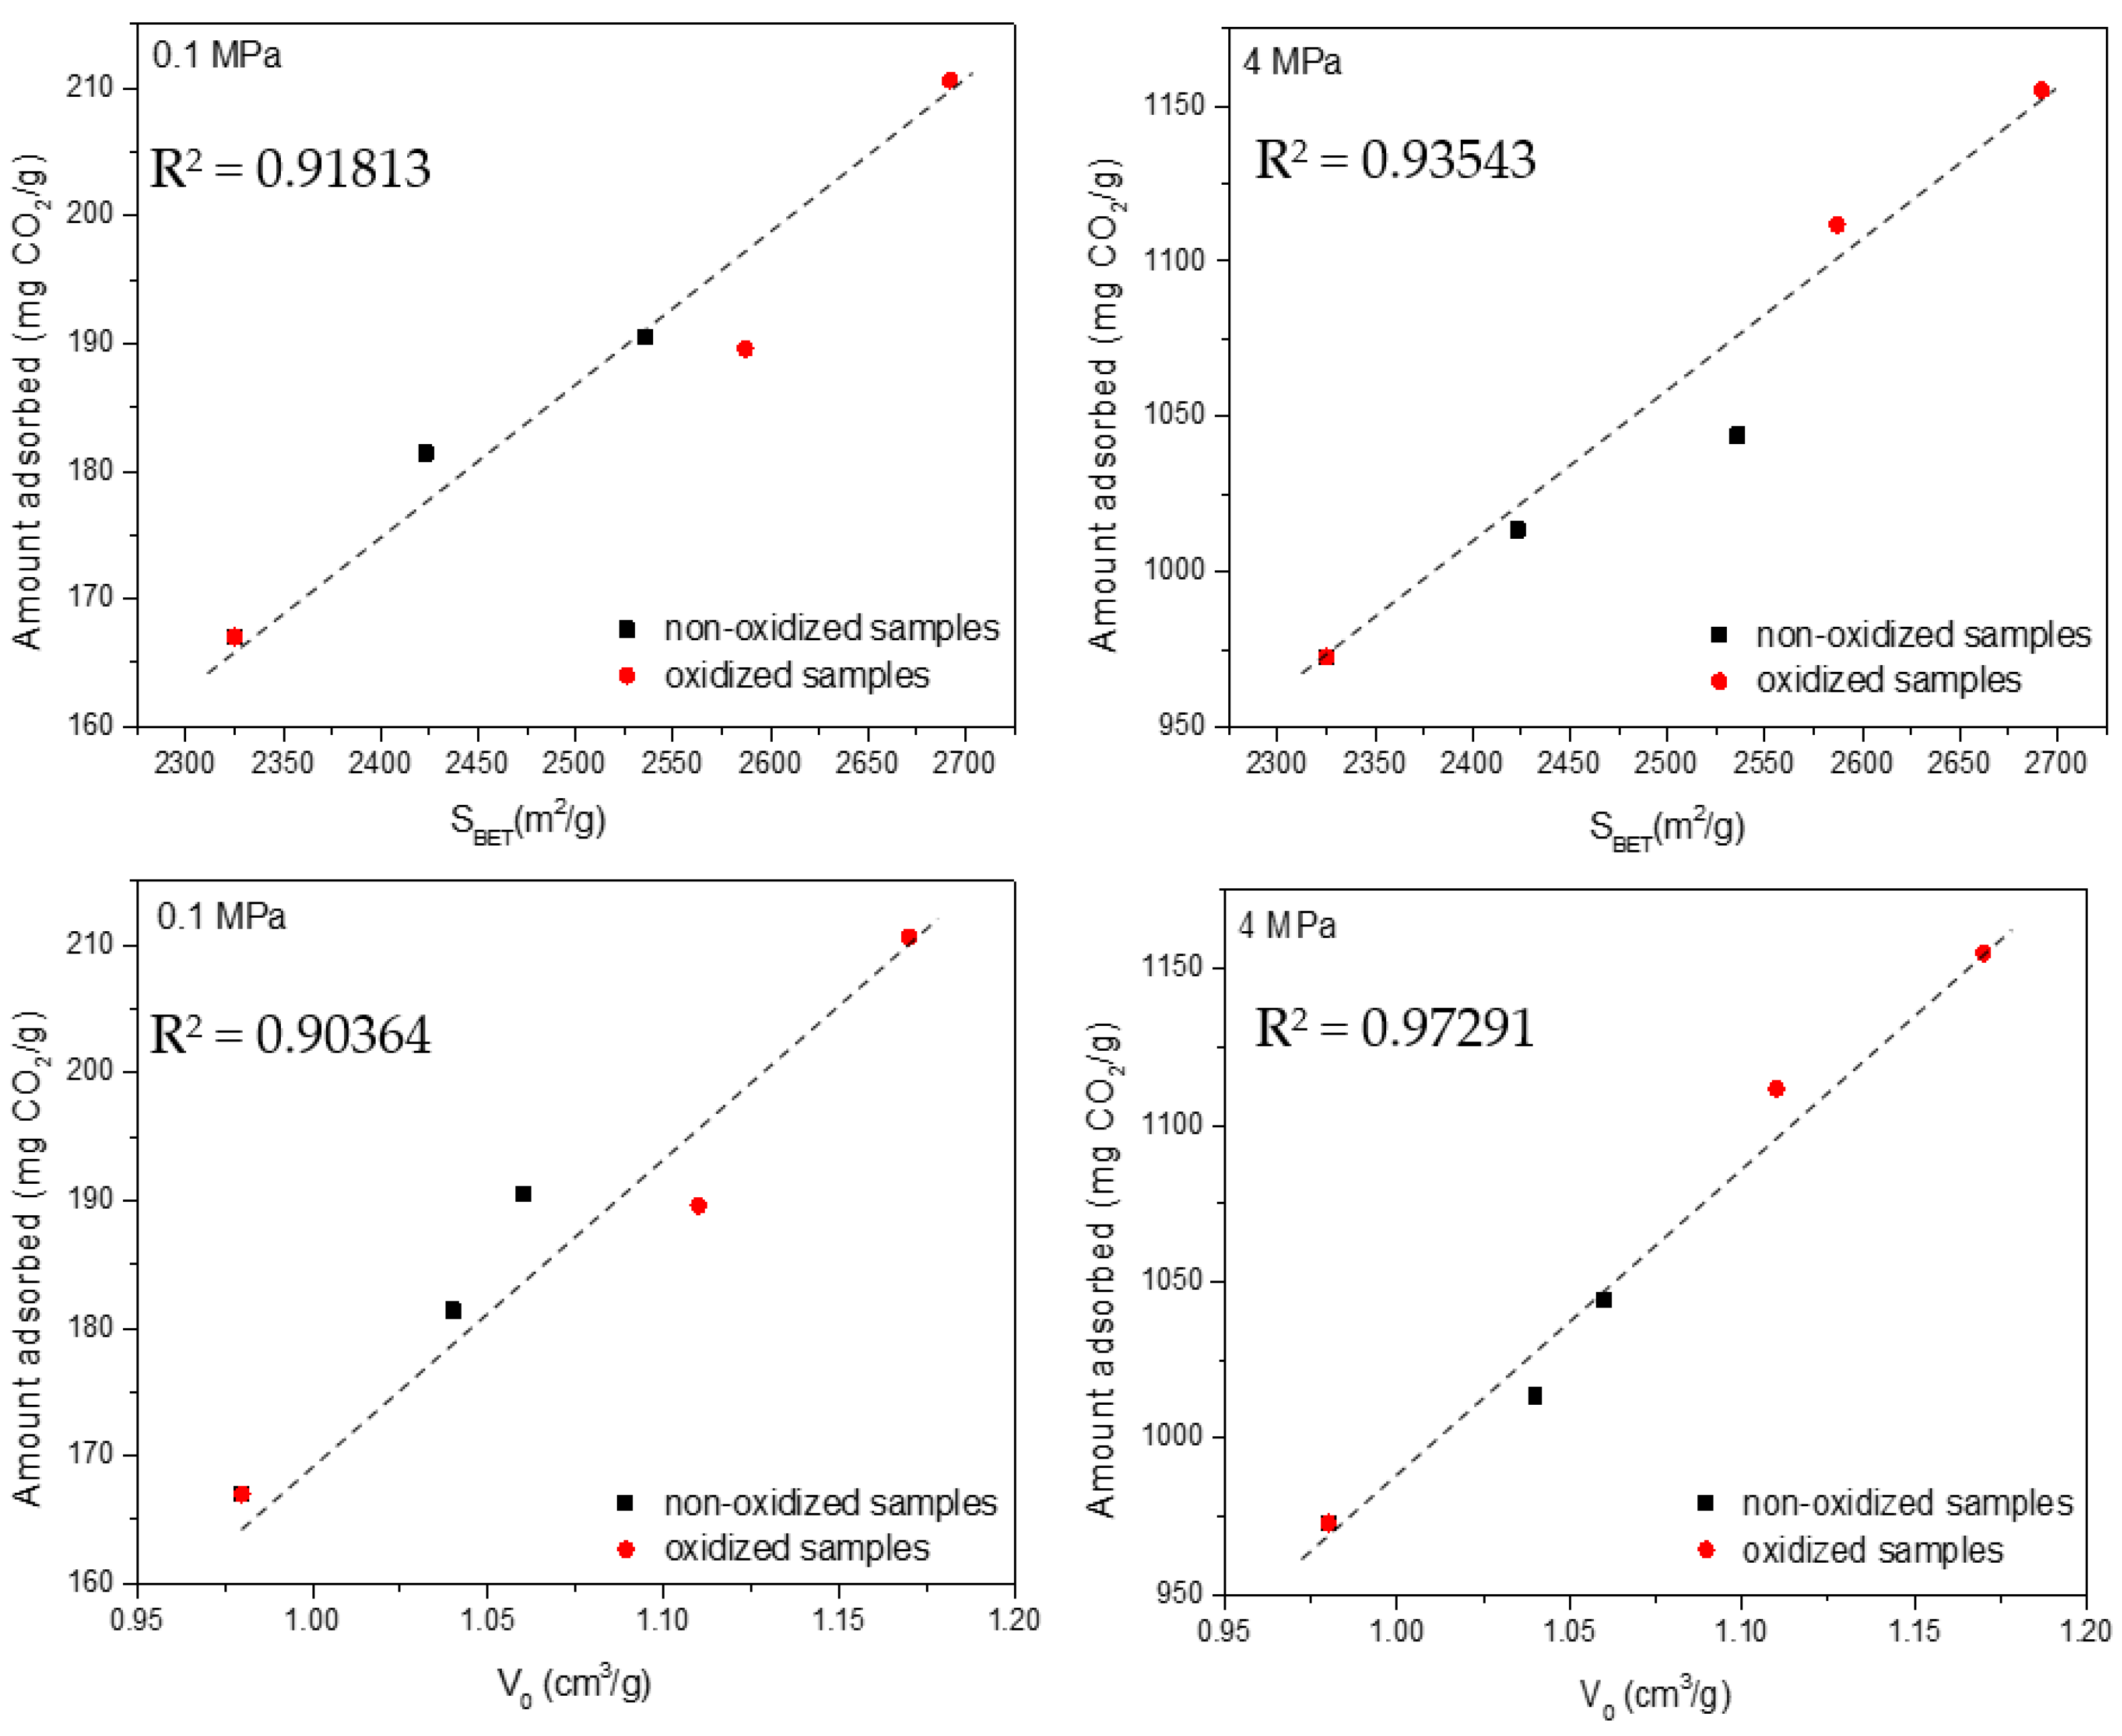
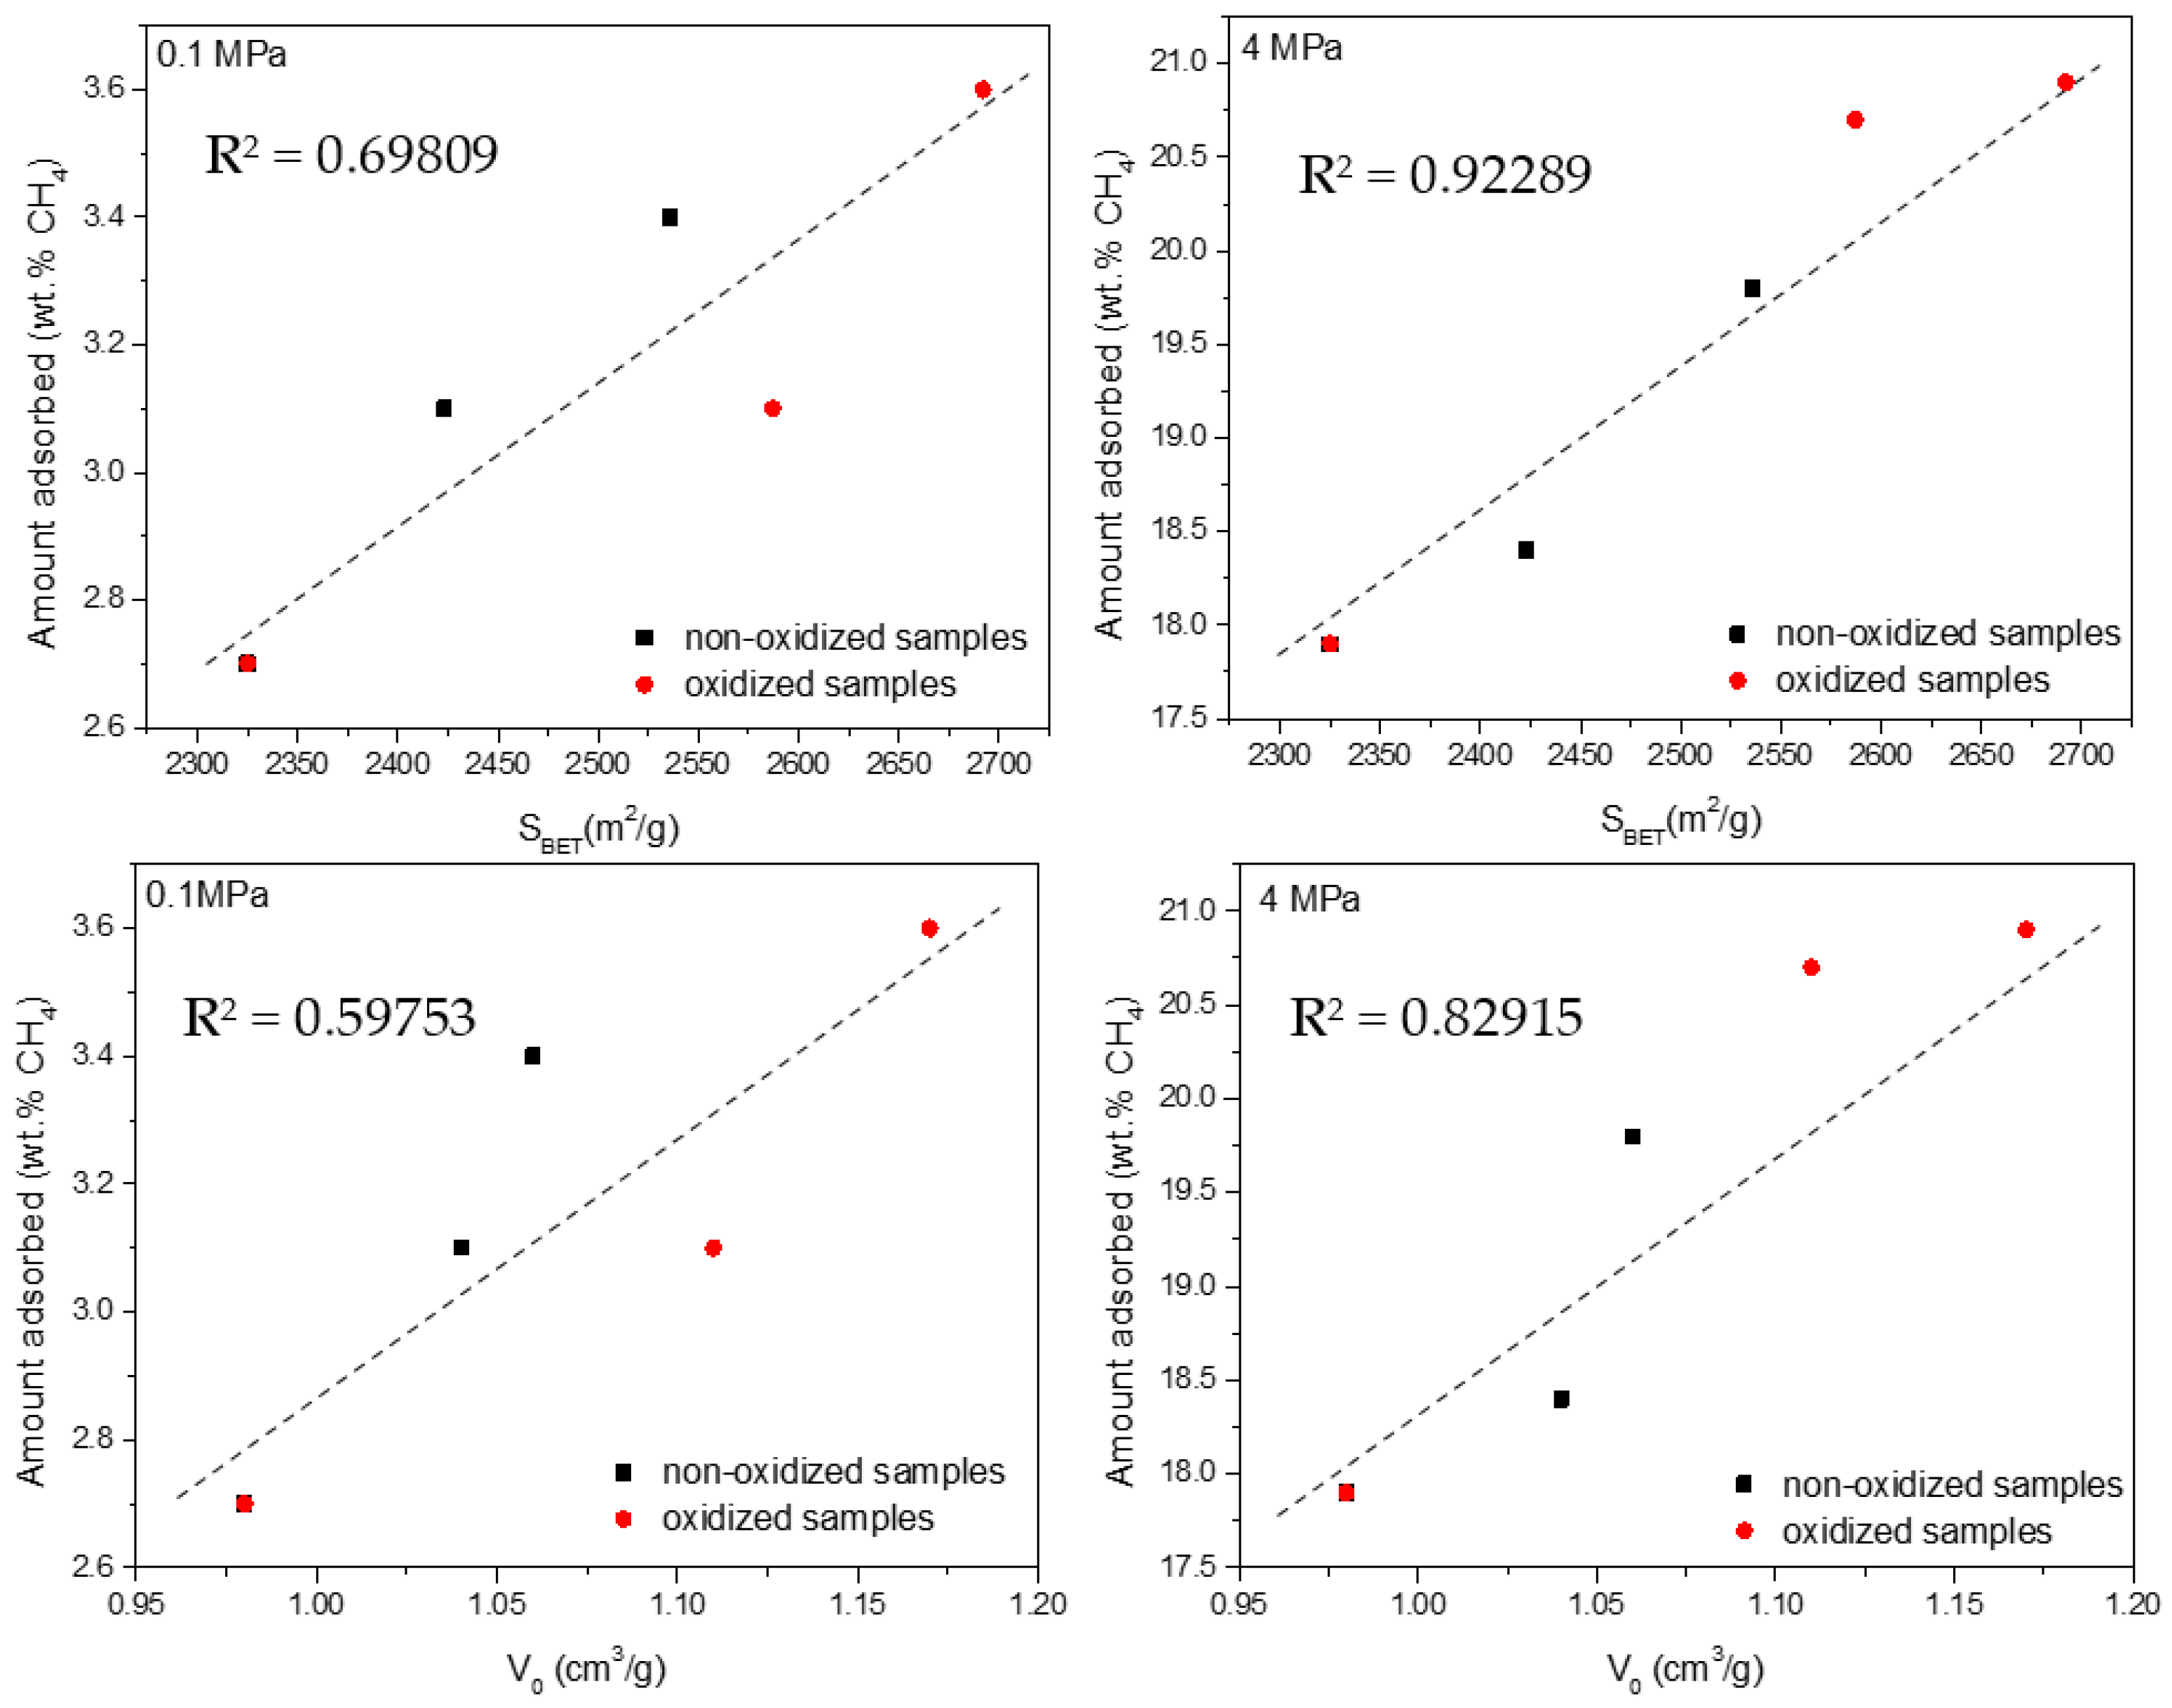
To identify the role of the porous structure in both adsorption processes, the amounts adsorbed for CO2 and CH4 at both low and high pressures were correlated with the BET surface area and the total micropore volume (V0). Previous studies described in the literature have anticipated that the porous structure is the main parameter defining the adsorption of these two probes evaluated [24,25,55,56]. The complexity of H2S-modified samples is due to the combined effect of the porous structure and surface chemistry in a single carbon network. To give more insight into the adsorption process, these two variables will be evaluated separated.
In the specific case of CO2, Figure 8 shows a relatively good agreement (coefficient of determination R2 above 0.90) between the total uptake and the main textural parameters for both sets of samples and at the two evaluated conditions (low- and high-pressures). These findings are in close agreement with the crucial role exhibited by micropores and small mesopores for CO2 adsorption in carbon materials [24,25]. Presser et al. anticipated that small micropores govern the adsorption performance at atmospheric pressure, while Casco et al. identified large micropores and small mesopores as responsible for the high-pressure adsorption process. For CH4 adsorption at atmospheric and high pressure, the correlations are not straightforward (Figure 9). In general, the agreement between the amount adsorbed and the textural parameters is quite poor, except for the measurements at high pressure (4 MPa). Under these specific conditions, there is a good agreement between the excess amount adsorbed and the BET surface area. These results suggest that the amount of methane adsorbed at atmospheric pressure does not scale with the main textural parameters (neither micropore volume nor apparent surface area). Only at high pressure (4 MPa) does the porous structure (microporosity and mesoporosity) seem to govern the excess uptake for methane (coefficient of determination R2 above 0.8–0.9). In a last attempt to understand methane adsorption at 0.1 MPa, Figure S2 compares the total uptake with the volume of narrow micropores (Vn, those below 1 nm). In this specific case, the agreement is very good, i.e., narrow cavities (<1 nm) define the adsorption performance for CH4 at 0.1 MPa. Moreover, the narrow micropore volume (Vn) correlates relatively well with the amount of CO2 adsorbed at atmospheric pressure (Figure S3). In summary, narrow micropores define the adsorption performance for CO2 and CH4 at atmospheric pressure, whereas under high-pressure conditions (4 MPa), the BET surface area defines the adsorption performance for methane (micropores and small mesopores) and the total micropore volume governs the adsorption of CO2.
3.3.4. Effect of Surface Chemistry
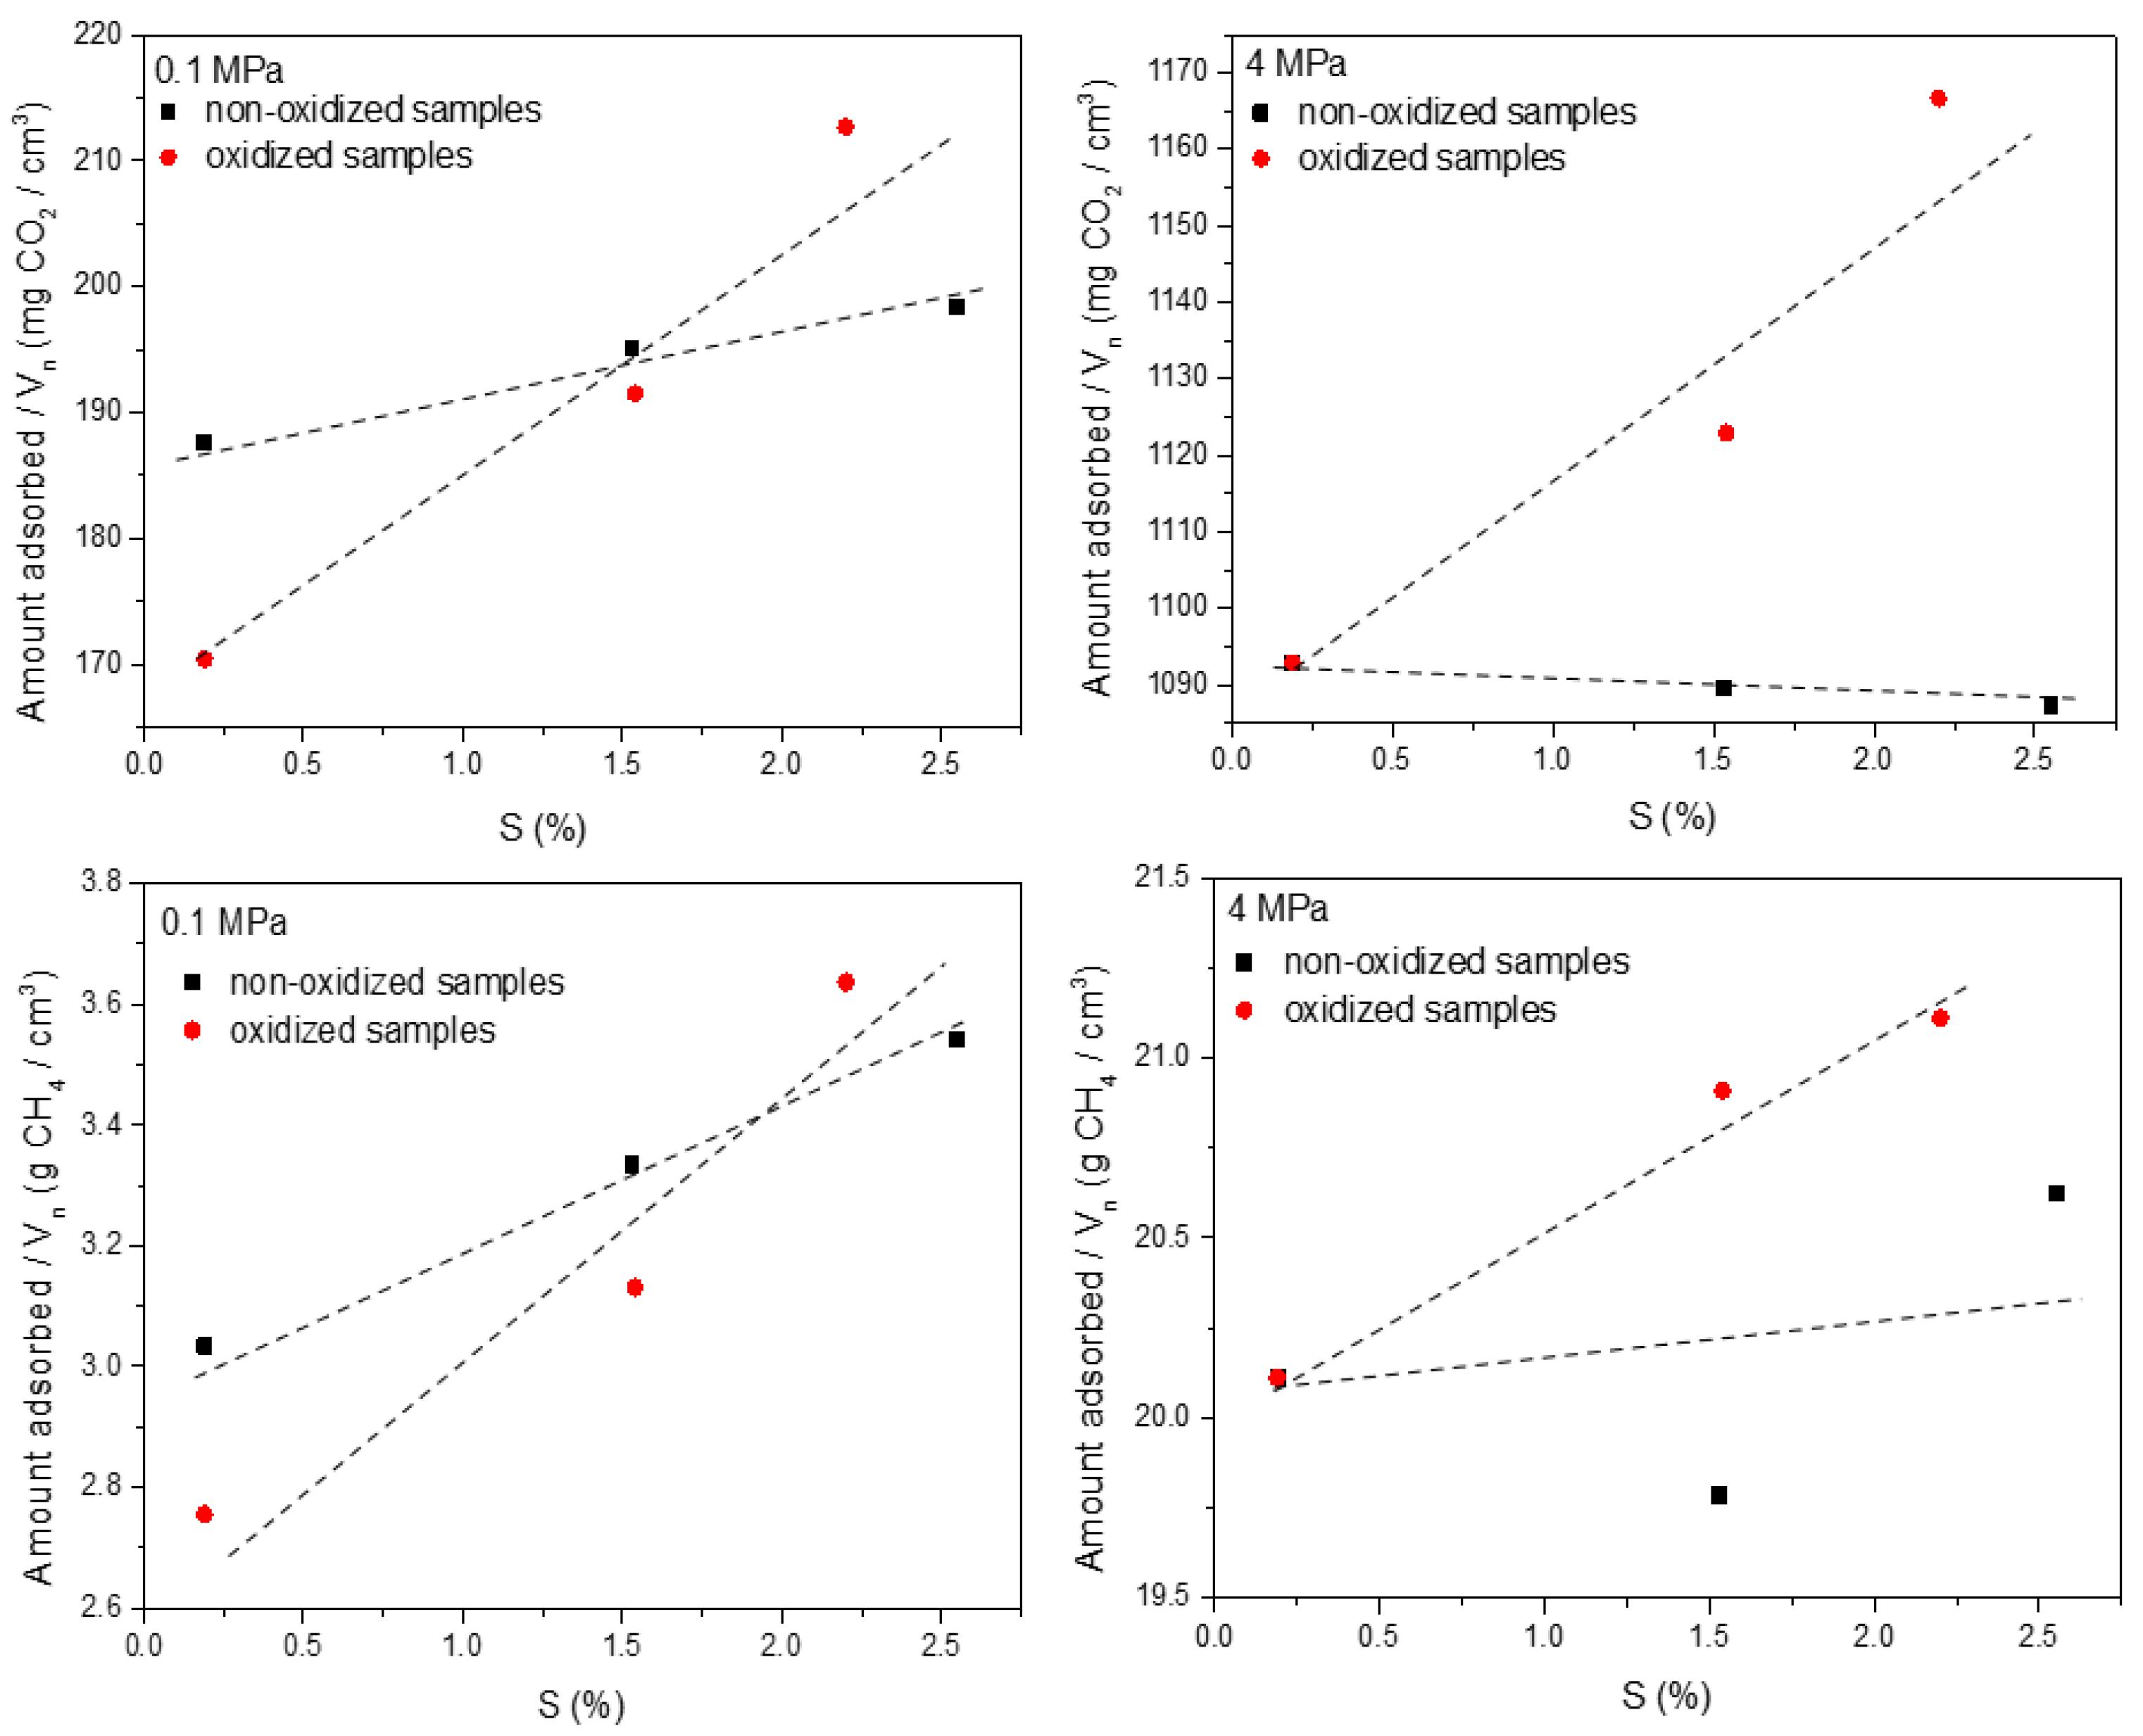
The identification of the effect exerted by the surface chemistry is much more difficult due to the predominant effect of the porous structure in the adsorption process. To identify the isolated effect of surface functional groups, recent studies from Sanchez-Sanchez et al. proposed the normalization of the uptake by the main textural parameter defining the adsorption process [57]. In the specific scenario of H2S-treated activated carbons, the narrow micropore volume (Vn) can be anticipated, a priori, as the most significant parameter for the normalization step. Figure 10 shows the normalized uptake (mg/cm3) for the different samples evaluated as a function of the atomic percentage of sulfur estimated from the XPS data.
As seen in Figure 10, the identification of the effect of the surface chemistry in the adsorption process is not straightforward. Correlations highly depend on the final pressure applied and the presence of additional functionalities (e.g., oxygen surface groups after the plasma treatment). The best fittings are obtained at atmospheric pressure (0.1 MPa). Under these conditions, the correlations anticipate a certain positive effect of the surface chemistry, although very small, for both probes, either for non-oxidized or oxidized samples. This positive effect is more pronounced for oxidized samples most probably due to the synergic effect between sulfur and oxygen functionalities. This observation is in close agreement with the higher sensitivity of the gas–solid interactions at lower pressures. Under high-pressure conditions, the definition of a clear statement is not easy for CH4. For CO2, one could argue a certain effect of the surface chemistry, i.e., negative effect for non-oxidized samples and positive for oxidized samples, most probably due to the presence of the oxygen surface groups. However, in the case of CH4 at high pressure, no clear tendencies can be appreciated, most probably reflecting the absence of clear effects of the surface chemistry in the methane adsorption process. In any case, these observations must be considered carefully due to the scarce effect of the surface chemistry (the adsorption process is mainly governed by the porous structure), and the intrinsic uncertainty in the estimation of the sulfur and oxygen content (previous studies from our group have anticipated that in highly heterogeneous samples such as these plasma-treated and H2S-treated samples, the surface chemistry largely differs for different sample positions) [42].
4. Conclusions
Two series of sulfur-doped and sulfur/oxygen-co-doped activated carbon materials were successfully prepared from a petroleum pitch-based activated carbon material (PPAC1:3). Sulfur functionalities were incorporated through a thermal treatment with H2S at high temperatures (600 °C and 800 °C) in the original (PPAC1:3) and plasma-treated samples (PPAC1:3P). Characterization results show that the thermal treatment with H2S highly improves the porous structure, preferentially in plasma-treated samples, and the surface chemistry (preferentially sulfur and oxygen functionalities). The synthesized activated carbons are among the most promising candidates reported in the literature for high-pressure methane and CO2 storage. The excellent adsorption performance is attributed to the presence of a highly developed porous structure combining narrow and wide micropores. Narrow micropores govern the adsorption performance for methane and CO2 at atmospheric pressure, while wider micropores and small mesopores are needed for high pressure. Concerning the role of the surface chemistry, the scenario is more complex. Although some trends can be anticipated for sulfur-doped carbons, care must be taken due to the heterogeneity in the oxygen and sulfur content in these kinds of samples.
Supplementary Materials
The following supporting information can be downloaded at: https://0-www-mdpi-com.brum.beds.ac.uk/article/10.3390/c8030041/s1, Figure S1: Deconvoluted XPS spectra in the (a) C1s, (b) O1s, (c) N1s, and (d) S2p region for the samples PPAC-800 (up) and PPAC-P-800 (down); Figure S2: Correlation between the narrow micropore volume (Vn) and the excess amount adsorbed for CH4 at atmospheric pressure; Figure S3: Correlation between the narrow micropore volume (Vn) and the excess amount adsorbed for CO2 at atmospheric pressure
Author Contributions
Conceptualization, J.S.-A.; methodology, S.R. and J.S.-A.; investigation, S.R.; formal analysis, S.R. and M.M.-E.; writing—original draft preparation, S.R. and J.S.-A.; supervision, J.S.-A. and M.M.-E.; project administration, J.S.-A.; funding acquisition, J.S.-A. All authors have read and agreed to the published version of the manuscript.
Funding
This research was funded by MCIN, and NATO. The authors would like to acknowledge financial support from the Ministerio de Ciencia e Innovación—MCIN (projects PID2019-108453GB-C21, MCIN/AEI/10.13039/501100011033 and EU “NextGeneration/PRTR” (project PCI2020-111968/3D-Photocat)), and NATO SPS program (project G5683).
Institutional Review Board Statement
Not applicable.
Informed Consent Statement
Not applicable.
Data Availability Statement
Not applicable.
Conflicts of Interest
The authors declare no conflict of interest.
References
- Seredych, M.; Jagiello, J.; Bandosz, T.J. Complexity of CO2 Adsorption on Nanoporous Sulfur-Doped Carbons–Is Surface Chemistry an Important Factor? Carbon 2014, 74, 207–217. [Google Scholar] [CrossRef]
- Ramanathan, V.; Xu, Y. The Copenhagen Accord for Limiting Global Warming: Criteria, Constraints, and Available Avenues. Proc. Natl. Acad. Sci. USA 2010, 107, 8055–8062. [Google Scholar] [CrossRef] [PubMed]
- Peters, G.P.; Andrew, R.M.; Canadell, J.G.; Fuss, S.; Jackson, R.B.; Korsbakken, J.I.; Le Quéré, C.; Nakicenovic, N. Key Indicators to Track Current Progress and Future Ambition of the Paris Agreement. Nat. Clim. Chang. 2017, 7, 118–122. [Google Scholar] [CrossRef]
- Wang, B.; Zhang, X.; Huang, H.; Zhang, Z.; Yildirim, T.; Zhou, W.; Xiang, S.; Chen, B. A Microporous Aluminum-Based Metal-Organic Framework for High Methane, Hydrogen, and Carbon Dioxide Storage. Nano Res. 2021, 14, 507–511. [Google Scholar] [CrossRef]
- Angelidaki, I.; Treu, L.; Tsapekos, P.; Luo, G.; Campanaro, S.; Wenzel, H.; Kougias, P.G. Biogas Upgrading and Utilization: Current Status and Perspectives. Biotechnol. Adv. 2018, 36, 452–466. [Google Scholar] [CrossRef]
- Cozier, M. CCS Takes Centre Stage. Greenh. Gases Sci. Technol. 2019, 9, 1084–1086. [Google Scholar] [CrossRef]
- Wang, Q.; Luo, J.; Zhong, Z.; Borgna, A. CO2 Capture by Solid Adsorbents and Their Applications: Current Status and New Trends. Energy Environ. Sci. 2011, 4, 42–55. [Google Scholar] [CrossRef]
- Lozano-Castelló, D.; Alcañiz-Monge, J.; De La Casa-Lillo, M.A.; Cazorla-Amorós, D.; Linares-Solano, A. Advances in the Study of Methane Storage in Porous Carbonaceous Materials. Fuel 2002, 81, 1777–1803. [Google Scholar] [CrossRef]
- Sevilla, M.; Mokaya, R. Energy Storage Applications of Activated Carbons: Supercapacitors and Hydrogen Storage. Energy Environ. Sci. 2014, 7, 1250–1280. [Google Scholar] [CrossRef]
- Eberle, U.; Müller, B.; Von Helmolt, R. Fuel Cell Electric Vehicles and Hydrogen Infrastructure: Status 2012. Energy Environ. Sci. 2012, 5, 8780–8798. [Google Scholar] [CrossRef]
- Morris, R.E.; Wheatley, P.S. Gas Storage in Nanoporous Materials. Angew. Chem. Int. Ed. 2008, 47, 4966–4981. [Google Scholar] [CrossRef] [PubMed]
- Lee, J.Y.; Wood, C.D.; Bradshaw, D.; Rosseinsky, M.J.; Cooper, A.I. Hydrogen Adsorption in Microporous Hypercrosslinked Polymers. Chem. Commun. 2006, 25, 2670–2672. [Google Scholar] [CrossRef] [PubMed]
- Pera-Titus, M. Porous Inorganic Membranes for CO2 Capture: Present and Prospects. Chem. Rev. 2014, 114, 1413–1492. [Google Scholar] [CrossRef] [PubMed]
- Farrusseng, D. Metal-Organic Frameworks: Applications from Catalysis to Gas Storage; Willey VCH: Weinheim, Germany, 2011. [Google Scholar] [CrossRef]
- Ding, M.; Flaig, R.W.; Jiang, H.L.; Yaghi, O.M. Carbon Capture and Conversion Using Metal-Organic Frameworks and MOF-Based Materials. Chem. Soc. Rev. 2019, 48, 2783–2828. [Google Scholar] [CrossRef] [PubMed]
- Verma, G.; Kumar, S.; Vardhan, H.; Ren, J.; Niu, Z.; Pham, T.; Wojtas, L.; Butikofer, S.; Echeverria Garcia, J.C.; Chen, Y.S.; et al. A Robust Soc-MOF Platform Exhibiting High Gravimetric Uptake and Volumetric Deliverable Capacity for on-Board Methane Storage. Nano Res. 2021, 14, 512–517. [Google Scholar] [CrossRef]
- Siriwardane, R.V.; Shen, M.S.; Fisher, E.P.; Losch, J. Adsorption of CO2 on Zeolites at Moderate Temperatures. Energy Fuels 2005, 19, 1153–1159. [Google Scholar] [CrossRef]
- Marsh, H.; Rodríguez-Reinoso, F. Activated Carbon; Elsevier: Amsterdam, The Netherlands, 2006. [Google Scholar] [CrossRef]
- Bandosz, T.J. Surface Chemistry of Carbon Materials. In Carbon Materials for Catalysis; Serp, P., Figueiredo, J.L., Eds.; John Wiley Sons Inc.: Hoboken, NJ, USA, 2008; pp. 45–92. [Google Scholar] [CrossRef]
- Dashti, A.; Raji, M.; Azarafza, A.; Baghban, A.; Mohammadi, A.H.; Asghari, M. Rigorous Prognostication and Modeling of Gas Adsorption on Activated Carbon and Zeolite-5A. J. Environ. Manag. 2018, 224, 58–68. [Google Scholar] [CrossRef] [PubMed]
- Travlou, N.A.; Seredych, M.; Rodríguez-Castellón, E.; Bandosz, T.J. Activated Carbon-Based Gas Sensors: Effects of Surface Features on the Sensing Mechanism. J. Mater. Chem. A 2015, 3, 3821–3831. [Google Scholar] [CrossRef]
- Li, D.; Li, W.B.; Shi, J.S.; Xin, F.W. Influence of doping nitrogen, sulfur and phosphorous on activated carbons for gas adsorption of H2, CH4, and CO2. RSC Adv. 2016, 6, 50138–50143. [Google Scholar] [CrossRef]
- Rouquerol, F.; Rouquerol, J.; Sing, K.S.W. Adsorption by Powders and Porous Solids: Principles, Methodology, and Applications; Academic Press: Cambridge, MA, USA, 1999. [Google Scholar]
- Presser, V.; McDonough, J.; Yeon, S.H.; Gogotsi, Y. Effect of Pore Size on Carbon Dioxide Sorption by Carbide Derived Carbon. Energy Environ. Sci. 2011, 4, 3059–3066. [Google Scholar] [CrossRef]
- Casco, M.E.; Martínez-Escandell, M.; Silvestre-Albero, J.; Rodríguez-Reinoso, F. Effect of the Porous Structure in Carbon Materials for CO2 Capture at Atmospheric and High-Pressure. Carbon 2014, 67, 230–235. [Google Scholar] [CrossRef]
- Martinez-Escandell, M.; De Castro, M.M.; Molina-Sabio, M.; Rodriguez-Reinoso, F. KOH Activation of Carbon Materials Obtained from the Pyrolysis of Ethylene Tar at Different Temperatures. Fuel Process. Technol. 2013, 106, 402–407. [Google Scholar] [CrossRef]
- Linares-Solano, A.; Lillo-Ródenas, M.A.; Marco-Lozar, J.P.; Kunowsky, M.; Romero-Anaya, A.J. NaOH and KOH for Preparing Activated Carbons Used in Energy and Environmental Applications. Int. J. Energy 2012, 20, 59–91. [Google Scholar]
- Kiciński, W.; Szala, M.; Bystrzejewski, M. Sulfur-Doped Porous Carbons: Synthesis and Applications. Carbon 2014, 68, 1–32. [Google Scholar] [CrossRef]
- Martínez de Yuso, A.; De Fina, M.; Nita, C.; Fioux, P.; Parmentier, J.; Matei Ghimbeu, C. Synthesis of Sulfur-Doped Porous Carbons by Soft and Hard Templating Processes for CO2 and H2 Adsorption. Microporous Mesoporous Mater. 2017, 243, 135–146. [Google Scholar] [CrossRef]
- Blankenship, T.S.; Balahmar, N.; Mokaya, R. Oxygen-Rich Microporous Carbons with Exceptional Hydrogen Storage Capacity. Nat. Commun. 2017, 8, 1545. [Google Scholar] [CrossRef]
- Su, W.; Yao, L.; Ran, M.; Sun, Y.; Liu, J.; Wang, X. Adsorption Properties of N2, CH4, and CO2 on Sulfur-Doped Microporous Carbons. J. Chem. Eng. Data 2018, 63, 2914–2920. [Google Scholar] [CrossRef]
- Yuan, Y.; Chen, Z.; Yu, H.; Zhang, X.; Liu, T.; Xia, M.; Zheng, R.; Shui, M.; Shu, J. Heteroatom-Doped Carbon-Based Materials for Lithium and Sodium Ion Batteries. Energy Storage Mater. 2020, 32, 65–90. [Google Scholar] [CrossRef]
- Liu, X.; Li, S.; Mei, J.; Lau, W.-M.; Mi, R.; Li, Y.; Liu, H.; Liu, L. From Melamine-Resorcinol-Formaldehyde to Nitrogen-Doped Carbon Xerogels with Micro-and Meso-Pores for Lithium Batteries. J. Mater. Chem. A 2014, 2, 14429–14438. [Google Scholar] [CrossRef]
- Shui, J.; Wang, M.; Du, F.; Dai, L. N-Doped Carbon Nanomaterials Are Durable Catalysts for Oxygen Reduction Reaction in Acidic Fuel Cells. Sci. Adv. 2015, 1, e1400129. [Google Scholar] [CrossRef]
- Kim, M.-J.; Park, J.E.; Kim, S.; Lim, M.S.; Jin, A.; Kim, O.-H.; Kim, M.J.; Lee, K.-S.; Kim, J.; Kim, S.-S.; et al. Biomass-Derived Air Cathode Materials: Pore-Controlled S,N-Co-Doped Carbon for Fuel Cells and Metal−Air Batteries. ACS Catal. 2019, 9, 3389–3398. [Google Scholar] [CrossRef]
- Han, Z.J.; Huang, C.; Meysami, S.S.; Piche, D.; Seo, D.H.; Pineda, S.; Murdock, A.T.; Bruce, P.S.; Grant, P.S.; Grobert, N. High-Frequency Supercapacitors Based on Doped Carbon Nanostructures. Carbon 2018, 126, 305–312. [Google Scholar] [CrossRef]
- Sevilla, M.; Valle-Vigõn, P.; Fuertes, A.B. N-Doped Polypyrrole-Based Porous Carbons for CO2 Capture. Adv. Funct. Mater. 2011, 21, 2781–2787. [Google Scholar] [CrossRef]
- Lv, Q.; Si, W.; He, J.; Sun, L.; Zhang, C.; Wang, N.; Yang, Z.; Li, X.; Wang, X.; Deng, W.; et al. Selectively Nitrogen-Doped Carbon Materials as Superior Metal-Free Catalysts for Oxygen Reduction. Nat. Commun. 2018, 9, 3376. [Google Scholar] [CrossRef] [PubMed]
- Wu, P.; Qian, Y.; Du, P.; Zhang, H.; Cai, C. Facile Synthesis of Nitrogen-Doped Graphene for Measuring the Releasing Process of Hydrogen Peroxide from Living Cells. J. Mater. Chem. 2012, 22, 6402–6412. [Google Scholar] [CrossRef]
- Shaheen Shah, S.; Abu Nayem, S.M.; Sultana, N.; Saleh Ahammad, A.J.; Abdul Aziz, M. Preparation of Sulfur-Doped Carbon for Supercapacitor Applications: A Review. ChemSusChem 2022, 15, e20211282. [Google Scholar] [CrossRef]
- Sevilla, M.; Fuertes, A.B. Highly Porous S-Doped Carbons. Microporous Mesoporous Mater. 2012, 158, 318–323. [Google Scholar] [CrossRef]
- Reljic, S.; Cuadrado-Collados, C.; Oliveira Jardim, E.; Farrando-Perez, J.; Martinez-Escandell, M.; Silvestre-Albero, J. Activated Carbon Materials with a Rich Surface Chemistry Prepared from L-Cysteine Amino Acid. Fluid Phase Equilib. 2022, 558, 113446. [Google Scholar] [CrossRef]
- Nguyen, H.G.T.; Sims, C.M.; Toman, B.; Horn, J.; van Zee, R.D.; Thommes, M.; Ahmad, R.; Denayer, J.F.M.; Baron, G.V.; Napolitano, E.; et al. A Reference High-Pressure CH4 Adsorption Isotherm for Zeolite Y: Results of an Interlaboratory Study. Adsorption 2020, 26, 1253–1266. [Google Scholar] [CrossRef]
- Silvestre-Albero, A.; Silvestre-Albero, J.; Sepúlveda-Escribano, A.; Rodríguez-Reinoso, F. Ethanol Removal Using Activated Carbon: Effect of Porous Structure and Surface Chemistry. Microporous Mesoporous Mater. 2009, 120, 62–68. [Google Scholar] [CrossRef]
- Choi, C.H.; Park, S.H.; Woo, S.I. Heteroatom Doped Carbons Prepared by the Pyrolysis of Bio-Derived Amino Acids as Highly Active Catalysts for Oxygen Electro-Reduction Reactions. Green Chem. 2011, 13, 406–412. [Google Scholar] [CrossRef]
- Qi, X.; Chen, W.; Zhang, J. Sulphur-Doped Activated Carbon as a Metal-Free Catalyst for Acetylene Hydrochlorination. RSC Adv. 2020, 10, 34612–34620. [Google Scholar] [CrossRef] [PubMed]
- Ayiania, M.; Smith, M.; Hensley, A.J.R.; Scudiero, L.; McEwen, J.S.; Garcia-Perez, M. Deconvoluting the XPS Spectra for Nitrogen-Doped Chars: An Analysis from First Principles. Carbon 2020, 162, 528–544. [Google Scholar] [CrossRef]
- Zhou, J.H.; Sui, Z.J.; Zhu, J.; Li, P.; Chen, D.; Dai, Y.C.; Yuan, W.K. Characterization of Surface Oxygen Complexes on Carbon Nanofibers by TPD, XPS and FT-IR. Carbon 2007, 45, 785–796. [Google Scholar] [CrossRef]
- Figueiredo, J.L.; Pereira, M.F.R.; Freitas, M.M.A.; Órfão, J.J.M. Modification of the Surface Chemistry of Activated Carbons. Carbon 1999, 37, 1379–1389. [Google Scholar] [CrossRef]
- Abouelamaiem, D.I.; Mostazo-López, M.J.; He, G.; Patel, D.; Neville, T.P.; Parkin, I.P.; Lozano-Castelló, D.; Morallón, E.; Cazorla-Amorós, D.; Jorge, A.B.; et al. New Insights into the Electrochemical Behaviour of Porous Carbon Electrodes for Supercapacitors. J. Energy Storage 2018, 19, 337–347. [Google Scholar] [CrossRef]
- Abdelkader-Fernández, V.K.; Domingo-García, M.; López-Garzón, F.J.; Fernandes, D.M.; Freire, C.; López de la Torre, M.D.; Melguizo, M.; Godino-Salido, M.L.; Pérez-Mendoza, M. Expanding Graphene Properties by a Simple S-Doping Methodology Based on Cold CS2 Plasma. Carbon 2019, 144, 269–279. [Google Scholar] [CrossRef]
- Shao, J.; Ma, C.; Zhao, J.; Wang, L.; Hu, X. Effective Nitrogen and Sulfur Co-Doped Porous Carbonaceous CO2 Adsorbents Derived from Amino Acid. Colloids Surf. A Physicochem. Eng. Asp. 2022, 632, 127750. [Google Scholar] [CrossRef]
- Ma, C.; Lu, T.; Shao, J.; Huang, J.; Hu, X.; Wang, L. Biomass Derived Nitrogen and Sulfur Co-Doped Porous Carbons for Efficient CO2 Adsorption. Sep. Purif. Technol. 2022, 281, 119899. [Google Scholar] [CrossRef]
- Silvestre-Albero, J.; Rodríguez-Reinoso, F. Novel Carbon Materials for CO2 Adsorption. In Novel Carbon Adsorbents; Tascón, J.M.D., Ed.; Elsevier: Amsterdam, The Netherlands, 2012; pp. 583–603. [Google Scholar] [CrossRef]
- Casco, M.E.; Martínez-Escandell, M.; Gadea-Ramos, E.; Kaneko, K.; Silvestre-Albero, J.; Rodríguez-Reinoso, F. High-Pressure Methane Storage in Porous Materials: Are Carbon Materials in the Pole Position? Chem. Mater. 2015, 27, 959–964. [Google Scholar] [CrossRef]
- Rodríguez-Reinoso, F.; Silvestre-Albero, J. Methane Storage on Nanoporous Carbons. In Nanoporous Materials for Gas Storage; Green Energy and Technology; Springer Science & Business Media: Berlin/Heidelberg, Germany, 2019; pp. 209–226. [Google Scholar] [CrossRef]
- Sánchez-Sánchez, Á.; Suárez-García, F.; Martínez-Alonso, A.; Tascón, J.M.D. Influence of Porous Texture and Surface Chemistry on the CO2 Adsorption Capacity of Porous Carbons: Acidic and Basic Site Interactions. ACS Appl. Mater. Interfaces 2014, 6, 21237–21247. [Google Scholar] [CrossRef]
Figure 1.
(a,b) N2 adsorption/desorption isotherms at −196 °C, (c,d) CO2 isotherms at 0 °C for the different samples evaluated, and (e,f) pore size distribution after the application of the QSDFT method to the nitrogen adsorption data (slit-shaped pore model).
Figure 1.
(a,b) N2 adsorption/desorption isotherms at −196 °C, (c,d) CO2 isotherms at 0 °C for the different samples evaluated, and (e,f) pore size distribution after the application of the QSDFT method to the nitrogen adsorption data (slit-shaped pore model).

Figure 2.
FESEM images of activated carbon samples (a) PPAC1:3, (b) PPAC1:3800, (c) PPAC1:3P, (d) PPAC1:3P800.
Figure 2.
FESEM images of activated carbon samples (a) PPAC1:3, (b) PPAC1:3800, (c) PPAC1:3P, (d) PPAC1:3P800.

Figure 3.
(a) XRD patterns and (b) Raman spectra for original and modified activated carbons.

Figure 4.
XPS spectra in the (a) overall survey, (b) C1s, (c) O1s, (d) N1s, and (e) S2p region for the samples PPAC1:3, PPAC1:3800, and PPAC1:3P800.
Figure 4.
XPS spectra in the (a) overall survey, (b) C1s, (c) O1s, (d) N1s, and (e) S2p region for the samples PPAC1:3, PPAC1:3800, and PPAC1:3P800.

Figure 5.
Temperature-programmed decomposition (TPD) profiles for the representative samples.

Figure 6.
CO2 adsorption isotherms measured at 0.1 MPa (a,c) and 4 MPa (b,d) and 25 °C.

Figure 7.
CH4 adsorption isotherms measured at 0.1 MPa (a,c) and 4 MPa (b,d).

Figure 8.
Correlation between the textural parameters (BET surface area and micropore volume—V0) and the excess amount adsorbed for CO2 at atmospheric and high pressure.
Figure 8.
Correlation between the textural parameters (BET surface area and micropore volume—V0) and the excess amount adsorbed for CO2 at atmospheric and high pressure.

Figure 9.
Correlation between the textural parameters (BET surface area and micropore volume—V0) and the excess amount adsorbed for CH4 at atmospheric and high pressure.
Figure 9.
Correlation between the textural parameters (BET surface area and micropore volume—V0) and the excess amount adsorbed for CH4 at atmospheric and high pressure.

Figure 10.
Correlation between the amount of sulfur functional groups on the carbon surface (deduced from the XPS results) and the excess amount adsorbed for CH4 and CO2 at atmospheric and high pressure after normalization using the narrow micropore volume.
Figure 10.
Correlation between the amount of sulfur functional groups on the carbon surface (deduced from the XPS results) and the excess amount adsorbed for CH4 and CO2 at atmospheric and high pressure after normalization using the narrow micropore volume.


Table 1.
Textural parameters deduced from the nitrogen and CO2 adsorption measurements.
| Sample | SBET (m2/g) | V0 (cm3/g) | Vmeso (cm3/g) | Vtotal (cm3/g) | Vn CO2 | Increase in SBET (%) |
|---|---|---|---|---|---|---|
| PPAC1:3 | 2325 | 0.98 | 0.02 | 1.00 | 0.89 | - |
| PPAC1:3600 | 2423 | 1.04 | 0.01 | 1.05 | 0.93 | 4.0 |
| PPAC1:3800 | 2536 | 1.06 | 0.02 | 1.08 | 0.96 | 9.1 |
| PPAC1:3P | 2049 | 0.88 | 0.02 | 0.90 | 0.66 | - |
| PPAC1:3P600 | 2587 | 1.11 | 0.03 | 1.14 | 0.99 | 11.3 |
| PPAC1:3P800 | 2692 | 1.17 | 0.01 | 1.18 | 0.99 | 15.8 |
| PPAC1:3P800N2 | 2148 | 0.78 | 0.18 | 0.96 | 0.81 | - |
Table 2.
Carbon, oxygen, nitrogen, and sulfur content (at. %) for the different samples evaluated obtained from the XPS spectra.
Table 2.
Carbon, oxygen, nitrogen, and sulfur content (at. %) for the different samples evaluated obtained from the XPS spectra.
| Sample | C (%) | O (%) | S (%) | N (%) |
|---|---|---|---|---|
| PPAC1:3 | 93.96 | 5.55 | 0.19 | 0.30 |
| PPAC1:3600 | 93.54 | 4.56 | 1.53 | 0.39 |
| PPAC1:3800 | 92.85 | 4.37 | 2.55 | 0.23 |
| PPAC1:3P | 77.99 | 21.51 | 0.08 | 0.42 |
| PPAC1:3P600 | 88.58 | 9.25 | 1.59 | 0.58 |
| PPAC1:3P800 | 87.59 | 9.63 | 2.20 | 0.57 |
Table 3.
CO2 adsorption capacity measured at 0.1 MPa and 4 MPa.
| Sample | CO2 Adsorbed (mg/g) 0.1 MPa | CO2 Adsorbed (mg/g) 4 MPa |
|---|---|---|
| PPAC1:3 | 167.0 | 972.7 |
| PPAC1:3600 | 181.4 | 1013.4 |
| PPAC1:3800 | 190.5 | 1043.9 |
| PPAC1:3P | 152.0 | 904.6 |
| PPAC1:3P600 | 189.6 | 1111.7 |
| PPAC1:3P800 | 210.6 | 1155.0 |
Table 4.
CH4 adsorption isotherms measured at 0.1 MPa and 4 MPa.
| Sample | CH4 Adsorbed (wt.%) 0.1 MPa | CH4 Adsorbed (wt.%) 4.0 MPa |
|---|---|---|
| PPAC1:3 | 2.7 | 17.9 |
| PPAC1:3600 | 3.1 | 18.4 |
| PPAC1:3800 | 3.4 | 19.8 |
| PPAC1:3P | 2.5 | 16.8 |
| PPAC1:3P600 | 3.1 | 20.7 |
| PPAC1:3P800 | 3.6 | 20.9 |
Publisher’s Note: MDPI stays neutral with regard to jurisdictional claims in published maps and institutional affiliations. |
© 2022 by the authors. Licensee MDPI, Basel, Switzerland. This article is an open access article distributed under the terms and conditions of the Creative Commons Attribution (CC BY) license (https://creativecommons.org/licenses/by/4.0/).
Share and Cite
MDPI and ACS Style
Reljic, S.; Martinez-Escandell, M.; Silvestre-Albero, J. Effect of Porosity and Surface Chemistry on CO2 and CH4 Adsorption in S-Doped and S-/O-co-Doped Porous Carbons. C 2022, 8, 41. https://0-doi-org.brum.beds.ac.uk/10.3390/c8030041
AMA Style
Reljic S, Martinez-Escandell M, Silvestre-Albero J. Effect of Porosity and Surface Chemistry on CO2 and CH4 Adsorption in S-Doped and S-/O-co-Doped Porous Carbons. C. 2022; 8(3):41. https://0-doi-org.brum.beds.ac.uk/10.3390/c8030041
Chicago/Turabian StyleReljic, Snezana, Manuel Martinez-Escandell, and Joaquin Silvestre-Albero. 2022. "Effect of Porosity and Surface Chemistry on CO2 and CH4 Adsorption in S-Doped and S-/O-co-Doped Porous Carbons" C 8, no. 3: 41. https://0-doi-org.brum.beds.ac.uk/10.3390/c8030041
Note that from the first issue of 2016, this journal uses article numbers instead of page numbers. See further details here.