Knockdown of UTX/KDM6A Enriches Precursor Cell Populations in Urothelial Cell Cultures and Cell Lines

 , , , , , ,
  and
and 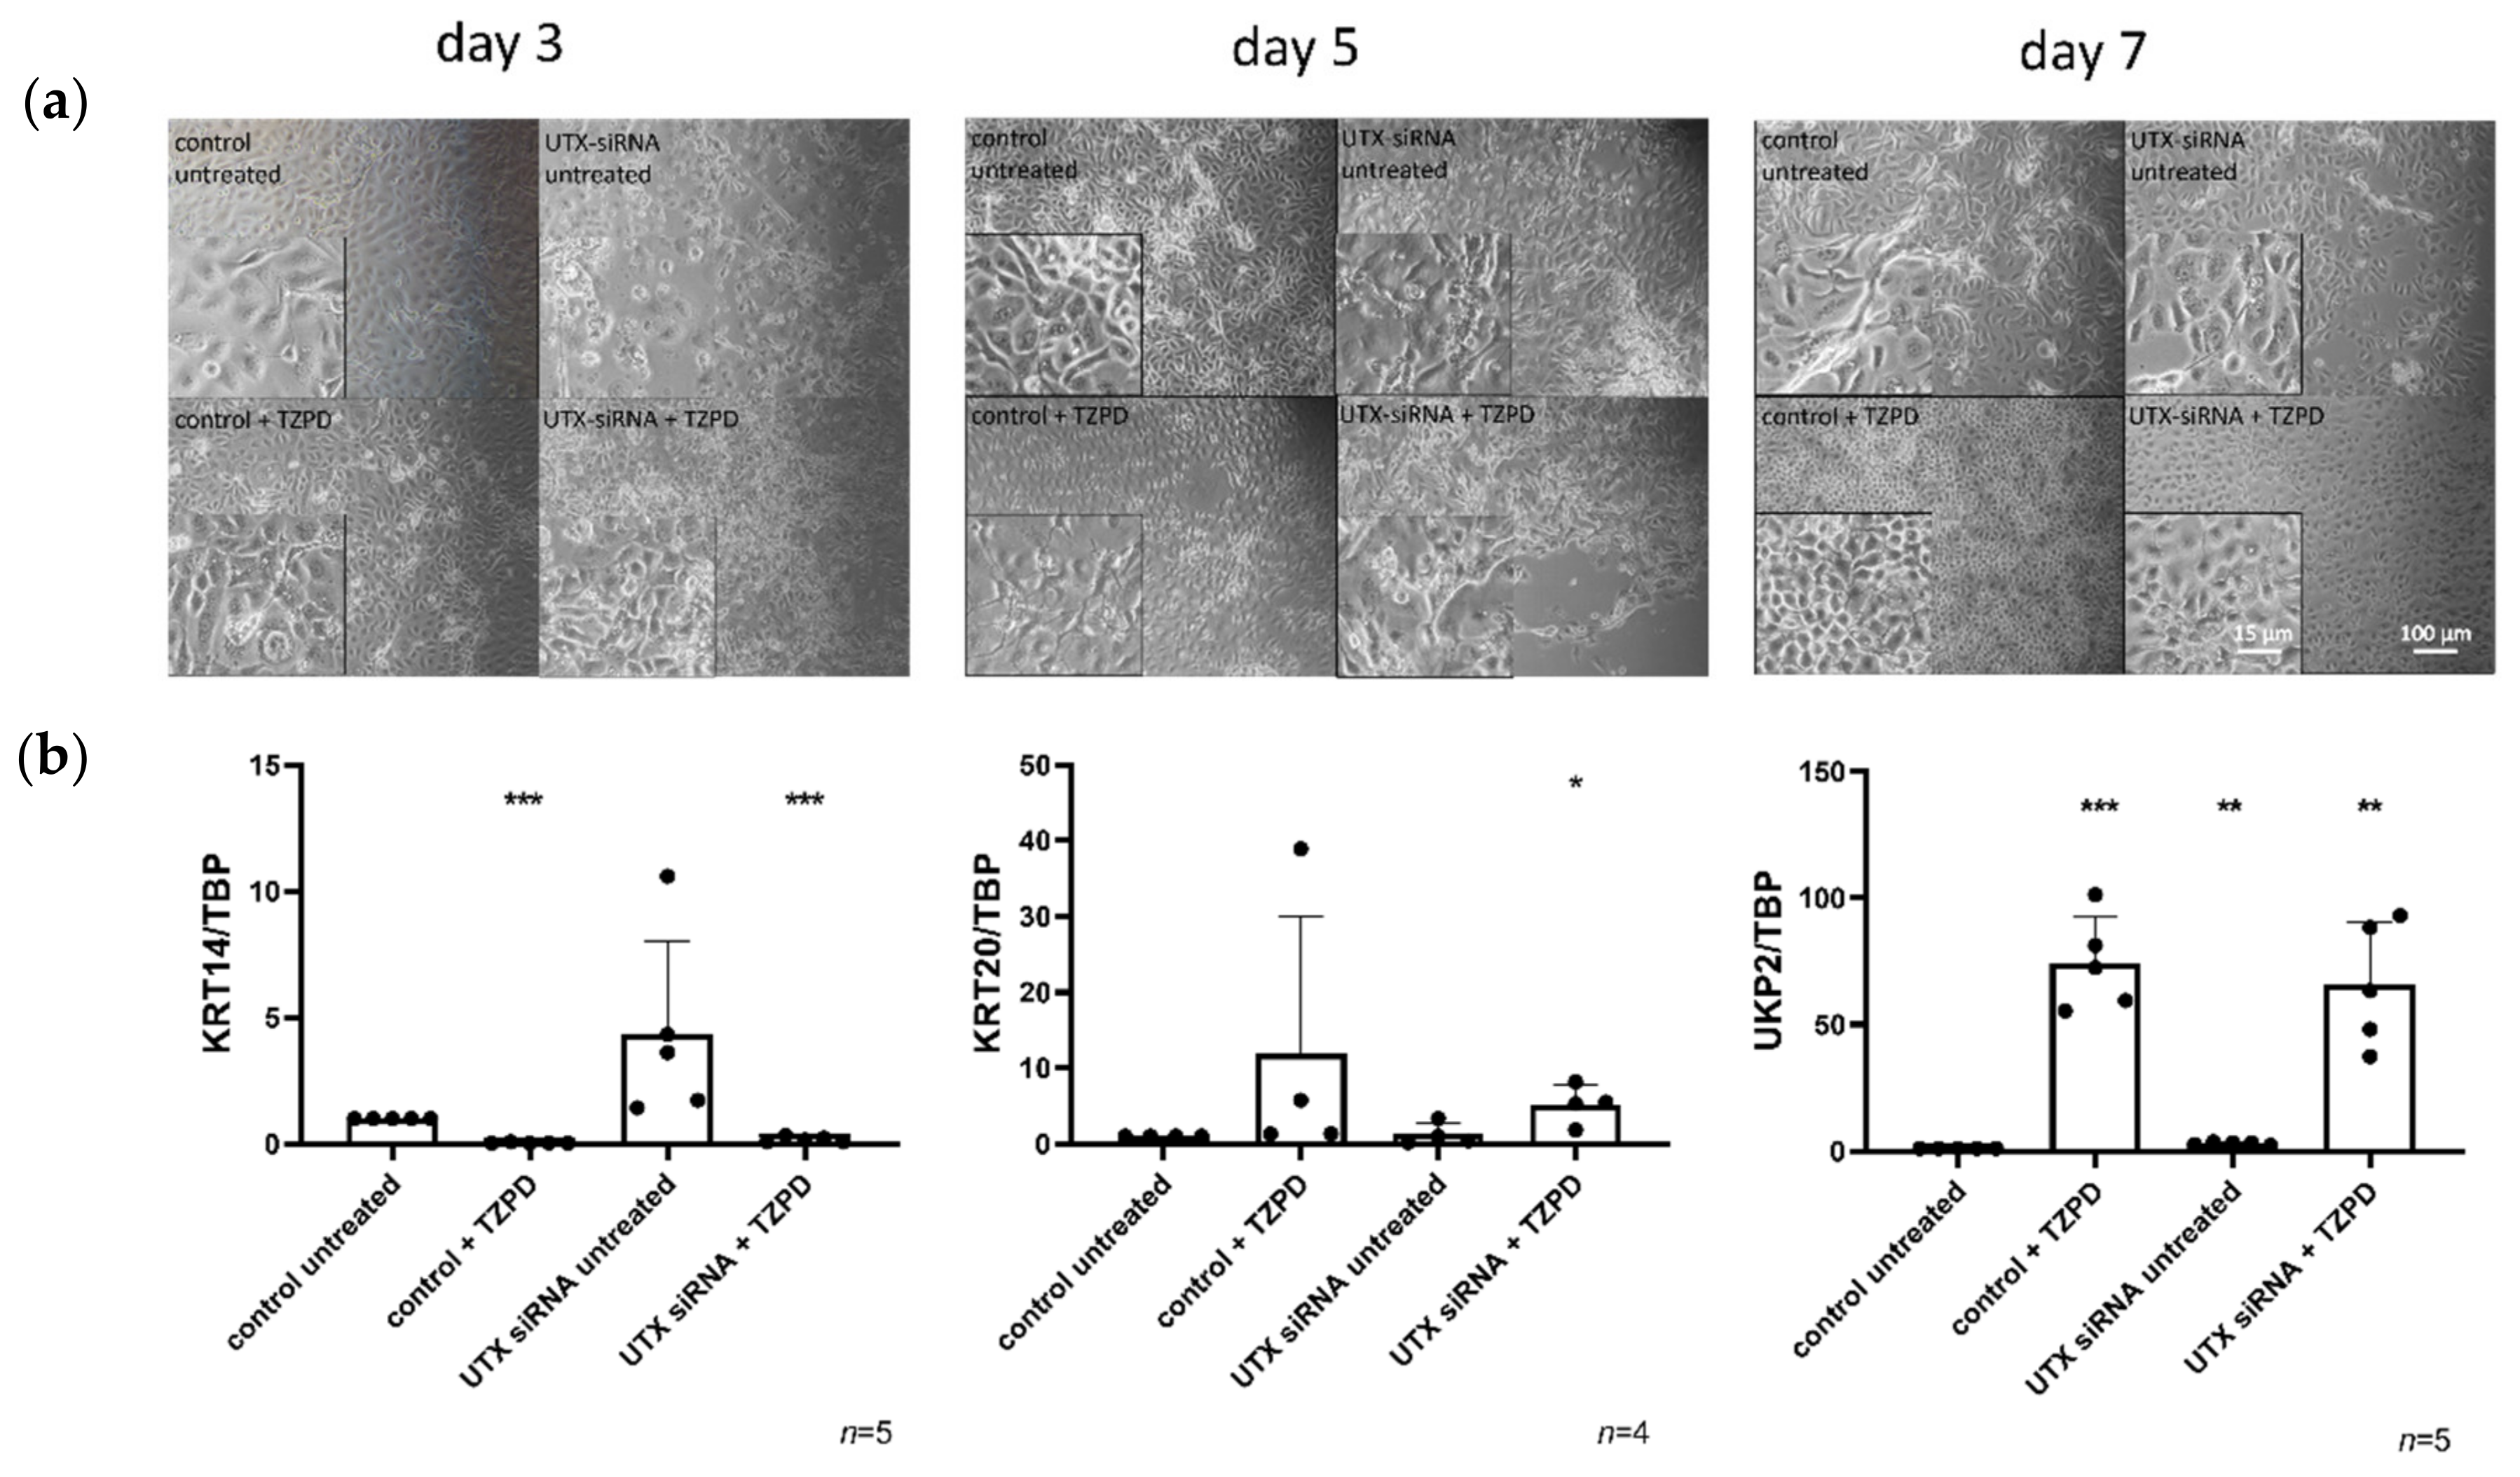
Abstract
:1. Introduction
2. Results
2.1. Efficiency of UTX Knockdown
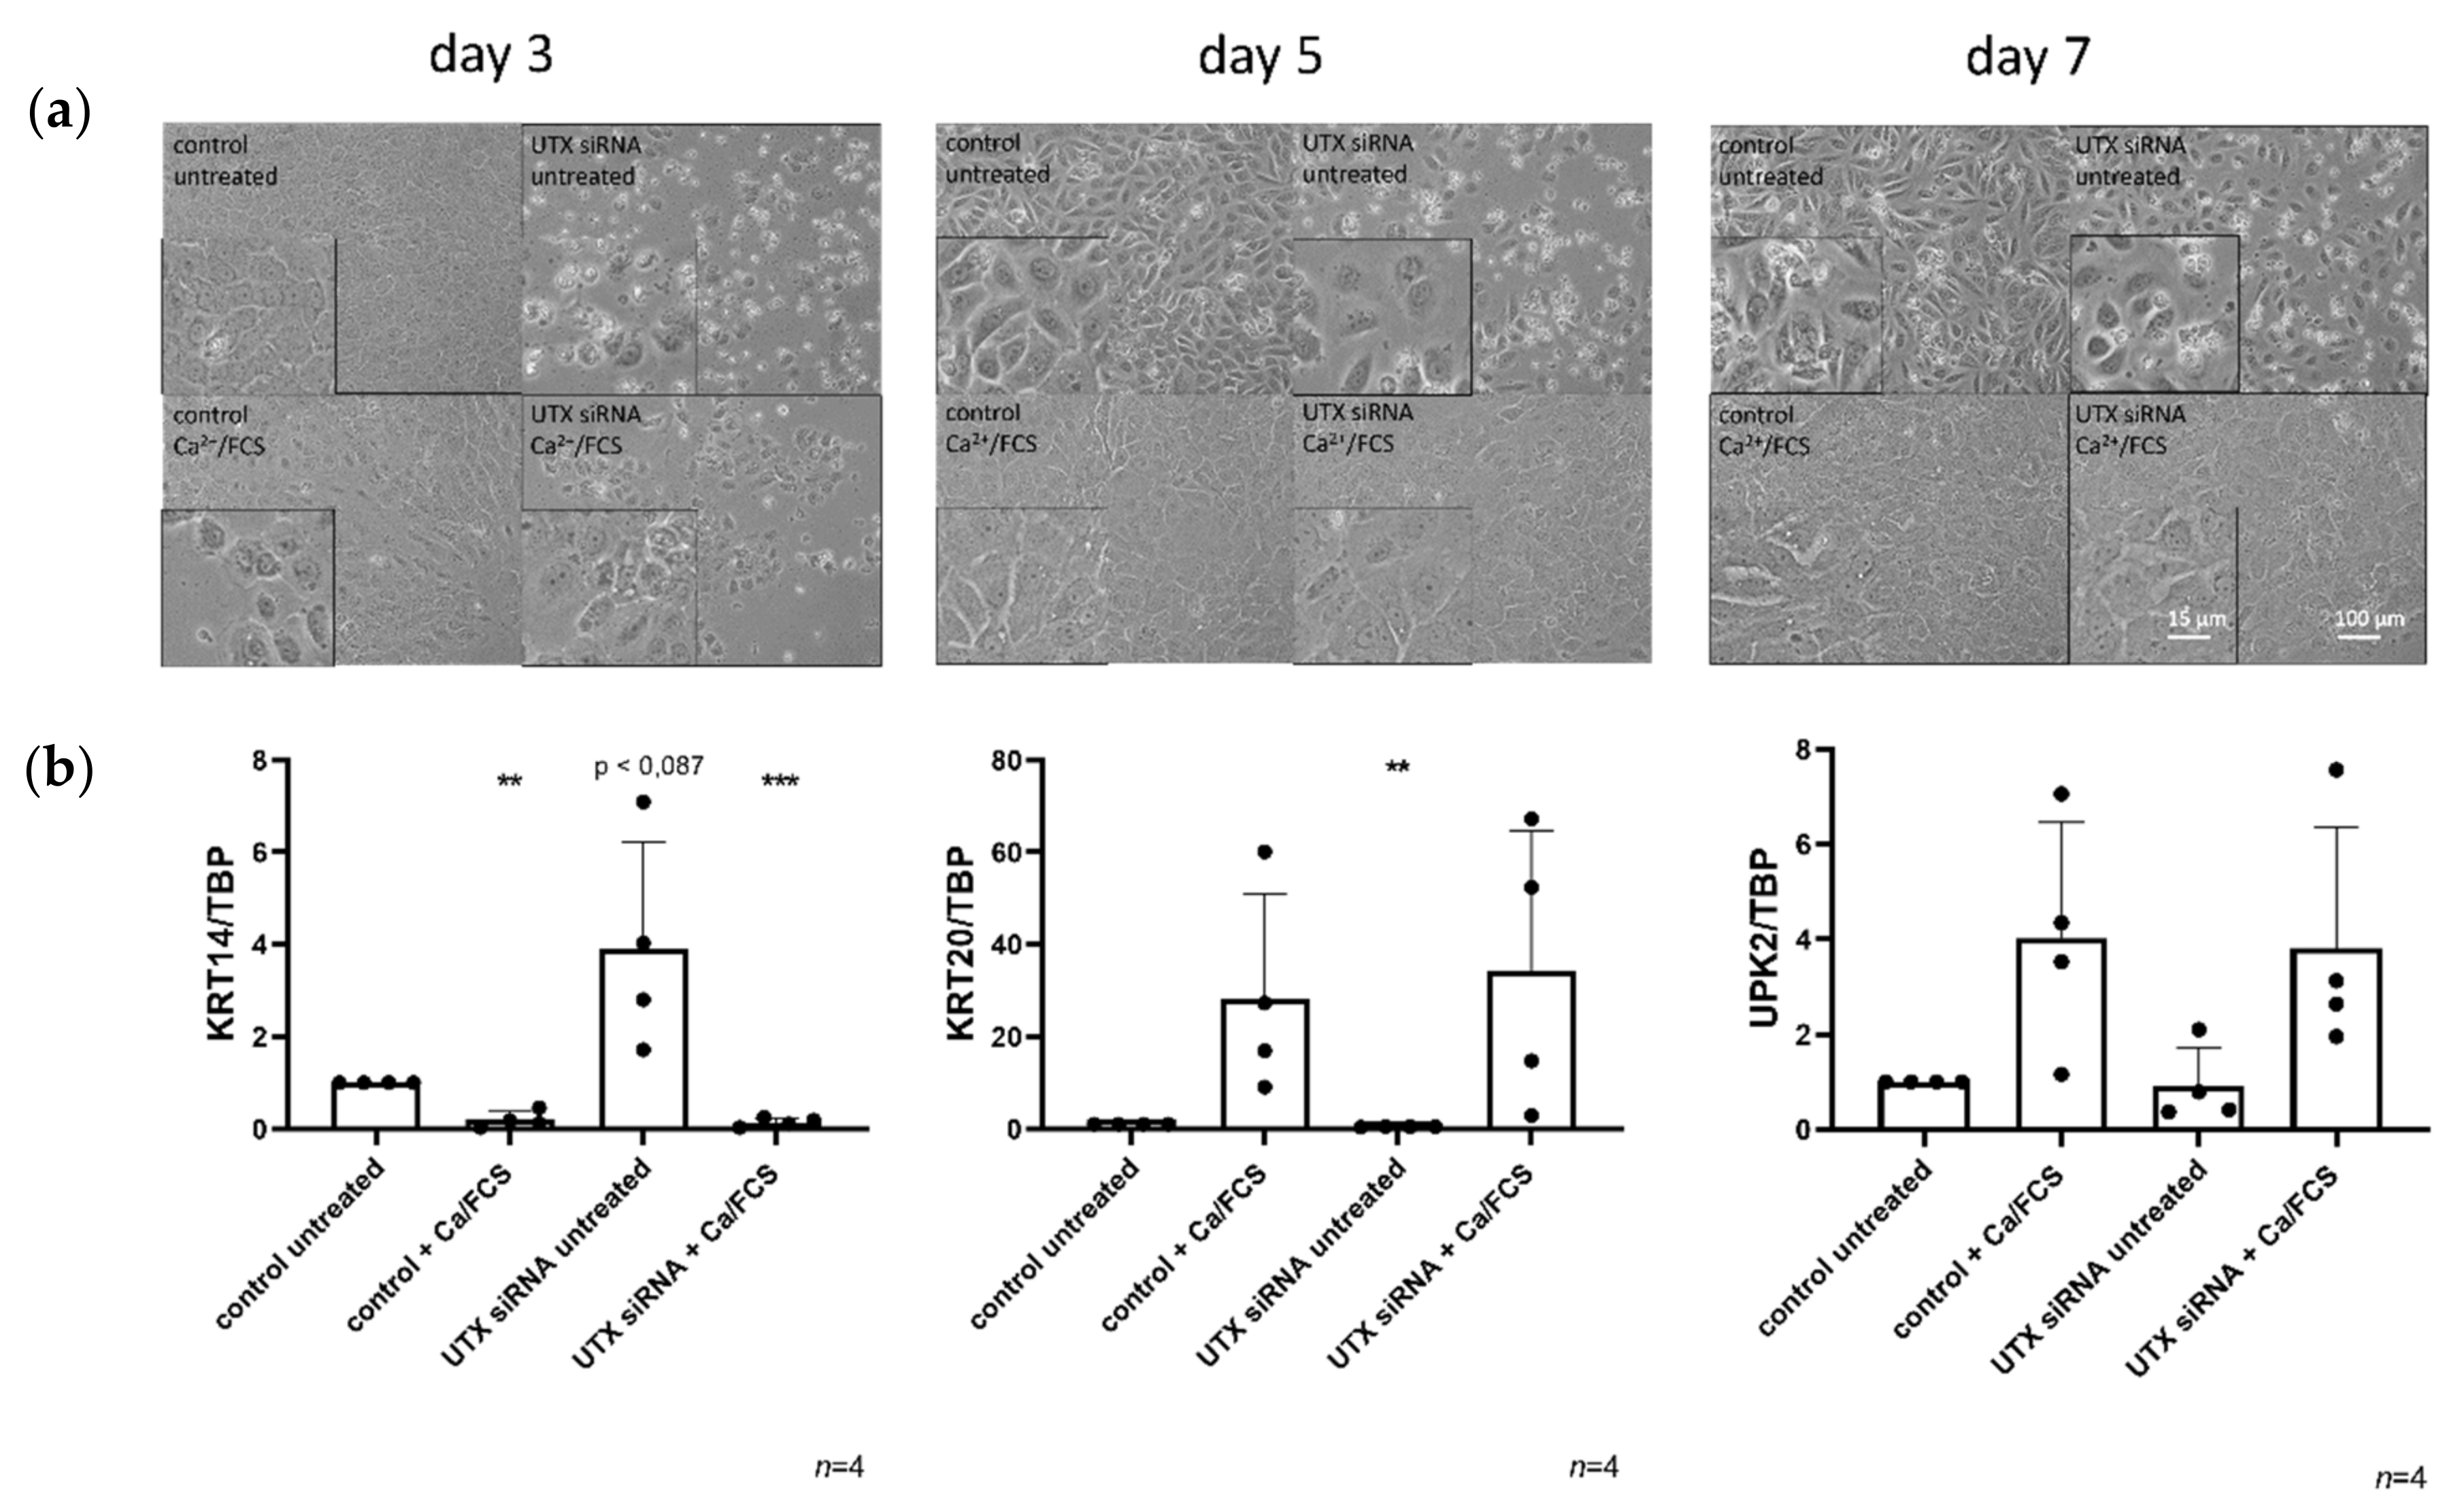
2.2. UTX Knockdown Does Not Block Urothelial Differentiation
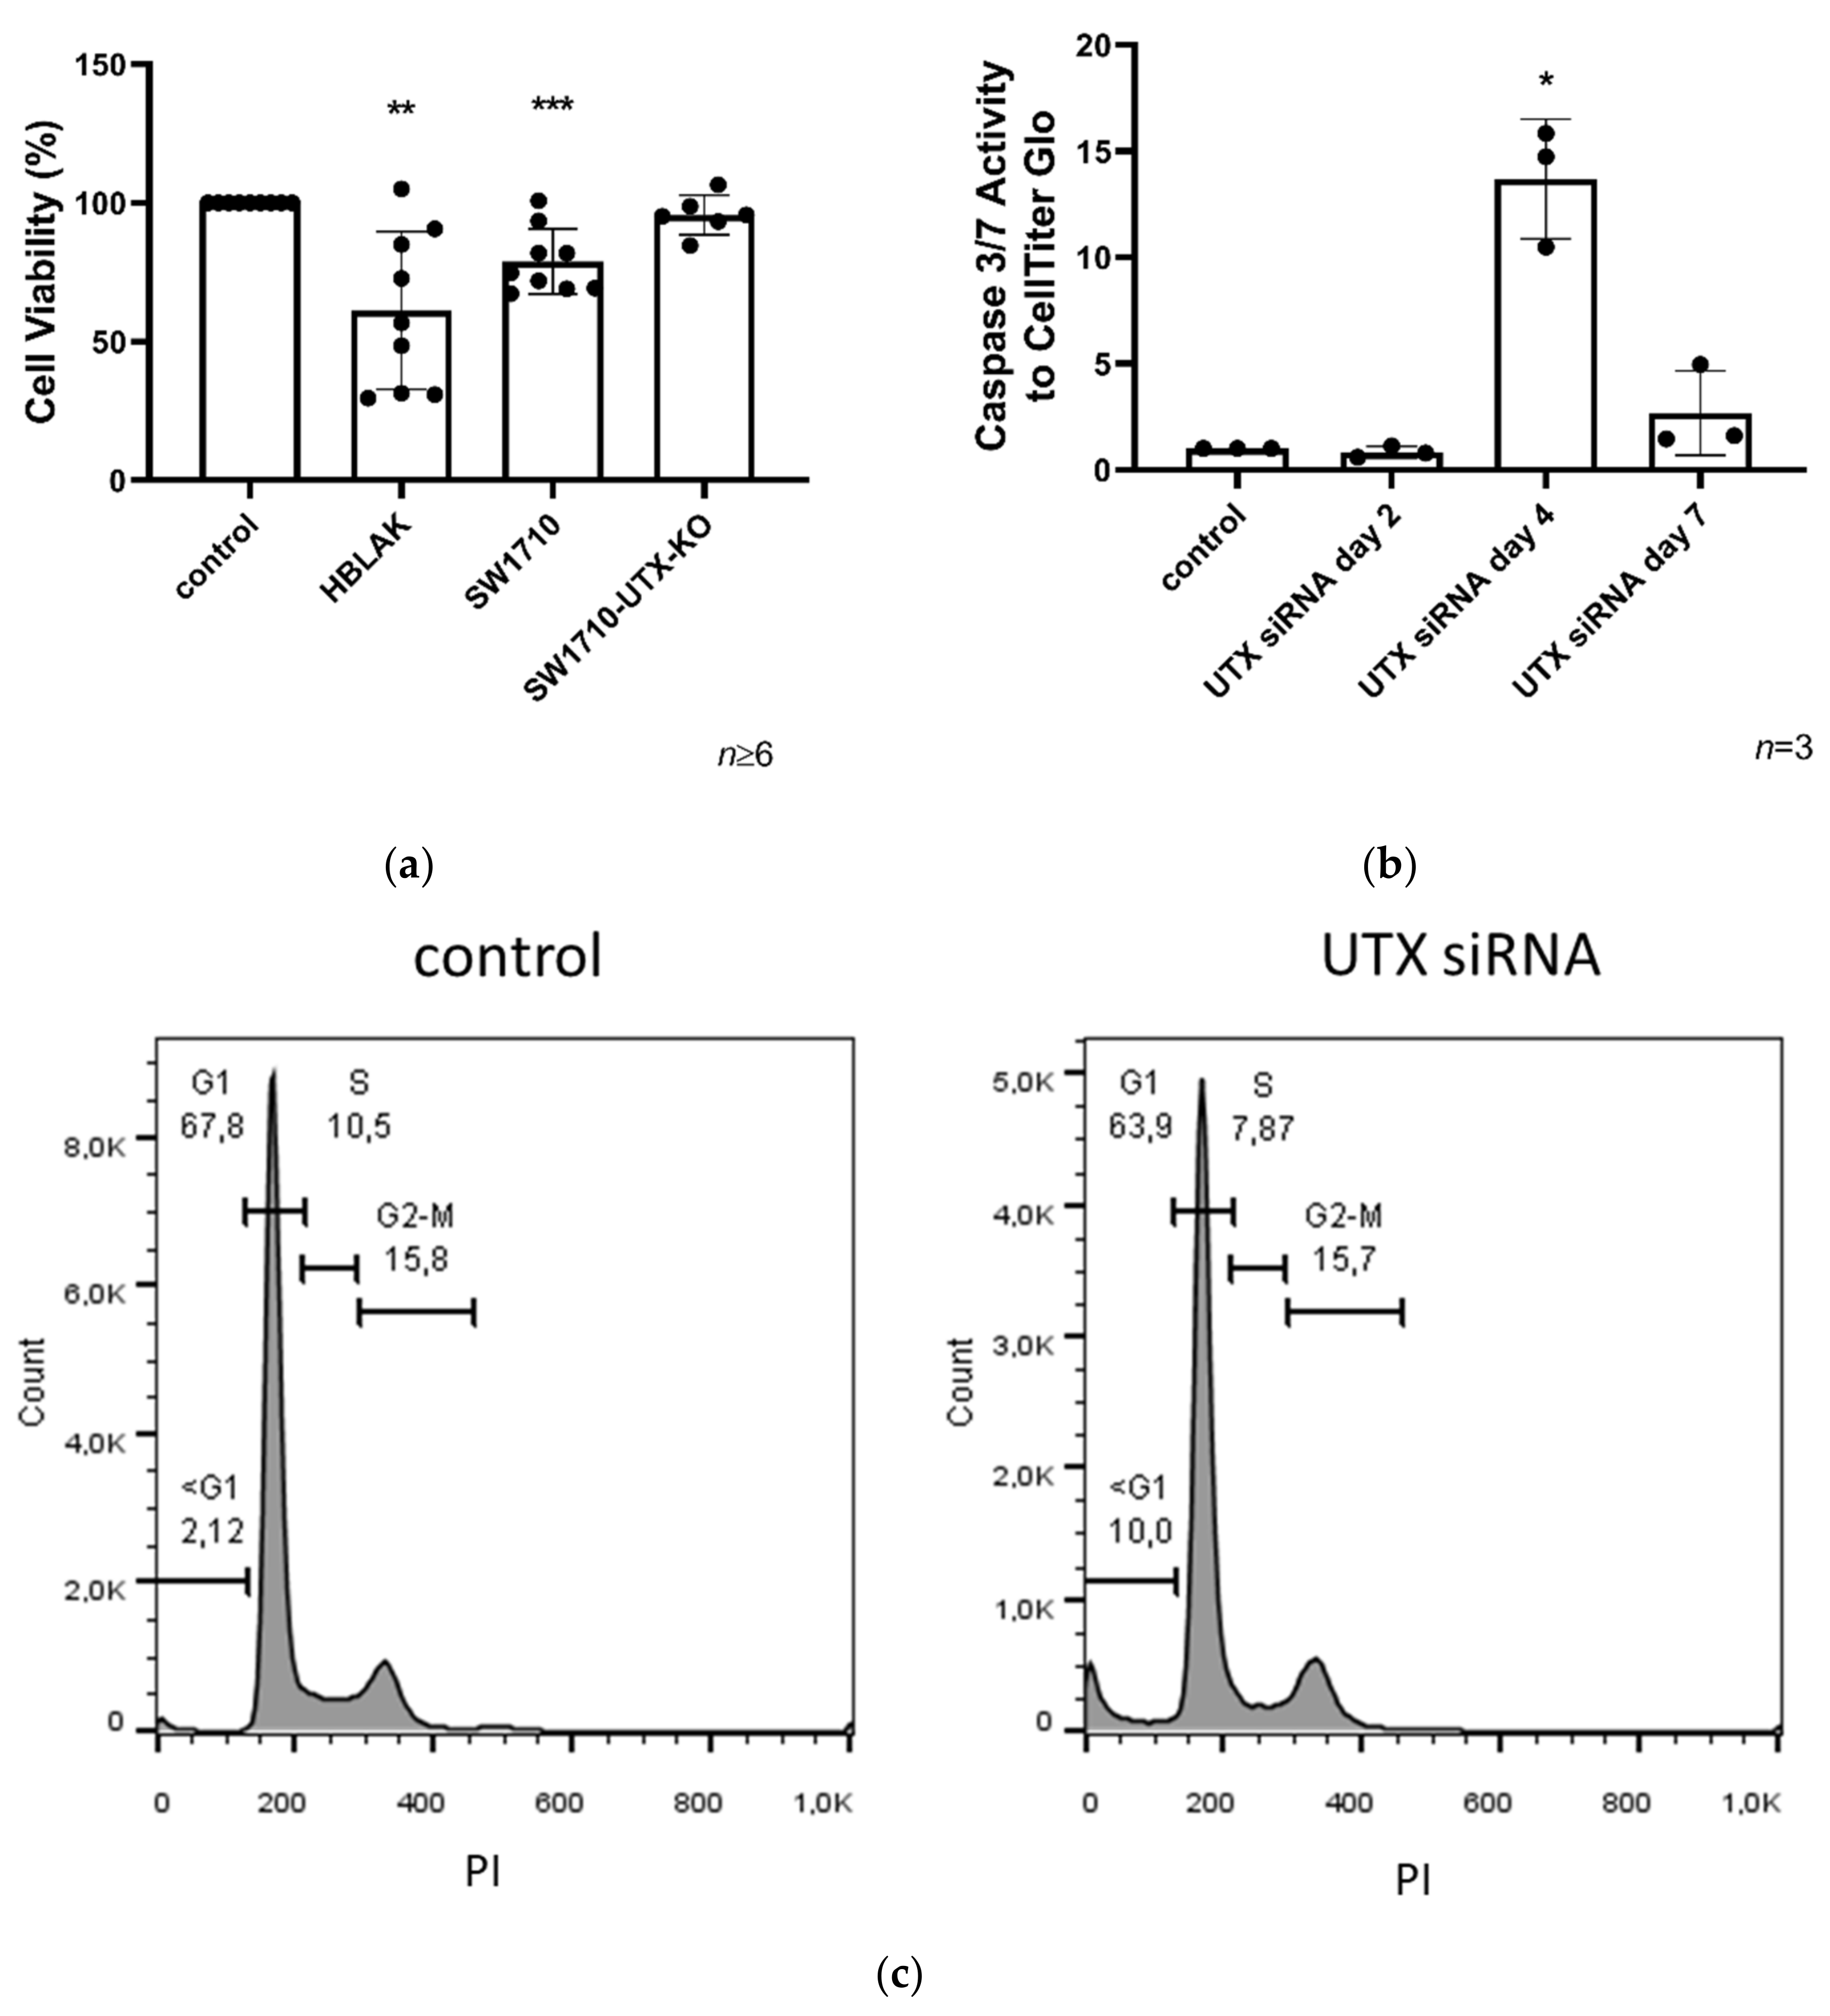
2.3. UTX Knockdown Reduces Viability in Primary Urothelial and HBLAK Cells
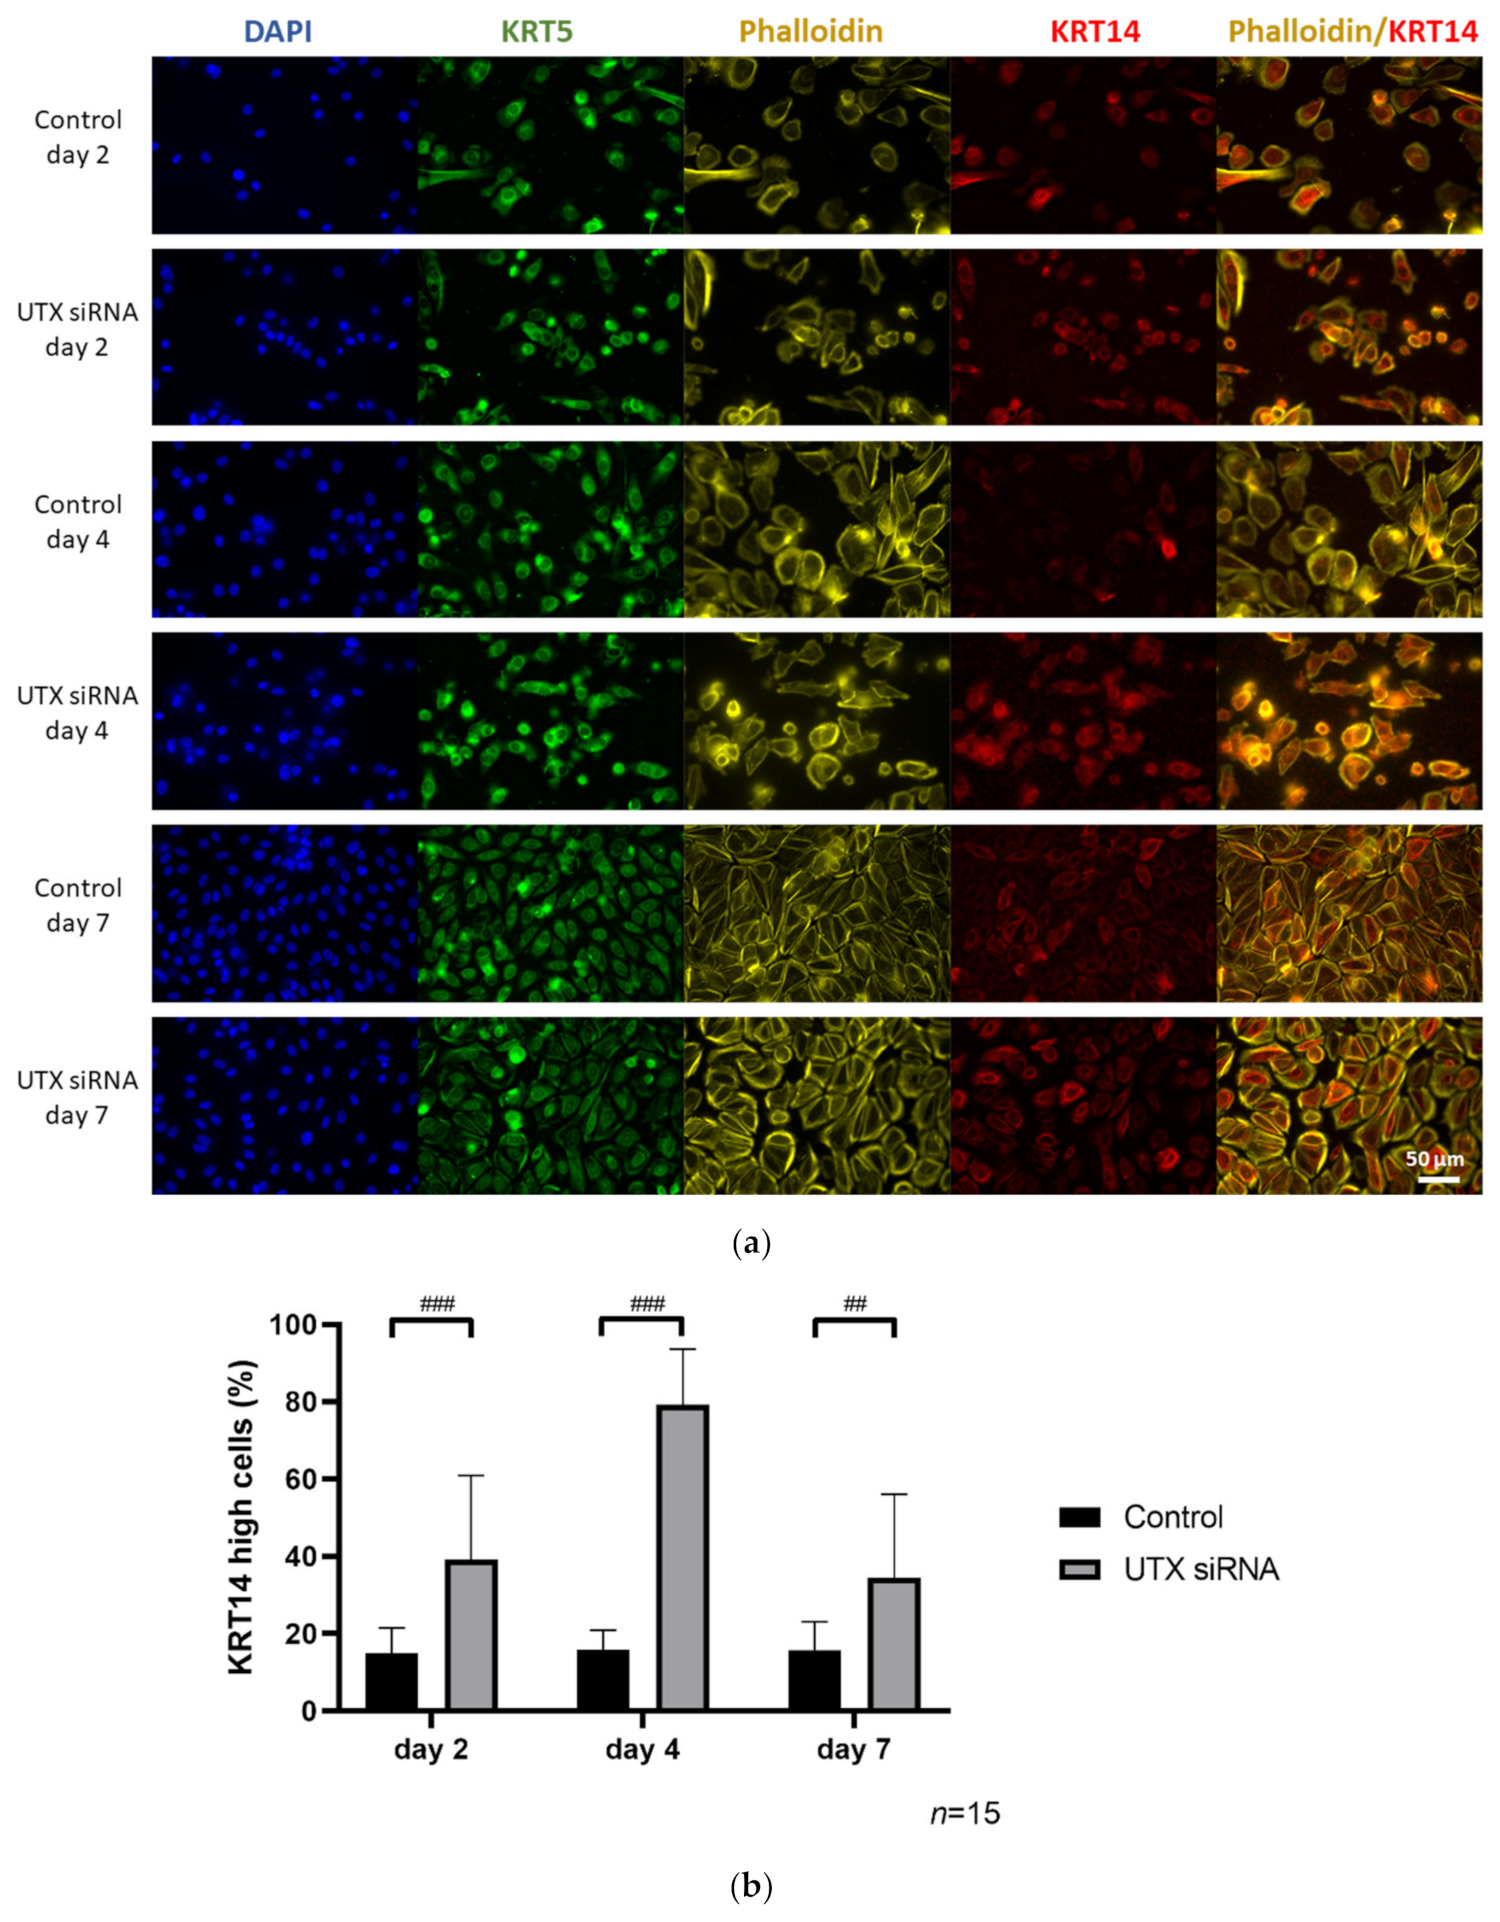
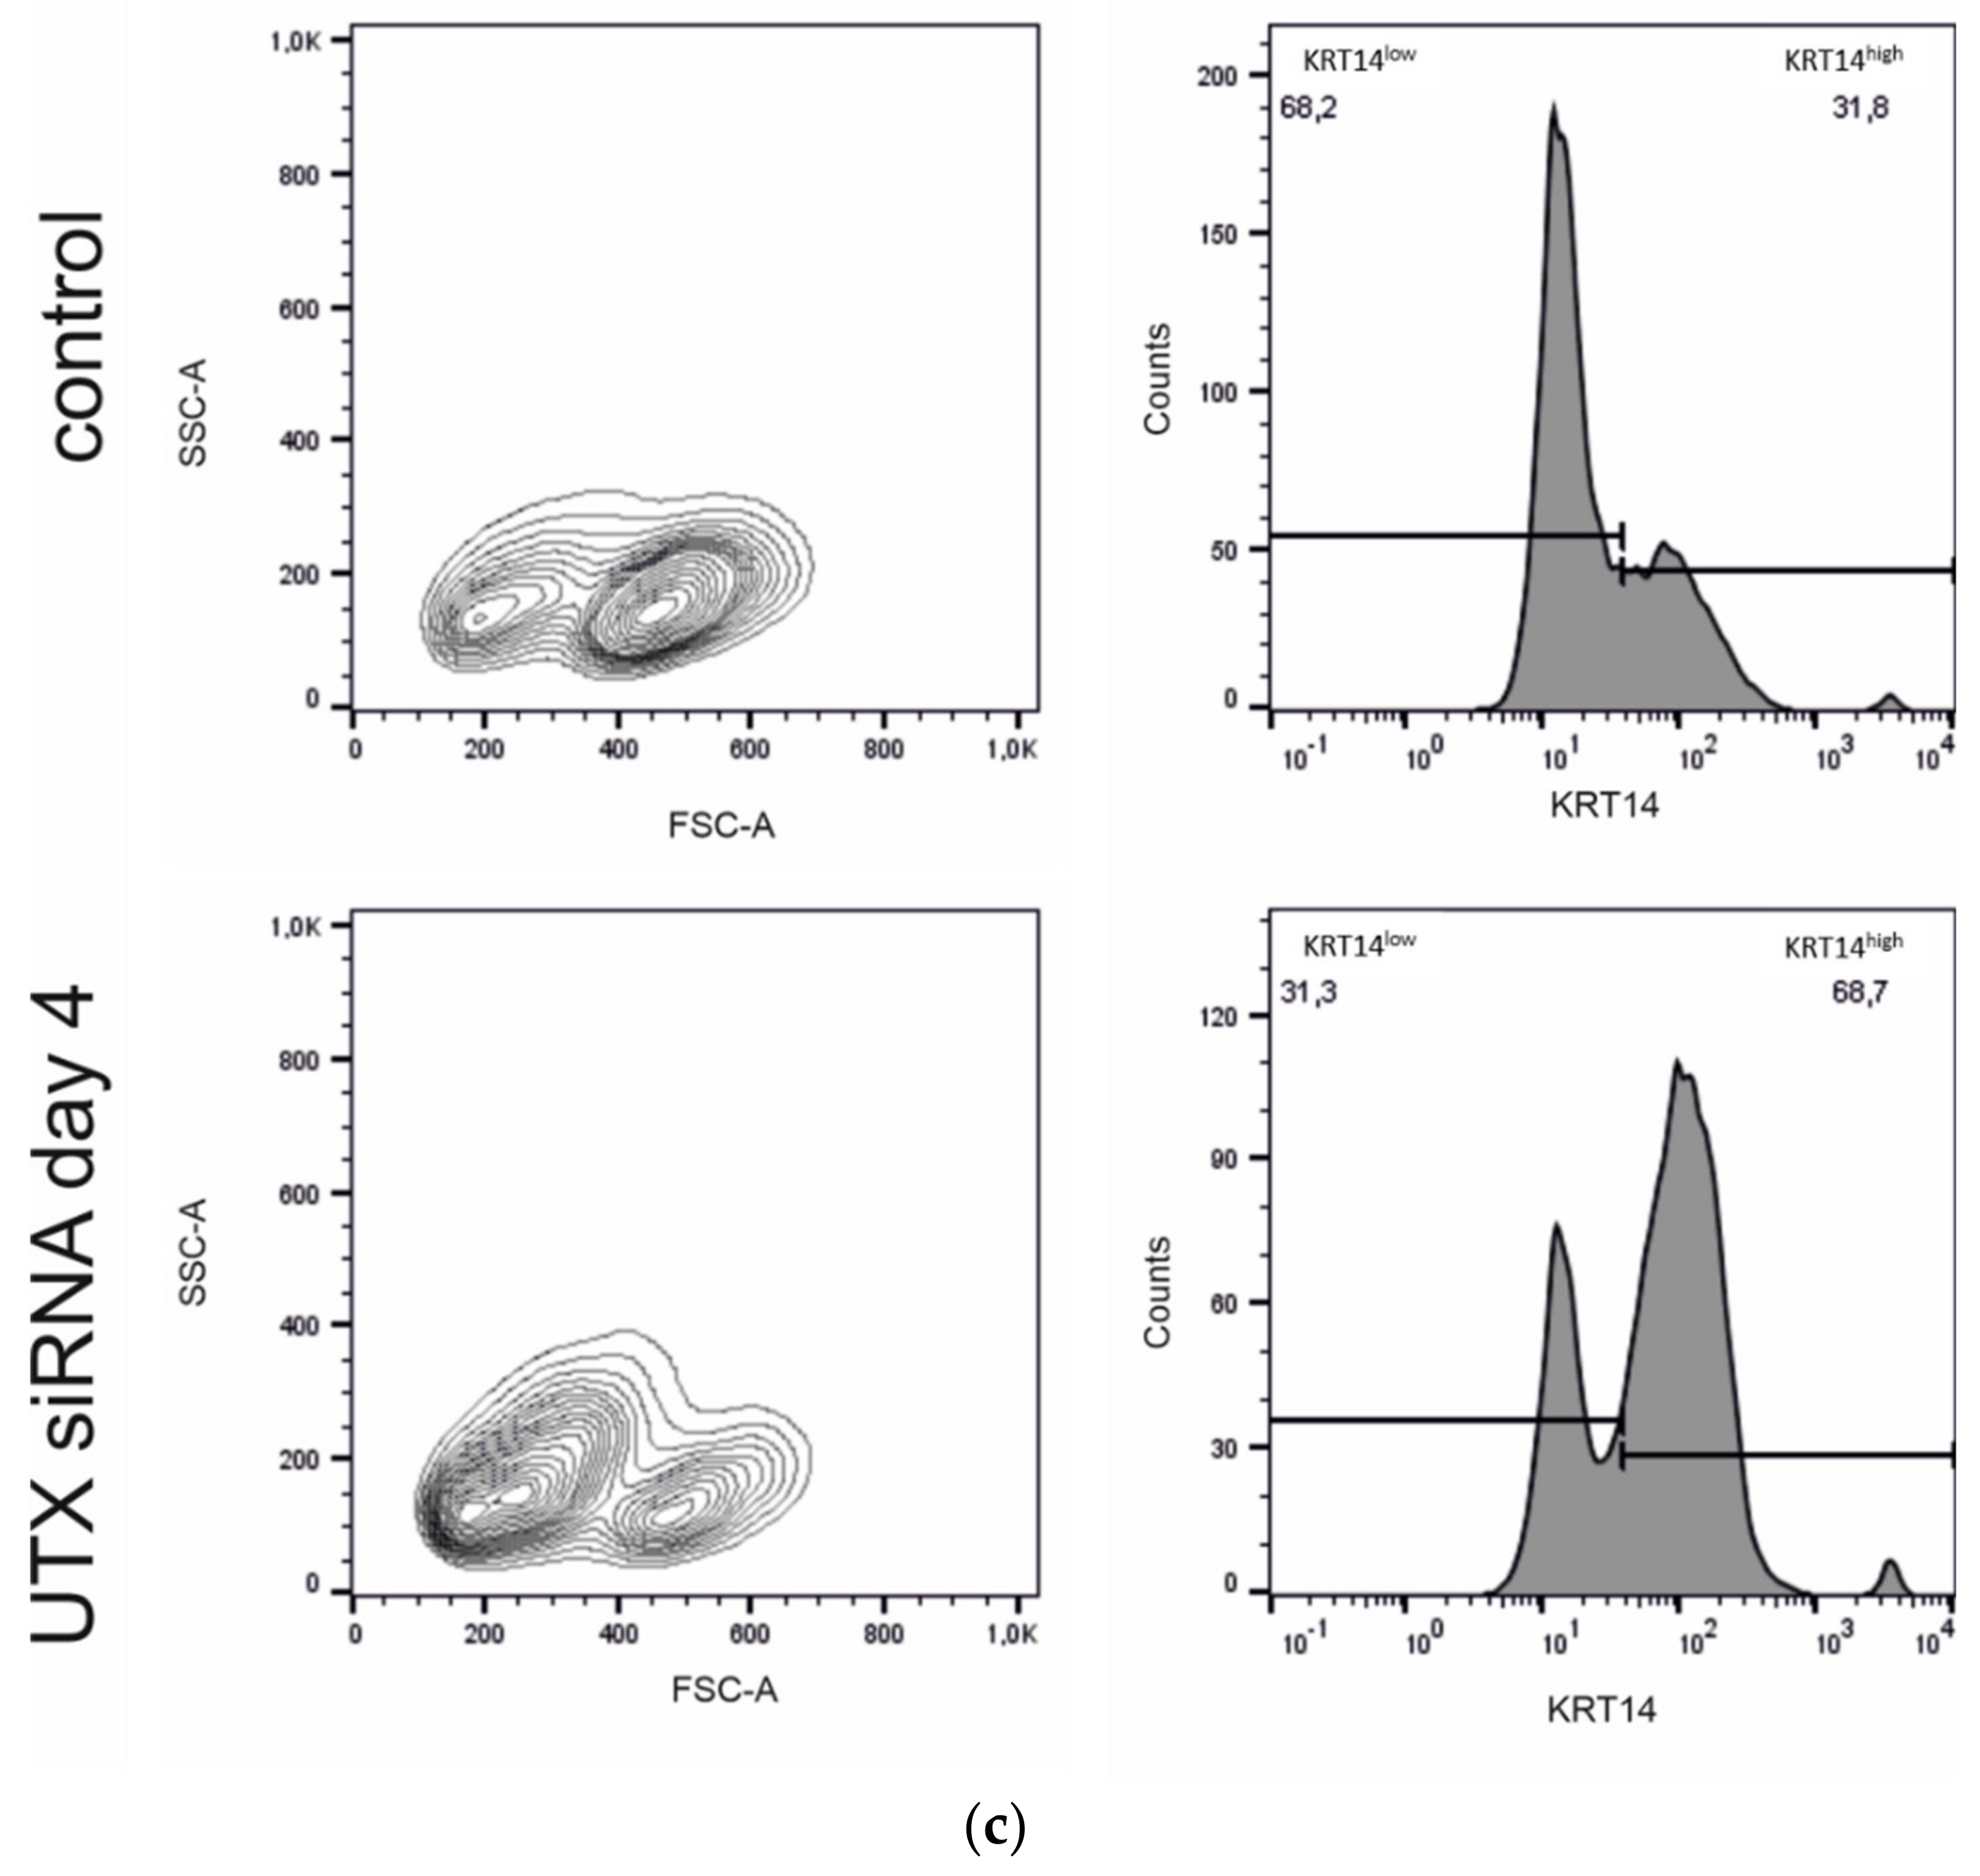
2.4. UTX Knockdown Increases the Fraction of KRT14high Cells
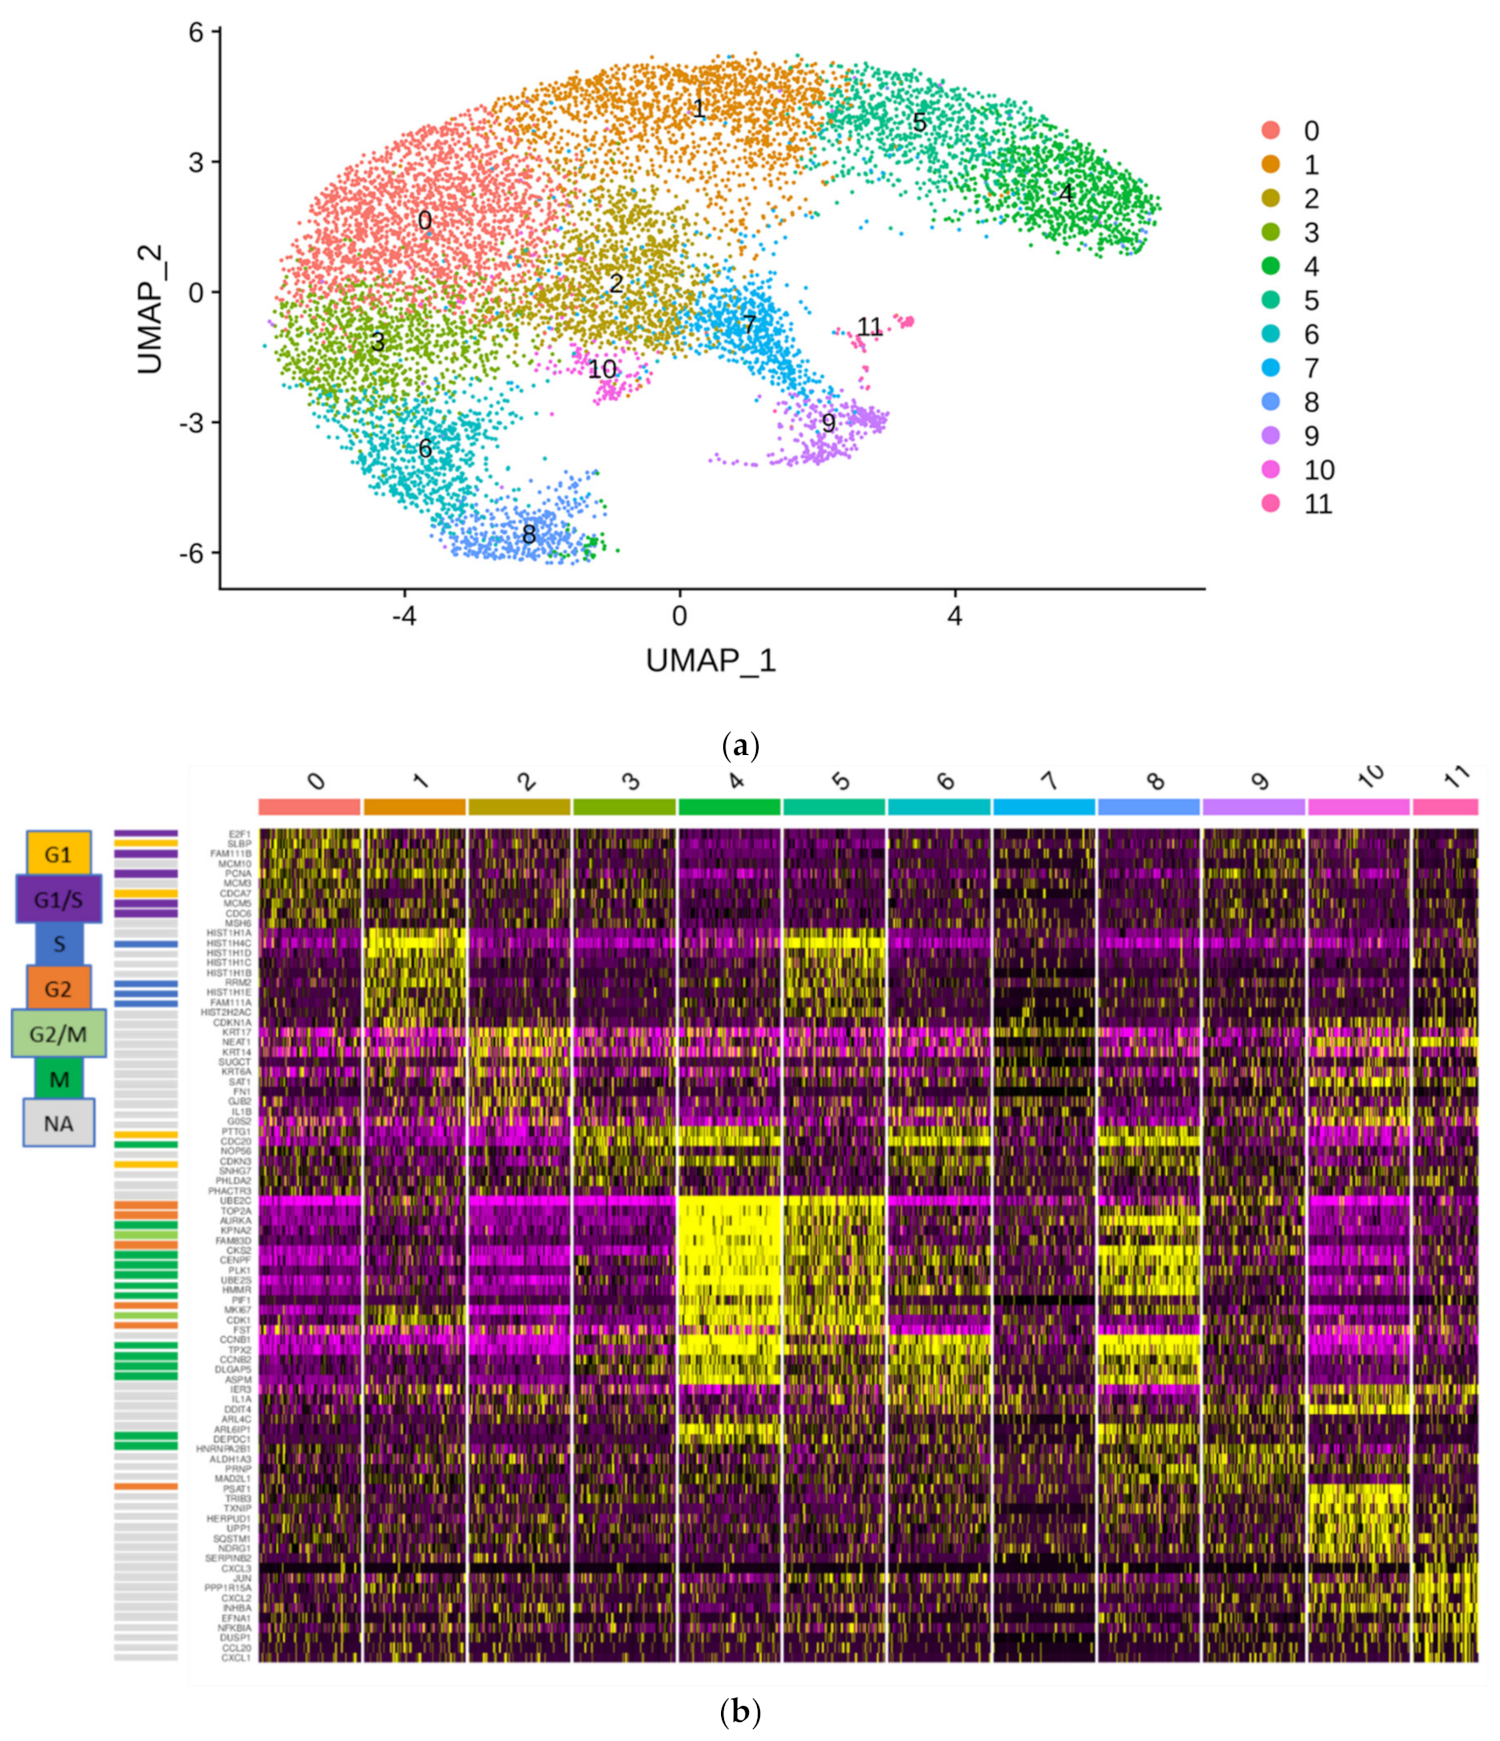
2.5. The HBLAK Cell Line Contains Two Major Subpopulations
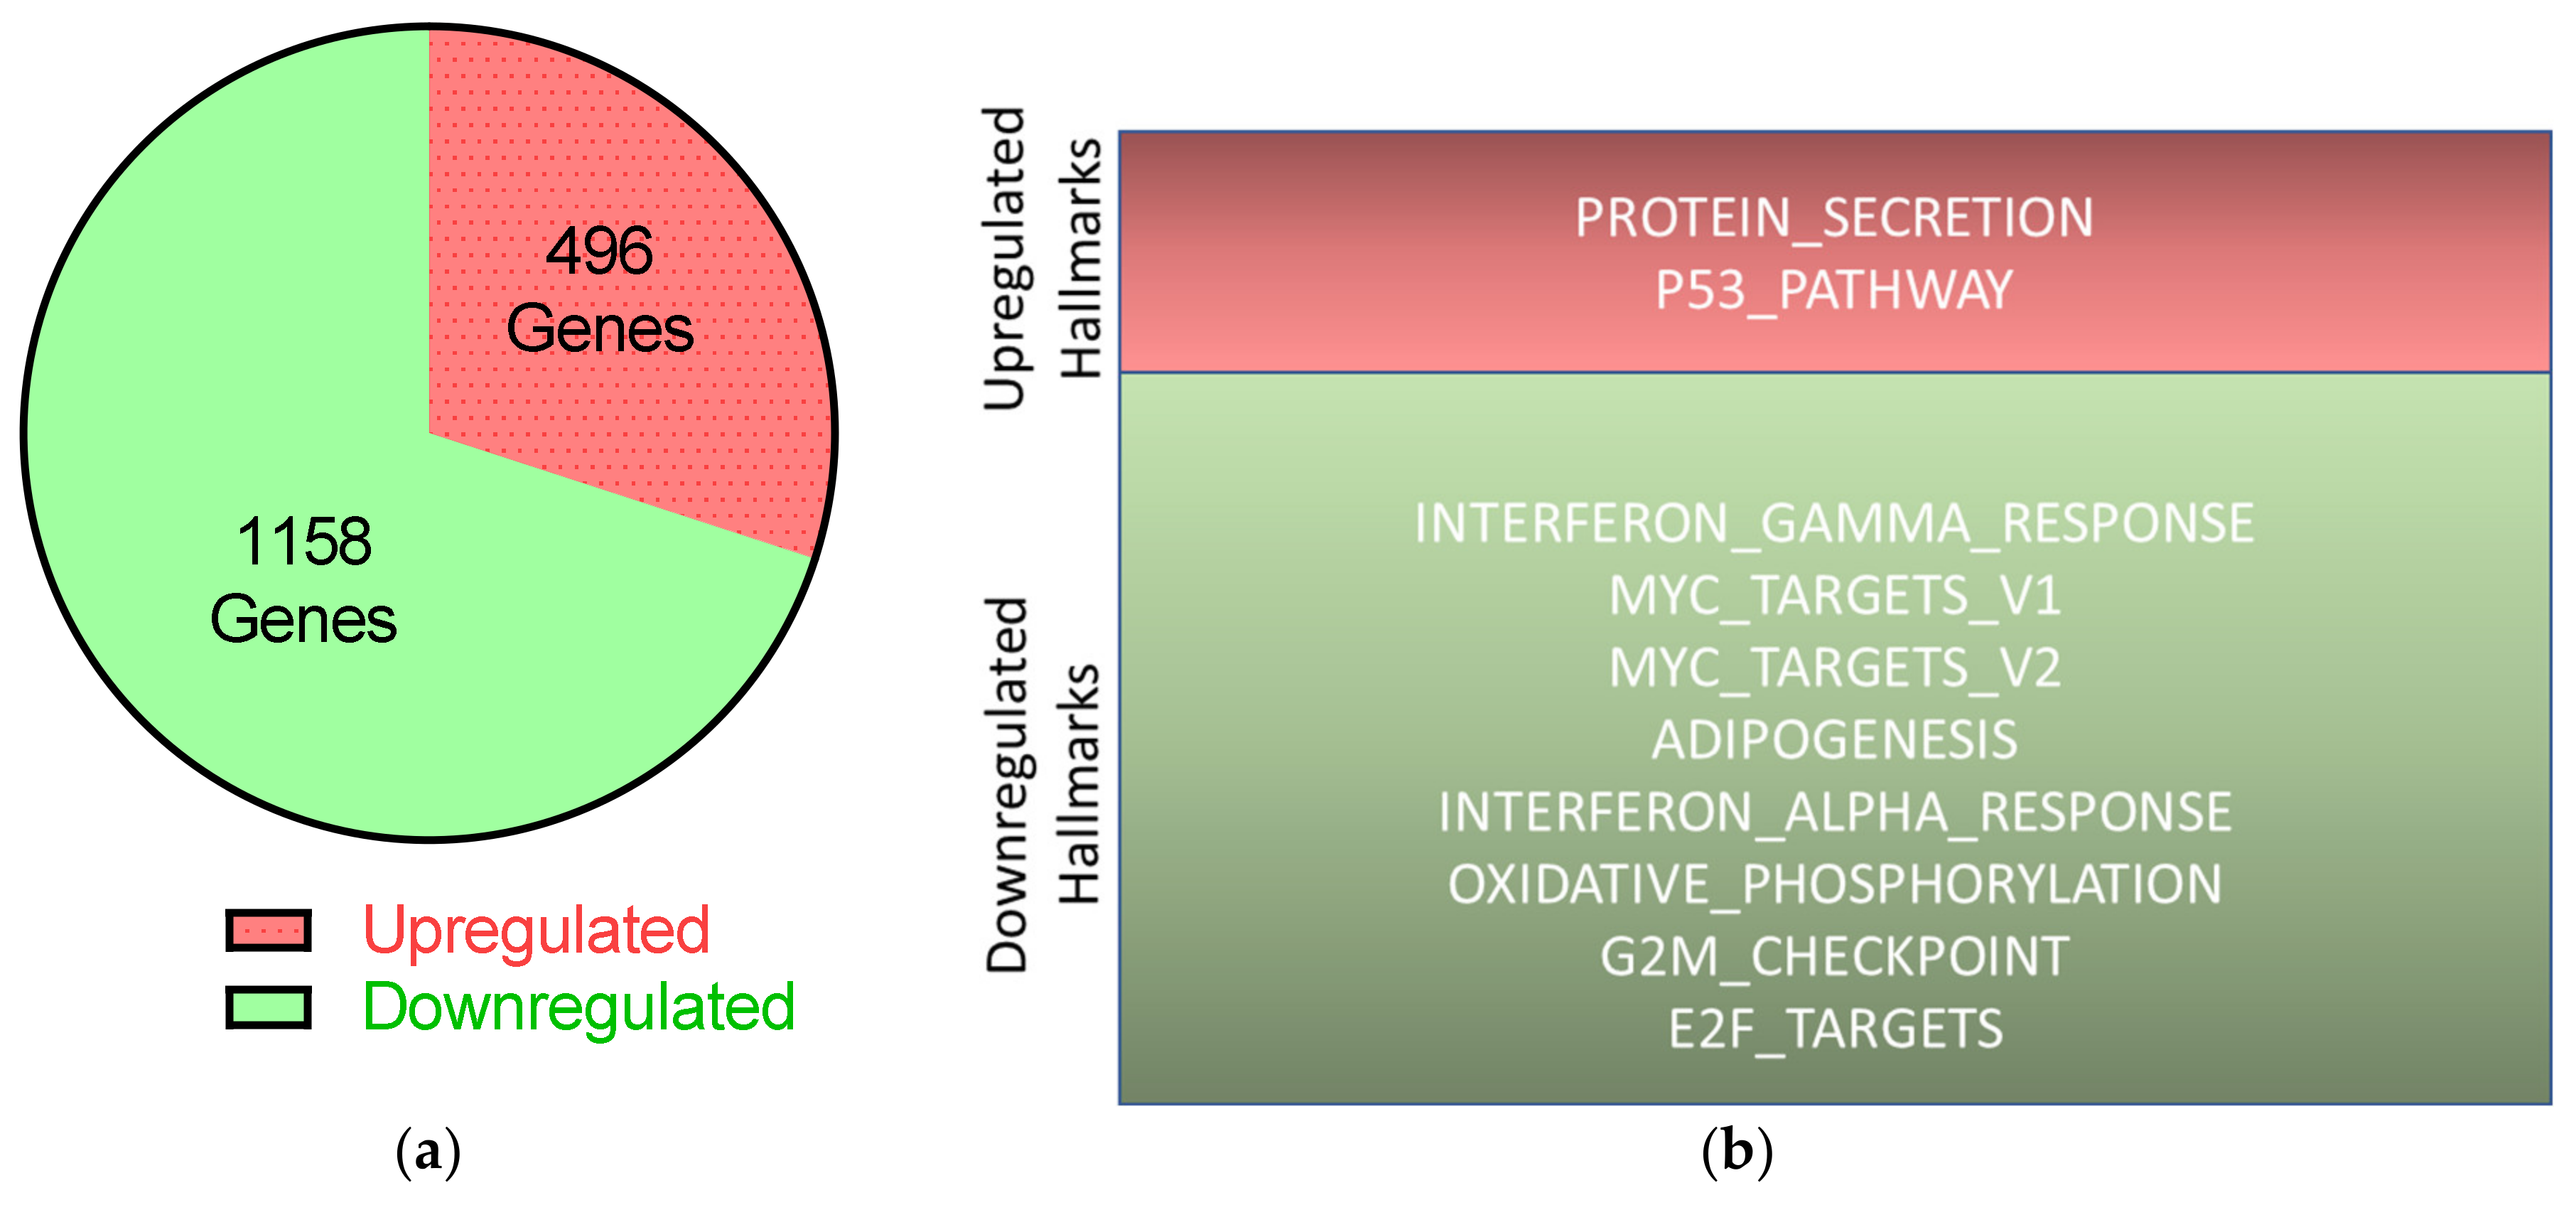
2.6. RNA-Seq Reveals Downregulation of Mitotic Pathways and Upregulation of p53-Signaling by UTX Knockdown
2.7. Apoptosis Induced by UTX Knockdown is Partly Mediated by p53 Activation
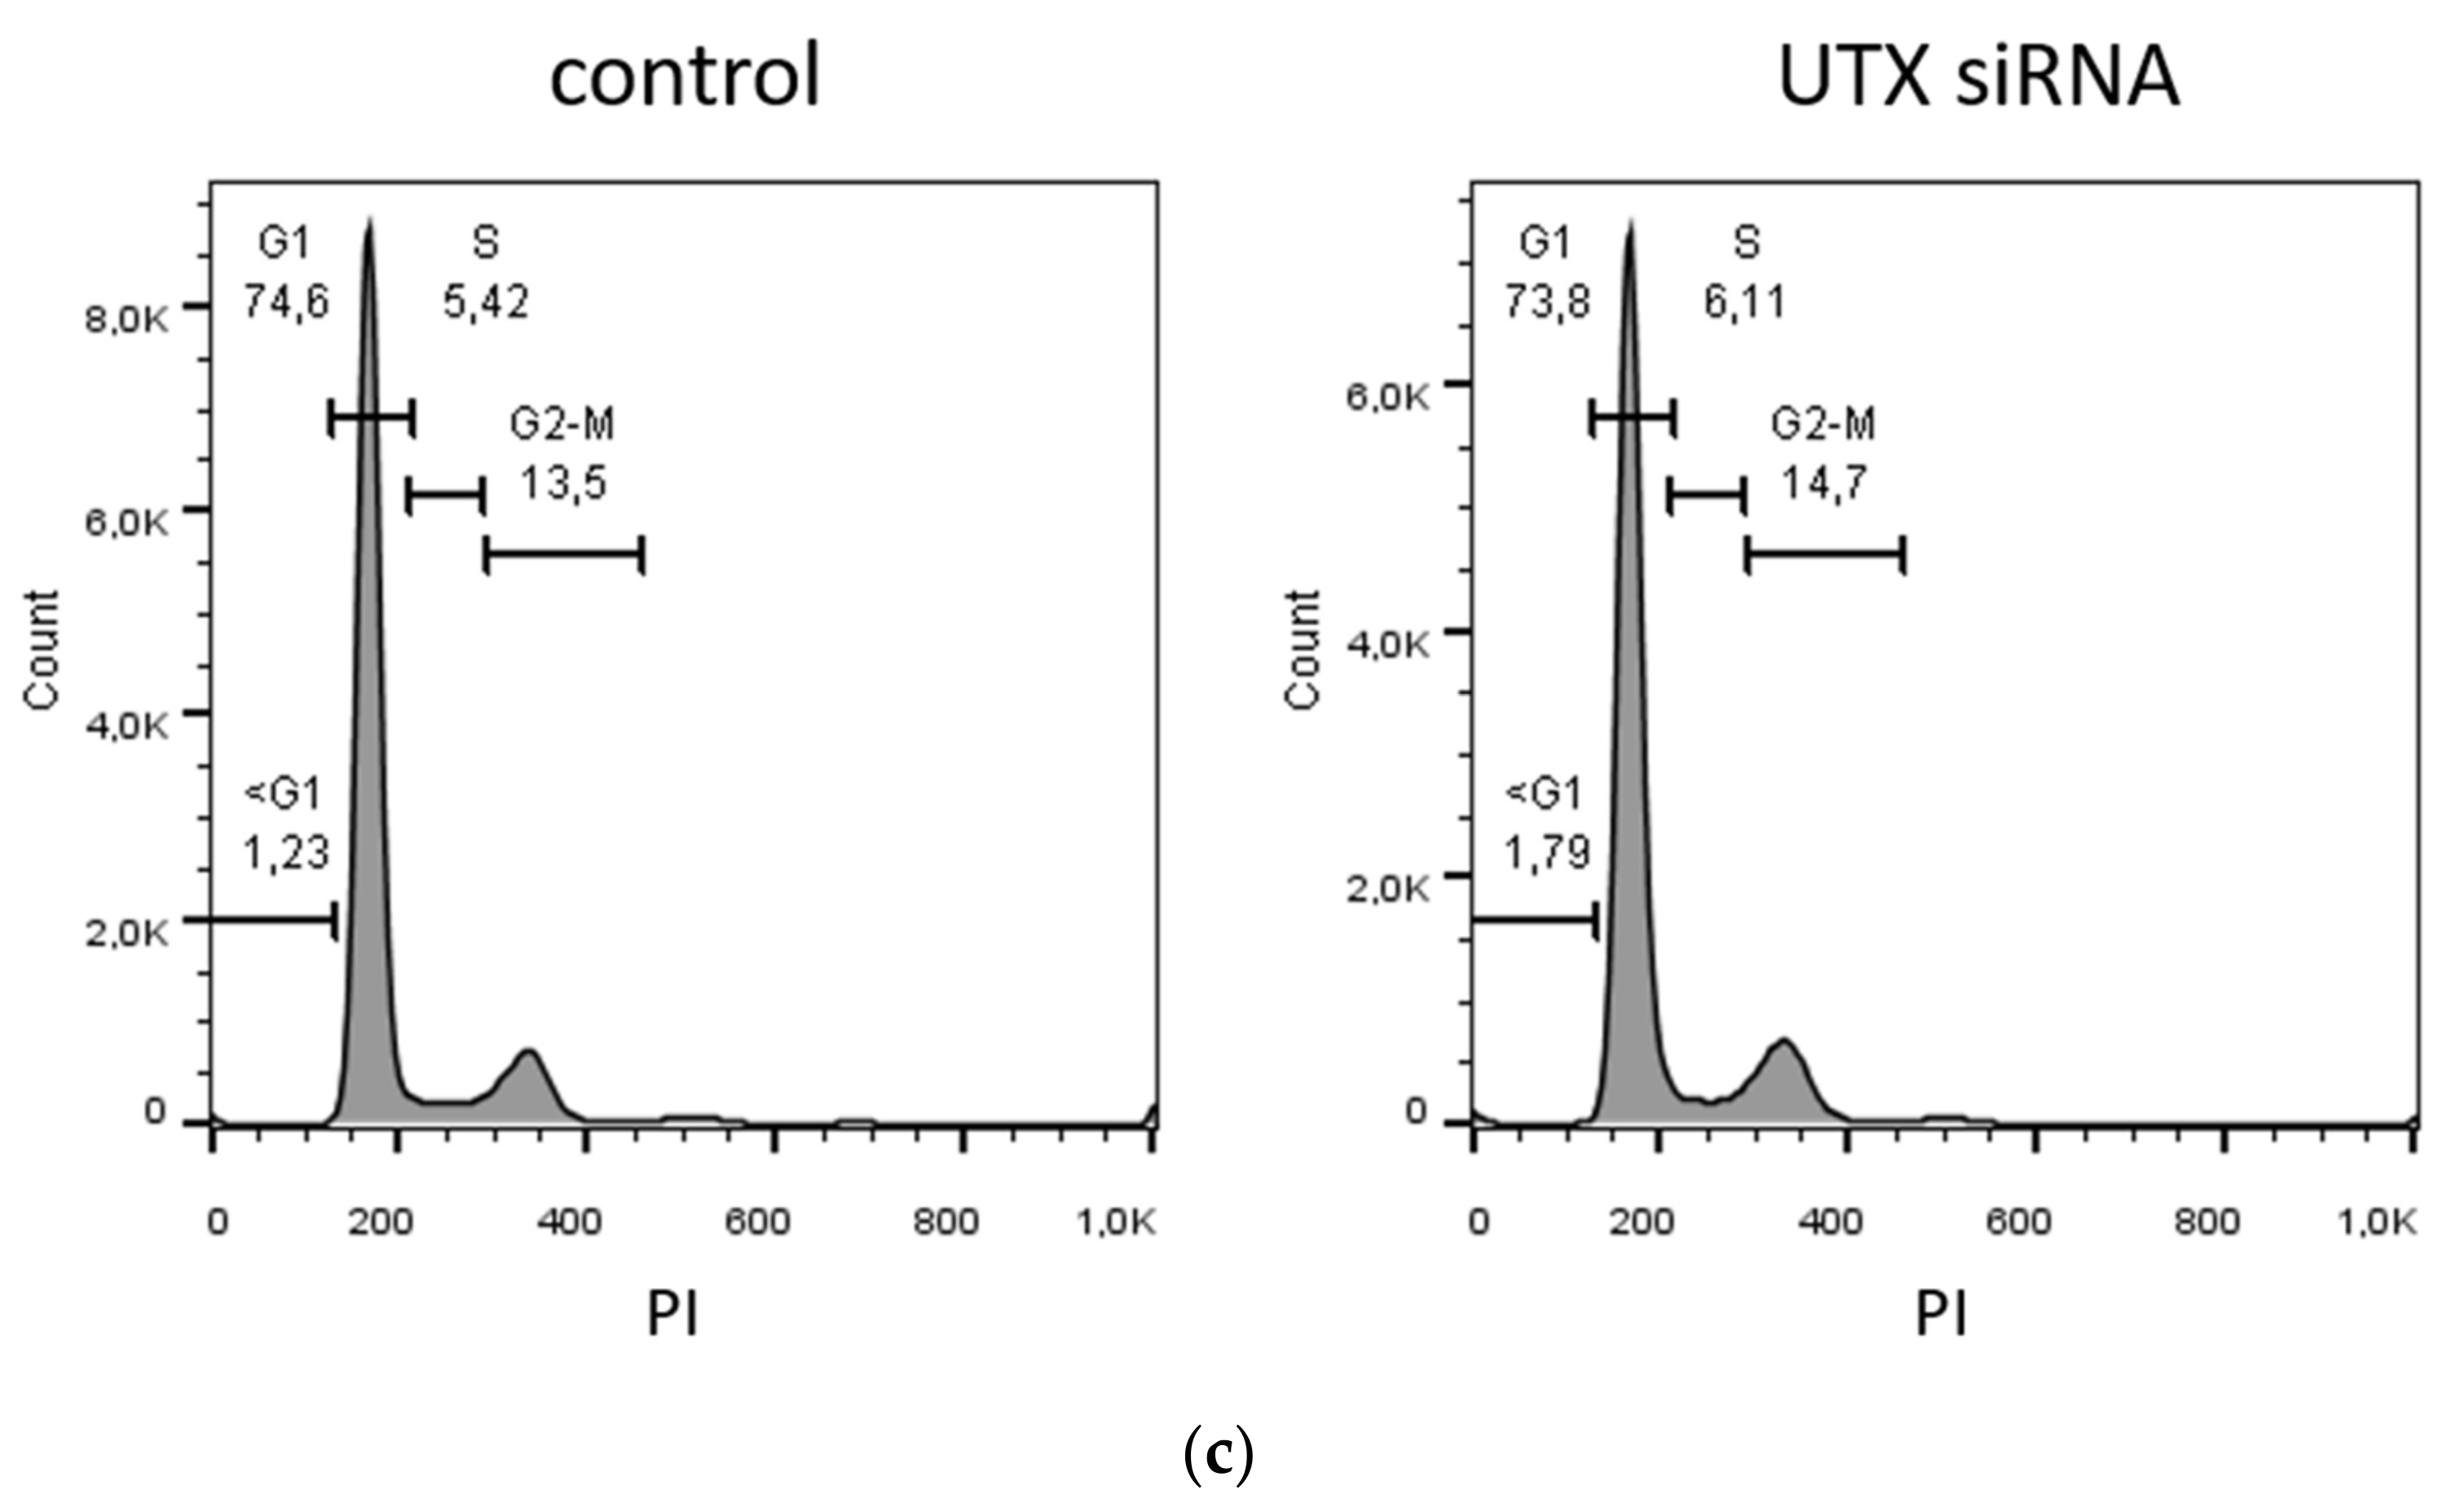
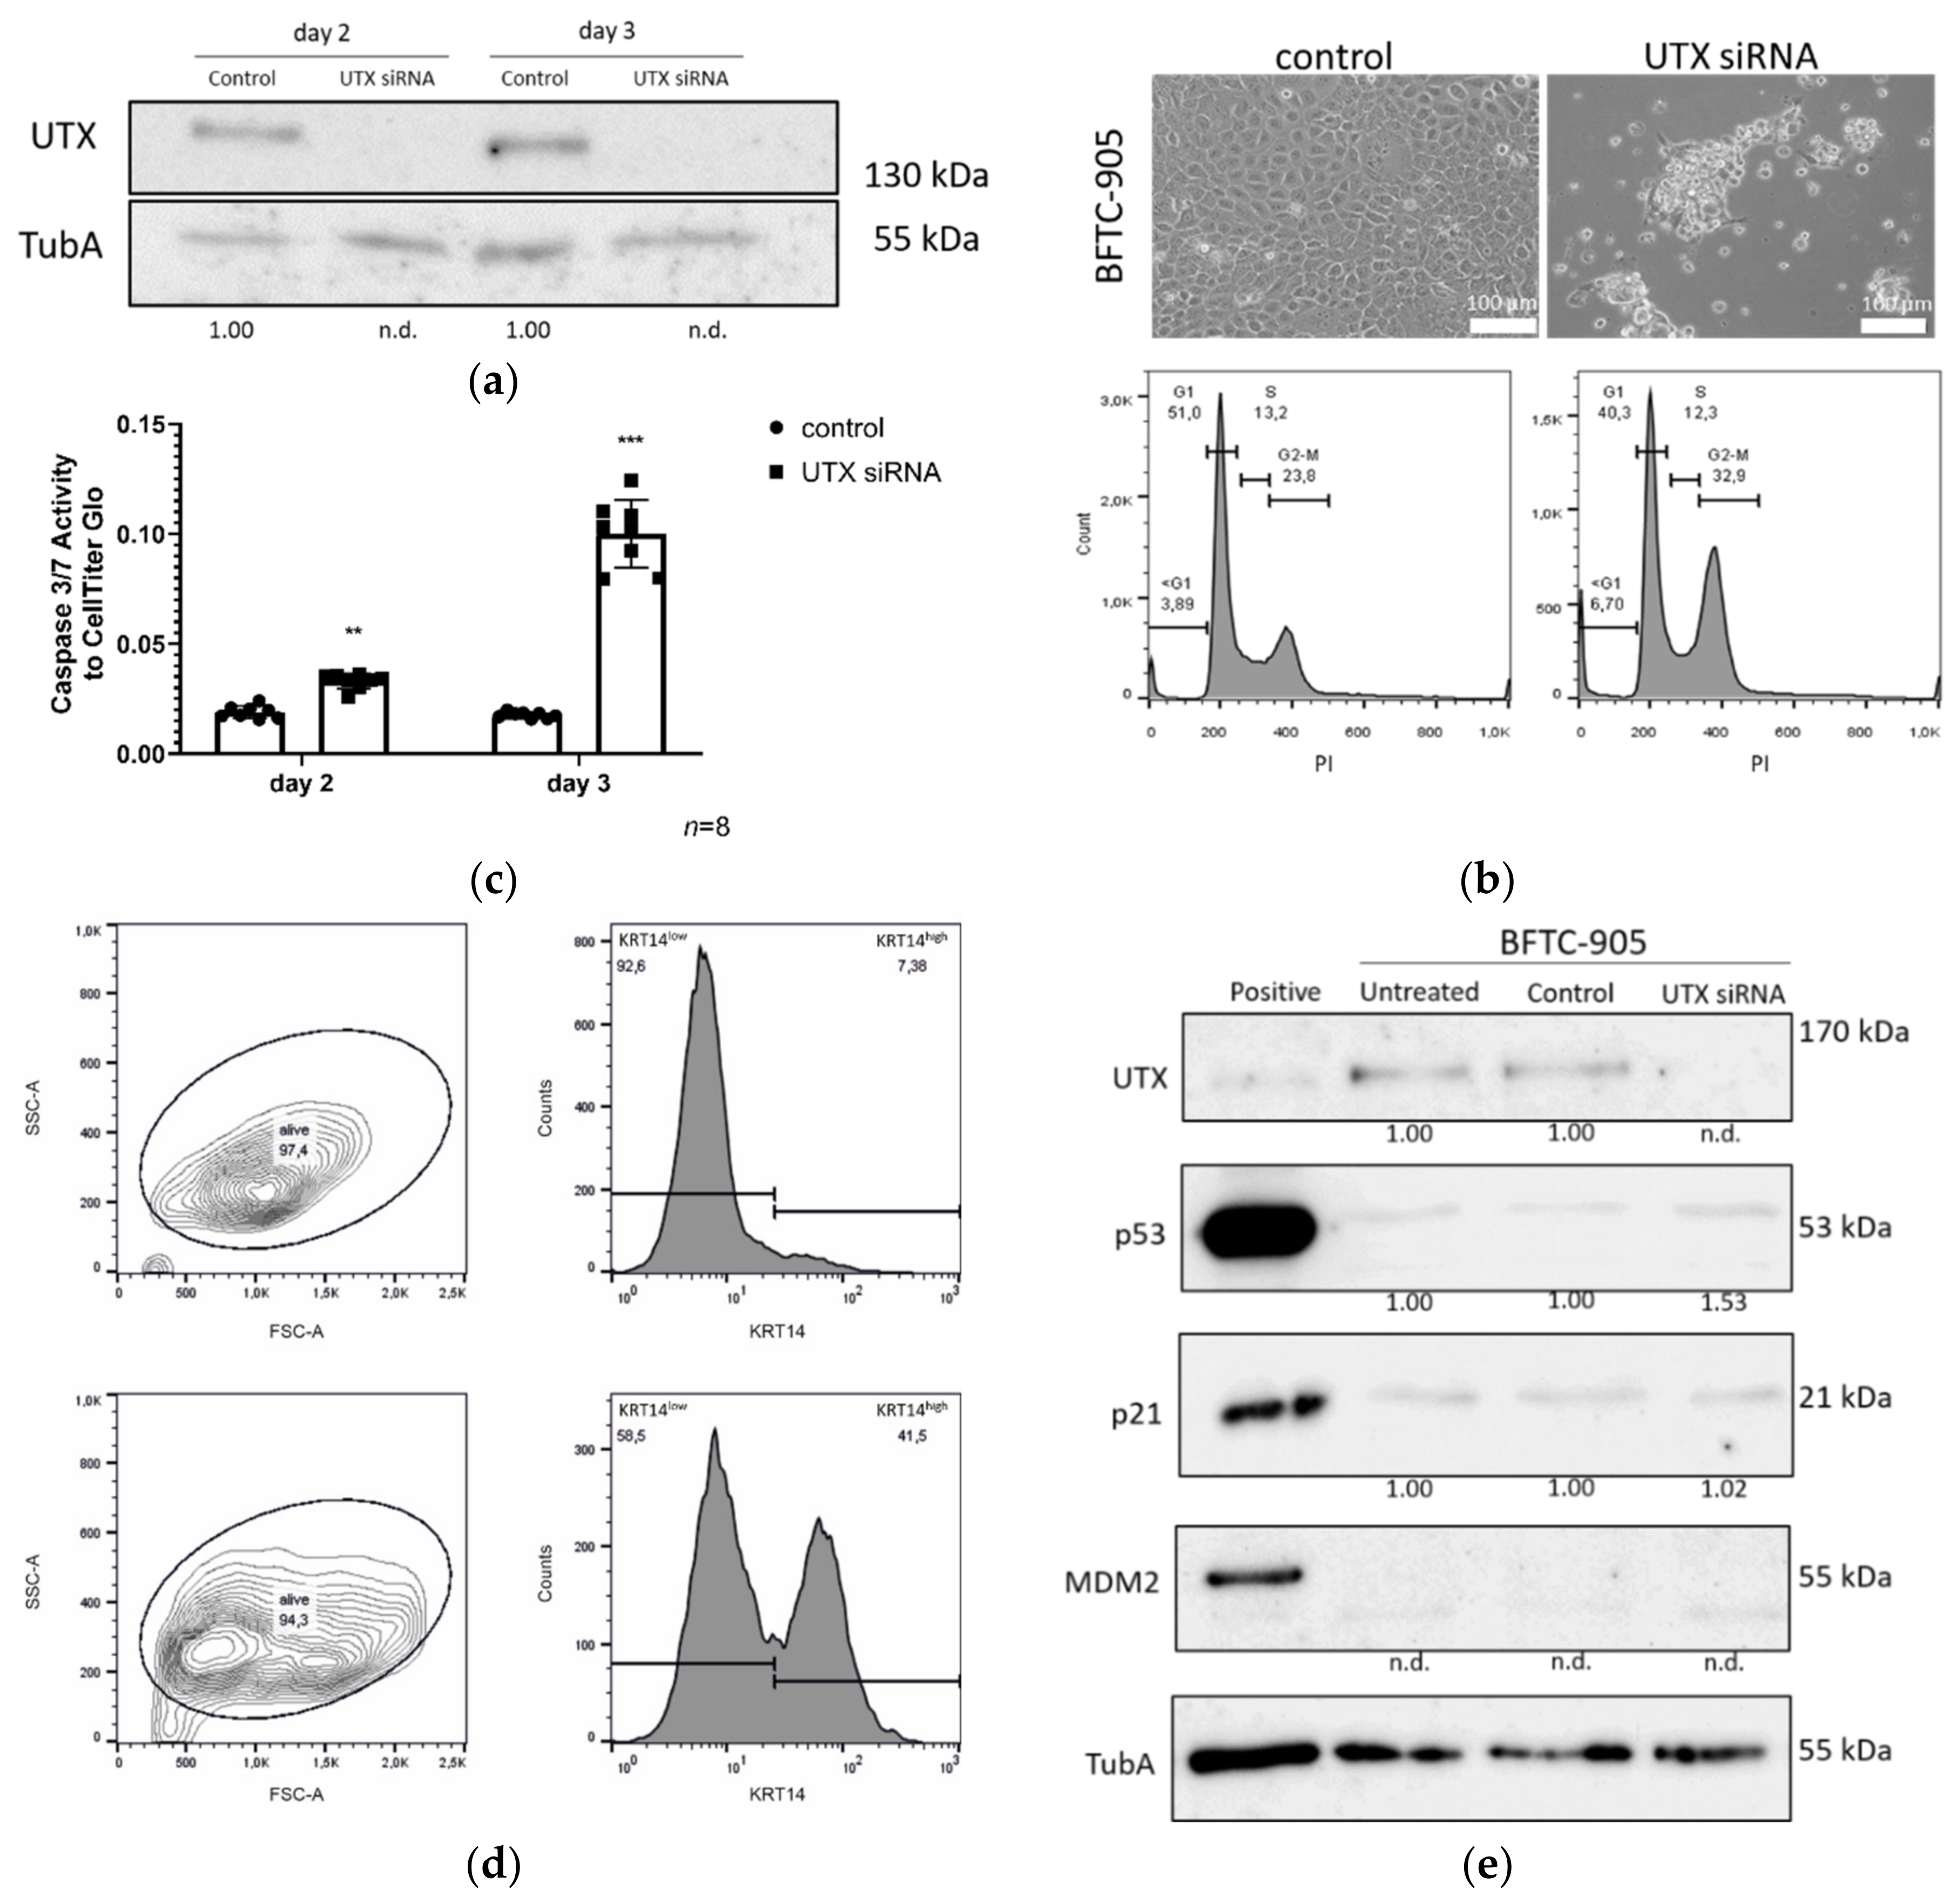
2.8. BFTC-905 Urothelial Carcinoma Cells Are Sensitive to UTX Knockdown
3. Discussion
4. Materials and Methods
4.1. Cell Culture
4.2. Induction of Urothelial Differentiation
4.3. siRNA Transfection
4.4. RNA isolation and RT-qPCR
4.5. Immunocytochemistry (ICC)
4.6. Western Blot Analysis
4.7. Flow Cytometry
4.8. Viability Assay
4.9. EdU-labeling
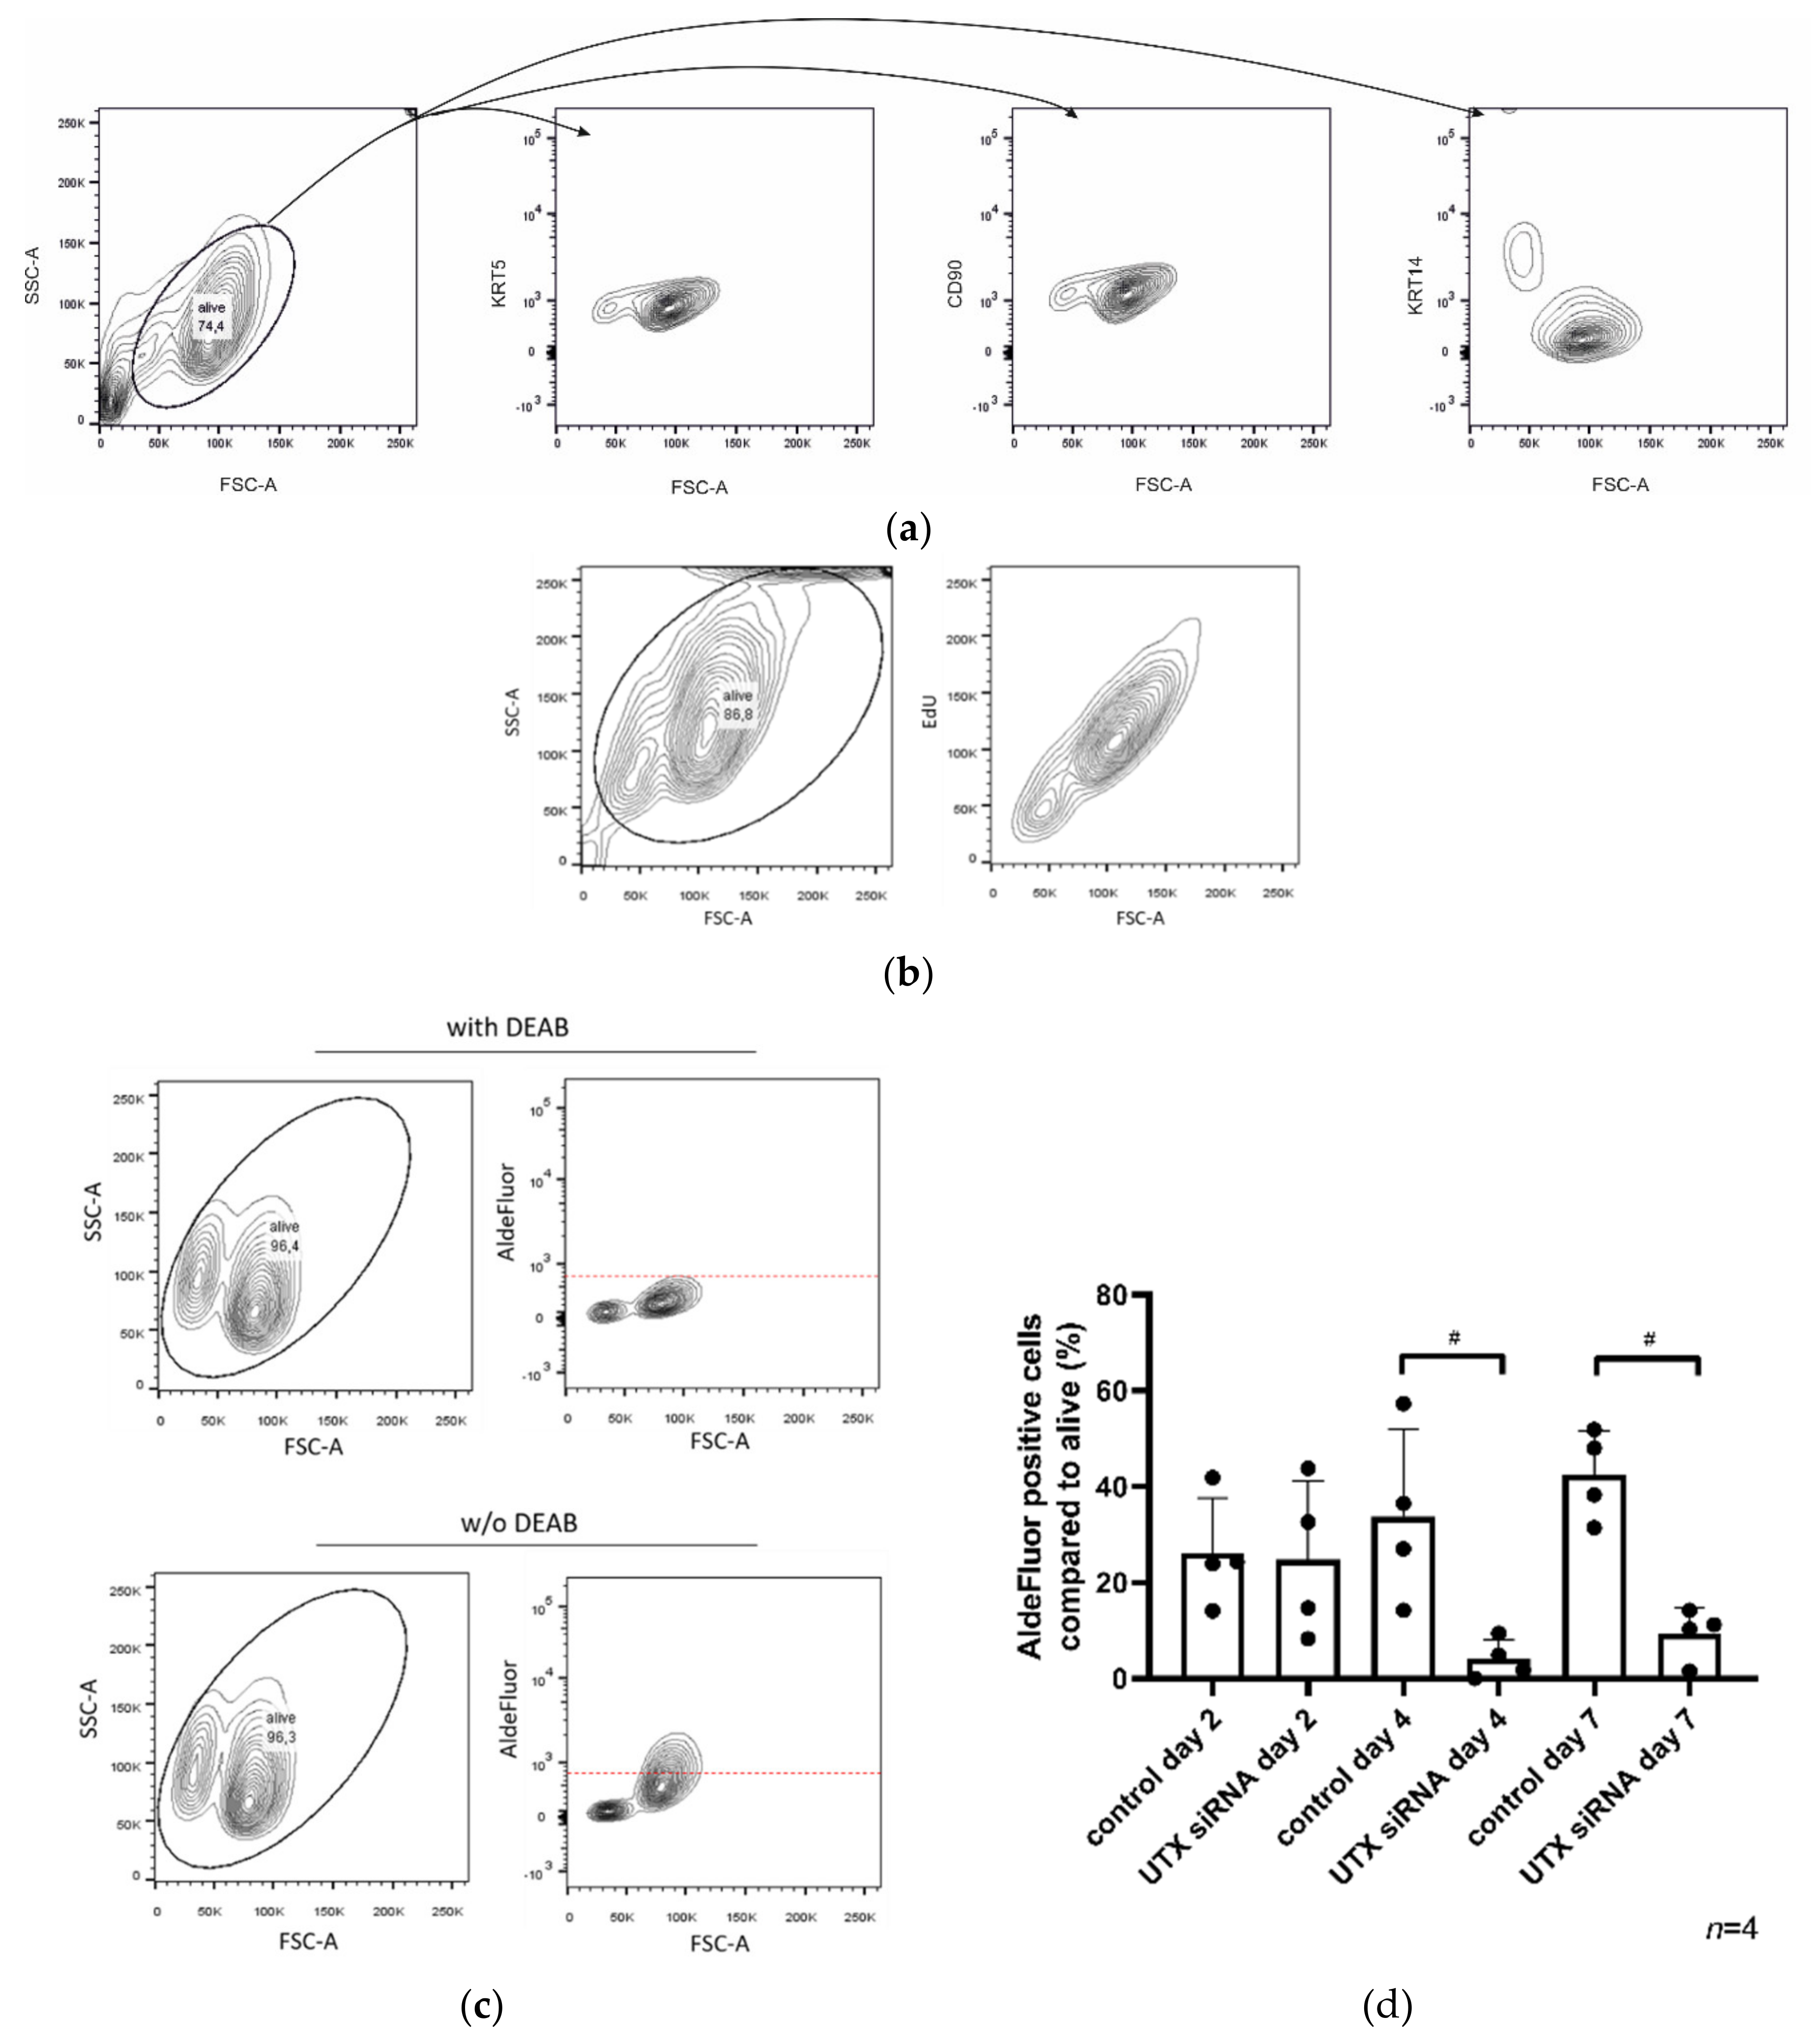
4.10. AldeFluor-Assay
4.11. Cell Cycle Analysis by Flow Cytometry
4.12. Caspase and CellTiter-Glo Assay
4.13. RNA-Seq
4.14. Single Cell RNA-Seq
4.15. Statistics
5. Conclusions
Supplementary Materials
Author Contributions
Funding
Acknowledgments
Conflicts of Interest
References
- Van der Meulen, J.; Speleman, F.; Van Vlierberghe, P. The H3K27me3 demethylase UTX in normal development and disease. Epigenetics 2014, 9, 658–668. [Google Scholar] [CrossRef] [PubMed] [Green Version]
- Schulz, W.A.; Lang, A.; Koch, J.; Greife, A. The histone demethylase UTX/KDM6A in cancer: Progress and puzzles. Int. J. Cancer 2019, 145, 614–620. [Google Scholar] [CrossRef] [PubMed]
- Wang, L.; Shilatifard, A. UTX Mutations in Human Cancer. Cancer Cell 2019, 35, 168–176. [Google Scholar] [CrossRef] [PubMed] [Green Version]
- Lan, F.; Bayliss, P.E.; Rinn, J.L.; Whetstine, J.R.; Wang, J.K.; Chen, S.; Iwase, S.; Alpatov, R.; Issaeva, I.; Canaani, E.; et al. A histone H3 lysine 27 demethylase regulates animal posterior development. Nature 2007, 449, 689–694. [Google Scholar] [CrossRef]
- Agger, K.; Cloos, P.A.; Christensen, J.; Pasini, D.; Rose, S.; Rappsilber, J.; Issaeva, I.; Canaani, E.; Salcini, A.E.; Helin, K. UTX and JMJD3 are histone H3K27 demethylases involved in HOX gene regulation and development. Nature 2007, 449, 731–734. [Google Scholar] [CrossRef]
- Wang, C.; Lee, J.E.; Cho, Y.W.; Xiao, Y.; Jin, Q.; Liu, C.; Ge, K. UTX regulates mesoderm differentiation of embryonic stem cells independent of H3K27 demethylase activity. Proc. Natl. Acad. Sci. USA 2012, 109, 15324–15329. [Google Scholar] [CrossRef] [Green Version]
- Gozdecka, M.; Meduri, E.; Mazan, M.; Tzelepis, K.; Dudek, M.; Knights, A.J.; Pardo, M.; Yu, L.; Choudhary, J.S.; Metzakopian, E.; et al. UTX-mediated enhancer and chromatin remodeling suppresses myeloid leukemogenesis through noncatalytic inverse regulation of ETS and GATA programs. Nat. Genet. 2018, 50, 883–894. [Google Scholar] [CrossRef]
- Zheng, L.; Xu, L.; Xu, Q.; Yu, L.; Zhao, D.; Chen, P.; Wang, W.; Wang, Y.; Han, G.; Chen, C.D. Utx loss causes myeloid transformation. Leukemia 2018, 32, 1458–1465. [Google Scholar] [CrossRef]
- Andricovich, J.; Perkail, S.; Kai, Y.; Casasanta, N.; Peng, W.; Tzatsos, A. Loss of KDM6A Activates Super-Enhancers to Induce Gender-Specific Squamous-like Pancreatic Cancer and Confers Sensitivity to BET Inhibitors. Cancer Cell 2018, 33, 512–526. [Google Scholar] [CrossRef] [Green Version]
- Robertson, A.G.; Kim, J.; Al-Ahmadie, H.; Bellmunt, J.; Guo, G.; Cherniack, A.D.; Hinoue, T.; Laird, P.W.; Hoadley, K.A.; Akbani, R.; et al. Comprehensive Molecular Characterization of Muscle-Invasive Bladder Cancer. Cell 2018, 174, 1033. [Google Scholar] [CrossRef] [Green Version]
- Hurst, C.D.; Alder, O.; Platt, F.M.; Droop, A.; Stead, L.F.; Burns, J.E.; Burghel, G.J.; Jain, S.; Klimczak, L.J.; Lindsay, H.; et al. Genomic Subtypes of Non-invasive Bladder Cancer with Distinct Metabolic Profile and Female Gender Bias in KDM6A Mutation Frequency. Cancer Cell 2017, 32, 701–715. [Google Scholar] [CrossRef] [PubMed]
- Hatina, J.; Schulz, W.A. Stem cells in the biology of normal urothelium and urothelial carcinoma. Neoplasma 2012, 59, 728–736. [Google Scholar] [CrossRef] [PubMed] [Green Version]
- Ho, P.L.; Kurtova, A.; Chan, K.S. Normal and neoplastic urothelial stem cells: Getting to the root of the problem. Nat. Rev. Urol. 2012, 9, 583–594. [Google Scholar] [CrossRef]
- Papafotiou, G.; Paraskevopoulou, V.; Vasilaki, E.; Kanaki, Z.; Paschalidis, N.; Klinakis, A. KRT14 marks a subpopulation of bladder basal cells with pivotal role in regeneration and tumorigenesis. Nat. Commun. 2016, 7, 11914. [Google Scholar] [CrossRef] [PubMed] [Green Version]
- Van Batavia, J.; Yamany, T.; Molotkov, A.; Dan, H.; Mansukhani, M.; Batourina, E.; Schneider, K.; Oyon, D.; Dunlop, M.; Wu, X.R.; et al. Bladder cancers arise from distinct urothelial sub-populations. Nat. Cell Biol. 2014, 16, 982–991. [Google Scholar] [CrossRef]
- Volkmer, J.P.; Sahoo, D.; Chin, R.K.; Ho, P.L.; Tang, C.; Kurtova, A.V.; Willingham, S.B.; Pazhanisamy, S.K.; Contreras-Trujillo, H.; Storm, T.A.; et al. Three differentiation states risk-stratify bladder cancer into distinct subtypes. Proc. Natl. Acad. Sci. USA 2012, 109, 2078–2083. [Google Scholar] [CrossRef] [Green Version]
- Balsara, Z.R.; Li, X. Sleeping beauty: Awakening urothelium from its slumber. Am. J. Physiol. Ren. Physiol. 2017, 312, F732–F743. [Google Scholar] [CrossRef] [Green Version]
- Varley, C.L.; Stahlschmidt, J.; Lee, W.C.; Holder, J.; Diggle, C.; Selby, P.J.; Trejdosiewicz, L.K.; Southgate, J. Role of PPARgamma and EGFR signalling in the urothelial terminal differentiation programme. J. Cell Sci. 2004, 117, 2029–2036. [Google Scholar] [CrossRef] [Green Version]
- Cross, W.R.; Eardley, I.; Leese, H.J.; Southgate, J. A biomimetic tissue from cultured normal human urothelial cells: Analysis of physiological function. Am. J. Physiol. Ren. Physiol. 2005, 289, F459–F468. [Google Scholar] [CrossRef] [Green Version]
- Hoffmann, M.J.; Koutsogiannouli, E.; Skowron, M.A.; Pinkerneil, M.; Niegisch, G.; Brandt, A.; Stepanow, S.; Rieder, H.; Schulz, W.A. The New Immortalized Uroepithelial Cell Line HBLAK Contains Defined Genetic Aberrations Typical of Early Stage Urothelial Tumors. Bladder Cancer 2016, 2, 449–463. [Google Scholar] [CrossRef] [Green Version]
- Lang, A.; Yilmaz, M.; Hader, C.; Murday, S.; Kunz, X.; Wagner, N.; Wiek, C.; Petzsch, P.; Kohrer, K.; Koch, J.; et al. Contingencies of UTX/KDM6A Action in Urothelial Carcinoma. Cancers 2019, 11, 481. [Google Scholar] [CrossRef] [PubMed] [Green Version]
- Sun, T.T. Altered phenotype of cultured urothelial and other stratified epithelial cells: Implications for wound healing. Am. J. Physiol. Ren. Physiol. 2006, 291, F9–F21. [Google Scholar] [CrossRef] [PubMed] [Green Version]
- Subramanian, A.; Tamayo, P.; Mootha, V.K.; Mukherjee, S.; Ebert, B.L.; Gillette, M.A.; Paulovich, A.; Pomeroy, S.L.; Golub, T.R.; Lander, E.S.; et al. Gene set enrichment analysis: A knowledge-based approach for interpreting genome-wide expression profiles. Proc. Natl. Acad. Sci. USA 2005, 102, 15545–15550. [Google Scholar] [CrossRef] [PubMed] [Green Version]
- Szklarczyk, D.; Franceschini, A.; Wyder, S.; Forslund, K.; Heller, D.; Huerta-Cepas, J.; Simonovic, M.; Roth, A.; Santos, A.; Tsafou, K.P.; et al. STRING v10: Protein-protein interaction networks, integrated over the tree of life. Nucleic Acids Res. 2015, 43, D447–D452. [Google Scholar] [CrossRef]
- Huang da, W.; Sherman, B.T.; Lempicki, R.A. Systematic and integrative analysis of large gene lists using DAVID bioinformatics resources. Nat. Protoc. 2009, 4, 44–57. [Google Scholar] [CrossRef] [PubMed]
- Huang da, W.; Sherman, B.T.; Lempicki, R.A. Bioinformatics enrichment tools: Paths toward the comprehensive functional analysis of large gene lists. Nucleic Acids Res. 2009, 37, 1–13. [Google Scholar] [CrossRef] [Green Version]
- Greife, A.; Tukova, J.; Steinhoff, C.; Scott, S.D.; Schulz, W.A.; Hatina, J. Establishment and characterization of a bladder cancer cell line with enhanced doxorubicin resistance by mevalonate pathway activation. Tumor Biol. 2015, 36, 3293–3300. [Google Scholar] [CrossRef]
- Whongsiri, P.; Lang, A.; Hoffmann, M.J.; Schulz, W.A. Personal observation; Heinrich Heine University: Düsseldorf, Germany, 2020. [Google Scholar]
- Warrick, J.I.; Walter, V.; Yamashita, H.; Chung, E.; Shuman, L.; Amponsa, V.O.; Zheng, Z.; Chan, W.; Whitcomb, T.L.; Yue, F.; et al. FOXA1, GATA3 and PPAR Cooperate to Drive Luminal Subtype in Bladder Cancer: A Molecular Analysis of Established Human Cell Lines. Sci. Rep. 2016, 6, 38531. [Google Scholar] [CrossRef]
- Zhou, L.; Sheng, D.; Wang, D.; Ma, W.; Deng, Q.; Deng, L.; Liu, S. Identification of cancer-type specific expression patterns for active aldehyde dehydrogenase (ALDH) isoforms in ALDEFLUOR assay. Cell Biol. Toxicol. 2019, 35, 161–177. [Google Scholar] [CrossRef] [Green Version]
- Su, Y.; Qiu, Q.; Zhang, X.; Jiang, Z.; Leng, Q.; Liu, Z.; Stass, S.A.; Jiang, F. Aldehyde dehydrogenase 1 A1-positive cell population is enriched in tumor-initiating cells and associated with progression of bladder cancer. Cancer Epidemiol. Prev. Biomark. 2010, 19, 327–337. [Google Scholar] [CrossRef] [Green Version]
- Falso, M.J.; Buchholz, B.A.; White, R.W. Stem-like cells in bladder cancer cell lines with differential sensitivity to cisplatin. Anticancer Res. 2012, 32, 733–738. [Google Scholar] [PubMed]
- Ho, P.L.; Lay, E.J.; Jian, W.; Parra, D.; Chan, K.S. Stat3 activation in urothelial stem cells leads to direct progression to invasive bladder cancer. Cancer Res. 2012, 72, 3135–3142. [Google Scholar] [CrossRef] [PubMed] [Green Version]
- Strandgaard, T.; Nordentoft, I.; Lamy, P.; Christensen, E.; Borg Houlberg Thomsen, M.; Bjerggaard Jensen, J.; Dyrskjot, L. Mutational analysis of field cancerization in bladder cancer. bioRxiv 2019, 536466. [Google Scholar] [CrossRef] [Green Version]
- Buscarlet, M.; Provost, S.; Zada, Y.F.; Barhdadi, A.; Bourgoin, V.; Lepine, G.; Mollica, L.; Szuber, N.; Dube, M.P.; Busque, L. DNMT3A and TET2 dominate clonal hematopoiesis and demonstrate benign phenotypes and different genetic predispositions. Blood 2017, 130, 753–762. [Google Scholar] [CrossRef] [Green Version]
- Pasqualucci, L.; Dalla-Favera, R. The genetic landscape of diffuse large B-cell lymphoma. Semin. Hematol. 2015, 52, 67–76. [Google Scholar] [CrossRef] [Green Version]
- Krstic, J.; Galhuber, M.; Schulz, T.J.; Schupp, M.; Prokesch, A. p53 as a Dichotomous Regulator of Liver Disease: The Dose Makes the Medicine. Int. J. Mol. Sci. 2018, 19, 921. [Google Scholar] [CrossRef] [Green Version]
- Ting, K.; Aitken, K.J.; Penna, F.; Samiei, A.N.; Sidler, M.; Jiang, J.X.; Ibrahim, F.; Tolg, C.; Delgado-Olguin, P.; Rosenblum, N.; et al. Uropathogenic E. coli (UPEC) Infection Induces Proliferation through Enhancer of Zeste Homologue 2 (EZH2). PLoS ONE 2016, 11, e0149118. [Google Scholar] [CrossRef]
- Swiatkowski, S.; Seifert, H.H.; Steinhoff, C.; Prior, A.; Thievessen, I.; Schliess, F.; Schulz, W.A. Activities of MAP-kinase pathways in normal uroepithelial cells and urothelial carcinoma cell lines. Exp. Cell Res. 2003, 282, 48–57. [Google Scholar] [CrossRef]
- Hahn, W.C.; Dessain, S.K.; Brooks, M.W.; King, J.E.; Elenbaas, B.; Sabatini, D.M.; DeCaprio, J.A.; Weinberg, R.A. Enumeration of the simian virus 40 early region elements necessary for human cell transformation. Mol. Cell. Biol. 2002, 22, 2111–2123. [Google Scholar] [CrossRef] [Green Version]
- Schindelin, J.; Arganda-Carreras, I.; Frise, E.; Kaynig, V.; Longair, M.; Pietzsch, T.; Preibisch, S.; Rueden, C.; Saalfeld, S.; Schmid, B.; et al. Fiji: an open-source platform for biological-image analysis. Nat Methods 2012, 9, 676–682. [Google Scholar] [CrossRef] [Green Version]
- Pinkerneil, M.; Hoffmann, M.J.; Deenen, R.; Kohrer, K.; Arent, T.; Schulz, W.A.; Niegisch, G. Inhibition of Class I Histone Deacetylases 1 and 2 Promotes Urothelial Carcinoma Cell Death by Various Mechanisms. Mol. Cancer Ther. 2016, 15, 299–312. [Google Scholar] [CrossRef] [PubMed] [Green Version]
- Liberzon, A.; Birger, C.; Thorvaldsdottir, H.; Ghandi, M.; Mesirov, J.P.; Tamayo, P. The Molecular Signatures Database (MSigDB) hallmark gene set collection. Cell Syst. 2015, 1, 417–425. [Google Scholar] [CrossRef] [PubMed] [Green Version]


© 2020 by the authors. Licensee MDPI, Basel, Switzerland. This article is an open access article distributed under the terms and conditions of the Creative Commons Attribution (CC BY) license (http://creativecommons.org/licenses/by/4.0/).
Share and Cite
Lang, A.; Whongsiri, P.; Yilmaz, M.; Lautwein, T.; Petzsch, P.; Greife, A.; Günes, C.; Köhrer, K.; Niegisch, G.; Hoffmann, M.; et al. Knockdown of UTX/KDM6A Enriches Precursor Cell Populations in Urothelial Cell Cultures and Cell Lines. Cancers 2020, 12, 1023. https://0-doi-org.brum.beds.ac.uk/10.3390/cancers12041023
Lang A, Whongsiri P, Yilmaz M, Lautwein T, Petzsch P, Greife A, Günes C, Köhrer K, Niegisch G, Hoffmann M, et al. Knockdown of UTX/KDM6A Enriches Precursor Cell Populations in Urothelial Cell Cultures and Cell Lines. Cancers. 2020; 12(4):1023. https://0-doi-org.brum.beds.ac.uk/10.3390/cancers12041023
Chicago/Turabian StyleLang, Alexander, Patcharawalai Whongsiri, Merve Yilmaz, Tobias Lautwein, Patrick Petzsch, Annemarie Greife, Cagatay Günes, Karl Köhrer, Günter Niegisch, Michèle Hoffmann, and et al. 2020. "Knockdown of UTX/KDM6A Enriches Precursor Cell Populations in Urothelial Cell Cultures and Cell Lines" Cancers 12, no. 4: 1023. https://0-doi-org.brum.beds.ac.uk/10.3390/cancers12041023