Metabolic Plasticity in Ovarian Cancer Stem Cells


1
Departments of Cancer Biology, Wake Forest University School of Medicine, Winston Salem, NC 27157, USA
2
Faculty of Medicine, University of Alexandria, Alexandria 21131, Egypt
3
Departments of Pathology, Wake Forest University School of Medicine, Winston Salem, NC 27157, USA
4
Departments of Urology, Wake Forest University School of Medicine, Winston Salem, NC 27157, USA
5
Comprehensive Cancer Center, Wake Forest Baptist Health Sciences, Winston Salem, NC 27157, USA
*
Author to whom correspondence should be addressed.
Cancers 2020, 12(5), 1267; https://0-doi-org.brum.beds.ac.uk/10.3390/cancers12051267
Submission received: 21 April 2020
/
Revised: 15 May 2020
/
Accepted: 15 May 2020
/
Published: 17 May 2020
(This article belongs to the Special Issue Gene Expression and Molecular Profiling of Human Cancer Stem Cells)
Abstract
:Ovarian Cancer is the fifth most common cancer in females and remains the most lethal gynecological malignancy as most patients are diagnosed at late stages of the disease. Despite initial responses to therapy, recurrence of chemo-resistant disease is common. The presence of residual cancer stem cells (CSCs) with the unique ability to adapt to several metabolic and signaling pathways represents a major challenge in developing novel targeted therapies. The objective of this study is to investigate the transcripts of putative ovarian cancer stem cell (OCSC) markers in correlation with transcripts of receptors, transporters, and enzymes of the energy generating metabolic pathways involved in high grade serous ovarian cancer (HGSOC). We conducted correlative analysis in data downloaded from The Cancer Genome Atlas (TCGA), studies of experimental OCSCs and their parental lines from Gene Expression Omnibus (GEO), and Cancer Cell Line Encyclopedia (CCLE). We found positive correlations between the transcripts of OCSC markers, specifically CD44, and glycolytic markers. TCGA datasets revealed that NOTCH1, CD133, CD44, CD24, and ALDH1A1, positively and significantly correlated with tricarboxylic acid cycle (TCA) enzymes. OVCAR3-OCSCs (cancer stem cells derived from a well-established epithelial ovarian cancer cell line) exhibited enrichment of the electron transport chain (ETC) mainly in complexes I, III, IV, and V, further supporting reliance on the oxidative phosphorylation (OXPHOS) phenotype. OVCAR3-OCSCs also exhibited significant increase in CD36, ACACA, SCD, and CPT1A, with CD44, CD133, and ALDH1A1 exhibiting positive correlations with lipid metabolic enzymes. TCGA data show positive correlations between OCSC markers and glutamine metabolism enzymes, whereas in OCSC experimental models of GSE64999, GSE28799, and CCLE, the number of positive and negative correlations observed was significantly lower and was different between model systems. Appropriate integration and validation of data model systems with those in patients’ specimens is needed not only to bridge our knowledge gap of metabolic programing of OCSCs, but also in designing novel strategies to target the metabolic plasticity of dormant, resistant, and CSCs.
1. Introduction
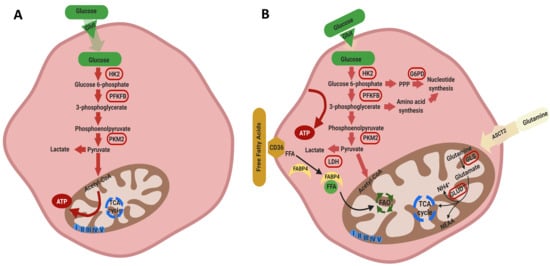
Ovarian cancer (OvCa) is the fifth most common cancer in females and remains the most lethal gynecologic malignancy in the present day [1]. The five-year survival rate of women diagnosed with early localized disease is over 90%, but drops precipitously when diagnosed at stages III or IV [1]. The standard of care clinical management for OvCa includes debulking surgery followed by adjuvant chemotherapy or neoadjuvant chemotherapy followed by surgery [2]. Despite initial responses to chemotherapy, recurrence of chemo-resistant disease is encountered in almost 75% of patients with OvCa [2]. Recurrence has been attributed to suboptimal resection and the presence of residual chemo-resistant OCSCs [3,4] that hold the unique ability to adapt to environmental, metabolic, immunological, and pharmacological cues. While CSC clones may carry identical genetic signatures, increasing evidence has shown significant intra-clonal heterogeneity [5,6]. For example, some subsets of CSCs are maintained in a quiescent non-proliferative state in G0 phase, and upon environmental stimuli, may escape to reenter the cell cycle [7,8,9,10]. Of note, cellular quiescence is not a passive state, but rather is highly regulated by several pathways enabling CSCs swift reactivation [11,12,13]. The activated CSC subsets can undergo a phenotypic switch to a more proliferative epithelial-like state [14] accompanied by a metabolic shift towards increased aerobic glycolysis, OXPHOS, fatty acid oxidation (FAO), and glutaminolysis [15,16]. Active CSCs can metabolize glucose via the pentose phosphate pathway (PPP), producing an abundance of reduced NADPH and macromolecules that serve as the energetic building blocks needed for increased proliferation. Several factors affect this metabolic switch [17]. For example, hypoxic conditions favor a more undifferentiated CSC state with reduced proliferation and decreased cell-fate commitment [18]. Despite the fact that quiescent CSCs possess higher concentrations of ATP than their differentiated counterparts in solid tumors, they are less glycolytic [19,20]. Additionally, in glucose-deprived conditions, CSCs shift to a quiescent state and depend on OXPHOS for ATP production. Due to the extensive spatial and temporal heterogeneity of glucose, glutamine, and oxygen levels in the tumor itself, CSCs are forced to exhibit high metabolic plasticity to meet the increased demands of proliferation and metastasis [21]. Hence, OCSCs reprogram their metabolic and signaling machinery to maximize their survival and re-populate the tumor bulk [3]. This intrinsic ability of OCSCs to switch between different energy sources is viewed as “metabolic plasticity” and continues to pose as a challenge in cancer treatment [4]. Since OCSCs have a pluripotent undifferentiated phenotype, it is widely accepted that they exhibit metabolic plasticity and can switch between glycolysis, TCA cycle, FAO, glutaminolysis, and OXPHOS [22]. Importantly, oncogenes as Protein Kinase B (AKT), Hypoxia-Inducible Factor 1-alpha (HIF-1α), and tumor suppressors as p53 and Phosphatase and Tensin Homolog (PTEN) have been shown to play key roles in metabolic programing in OCSCs [23].
CSCs have been long established in hematologic malignancies; the first reports of CSCs in solid tumors were published in 2003 [24], demonstrating that breast CSCs exhibiting CD44highCD24low cell surface markers isolated from metastatic tumors were able to self-renew and re-establish tumors when injected in immune-deficient mice [24]. In addition to CD44 and CD24, these CSCs expressed the transcriptional machinery associated with epithelial to mesenchymal transition (EMT), including Snail Family Transcriptional Repressor 1 (SNAI1/SNAIL), Snail Family Transcriptional Repressor 2 (SNAI2/SLUG), Twist-related protein 1 (TWIST1), and Zinc Finger E-Box Binding Homeobox 1 (ZEB1) concomitant with down-regulation of the epithelial marker E-cadherin and upregulation of mesenchymal markers, N-cadherin and vimentin [25]. Since these initial studies, CSCs have been reported to express stem cell surface markers as CD117/KIT as well as AC133, the epitope of CD133. [26]. Interestingly, several reports indicated that during differentiation, there is a pronounced decrease in the transcript and protein levels of AC133, but not of CD133 itself [27]. Transcription factors that are implicated in embryonal, hematopoietic, endothelial and neuronal stemness, and differentiation such as SRY (sex determining region Y)-box 2 (SOX2), POU domain, class 5, transcription factor 1/Octamer-binding transcription factor 4 (POU5F1/OCT4), Nanog homeobox (NANOG), and Notch homolog 1 (NOTCH1) have also been identified in CSCs [28]. Moreover, aldehyde dehydrogenase 1 enzyme (ALDH1), specifically its isotype ALDH1A1, has been recently identified as a useful CSC marker for further enrichment of subpopulations expressing one or more of the aforementioned stem cell markers [29]. It is noteworthy that the expression of CSC markers does not always correlate with disease stage or clinical outcome in many cancers due to their expression in small subpopulations or due to technical variations in measuring the expression of these markers [29].
OCSCs were first identified by Bapat and colleagues in 2005 in an experimental model system as a small subset of the cancer cells associated with sustained self-renewal, ability to drive tumor growth, metastatic dissemination, and chemo-resistance [30]. OCSCs have also been reported to express CSC markers that not only serve as markers of stemness, but were also implicated in different aspects of tumor growth, invasiveness, metastasis, chemo-resistance, and recurrence [31].
Most reports of OCSCs relied on in vitro phenotypic behavior, specifically their ability to form spheroids that express one or multiple CSC markers, and their resistance to the standard of care therapy. Chemo-resistant OvCa cells were also reported to exhibit the unique ability to form spheroids in vitro and express CSC markers as CD24, CD44, cKit/CD117, PROM1/CD133, ALDH1A1, SOX2, NANOG, POU5F1/OCT4, and NOTCH1 as well as multi-drug resistance markers [10,31,32,33,34,35,36,37]. Notably, the expression of markers of OCSCs does not depend on the OvCa subtype, but rather on environmental cues [38] as evidenced by varying expression of these markers in OCSC subpopulations under different in vitro cell culture conditions, along with the expression of distinctive transcriptomic signatures [38].
Several studies reported the signaling pathways implicated in the maintenance of cancer cells stemness. However, the metabolic pathways associated with the regulation of stemness are in infancy. CSCs were believed to exhibit the same metabolic programing as non-cancer stem cells, however, recent reports indicated that CSCs rely on multiple metabolic pathways depending on the cancer type, environmental cues, and the experimental model system that induces and/or supports the CSC phenotype [16,39,40]. The goal of this study is to unravel the correlations between putative stem cell markers with perturbed metabolic pathways in OvCa cells, OCSC model systems, as well as in patients’ tumors with the ultimate goal of bridging the knowledge gap in metabolic programing of OCSCs which can serve to guide researchers and physicians in developing and testing model systems and therapeutics targeting recurrent and resistant OvCa.
2. Material and Methods
2.1. Microarray Extraction
Gene expression profiles of two studies of OCSC GSE28799 [41] and GSE64999 [42] with platform information of GPL570 and GPL17077, respectively, were extracted from Gene Expression Omnibus (GEO). Both included ovarian cancer spheroids and their parental cells. GSE28799 included OVCAR3-derived spheroids and their parental OVCAR3 in triplicates. GSE64999 included undifferentiated spheroids and their parental differentiated spheroids in quadruplicates. Studies were selected using keywords: ovarian cancer and stem cells. Only data from studies with 3–4 biological replicates were used for analysis.
2.2. Data Analysis
The differential expression of the OCSCs markers and the enzymes involved in the metabolic pathways in OCSCs and their parental cells was analyzed by the multiple t-test with Holm–Sidak method, and each gene was analyzed individually between the two groups, without assuming a consistent SD with p ≤ 0.05. Data of the OvCa cell lines were downloaded from the Broad Institute Cancer Cell Line Encyclopedia (CCLE) portal (https://portals.broadinstitute.org/ccle/) and were similarly analyzed. The transcripts of OCSC markers and metabolic enzymes were correlated in the OCSC populations using Pearson’s correlation. All analyses were performed using GraphPad Prism 7.0 (San Diego, CA, USA). Correlations of the genes from The Cancer Genome Atlas (TCGA) data were performed using Gene Expression Profiling Interactive Analysis (GEPIA) web tool (http://gepia.cancer-pku.cn/) [43]. Bar graphs representing the prevalence of positive and negative correlations were generated in Microsoft Excel.
3. Results and Discussion
3.1. Correlation Between Putative OCSCs Markers
First, we sought to determine whether the various OCSC markers correlate with each other in patients’ tumors at the transcript level. Correlation analysis of TCGA data using GEPIA web tool revealed that CD44 transcripts significantly correlated with other putative OCSCs markers SOX2, NOTCH1, OCT4/POU5F1, ALDH1A1, but not with CD24, CD117/KIT, CD133/PROM1, or NANOG (Figure 1A). It should be noted that CD44 contains over one hundred splice variants and is the most ubiquitous marker of CSCs. While not all CD44 variants have been correlated with cancer stemness, several prominent variants, including CD44v6 and CD44v8-10 were upregulated in a variety of epithelial malignancies, including ovarian cancer [44,45]. The presence of CD44v8-10 correlated strongly with transition of OCSCs to an epithelial phenotype in ascites while CD44v6 played a role in PI3K/AKT and MAPK pathways, and hence led to enhanced peritoneal dissemination [37,44,46,47]. Significant positive correlations were observed between NOTCH1 and CD133/PROM1 and CD24, between CD117/KIT and ALDH1A1, and between SOX2 and NANOG (Figure S1). Interestingly, modeling the interactions of these OCSC markers using STRING protein-protein interaction web tool, predicted interactions based on experimental evidence between NOTCH1, SOX2, OCT4, NANOG, CD117, and CD133; whereas CD44 connected with drug resistance marker ABCB5 (Figure 1B).
Next, we analyzed data of publicly available datasets from studies that compared OCSCs with their parental cells. In a study that characterized OCSCs from OVCAR3 cell line, GSE28799 [41], we found that, consistent with the original report, CD44, CD24, CD117/KIT, CD133/PROM1, ALDH1A1, and SOX2 were significantly upregulated in OVCAR3 spheroid- derived stem cells compared to their parental OVCAR3 cells. No significant changes were detected in OCT4/POU5F1 and NANOG, however, NOTCH1 expression was significantly down-regulated in spheroid-derived OCSCs compared to parental OVCAR3 cells (Figure 2A). In another study GSE64999 [42], CSC-related features of established serially diluted spheroid cells were examined in vitro under serum-containing and CSC culture conditions (will be referred to thereafter as differentiated and undifferentiated OCSCs, respectively). In this study [42], differentiated spheroids cultured in the presence of serum-containing media underwent epithelial differentiation with epithelial-like morphology and reduction of stem cell markers ALDH1A1 and SOX2 compared to parental undifferentiated spheroids cultured in stem cell media. Further analysis of the associated GSE64999 dataset confirmed the significant upregulation of ALDH1A1 and SOX2 but not the other putative OCSCs’ markers (Figure 2B).
3.2. Correlation between OCSCs Markers and Glycolysis
Glycolysis is an oxygen-independent metabolic pathway that occurs in the cytosol, generating ATP from the conversion of glucose into pyruvate. Glycolytic metabolic reprogramming is critical for the maintenance of CSCs and is associated with cancer progression and chemo-resistance [48]. OCSCs share a similar pattern of glycolytic events with CSCs in cancers of the brain, breast, lung, liver, and bone, that they significantly increase their glucose uptake and lactate production compared with their non-CSC counterparts [49,50,51].
We first compared the expression of the enzymes involved in glycolysis in OCSCs and their parental cells in both GSE28799 and GSE64999. We found that the glucose transporter SLC2A1, Hexokinase 1 (HK1), and pyruvate dehydrogenase kinase 1 (PDK1) were significantly upregulated in OVCAR3 spheroid-derived OCSCs compared to their parental OVCAR3 cells (Figure 3A). In contrast, there was no significant difference in glycolytic enzymes between undifferentiated and differentiated spheroids in GSE64999 (Figure 3B). There was a general trend of positive correlations between OCSC markers and glycolytic enzymes in OVCAR3-spheroids OCSCs compared to their parental OVCAR3. CD44 and CD24 exhibited significant positive correlation with HK1 and phosphoglycerate kinase 1 (PGK1). NOTCH1 exhibited significant positive correlation with HK2. None of the other stemness markers exhibited significant positive correlation with glucose transporters or glycolysis (Figure 3C and Table S1). Consistently, OCSC markers in undifferentiated spheroids in GSE64999, did not exhibit a glycolytic enrichment. CD44 positively correlated with SLC2A6, while CD24 negatively correlated with PHGDH. CD117/KIT exhibited significant negative correlations with SLC2A1 and SLC2A5. CD133/PROM1 exhibited significant positive correlation with HK2, PGK1, PDK1, and enolase1 (ENO1). ALDH1A1 and SOX2 positively correlated with SLC2A3, whereas POU5F1/OCT4 and NANOG positively correlated with SLC2A2. However, NOTCH1 did not exhibit any significant correlation with glycolytic enzymes or glycolysis (Figure 3D and Table S2).
Analysis of patients’ tumors, from TCGA data revealed that CD44 and NOTCH1 were the top CSC markers whose expression exhibited positive correlations with glucose transporters and glycolytic enzymes (Figure 3E and Table 1). NOTCH1 positively correlated with six glucose transporters (SLC2A1-6), HK1 and HK2, the rate limiting enzymes in glycolysis, and nine out of thirteen mapped enzymes involved in glycolysis. Similarly, CD44 was significantly positively correlated with three out of the six glucose transporters, hexokinases as well as nine out of thirteen enzymes involved in glycolysis. CD117/KIT was positively correlated with SLC2A1-4, HK2, and two out of thirteen mapped glycolytic enzymes, 6-phosphofructo-2-kinase/fructose-2,6-biphosphatase 3 (PFKFB3) and phosphoglycerate dehydrogenase (PHGDH); CD133/PROM1 correlated with HK1 and HK2, and two out of the thirteen enzymes in glycolysis. ALDH1A1 correlated with HK1, SLC2A1, and seven out of the thirteen enzymes involved in glycolysis. SOX2 correlated positively with SLC2A3 and four out of the thirteen enzymes in glycolysis. Other cell stemness markers as CD24, OCT4, and NANOG did not significantly correlate with glucose transporters, but positively correlated with only two of the glycolytic enzymes.
Transcriptomic profiling of data of the OvCa cell lines in CCLE revealed that the transcripts of CD44 positively correlated with a glycolytic signature with significant positive correlation with HK2, lactate dehydrogenase A (LDHA), and ENO1, but a negative correlation with SLC2A4 (Figure S2). CD117/KIT exhibited a positive correlation with SLC2A4 and fructose-bisphosphatase (FBP1) which catalyzes hydrolysis of fructose 1,6-bisphosphate to fructose 6-phosphate, the rate-limiting step in gluconeogenesis. CD133/PROM1 expression significantly negatively correlated with SLC2A3, PFKFB3, LDHA, and triosephosphate isomerase 1 (TPI1), and positively correlated with FBP1 and PHGDH. ALDH1A1 negatively correlated with SLC2A4 and SLC2A6. SOX2 expression is negatively correlated with PFKFB3 and positively correlated with SLC2A2 and SLC2A4. POUF5F1/OCT4 was negatively correlated with HK1, SLC2A3, and PHGDH and positively correlated with SLC2A1. NANOG negatively correlated with PGK1, LDHA, TPI1, and positively correlated with PHGDH. NOTCH1 was negatively correlated with SLC2A5 and positively correlated with LDHA (Figure S2).
Taken together, data from GSE28799 and TCGA show positive correlations between the transcripts of OCSC markers and glycolytic markers, whereas in GSE64999, fewer positive correlations were observed with a tendency towards a negative correlation with glycolytic markers. These discrepancies may be due to technical variabilities in experimental model systems using different cell lines under diverse cell growth media; whereas in patients’ tumor samples, the correlations are influenced by tumor heterogeneity and environmental cues. The high glucose and supplemental growth factors and serum present in culture media, combined with normoxic conditions and other pharmacologic inhibitors as Rho-associated protein kinase (ROCK) inhibitor used in the OCSC model in GSE64999 [42] do not represent the glucose and oxygen deprived conditions resulting from dysfunctional vasculature and lack of perfusion that characterizes the OvCa tumor microenvironment (TME) [52]. Specifically, OvCa cells are highly sensitive to oxygen conditions; it is known that to survive hypoxic conditions, OCSCs are forced to upregulate their stem-like properties and behave more aggressively when brought back to higher oxygen environments [53]. Hypoxia also induced a decrease in OXPHOS and fatty-acid desaturation [52]. Further limitations that should be considered are that the in vitro culture models lack vital extracellular matrix components including immune cells, stromal cells, and structural matrices, all of which are known to influence OCSC expression, growth, and differentiation. The absence of biophysical properties including interstitial flow, oxygen partial pressure, and surrounding environmental stiffness as well as the lack of biochemical cues are all factors that must be considered when comparing cell culture systems to in vivo CSC properties [54]. In CCLE databases, the correlations represent the behavior of OvCa cell lines under optimal growth conditions. The expression of CD44 positively and significantly correlated with most glycolytic phenotype in OCSC model systems, patients’ tumors as well as non-stem OvCa cells. This finding is consistent with earlier reports that CD44 is crucial for the regulation of glycolytic metabolism [55].
3.3. Correlation between OCSCs Markers and TCA Cycle
The TCA cycle is a hub for the integration of multiple catabolic and anabolic pathways, as glycolysis, gluconeogenesis, mitochondrial electron transport chain, fatty acid, and cholesterol synthesis as well as glutamine metabolism. TCA cycle generates metabolic intermediates that are not only critical for anabolic and catabolic pathways and redox homeostasis, but are also implicated in the regulation of transformation, carcinogenesis, inflammation, and immunity [22,56,57,58]. The expression and function of the TCA enzymes and metabolites in cancer cells in general and OvCa in particular are unfolding; however, in OCSCs, these are not yet unraveled. Therefore, we sought to determine the association of TCA enzymes with OCSC model systems and in correlation with OCSC markers in patients’ specimens and model systems. We further analyzed the expression of the transcripts of TCA cycle enzymes in OVCAR3-stem cells and their parental controls in GSE28799. We found that aconitase 1 (ACO1), isocitrate dehydrogenase (IDH1), IDH3A, succinate-CoA ligase GDP-forming subunit beta (SUCLG2), and malate dehydrogenase 2 (MDH2) were significantly upregulated in OVCAR3-stem cells, whereas malic enzyme 2 (ME2) was significantly downregulated (Figure 4A). In GSE64999, no significant differences were found between the transcripts of TCA cycle enzymes between differentiated and undifferentiated OCSCs (Figure 4B). In GSE28799, there was a correlation between the expression of the enzyme transcripts and OCSC markers in OVCAR3-stem cells revealed a trend towards positive correlations with TCA enzymes. NANOG positively correlated with ten enzymes with significance only with CS. ALDH1A1 exhibited positive though insignificant correlations with nine enzymes. CD117/KIT positively correlated with six enzymes with significance only with IDH2 and MDH2. Other factors exhibited positive though insignificant correlations with TCA enzymes. CD44 and CD24 exhibited similar five positive and six negative correlation patterns with significant negative correlation with ME2. However, significant negative correlations were observed between CD133 with IDH3B, and SOX2 with IDH2. Neither POU5F1/OCT4 nor NOTCH1 bear significant correlation with key TCA enzymes (Figure 4C and Table S3). Correlating the expression of CSC transcripts with those transcripts of TCA in undifferentiated and differentiated spheroids in GSE64999 revealed a more negative trend. CD44 positively correlated with five enzymes with significance only with ACO1. ALDH1A1 and SOX2 exhibited identical five positive and six negative profiles with significant positive correlation with SUCLG1. POU5F1/OCT4 positively correlated with four enzymes, of them significance was noted with citrate synthase (CS), IDH3B, and SUCLG1. NANOG negatively correlated with seven enzymes with significant negative correlation with MDH2; while NOTCH1 negatively correlated with six enzymes with significance with ACO1. CD24, CD117, and CD133 were all not found to be significantly correlated with enzymes involved in the TCA cycle (Figure 4D and Table S4).
Analysis and correlation of the OCSCs’ markers with TCA enzymes from TCGA datasets (Figure 4E and Table 2) revealed that NOTCH1 positively correlated with all TCA enzymes with significant correlations with all enzymes except SUCLG1/2. Similarly, CD133 positively correlated with all eleven TCA enzymes with significance observed with CS and ACO1. CD44 positively and significantly correlated with ten out of the eleven enzymes namely CS, ACO1/2, IDH1/2/3A, SUCLG1/2, MDH2, and ME2, while CD24 positively correlated with ten out of the eleven enzymes with significant correlations with CS, ACO2, CD117, SUCLG1, and ME2. ALDH1A1 positively correlated with nine out of the eleven enzymes with significance observed with CS, ACO1, IDH1, and SUCLG1. POU5F1/OCT4 positively correlated with eight out of the eleven enzymes with significance observed with ACO1/2, SUCLG2, and ME2. CD117/KIT positively correlated with seven out of eleven enzymes with positive significance observed with CS, ACO1, and IDH2 and significant negative correlation with MDH2. SOX2 positively correlated with seven enzymes with significance observed only with ACO1, whereas NANOG positively correlated with six enzymes with significance observed with CS.
Correlation of OvCa cell line data acquired from CCLE demonstrated a generalized trend of negative correlation between OCSC markers and TCA cycle enzymes. Although CD117/KIT positively correlated with all enzymes, no significance was noted. SOX2 positively correlated with eight enzymes, of them, only CS and IDH3A were significant. ALDH1A1 and POU5F1/OCT4 negatively correlated with nine enzymes with significant negative correlation with CS2 and ME2 as well as IDH3A, respectively. Similarly, CD133/PROM1 negatively correlated with nine enzymes with significance only with ACO1 and SUCLG2. Consistently, CD44 negatively correlated with eight enzymes with significance observed with ACO2 and MDH2; whereas NANOG negatively correlated with five enzymes with significant negative correlation with SUCLG2. NOTCH1 did not significantly correlate with any enzyme in the TCA cycle with a trend towards negative correlations with six enzymes (Figure S3).
These data indicate that the reliance of OCSCs cells on the TCA is demonstrated in TCGA data by the positive correlations between OCSC markers and TCA enzymes. Spheroids from characterized OVCAR3 not only exhibited significant upregulation of most of the TCA enzymes but also exhibited positive correlations with OCSC markers and TCA enzymes suggestive of their reliance on TCA cycle. The discrepancies between the two OCSC model systems further highlight the influence of environmental cues on the expression of their metabolic programing and plasticity.
Conversely, OCSC-like spheroids relied on anaerobic glycolysis and the PPP with decreased reliance on the TCA cycle compared to their parental cells [59]. Another study demonstrated that in SKOV3 and lung A549 model systems, cell populations with high telomerase activity, exhibited significantly higher ability to form spheroids (and hence CSC phenotype), and exhibited enhanced glycolysis, OXPHOS, and increased mitochondrial mass [60]. Consistently, a subset of cancer cells with stem like properties, called side population (SP) cells, were identified in OvCa and other cancer types and exhibited higher glycolytic activity than non-SP cells. The percentage of SP cells significantly increased in glucose-rich conditions. Paradoxically, glucose deprivation or the presence of a glycolytic inhibitor, 3-BrOP, significantly decreased the number of SP cells and decreased their tumor forming ability in mice xenografts [61]. Glucose-induced CSC-like SP proliferation was mediated through an ATP-dependent suppression of AMPK and activation of the AKT pathway [61].
3.4. OXPHOS in Ovarian Cancer Stem Cells
OXPHOS is a process by which NADH and FADH2 generated in TCA cycle transfer electrons to the mitochondrial ETC and occurs via several redox reactions that take place in the inner mitochondrial membrane (IMM). These reactions facilitate the generation of an electrochemical proton (H+) gradient, which subsequently drives the synthesis of energy rich adenosine triphosphate (ATP) by ATP synthases [62].
CSCs may exhibit highly glycolytic or OXPHOS phenotypes with plasticity of metabolic switch between phenotypes depending not only on cancer type and environmental cues, but also upon glucose starvation or OXPHOS blockade [55,63]. For example, CD44+/CD117+ OCSCs isolated from patients’ ascitic fluid exhibited enhanced glucose uptake with heightened OXPHOS. Upon glucose starvation, these OCSCs underwent complete quiescence and down-regulated most metabolic activities, while maintaining an OXPHOS profile [63]. In further support of this, cellular bio-energetic profiling of established and patient-derived OvCa cell lines showed that chemo-sensitive cancer cell lines displayed a glycolytic phenotype while their chemo-resistant counterparts developed an adaptive switch between OXPHOS and glycolysis [64]. Integrated proteomic, metabolomic, and bioenergetic analyses of OVTOKO cells growing in 3D spheroids and expressing high ALDH1A1 levels, showed a high-OXPHOS subtype relying on OXPHOS, supported by glutamine and FAO and a low-OXPHOS subtype that was mainly glycolytic [65].
Comparative analysis of the expression of ETC complexes in OVCAR3-OCSCs in GSE28799 revealed significant upregulation of most of the transcripts of complex I (NADH:ubiquinone oxidoreductases, NDUFA Figure 5A), with inconsistent changes of enzymes of complex II (succinate dehydrogenases, SDHA-D, Figure 5B). Significant increase was observed in six out of eight transcripts of complex III enzymes (ubiquinol: cytochrome C oxidoreductases, UQCR) in OVCAR3-OCSCs compared to parental cells (Figure 5C), but only in four out of thirteen transcripts of complex IV enzymes (cytochrome C oxidases, COX4I1, COX6B1, COX7A1, and COX7C, Figure 5D). Whereas, OVCAR3-OCSCs exhibited significant increase in all the transcripts of complex V enzymes (ATP synthases) compared to parental cells (Figure 5E). In GSE64999, undifferentiated OCSCs exhibited significant upregulation only in one complex I enzyme, NDUFA2, compared to differentiated OCSCs (Figure 5F) with no significant changes in complex II enzymes (Figure 5G). In addition, undifferentiated OCSCs exhibited an upregulation trend of complex III enzyme transcripts with significance observed in three out of the eight enzymes investigated (Figure 5H), whereas for complex IV, they exhibited significant upregulation of COX7C with an upregulation trend in the other transcripts (Figure 5I). Concordantly, the transcripts of ATP synthases were upregulated in undifferentiated OCSCs with significance observed only in ATP5E (Figure 5J). Together, this data indicates that OCSC spheroids exhibit enrichment of the ETC mainly in complexes I, III, IV, and V, further supporting reliance on the OXPHOS phenotype. Interestingly, correlations between the expression of OCSC transcripts and the transcripts of the key ETC enzymes revealed that in OVCAR3-OCSCs in GSE28799, there was a trend of positive correlations with complex I enzymes with NOTCH1, NANOG, and ALDH1A1 exhibiting significant correlations with the transcripts of one of the twelve enzymes. However, there were inconsistent positive and negative correlations between the transcripts of OCSC markers and the transcripts of complexes II, III, IV, and V (Figure 6A and Table S5). In contrast, in GSE64999 the transcripts of OCSC markers in undifferentiated OCSCs exhibited inconsistent positive and negative correlations with transcripts of complexes I, III, IV, and V, with CD24 and CD44 exhibiting positive though insignificant correlations with complex II enzymes (Figure 6B and Table S6). Interestingly, the correlation patterns of the transcripts of OCSC markers and ETC enzymes in patients’ tumors in TCGA data (Figure 6C and Table 3) phenocopied those of undifferentiated OCSCs. These data suggest that OCSC markers do not correlate with those of ETC enzymes in the model systems or in patients’ tumors. The inconsistencies in the positive and negative correlations and their significance may be due to the existence of multiple isoforms for ETC enzymes with redundant activity, or compensation of the activity by mitochondrially encoded ETC enzymes.
Of note, is that analysis of OvCa cell line data curated from CCLE also revealed similar inconsistent pattern of positive and negative correlations with ETC enzymes (Figure S4). CD44 exhibited negative correlations with all investigated enzymes of complexes I and V with significant negative correlations with NDUFS1 and NDUFS2 of complex I. CD44 also exhibited negative correlations with four out of nine enzymes in complex III with significant negative correlation with UQCRC2. In addition, CD44 exhibited negative though insignificant correlation with two out of four complex II enzymes and four out of thirteen complex IV enzymes. SOX2 exhibited positive correlations with all ETC complexes with significant positive correlations with NDUFS3 and NDUFV1 of complex I, CYSC of complex III, and ATP5J of complex V. POU5F1/OCT4 negatively correlated with most of the enzymes of complexes I-V with significant negative correlations with NDUFA10, NDUFAF4, and NDUFAS1-3 of complex I, SDHC of complex II, UQCRC1 and UQCRH of complex III, COX5A of complex IV as well as ATP5D of complex V. However, POU5F1/OCT4 only positively correlated with COX7A1 of complex IV. PROM1/CD133 exhibited a trend of a negative correlations with complexes II, III, and V with significant negative correlation with NDUFA10 of complex I and UQCR10 of complex III as well as significant positive correlation with COX4I1 and COX6B1 of complex IV. KIT/CD117 exhibited positive correlation with complex I, III, and V, and a negative correlation with complex IV, with a significant positive correlation only with NDUFS1 of complex I. ALDH1A1 exhibited negative correlation with complex I and II enzymes with significant negative correlation with NDUFA10 of complex I, and COX6A2 and COX7A1 of complex IV. However, ALDH1A1 positively correlated with COX6A1. Furthermore, NANOG exhibited positive correlation with complexes I, II, and V, with significant positive correlation only with NDUFA11, SDHC, and ATP5J. Finally, NOTCH1 exhibited negative correlations with complexes II, IV, and V, with significant negative correlation only with COX4I2 and COX6B1 as well as ATP5C1. Together, data from CCLE further imply that the expression of the transcripts of OCSC markers CD44, POU5F1/OCT4, and NOTCH1 exhibit most of the significant negative correlations.
3.5. Correlation of OCSC Markers With Lipid Metabolism
Lipid-associated pathways are essential for the maintenance of CSCs [66]. Lipid metabolism is inherently bound to the glucose and amino acid metabolic pathways in order to meet the increasing bio-energetic needs of CSCs. Specifically, epithelial OCSCs utilize OXPHOS and FAO to overcome glucose starvation, and this metabolic trait confers resistance to chemotherapy [64]. It has been shown that when CD44+CD117+ CSCs were isolated from OvCa primary culture, and detached from a monolayer into a suspension state, they reprogramed their metabolism from glycolysis to TCA cycle with active lipid metabolism compared to adherent cultures [67]. Consistently, ALDH+CD133+ OCSCs and spheroids have increased levels of unsaturated lipids compared to non-CSCs in monolayers [68]; an effect that was inhibited by inhibition of lipid desaturases that significantly reduced stemness and eliminated sphere formation in vitro and tumor initiation in vivo [68]. Moreover, overexpression of fatty acid synthase (FASN), a key enzyme in lipogenesis correlated with poor disease outcome [69]. Accordingly, the inhibition of FASN reversed platinum resistance in resistant OvCa cells [70].
Analysis of OVCAR3-OCSCs transcripts in GSE28799 dataset, revealed that compared to parental OVCAR3, OVCAR3-OCSCs exhibited significant increase in the transcripts of fatty acid transporter (CD36), acetyl CoA carboxylase A (ACACA) that catalyzes the first committed step in fatty acid (FA) synthesis from acetyl CoA to malonyl CoA [71], stearoyl-CoA desaturase (SCD), that is also involved in FA biosynthesis, mainly unsaturated FAs, as well as carnitine palmitoyltransferase 1A (CPT1A) that catalyzes the first committed step in FAO [72,73] (Figure 7A). Analysis of the transcripts in undifferentiated vs. differentiated OCSC models in GSE64999 dataset revealed a significant increase in SCD in the undifferentiated OCSCs with an increase, though insignificant, in the enzymes involved in FA synthesis and oxidation as well as CD36 (Figure 7B). This data indicates that OCSCs exhibit a lipid metabolic phenotype that is consistent with the OvCa in the lipid-rich peritoneal TME.
Correlation of the putative OCSC markers and lipid transporters and enzymes in OVCAR3-OCSCs in GSE28799 dataset revealed that NOTCH1, NANOG, OCT4, ALDH1A1, and CD117 exhibited more positive, though insignificant, correlations with lipid metabolism markers than CD44, CD24, CD133, or SOX2. The latter markers exhibited a trend towards negative correlations, with CD44 and CD24 exhibiting significant negative correlations with fatty acid-binding protein 4 (FABP4) (Figure 7C and Table S7). In GSE64999, CD44, CD133, and ALDH1A1 exhibited more positive correlations with lipid metabolic enzymes with significance between CD44 and CPT1B as well as CD133 and CPT1A. OCT4 exhibited significant positive correlation with CD36, but negatively correlated with ACACA. NANOG was negatively correlated with ACACA (Figure 7D and Table S8). TCGA data indicated significant positive correlation between NOTCH1 and CD44, with lipid metabolic markers, followed by CD133, ALDH1A1, and CD117 with significant positive correlations exhibited by SOX2 (Figure 7E and Table 4). Conversely, in CCLE datasets, CD44 negatively correlated with ACACB, CPT1A, and CPT2. CD117 positively correlated with ACACB, CPT2, FASN, and SCD1. CD133 positively correlated with CPT1A. ALDH1A1 was negatively correlated with ACACB. SOX2 was positively correlated with CPT1A and CPT2 and negatively correlated with FABP4. OCT4 was negatively correlated with FABP4, ATP citrate lyase (ACLY), ACACA, FASN, and SCD1 and positively correlated with CPT1A/B. NANOG was positively correlated with CPT2. NOTCH1 was not significantly correlated with the enzymes investigated (Figure S5). These data further support the distinct metabolic phenotypes and “metabolic plasticity” of OCSCs as the acquisition of the OCSC phenotype is associated with enrichment of a lipid metabolic signature. These may explain the ability of OCSCs to survive in the lipid-rich peritoneal TME leading to recurrence after optimal or suboptimal surgery and chemotherapy.
3.6. Glutamine/Glutamate Metabolism in OCSCs
Glutamine metabolism provides the carbon and amino-nitrogen that are necessary for biosynthesis of amino acids, nucleotides, and lipids [74,75,76]. As an anabolic process, glutaminolysis promotes the production of macromolecules with lower energetic potential [77]. Furthermore, glutamine enters cancer cells through the alanine, serine, cysteine transporter 2 (ASCT2; also known as SLC1A5) and is subsequently hydrolyzed to glutamate and ammonia by glutaminase (GLS). Glutamate has dual roles: while it can be combined with cysteine and glycine to form the reduced glutathione (GSH), a major antioxidant that regulates oxidative stress [78], it can also be converted into α-ketoglutarate (αKG) by glutamate dehydrogenases (GLUD) to provide TCA cycle intermediates and, hence, energy production [79]. Furthermore, OCSCs like other CSCs exploit glutamine metabolism for therapeutic resistance. Glutaminolysis significantly correlated with poor survival of OvCa patients [80]. Additionally, glutamine and glutamate concentrations were higher in spheroids than in adherent OCSCs [65]. Targeting glutamine metabolism using a pan-transaminase inhibitor hindered the growth of spheroids from ovarian clear cell carcinomas with inhibition of the mTOR pathway [65], suggesting a promising therapeutic strategy.
Analysis of the expression of the enzymes involved in glutamine metabolism in OCSCs and their parental cells in GSE28799 revealed that the glutamine transporter SLC1A1 and the enzyme GLS, were significantly upregulated in OVCAR3 spheroid-derived OCSCs compared to their parental OVCAR3 cells (Figure 8A). In contrast, there was no significant difference in glutamine metabolism enzymes between undifferentiated and differentiated spheroids in GSE64999 (Figure 8B). In both datasets, very few correlations between stem cell markers and glutamine transporters were noted. In GSE28799, both CD24 and CD44 positively correlated with SLC1A1, while CD133 positively correlated with GLS and negatively correlated with GLUD2. ALDH1A1 positively correlated with SLC1A2 while OCT4 positively correlated with SLC1A3 (Figure 8C and Table S9). In GSE64999, CD133 positively correlated with GLS. CD24 negatively correlated with GLUD1. ALDH1A1 and SOX2 both negatively correlated with SLC1A6. NOTCH1 negatively correlated with SLC1A1 (Figure 8D and Table S10).
Further analysis of patients’ tumors from TCGA data indicated that CD44, ALDH1A1, and NOTCH1 exhibited significantly positive correlations with enzymes involved in glutamine metabolism. CD44 positively correlated with SLC1A1-5, GLS, and GLUD1/2. Similarly, ALDH1A1 exhibited significant positive correlation with four out of the seven glutamine transporters, along with GLS and GLUD1/2. NOTCH1 significantly positively correlated with five out of the seven glutamine transporters, along with GLS and GLUD1/2. CD133 positively correlated with five out of the seven glutamine transporters, while CD117 correlated with three out of seven glutamine transporters, as well as with GLS and GLUD1/2. SOX2 and OCT4 positively correlated with three and two glutamine transporters, respectively. OCT4 also positively correlated with GLS and GLUD1/2. CD24 positively correlated with one glutamine transporter, as well as SLC1A1, but no other significant correlations with other glutamine transporters. NANOG was not positively correlated with any of the glutamine transporters yet was correlated with GLS and GLUD2 (Figure 8E and Table 5). Of note is that transcriptomic profiling of data of the OvCa cell lines in CCLE demonstrated that the transcripts of CD44 and OCT4 both positively correlated with SLC1A1 and GLS; whereas OCT4 negatively correlated with SLC1A2 and SLC1A5. CD117 positively correlated with SLC1A3, while CD133 positively correlated with SLC1A5. Additionally, ALDH1A1 negatively correlated with SLC1A7, while NANOG negatively correlated with SLC1A1 (Figure S6). In summary, data from TCGA show positive correlations between the transcripts of OCSC markers and glutamine metabolism enzymes, whereas in OCSC experimental models of GSE64999, GSE28799, and CCLE, the number of positive and negative correlations observed was significantly lower implying that glutamine metabolism is indispensable for OCSCs and OvCa cells grown in normal conditions, whereas in their complex TME, OvCa cells utilize glutamine metabolism in an anaplerotic reaction for generating energy and metabolic intermediates to fulfill their increasing demands.
While our findings are based on OCSC transcript levels, it is necessary to clarify that the transcript level and proteome levels may not necessarily correlate due to post transcriptional modifications, including splice variation. Alternative splicing accounts for the major difference between the number of protein-coding genes and the number of proteins that are ultimately produced from translation [81]. Through the various splicing mechanisms, as constitutive splicing, mutually exclusive exons, cassette alternative exon, alternative 3′ or 5′ splice site, and intron retention, splicing plays a key role in protein diversification. In effect, by allowing several functionally distinctive proteins to be encoded by the same original gene, splicing does not allow for the direct conversion of the transcriptomic signature into the proteomic signature [81]. Moreover, due to intra-clonal heterogeneity, it is challenging to assign a specific set of stemness markers that define the different subsets of CSCs [82]. Such heterogeneity includes quiescent, precancerous, primary, migrating, chemo-resistant, and radio-resistant CSCs [83]. In OCSCs specifically, multiple subtypes have been identified including proliferating CSCs expressing OCT4, ALDH1/2, CD44, and LGR5/Ki67+ markers and non-proliferating CSCs expressing SSEA4+/Ki67− or ALDH1/2+/Ki67− markers. Other subsets of OCSCs include CD133+ and CD44+/CD117+ all of which can be influenced by tumor microenvironmental cues, upregulation of signaling pathways, and tumor grade, making it difficult to confine OCSCs to a standardized list of markers [4,82].
4. Conclusions
In this study, we sought to investigate the predictive significance of the gene expression of OCSCs in correlation with transcripts of metabolic pathways that are upregulated in HGSOC, that could inform about the metabolic plasticity of tumors, predict the behavior of recurrent or chemo-resistant disease, and ultimately may guide on therapeutics targeting the enriched pathways in combination with standard of care therapy. Comparison of transcripts of OCSC markers with those of enzymes involved in metabolic pathways in OCSC spheroid model systems with patients’ data revealed several distinctive differences in the expression of the stem cell markers. Correlations with energy metabolic pathways, not only between the two model systems investigated, but also with patients’ tumors and cumulative behavior of OvCa cell data from CCLE were elucidated. While these differences between spheroid model systems could be attributed to technical variability in establishing and maintaining of OCSCs as spheroids, nevertheless, they highlight the significance of OvCa heterogeneity, and the influence of micro-environmental cues on metabolic plasticity of OCSCs that may influence their survival and self-renewal capabilities.
It is noteworthy that the limitation of the present study is the paucity of data from established model systems of OCSCs with adequate biological replica that can be used for systematic biological, metabolic as well as transcriptomic analyses to bridge the gap of metabolic programing in OCSCs.
Supplementary Materials
The following are available online at https://0-www-mdpi-com.brum.beds.ac.uk/2072-6694/12/5/1267/s1, Figure S1: Pearson’s correlation between OvCa stem cell (OCSC) markers. Figure S2: Correlations of OCSC markers with glucose transporters and glycolysis enzymes in OvCa cell lines’ data curated from CCLE. Figure S3: Correlations of OVSC markers with TCA cycle enzymes in OvCa cell lines’ data curated from CCLE. Red indicates positive correlations. Figure S4: Pearson Correlation between the expression of OCSC transcripts and the transcripts of the key enzymes involved in ETC in OvCa cell lines’ data curated from CCLE. Figure S5: Correlations of OCSC markers with fatty acid transporters and lipid metabolism enzymes in OvCa cell lines’ data curated from CCLE. Figure S6: Correlations of OCSC markers with glutamine/glutamine transporters and metabolic enzymes in OvCa cell lines’ data curated from CCLE. Table S1: Pearson Correlation between the expression of CSC transcripts and the transcripts of glucose transporters and the key enzymes involved in glycolysis in OVCAR3 spheroids stem cells curated from GSE28799. Table S2: Pearson Correlation between the expression of CSC transcripts and the transcripts of glucose transporters and the key enzymes involved in glycolysis in undifferentiated spheroids stem cells curated from GSE64999. Table S3: Pearson Correlation between the expression of CSC transcripts and the transcripts of the key TCA enzymes in OVCAR3 stem cells from GSE28799. Table S4: Pearson Correlation between the expression of CSC transcripts and the transcripts of the key TCA enzymes in undifferentiated OCSCs from GSE64999. Table S5: Pearson Correlation between the expression of CSC transcripts and the transcripts of the key enzymes involved in the Electron Transport Chain in OvCa cell lines curated from GSE28799. Table S6: Pearson Correlation between the expression of CSC transcripts and the transcripts of the key enzymes involved in the Electron Transport Chain in OvCa cell lines curated from GSE64999. Table S7: Pearson Correlation between OCSC markers and lipid transporters and key enzymes in lipid metabolism in GSE28799. Table S8: Pearson Correlation between OCSC markers and lipid transporters and key enzymes in lipid metabolism in GSE64999. Table S9: Pearson Correlation between OCSC markers and glutamate transporters and key enzymes of glutamate/glutamine metabolism in GSE28799. Table S10: Pearson Correlation between OCSC markers and glutamate transporters and key enzymes in glutamate/glutamine metabolism in GSE64999.
Author Contributions
Conceptualization, A.G., A.Y.A., and N.S.; data curation, A.Y.A. and N.S.; formal analysis, D.G., A.G.; funding acquisition, N.S.; investigation, A.G., A.Y.A., and N.S.; methodology, A.G., A.Y.A., and N.S.; resources, N.S.; software, N.S.; supervision, N.S.; writing—original draft, A.G., D.G., and A.Y.A.; writing—review and editing, N.S. All authors have read and agreed to the published version of the manuscript.
Funding
National Cancer Institute: R01CA193437; National Institute of General Medical Sciences: T32GM127261
Conflicts of Interest
The authors declare no conflict of interest.
References
- Siegel, R.L.; Miller, K.D.; Jemal, A. Cancer statistics, 2020. CA Cancer J. Clin. 2020, 70, 7–30. [Google Scholar] [CrossRef] [PubMed]
- Borley, J.; Wilhelm-Benartzi, C.; Brown, R.; Ghaem-Maghami, S. Does tumour biology determine surgical success in the treatment of epithelial ovarian cancer? A systematic literature review. Br. J. Cancer 2012, 107, 1069–1074. [Google Scholar] [CrossRef] [PubMed] [Green Version]
- Al-Alem, L.F.; Pandya, U.M.; Baker, A.T.; Bellio, C.; Zarrella, B.D.; Clark, J.; DiGloria, C.M.; Rueda, B.R. Ovarian cancer stem cells: What progress have we made? Int. J. Biochem. Cell Biol. 2019, 107, 92–103. [Google Scholar] [CrossRef]
- Kenda Suster, N.; Virant-Klun, I. Presence and role of stem cells in ovarian cancer. World J. Stem Cells 2019, 11, 383–397. [Google Scholar] [CrossRef]
- Malanchi, I.; Santamaria-Martinez, A.; Susanto, E.; Peng, H.; Lehr, H.A.; Delaloye, J.F.; Huelsken, J. Interactions between cancer stem cells and their niche govern metastatic colonization. Nature 2011, 481, 85–89. [Google Scholar] [CrossRef]
- Visvader, J.E.; Lindeman, G.J. Cancer stem cells: Current status and evolving complexities. Cell Stem 2012, 10, 717–728. [Google Scholar] [CrossRef] [Green Version]
- Chen, W.; Dong, J.; Haiech, J.; Kilhoffer, M.C.; Zeniou, M. Cancer Stem Cell Quiescence and Plasticity as Major Challenges in Cancer Therapy. Stem Cells Int. 2016, 2016, 1740936. [Google Scholar] [CrossRef] [Green Version]
- Takeishi, S.; Nakayama, K.I. To wake up cancer stem cells, or to let them sleep, that is the question. Cancer Sci. 2016, 107, 875–881. [Google Scholar] [CrossRef]
- Zeuner, A. The secret life of quiescent cancer stem cells. Mol. Cell Oncol. 2015, 2, e968067. [Google Scholar] [CrossRef] [Green Version]
- Gao, M.Q.; Choi, Y.P.; Kang, S.; Youn, J.H.; Cho, N.H. CD24+ cells from hierarchically organized ovarian cancer are enriched in cancer stem cells. Oncogene 2010, 29, 2672–2680. [Google Scholar] [CrossRef] [Green Version]
- Cheung, T.H.; Rando, T.A. Molecular regulation of stem cell quiescence. Nat. Rev. Mol. Cell Biol. 2013, 14, 329–340. [Google Scholar] [CrossRef] [PubMed]
- Wang, S.H.; Lin, S.Y. Tumor dormancy: Potential therapeutic target in tumor recurrence and metastasis prevention. Exp. Hematol. Oncol. 2013, 2, 29. [Google Scholar] [CrossRef] [PubMed] [Green Version]
- Sosa, M.S.; Bragado, P.; Aguirre-Ghiso, J.A. Mechanisms of disseminated cancer cell dormancy: An awakening field. Nat. Rev. Cancer 2014, 14, 611–622. [Google Scholar] [CrossRef] [PubMed]
- Luo, M.; Brooks, M.; Wicha, M.S. Epithelial-mesenchymal plasticity of breast cancer stem cells: Implications for metastasis and therapeutic resistance. Curr. Pharm. Des. 2015, 21, 1301–1310. [Google Scholar] [CrossRef] [PubMed] [Green Version]
- Martinez-Outschoorn, U.E.; Peiris-Pages, M.; Pestell, R.G.; Sotgia, F.; Lisanti, M.P. Cancer metabolism: A therapeutic perspective. Nat. Rev. Clin. Oncol. 2017, 14, 11–31. [Google Scholar] [CrossRef]
- Sancho, P.; Barneda, D.; Heeschen, C. Hallmarks of cancer stem cell metabolism. Br. J. Cancer 2016, 114, 1305–1312. [Google Scholar] [CrossRef] [Green Version]
- Vander Heiden, M.G.; Cantley, L.C.; Thompson, C.B. Understanding the Warburg effect: The metabolic requirements of cell proliferation. Science 2009, 324, 1029–1033. [Google Scholar] [CrossRef] [Green Version]
- Muz, B.; de la Puente, P.; Azab, F.; Azab, A.K. The role of hypoxia in cancer progression, angiogenesis, metastasis, and resistance to therapy. Hypoxia (Auckl.) 2015, 3, 83–92. [Google Scholar] [CrossRef] [Green Version]
- Janiszewska, M.; Suva, M.L.; Riggi, N.; Houtkooper, R.H.; Auwerx, J.; Clement-Schatlo, V.; Radovanovic, I.; Rheinbay, E.; Provero, P.; Stamenkovic, I. Imp2 controls oxidative phosphorylation and is crucial for preserving glioblastoma cancer stem cells. Genes Dev. 2012, 26, 1926–1944. [Google Scholar] [CrossRef] [Green Version]
- Sancho, P.; Burgos-Ramos, E.; Tavera, A.; Bou Kheir, T.; Jagust, P.; Schoenhals, M.; Barneda, D.; Sellers, K.; Campos-Olivas, R.; Grana, O.; et al. MYC/PGC-1alpha Balance Determines the Metabolic Phenotype and Plasticity of Pancreatic Cancer Stem Cells. Cell Metab. 2015, 22, 590–605. [Google Scholar] [CrossRef] [Green Version]
- Cantor, J.R.; Sabatini, D.M. Cancer cell metabolism: One hallmark, many faces. Cancer Discov. 2012, 2, 881–898. [Google Scholar] [CrossRef] [Green Version]
- Peixoto, J.; Lima, J. Metabolic traits of cancer stem cells. Dis. Model. Mech. 2018, 11. [Google Scholar] [CrossRef] [PubMed] [Green Version]
- Han, C.Y.; Patten, D.A.; Richardson, R.B.; Harper, M.E.; Tsang, B.K. Tumor metabolism regulating chemosensitivity in ovarian cancer. Genes Cancer 2018, 9, 155–175. [Google Scholar] [PubMed] [Green Version]
- Al-Hajj, M.; Wicha, M.S.; Benito-Hernandez, A.; Morrison, S.J.; Clarke, M.F. Prospective identification of tumorigenic breast cancer cells. Proc. Natl. Acad. Sci. USA 2003, 100, 3983–3988. [Google Scholar] [CrossRef] [PubMed] [Green Version]
- Mani, S.A.; Guo, W.; Liao, M.J.; Eaton, E.N.; Ayyanan, A.; Zhou, A.Y.; Brooks, M.; Reinhard, F.; Zhang, C.C.; Shipitsin, M.; et al. The epithelial-mesenchymal transition generates cells with properties of stem cells. Cell 2008, 133, 704–715. [Google Scholar] [CrossRef] [Green Version]
- Mak, A.B.; Schnegg, C.; Lai, C.Y.; Ghosh, S.; Yang, M.H.; Moffat, J.; Hsu, M.Y. CD133-targeted niche-dependent therapy in cancer: A multipronged approach. Am. J. Pathol. 2014, 184, 1256–1262. [Google Scholar] [CrossRef] [PubMed] [Green Version]
- Florek, M.; Haase, M.; Marzesco, A.M.; Freund, D.; Ehninger, G.; Huttner, W.B.; Corbeil, D. Prominin-1/CD133, a neural and hematopoietic stem cell marker, is expressed in adult human differentiated cells and certain types of kidney cancer. Cell Tissue Res. 2005, 319, 15–26. [Google Scholar] [CrossRef] [PubMed]
- Hadjimichael, C.; Chanoumidou, K.; Papadopoulou, N.; Arampatzi, P.; Papamatheakis, J.; Kretsovali, A. Common stemness regulators of embryonic and cancer stem cells. World J. Stem Cells 2015, 7, 1150–1184. [Google Scholar]
- Tomita, H.; Tanaka, K.; Tanaka, T.; Hara, A. Aldehyde dehydrogenase 1A1 in stem cells and cancer. Oncotarget 2016, 7, 11018–11032. [Google Scholar] [CrossRef] [Green Version]
- Bapat, S.A.; Mali, A.M.; Koppikar, C.B.; Kurrey, N.K. Stem and progenitor-like cells contribute to the aggressive behavior of human epithelial ovarian cancer. Cancer Res. 2005, 65, 3025–3029. [Google Scholar] [CrossRef] [Green Version]
- Ahmed, N.; Stenvers, K.L. Getting to know ovarian cancer ascites: Opportunities for targeted therapy-based translational research. Front Oncol. 2013, 3, 256. [Google Scholar] [CrossRef] [PubMed] [Green Version]
- Ahmed, N.; Abubaker, K.; Findlay, J.K. Ovarian cancer stem cells: Molecular concepts and relevance as therapeutic targets. Mol. Aspects Med. 2014, 39, 110–125. [Google Scholar] [CrossRef] [PubMed]
- Alvero, A.B.; Fu, H.H.; Holmberg, J.; Visintin, I.; Mor, L.; Marquina, C.C.; Oidtman, J.; Silasi, D.A.; Mor, G. Stem-like ovarian cancer cells can serve as tumor vascular progenitors. Stem Cells 2009, 27, 2405–2413. [Google Scholar] [CrossRef] [PubMed] [Green Version]
- Elzarkaa, A.A.; Sabaa, B.E.; Abdelkhalik, D.; Mansour, H.; Melis, M.; Shaalan, W.; Farouk, M.; Malik, E.; Soliman, A.A. Clinical relevance of CD44 surface expression in advanced stage serous epithelial ovarian cancer: A prospective study. J. Cancer Res. Clin. Oncol. 2016, 142, 949–958. [Google Scholar] [CrossRef] [PubMed]
- Bonneau, C.; Rouzier, R.; Geyl, C.; Cortez, A.; Castela, M.; Lis, R.; Darai, E.; Touboul, C. Predictive markers of chemoresistance in advanced stages epithelial ovarian carcinoma. Gynecol. Oncol. 2015, 136, 112–120. [Google Scholar] [CrossRef]
- Bourguignon, L.Y.; Peyrollier, K.; Xia, W.; Gilad, E. Hyaluronan-CD44 interaction activates stem cell marker Nanog, Stat-3-mediated MDR1 gene expression, and ankyrin-regulated multidrug efflux in breast and ovarian tumor cells. J. Biol. Chem. 2008, 283, 17635–17651. [Google Scholar] [CrossRef] [Green Version]
- Klemba, A.; Purzycka-Olewiecka, J.K.; Wcislo, G.; Czarnecka, A.M.; Lewicki, S.; Lesyng, B.; Szczylik, C.; Kieda, C. Surface markers of cancer stem-like cells of ovarian cancer and their clinical relevance. Contemp. Oncol. (Pozn) 2018, 22, 48–55. [Google Scholar] [CrossRef]
- Abelson, S.; Shamai, Y.; Berger, L.; Skorecki, K.; Tzukerman, M. Niche-dependent gene expression profile of intratumoral heterogeneous ovarian cancer stem cell populations. PLoS ONE 2013, 8, e83651. [Google Scholar] [CrossRef] [Green Version]
- Dong, Z.; Yang, L.; Lai, D. KLF5 strengthens drug resistance of ovarian cancer stem-like cells by regulating survivin expression. Cell Prolif. 2013, 46, 425–435. [Google Scholar] [CrossRef]
- Zhang, S.; Cui, B.; Lai, H.; Liu, G.; Ghia, E.M.; Widhopf, G.F.; Zhang, Z.; Wu, C.C.; Chen, L.; Wu, R.; et al. Ovarian cancer stem cells express ROR1, which can be targeted for anti-cancer-stem-cell therapy. Proc. Natl. Acad. Sci. USA 2014, 111, 17266–17271. [Google Scholar] [CrossRef] [Green Version]
- Wang, Z.C.; Birkbak, N.J.; Culhane, A.C.; Drapkin, R.; Fatima, A.; Tian, R.; Schwede, M.; Alsop, K.; Daniels, K.E.; Piao, H.; et al. Profiles of genomic instability in high-grade serous ovarian cancer predict treatment outcome. Clin. Cancer Res. 2012, 18, 5806–5815. [Google Scholar] [CrossRef] [PubMed] [Green Version]
- Ishiguro, T.; Sato, A.; Ohata, H.; Ikarashi, Y.; Takahashi, R.U.; Ochiya, T.; Yoshida, M.; Tsuda, H.; Onda, T.; Kato, T.; et al. Establishment and Characterization of an In Vitro Model of Ovarian Cancer Stem-like Cells with an Enhanced Proliferative Capacity. Cancer Res. 2016, 76, 150–160. [Google Scholar] [CrossRef] [PubMed] [Green Version]
- Tang, Z.; Li, C.; Kang, B.; Gao, G.; Li, C.; Zhang, Z. GEPIA: A web server for cancer and normal gene expression profiling and interactive analyses. Nucleic. Acids Res. 2017, 45, W98–W102. [Google Scholar] [CrossRef] [PubMed] [Green Version]
- Yamada, Y.; Itano, N.; Narimatsu, H.; Kudo, T.; Hirohashi, S.; Ochiai, A.; Tohnai, I.; Ueda, M.; Kimata, K. CD44 variant exon 6 expressions in colon cancer assessed by quantitative analysis using real time reverse transcriptase-polymerase chain reaction. Oncol. Rep. 2003, 10, 1919–1924. [Google Scholar] [CrossRef] [PubMed]
- Afify, A.M.; Craig, S.; Paulino, A.F.; Stern, R. Expression of hyaluronic acid and its receptors, CD44s and CD44v6, in normal, hyperplastic, and neoplastic endometrium. Ann. Diagn. Pathol. 2005, 9, 312–318. [Google Scholar] [CrossRef] [PubMed]
- Sosulski, A.; Horn, H.; Zhang, L.; Coletti, C.; Vathipadiekal, V.; Castro, C.M.; Birrer, M.J.; Nagano, O.; Saya, H.; Lage, K.; et al. CD44 Splice Variant v8-10 as a Marker of Serous Ovarian Cancer Prognosis. PLoS ONE 2016, 11, e0156595. [Google Scholar] [CrossRef]
- Tjhay, F.; Motohara, T.; Tayama, S.; Narantuya, D.; Fujimoto, K.; Guo, J.; Sakaguchi, I.; Honda, R.; Tashiro, H.; Katabuchi, H. CD44 variant 6 is correlated with peritoneal dissemination and poor prognosis in patients with advanced epithelial ovarian cancer. Cancer Sci. 2015, 106, 1421–1428. [Google Scholar] [CrossRef] [Green Version]
- Tamada, M.; Nagano, O.; Tateyama, S.; Ohmura, M.; Yae, T.; Ishimoto, T.; Sugihara, E.; Onishi, N.; Yamamoto, T.; Yanagawa, H.; et al. Modulation of Glucose Metabolism by CD44 Contributes to Antioxidant Status and Drug Resistance in Cancer Cells. Cancer Res. 2012, 72, 1438–1448. [Google Scholar] [CrossRef] [Green Version]
- Palorini, R.; Votta, G.; Balestrieri, C.; Monestiroli, A.; Olivieri, S.; Vento, R.; Chiaradonna, F. Energy metabolism characterization of a novel cancer stem cell-like line 3AB-OS. J. Cell Biochem. 2014, 115, 368–379. [Google Scholar] [CrossRef]
- Schieber, M.S.; Chandel, N.S. ROS links glucose metabolism to breast cancer stem cell and EMT phenotype. Cancer Cell 2013, 23, 265–267. [Google Scholar] [CrossRef] [Green Version]
- Penkert, J.; Ripperger, T.; Schieck, M.; Schlegelberger, B.; Steinemann, D.; Illig, T. On metabolic reprogramming and tumor biology: A comprehensive survey of metabolism in breast cancer. Oncotarget 2016, 7, 67626–67649. [Google Scholar] [CrossRef] [PubMed] [Green Version]
- Al Tameemi, W.; Dale, T.P.; Al-Jumaily, R.M.K.; Forsyth, N.R. Hypoxia-Modified Cancer Cell Metabolism. Front Cell Dev. Biol. 2019, 7, 4. [Google Scholar] [CrossRef] [PubMed] [Green Version]
- Liang, D.; Ma, Y.; Liu, J.; Trope, C.G.; Holm, R.; Nesland, J.M.; Suo, Z. The hypoxic microenvironment upgrades stem-like properties of ovarian cancer cells. BMC Cancer 2012, 12, 201. [Google Scholar] [CrossRef] [PubMed] [Green Version]
- Katt, M.E.; Placone, A.L.; Wong, A.D.; Xu, Z.S.; Searson, P.C. In Vitro Tumor Models: Advantages, Disadvantages, Variables, and Selecting the Right Platform. Front Bioeng. Biotechnol. 2016, 4, 12. [Google Scholar] [CrossRef] [PubMed]
- Chae, Y.C.; Kim, J.H. Cancer stem cell metabolism: Target for cancer therapy. BMB Rep. 2018, 51, 319–326. [Google Scholar] [CrossRef] [PubMed] [Green Version]
- Pietrocola, F.; Galluzzi, L.; Bravo-San Pedro, J.M.; Madeo, F.; Kroemer, G. Acetyl coenzyme A: A central metabolite and second messenger. Cell Metab. 2015, 21, 805–821. [Google Scholar] [CrossRef] [Green Version]
- Green, D.R.; Galluzzi, L.; Kroemer, G. Cell biology. Metabolic control of cell death. Science 2014, 345, 1250256. [Google Scholar] [CrossRef] [Green Version]
- Marino, G.; Pietrocola, F.; Eisenberg, T.; Kong, Y.; Malik, S.A.; Andryushkova, A.; Schroeder, S.; Pendl, T.; Harger, A.; Niso-Santano, M.; et al. Regulation of autophagy by cytosolic acetyl-coenzyme A. Mol. Cell 2014, 53, 710–725. [Google Scholar] [CrossRef] [Green Version]
- Liao, J.; Qian, F.; Tchabo, N.; Mhawech-Fauceglia, P.; Beck, A.; Qian, Z.; Wang, X.; Huss, W.J.; Lele, S.B.; Morrison, C.D.; et al. Ovarian cancer spheroid cells with stem cell-like properties contribute to tumor generation, metastasis and chemotherapy resistance through hypoxia-resistant metabolism. PLoS ONE 2014, 9, e84941. [Google Scholar] [CrossRef] [Green Version]
- Bonuccelli, G.; De Francesco, E.M.; de Boer, R.; Tanowitz, H.B.; Lisanti, M.P. NADH autofluorescence, a new metabolic biomarker for cancer stem cells: Identification of Vitamin C and CAPE as natural products targeting “stemness”. Oncotarget 2017, 8, 20667–20678. [Google Scholar] [CrossRef] [Green Version]
- Liu, P.P.; Liao, J.; Tang, Z.J.; Wu, W.J.; Yang, J.; Zeng, Z.L.; Hu, Y.; Wang, P.; Ju, H.Q.; Xu, R.H.; et al. Metabolic regulation of cancer cell side population by glucose through activation of the Akt pathway. Cell Death Differ. 2014, 21, 124–135. [Google Scholar] [CrossRef] [Green Version]
- Ryan, D.G.; Murphy, M.P.; Frezza, C.; Prag, H.A.; Chouchani, E.T.; O’Neill, L.A.; Mills, E.L. Coupling Krebs cycle metabolites to signalling in immunity and cancer. Nat. Metab. 2019, 1, 16–33. [Google Scholar] [CrossRef] [PubMed]
- Pasto, A.; Bellio, C.; Pilotto, G.; Ciminale, V.; Silic-Benussi, M.; Guzzo, G.; Rasola, A.; Frasson, C.; Nardo, G.; Zulato, E.; et al. Cancer stem cells from epithelial ovarian cancer patients privilege oxidative phosphorylation, and resist glucose deprivation. Oncotarget 2014, 5, 4305–4319. [Google Scholar] [CrossRef] [PubMed] [Green Version]
- Dar, S.; Chhina, J.; Mert, I.; Chitale, D.; Buekers, T.; Kaur, H.; Giri, S.; Munkarah, A.; Rattan, R. Bioenergetic Adaptations in Chemoresistant Ovarian Cancer Cells. Sci. Rep. 2017, 7, 8760. [Google Scholar] [CrossRef]
- Sato, M.; Kawana, K.; Adachi, K.; Fujimoto, A.; Yoshida, M.; Nakamura, H.; Nishida, H.; Inoue, T.; Taguchi, A.; Takahashi, J.; et al. Spheroid cancer stem cells display reprogrammed metabolism and obtain energy by actively running the tricarboxylic acid (TCA) cycle. Oncotarget 2016, 7, 33297–33305. [Google Scholar] [CrossRef] [PubMed] [Green Version]
- Kim, W.Y. Therapeutic targeting of lipid synthesis metabolism for selective elimination of cancer stem cells. Arch. Pharm. Res. 2019, 42, 25–39. [Google Scholar] [CrossRef] [PubMed]
- Chen, J.; Wang, J.; Chen, D.; Yang, J.; Yang, C.; Zhang, Y.; Zhang, H.; Dou, J. Evaluation of characteristics of CD44+CD117+ ovarian cancer stem cells in three dimensional basement membrane extract scaffold versus two dimensional monocultures. BMC Cell Biol. 2013, 14, 7. [Google Scholar] [CrossRef] [PubMed] [Green Version]
- Li, J.; Condello, S.; Thomes-Pepin, J.; Ma, X.; Xia, Y.; Hurley, T.D.; Matei, D.; Cheng, J.X. Lipid Desaturation Is a Metabolic Marker and Therapeutic Target of Ovarian Cancer Stem Cells. Cell Stem Cell 2017, 20, 303–314.e5. [Google Scholar] [CrossRef] [Green Version]
- Cai, Y.; Wang, J.; Zhang, L.; Wu, D.; Yu, D.; Tian, X.; Liu, J.; Jiang, X.; Shen, Y.; Zhang, L.; et al. Expressions of fatty acid synthase and HER2 are correlated with poor prognosis of ovarian cancer. Med. Oncol. 2015, 32, 391. [Google Scholar] [CrossRef] [Green Version]
- Bauerschlag, D.O.; Maass, N.; Leonhardt, P.; Verburg, F.A.; Pecks, U.; Zeppernick, F.; Morgenroth, A.; Mottaghy, F.M.; Tolba, R.; Meinhold-Heerlein, I.; et al. Fatty acid synthase overexpression: Target for therapy and reversal of chemoresistance in ovarian cancer. J. Transl. Med. 2015, 13, 146. [Google Scholar] [CrossRef] [Green Version]
- Colbert, C.L.; Kim, C.W.; Moon, Y.A.; Henry, L.; Palnitkar, M.; McKean, W.B.; Fitzgerald, K.; Deisenhofer, J.; Horton, J.D.; Kwon, H.J. Crystal structure of Spot 14, a modulator of fatty acid synthesis. Proc. Natl. Acad. Sci. USA 2010, 107, 18820–18825. [Google Scholar] [CrossRef] [PubMed] [Green Version]
- Goren, M.A.; Fox, B.G. Wheat germ cell-free translation, purification, and assembly of a functional human stearoyl-CoA desaturase complex. Protein Expr. Purif. 2008, 62, 171–178. [Google Scholar] [CrossRef] [PubMed] [Green Version]
- Qu, Q.; Zeng, F.; Liu, X.; Wang, Q.J.; Deng, F. Fatty acid oxidation and carnitine palmitoyltransferase I: Emerging therapeutic targets in cancer. Cell Death Dis. 2016, 7, e2226. [Google Scholar] [CrossRef] [PubMed]
- Cluntun, A.A.; Lukey, M.J.; Cerione, R.A.; Locasale, J.W. Glutamine Metabolism in Cancer: Understanding the Heterogeneity. Trends Cancer 2017, 3, 169–180. [Google Scholar] [CrossRef] [PubMed] [Green Version]
- Oburoglu, L.; Tardito, S.; Fritz, V.; de Barros, S.C.; Merida, P.; Craveiro, M.; Mamede, J.; Cretenet, G.; Mongellaz, C.; An, X.; et al. Glucose and glutamine metabolism regulate human hematopoietic stem cell lineage specification. Cell Stem Cell 2014, 15, 169–184. [Google Scholar] [CrossRef] [Green Version]
- Kim, J.H.; Lee, K.J.; Seo, Y.; Kwon, J.H.; Yoon, J.P.; Kang, J.Y.; Lee, H.J.; Park, S.J.; Hong, S.P.; Cheon, J.H.; et al. Effects of metformin on colorectal cancer stem cells depend on alterations in glutamine metabolism. Sci. Rep. 2018, 8, 409. [Google Scholar] [CrossRef] [Green Version]
- Zheng, J. Energy metabolism of cancer: Glycolysis versus oxidative phosphorylation (Review). Oncol. Lett. 2012, 4, 1151–1157. [Google Scholar] [CrossRef] [Green Version]
- Estrela, J.M.; Ortega, A.; Obrador, E. Glutathione in cancer biology and therapy. Crit. Rev. Clin. Lab. Sci. 2006, 43, 143–181. [Google Scholar] [CrossRef]
- DeBerardinis, R.J.; Cheng, T. Q’s next: The diverse functions of glutamine in metabolism, cell biology and cancer. Oncogene 2010, 29, 313–324. [Google Scholar] [CrossRef] [Green Version]
- Yang, L.; Moss, T.; Mangala, L.S.; Marini, J.; Zhao, H.; Wahlig, S.; Armaiz-Pena, G.; Jiang, D.; Achreja, A.; Win, J.; et al. Metabolic shifts toward glutamine regulate tumor growth, invasion and bioenergetics in ovarian cancer. Mol. Syst. Biol. 2014, 10, 728. [Google Scholar] [CrossRef]
- Wang, Y.; Liu, J.; Huang, B.O.; Xu, Y.M.; Li, J.; Huang, L.F.; Lin, J.; Zhang, J.; Min, Q.H.; Yang, W.M.; et al. Mechanism of alternative splicing and its regulation. Biomed. Rep. 2015, 3, 152–158. [Google Scholar] [CrossRef] [PubMed] [Green Version]
- Parte, S.C.; Batra, S.K.; Kakar, S.S. Characterization of stem cell and cancer stem cell populations in ovary and ovarian tumors. J. Ovarian Res. 2018, 11, 69. [Google Scholar] [CrossRef] [PubMed]
- Liu, H.G.; Chen, C.; Yang, H.; Pan, Y.F.; Zhang, X.H. Cancer stem cell subsets and their relationships. J. Transl. Med. 2011, 9, 50. [Google Scholar] [CrossRef] [PubMed] [Green Version]
Figure 1.
(A) Pearson’s correlation of CD44 with other ovarian cancer (OvCa) stem cell (OCSC) markers. (B) Predicted protein-protein interactions of OCSC markers using STRING web tool.
Figure 1.
(A) Pearson’s correlation of CD44 with other ovarian cancer (OvCa) stem cell (OCSC) markers. (B) Predicted protein-protein interactions of OCSC markers using STRING web tool.

Figure 2.
Expression of OCSC markers in OvCa stem cells and their parental cells. Bars represent mean ± SEM of the relative mRNA expression of the indicated OCSC markers in (A) OVCAR3 stem-cells vs. their parental cells (n = 3 each) in GSE28799, and (B) differentiated vs. undifferentiated OCSCs (n = 4 each) in GSE64999. Significance was determined using multiple t-test and Holm–Sidak method with each row analyzed individually with p < 0.05, without assuming a consistent SD.

Figure 3.
Expression of glycolysis markers in GSE28799 and GSE64999: (A,B) Bars represent mean ± SEM of the relative mRNA expression of the indicated glycolytic enzymes in OVCAR3 stem-cells vs. their parental cells in GSE28799, and undifferentiated vs. differentiated OCSCs in GSE64999, respectively. Significance was determined using multiple t-test and Holm–Sidak method with each row analyzed individually with p < 0.05, without assuming a consistent SD. (C–E) Bar graphs represent the prevalence of positive (red) and negative (blue) correlations of the indicated markers in OVCAR3-spheroids and the glycolytic enzymes in Supplement Tables S1–S2 and Table 1. * indicates the number of significant correlations either positive or negative.

Figure 4.
Expression of TCA markers in OCSC models. (A,B) Bars represent mean ± SEM of the relative mRNA expression of the indicated TCA enzymes in OVCAR3 stem-cells vs. their parental cells in GSE28799 and undifferentiated vs. differentiated OCSCs in GSE64999. Significance was determined using the multiple t-test and Holm–Sidak method with each row analyzed individually with p < 0.05, without assuming a consistent SD. (C–E) Bar graphs represent the prevalence of positive (red) and negative (blue) correlations of the indicated OCSC markers and TCA enzymes in Supplement Tables S3–S4 and Table 2. * indicate the number of significant correlations either positive or negative.

Figure 5.
Expression of electron transport chain (ETC) complexes in GSE28799 and GSE64999. Bars represent mean ± SEM of the relative mRNA expression of the indicated enzymes involved in complex I, (A–F); complex II, (B–G); complex III, (C–H); complex IV, (D–I), and complex V, (E–J) in OVCAR3 stem-cells vs. their parental cells in GSE28799 and differentiated vs. undifferentiated OCSCs in GSE64999. Significance was determined using the multiple t-test and Holm–Sidak method with each row analyzed individually with p < 0.05, without assuming a consistent SD. * indicate the number of significant correlations either positive or negative.

Figure 6.
Correlations of the transcripts of OCSC markers and ETC complexes. Pearson Correlation between the expression of OCSC transcripts and the transcripts of the key enzymes involved in ETC in OVCAR3-OCSCs curated from GSE28799 (A) and GSE64999 (B), as well as patients’ tumors from TCGA (C). Bar graphs represent the prevalence of positive (red) and negative (blue) correlations of the indicated OCSC markers and ETC enzymes. Significance was determined using the multiple t-test and Holm–Sidak method with each row analyzed individually with p < 0.05, without assuming a consistent SD. * indicate the number of significant correlations either positive or negative.

Figure 7.
Expression of transporters and enzymes of lipid metabolism in OCSC models. (A,B) Bars represent mean ± SEM of the relative mRNA expression of the indicated transporters and lipid metabolism enzymes in OVCAR3 stem-cells vs. their parental cells in GSE28799 and undifferentiated vs. differentiated OCSCs in GSE64999. Significance was determined using the multiple t-test and Holm–Sidak method with each row analyzed individually with p < 0.05, without assuming a consistent SD. (C–E) Bar graphs represent the prevalence of positive (red) and negative (blue) correlations of the indicated OCSC markers and lipid metabolism enzymes in Supplement Tables S7–S8 and Table 4. * indicate the number of significant correlations either positive or negative.

Figure 8.
Expression of transporters and enzymes of glutamine/glutamate metabolism in OCSC models. (A,B) Bars represent mean ± SEM of the relative mRNA expression of the indicated transporters and glutamine/glutamate metabolism enzymes in OVCAR3 stem-cells vs. their parental cells in GSE28799 and undifferentiated vs. differentiated OCSCs in GSE64999. Significance was determined using the multiple t-test and Holm–Sidak method with each row analyzed individually with p < 0.05, without assuming a consistent SD. (C–E) Bar graphs represent the prevalence of positive (red) and negative (blue) correlations of the indicated OCSC markers and glutamine/glutamate metabolism enzymes in Supplement Tables S9–S10 and Table 5. * indicate the number of significant correlations either positive or negative.


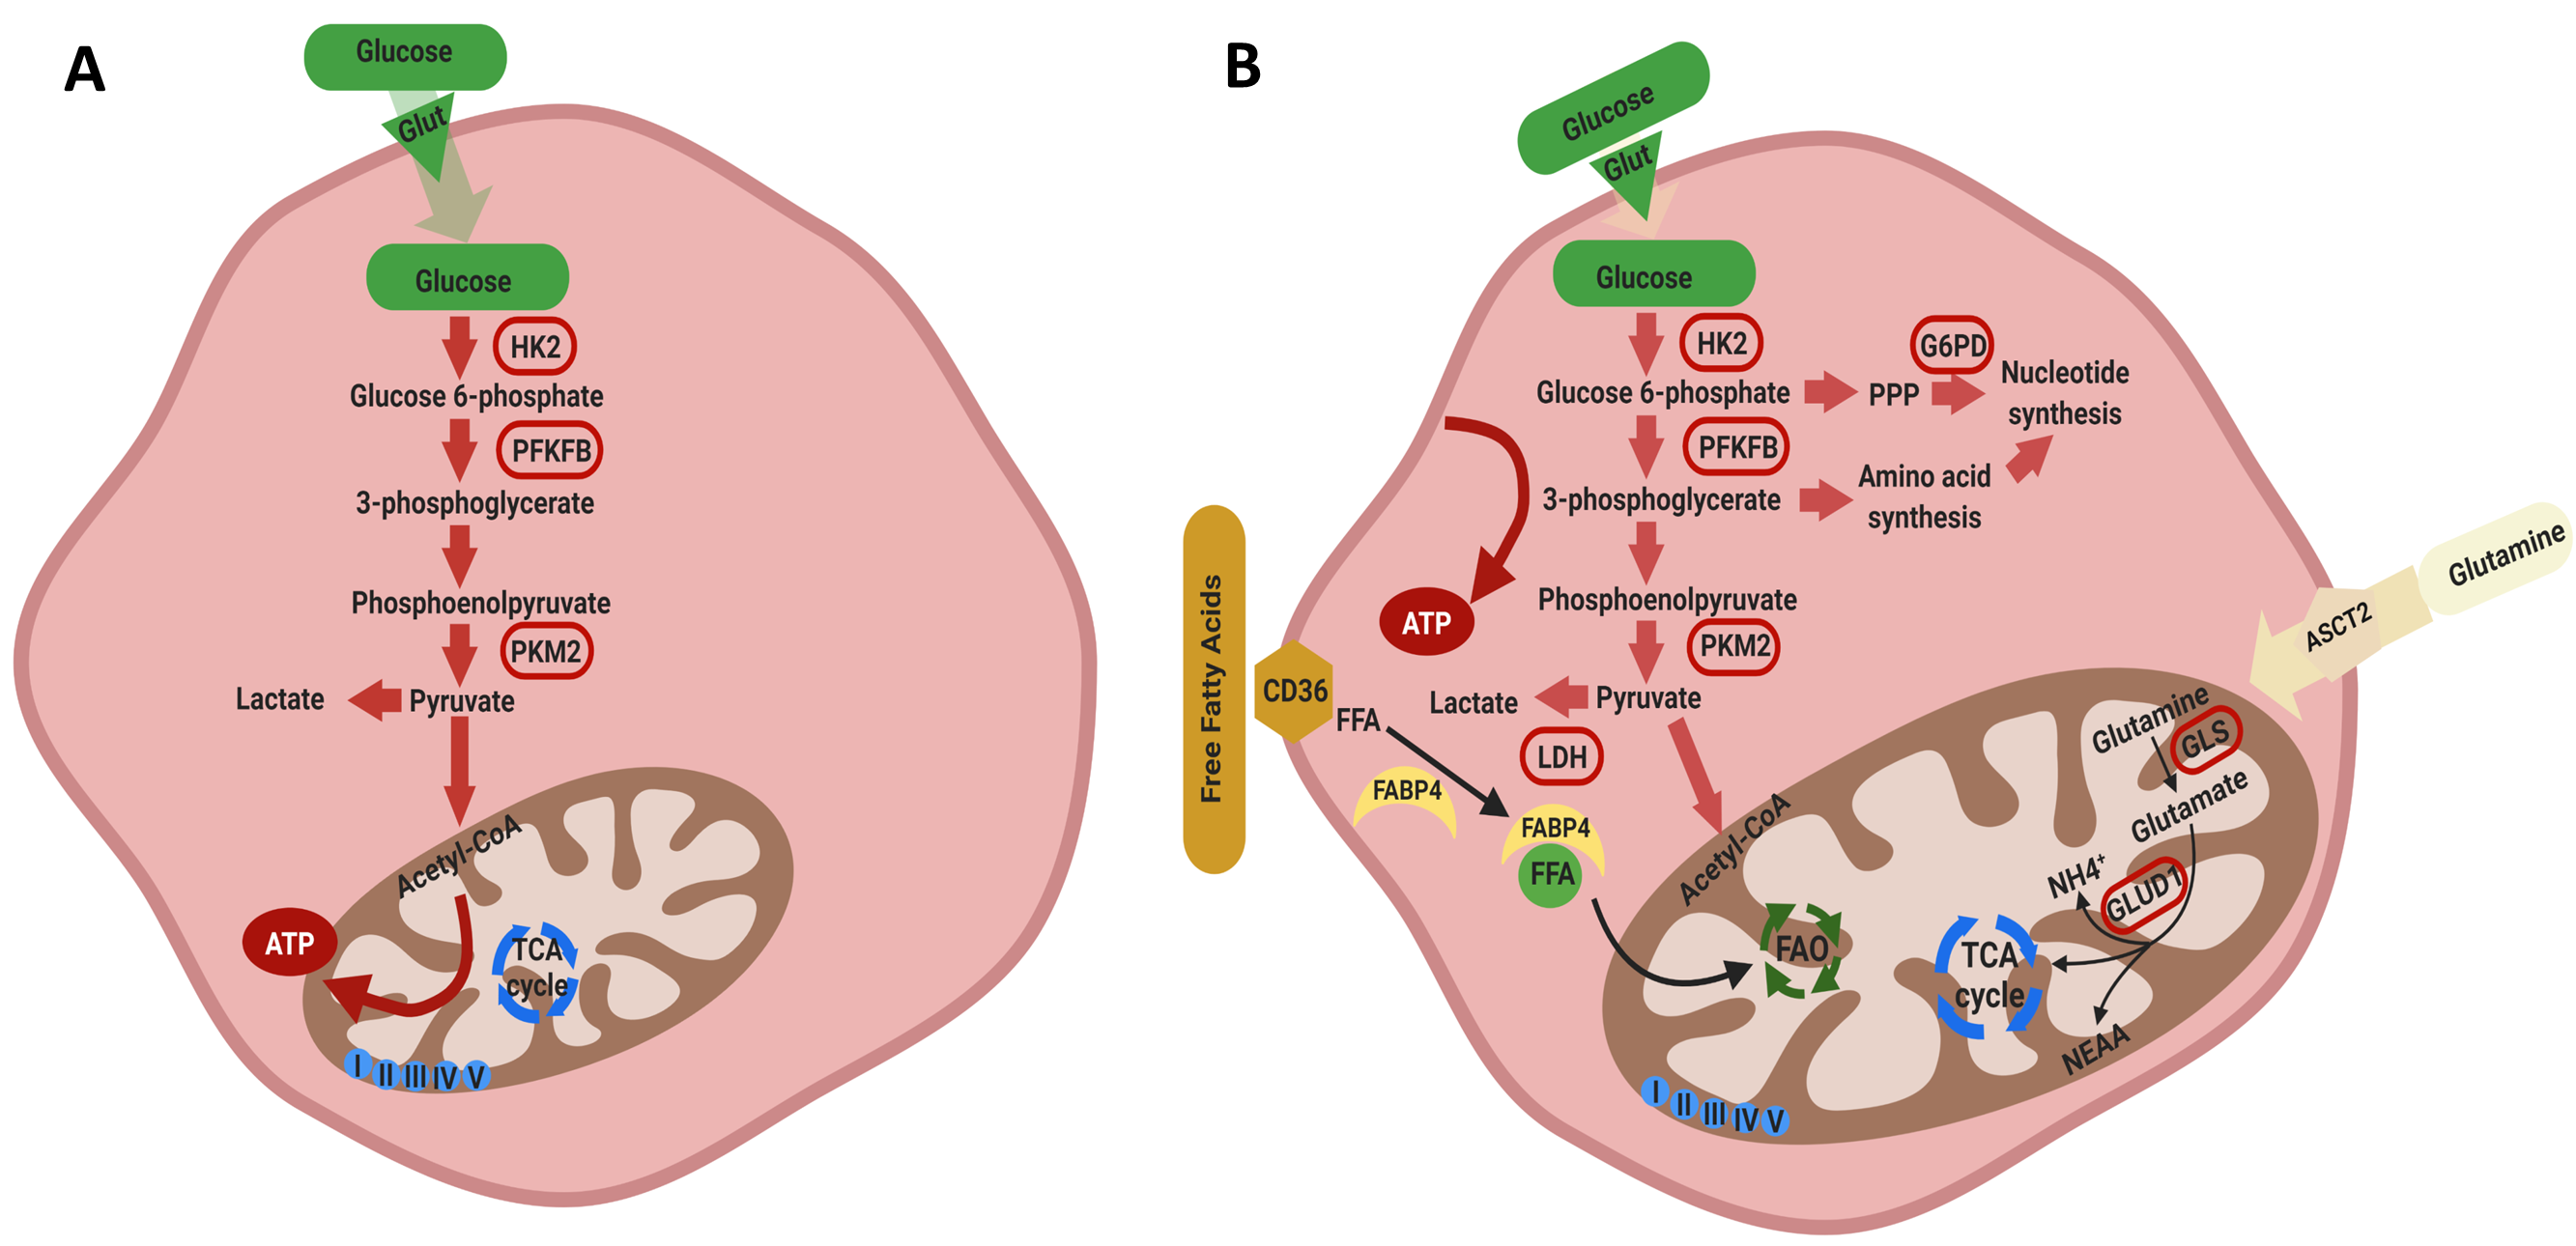
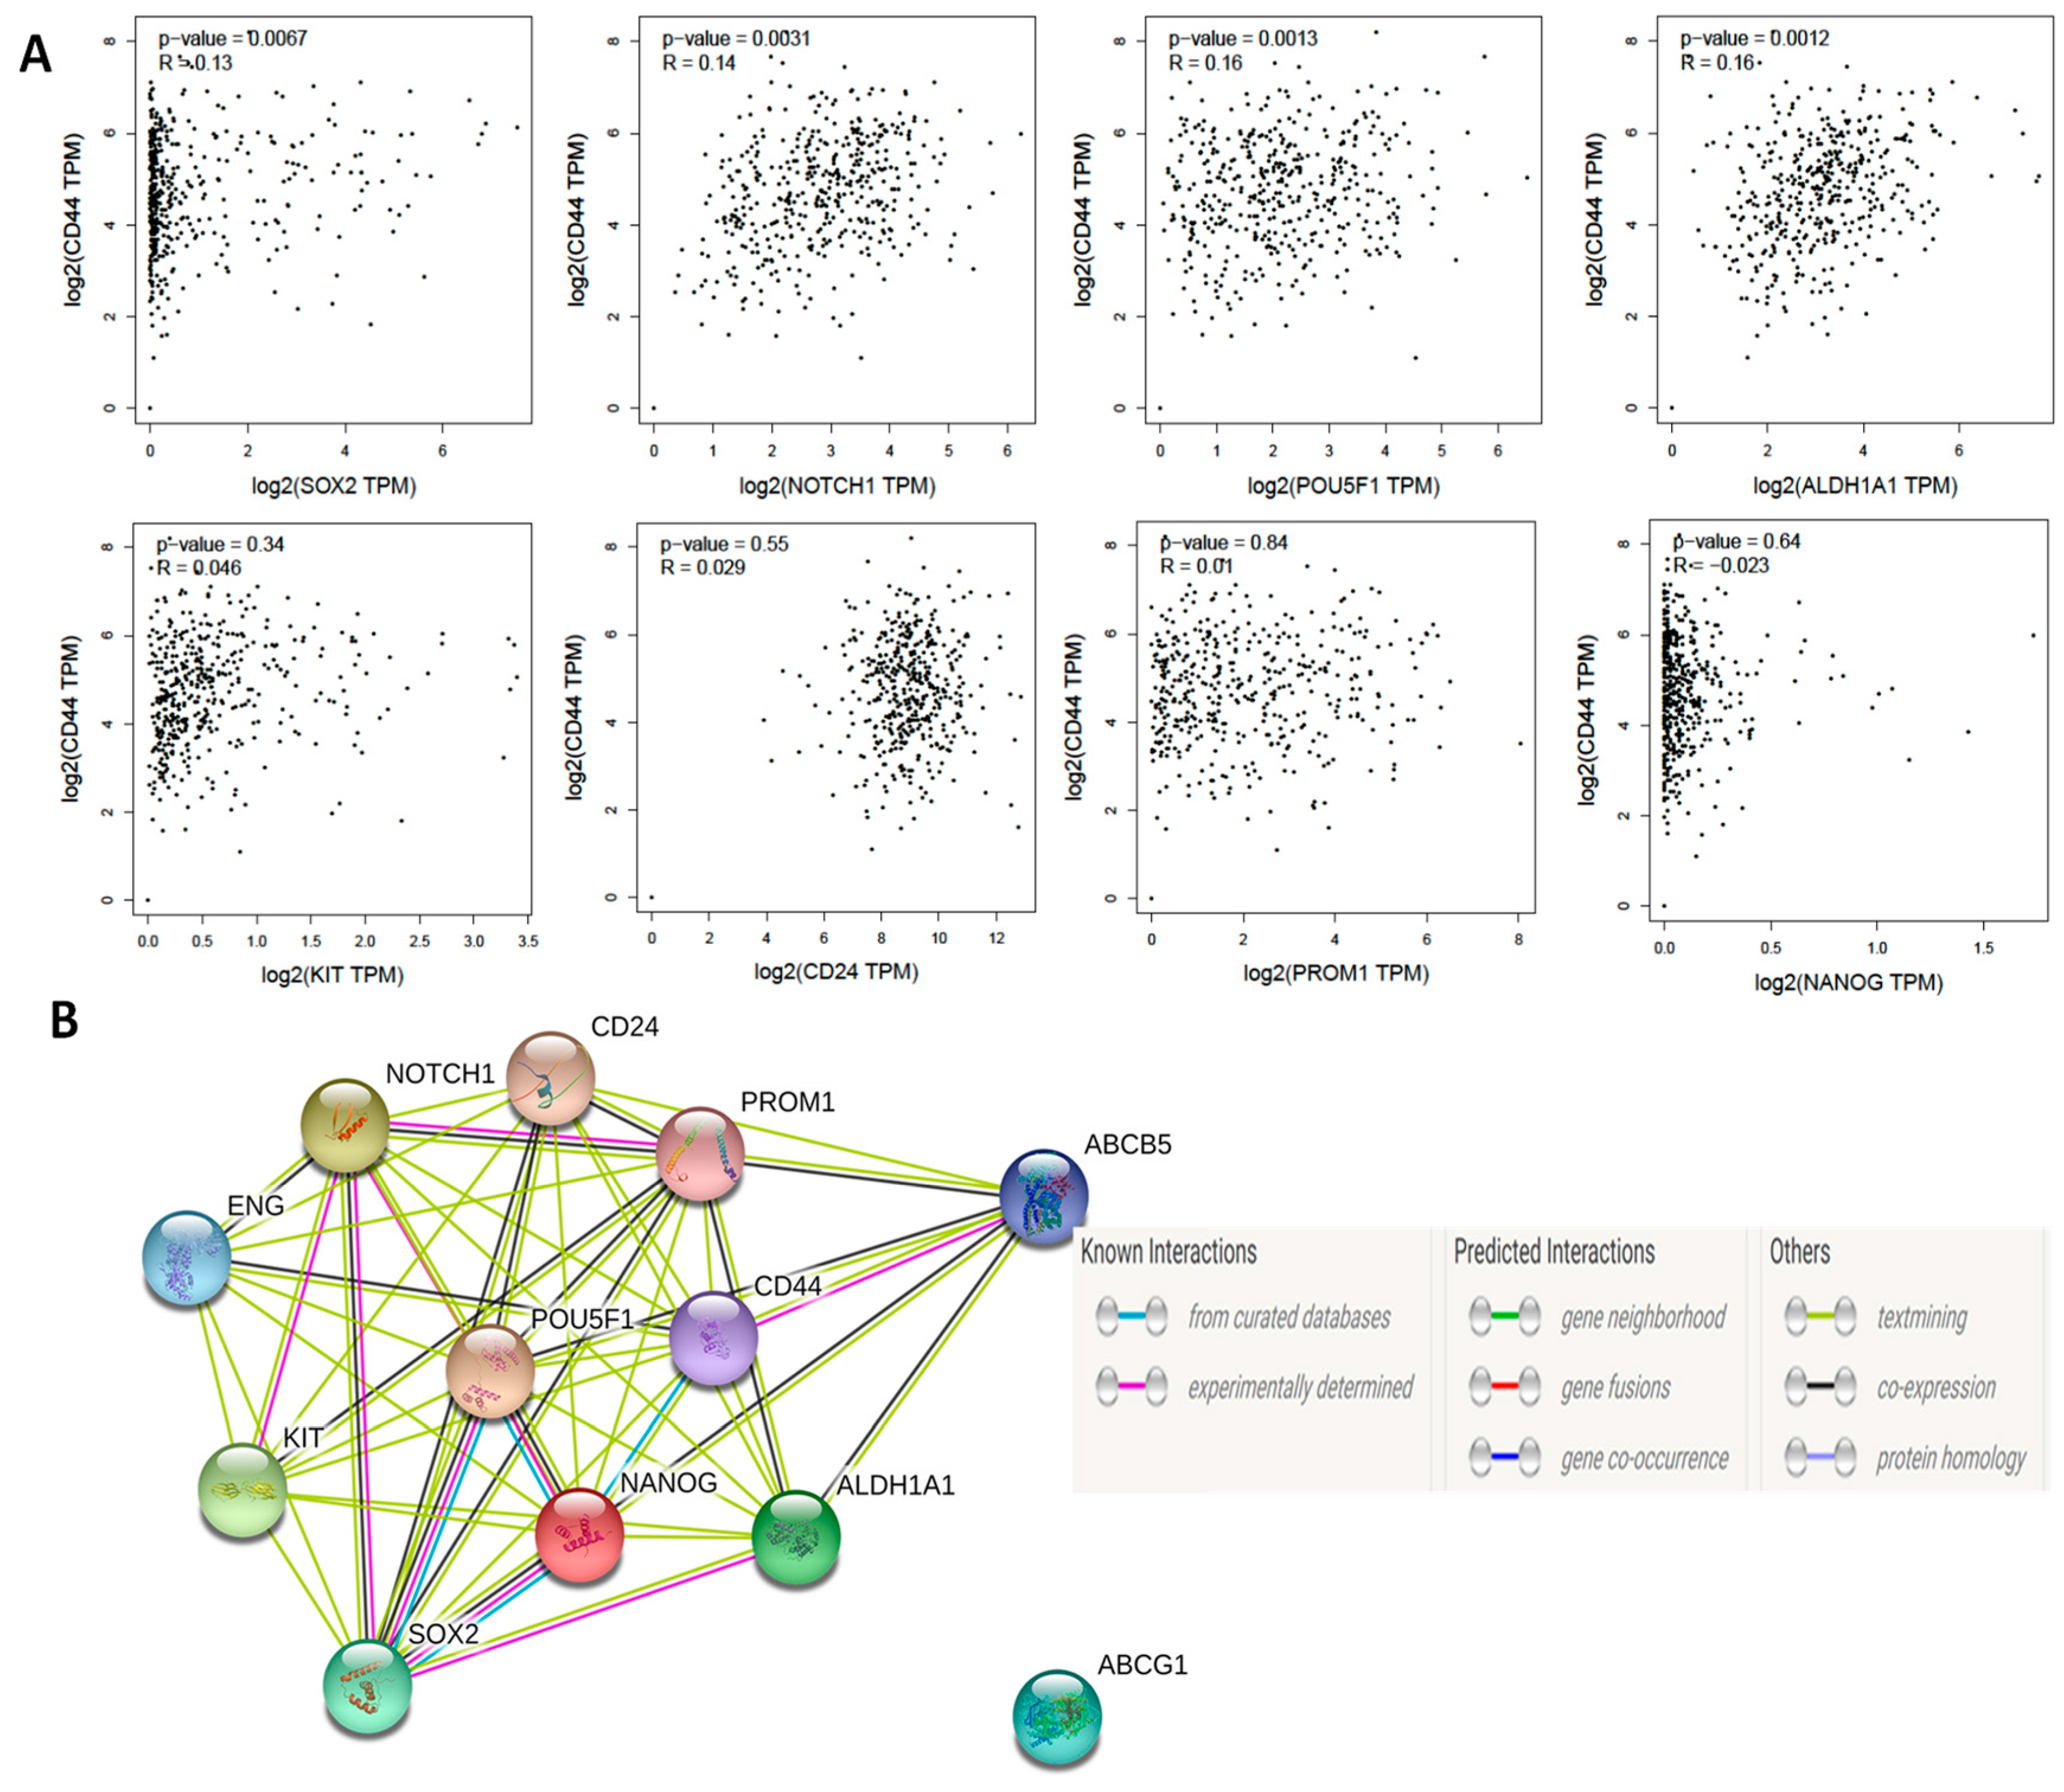
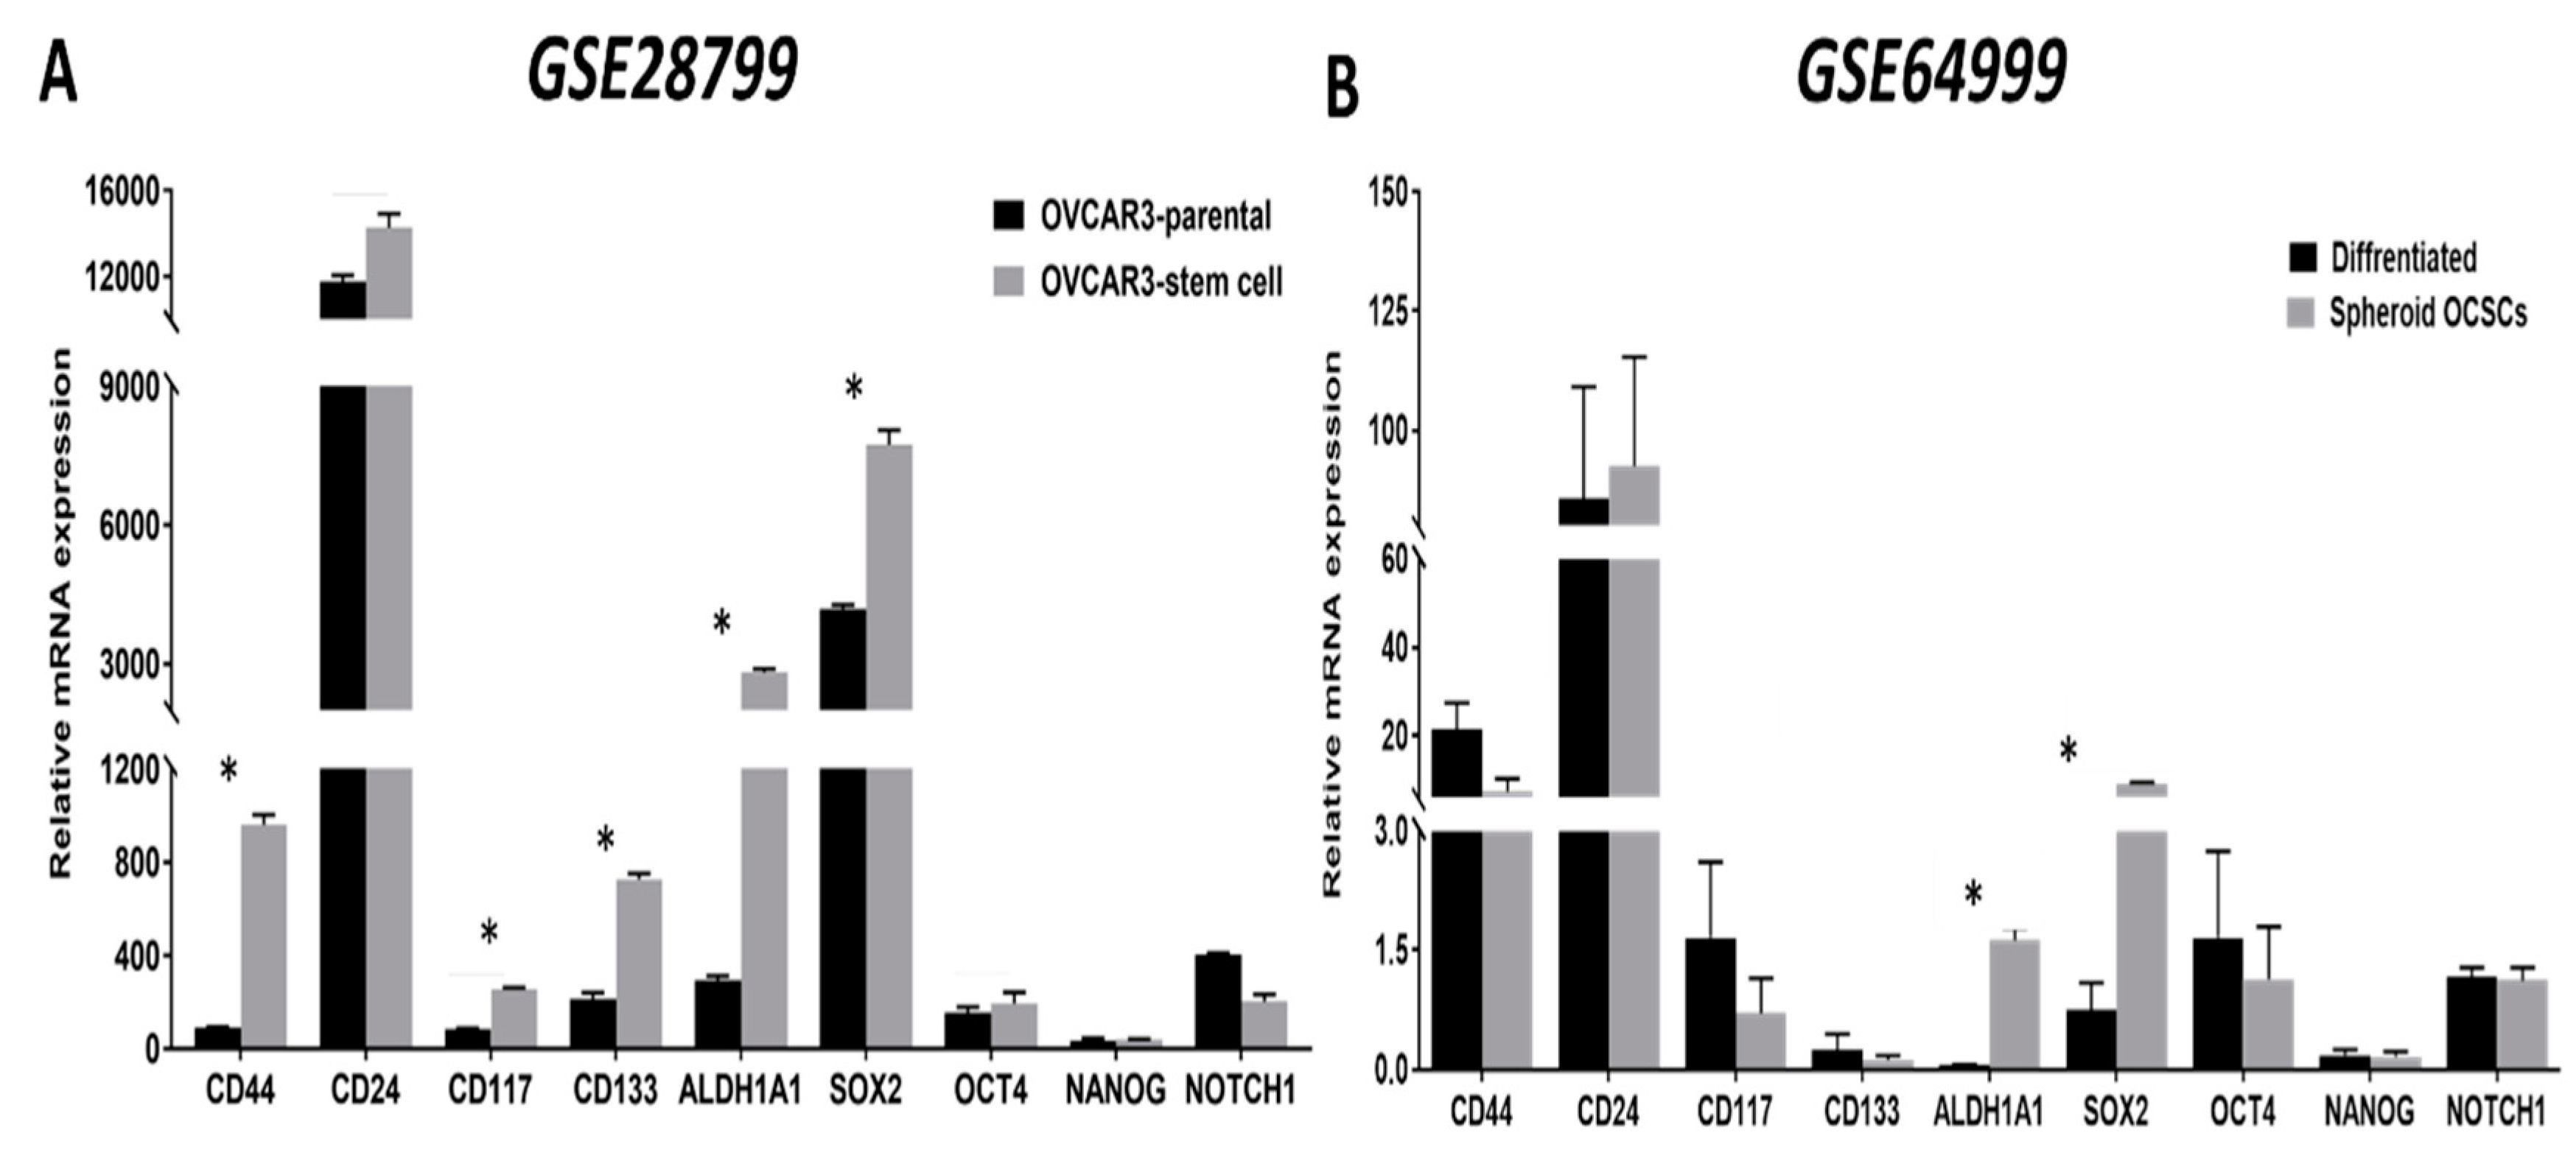
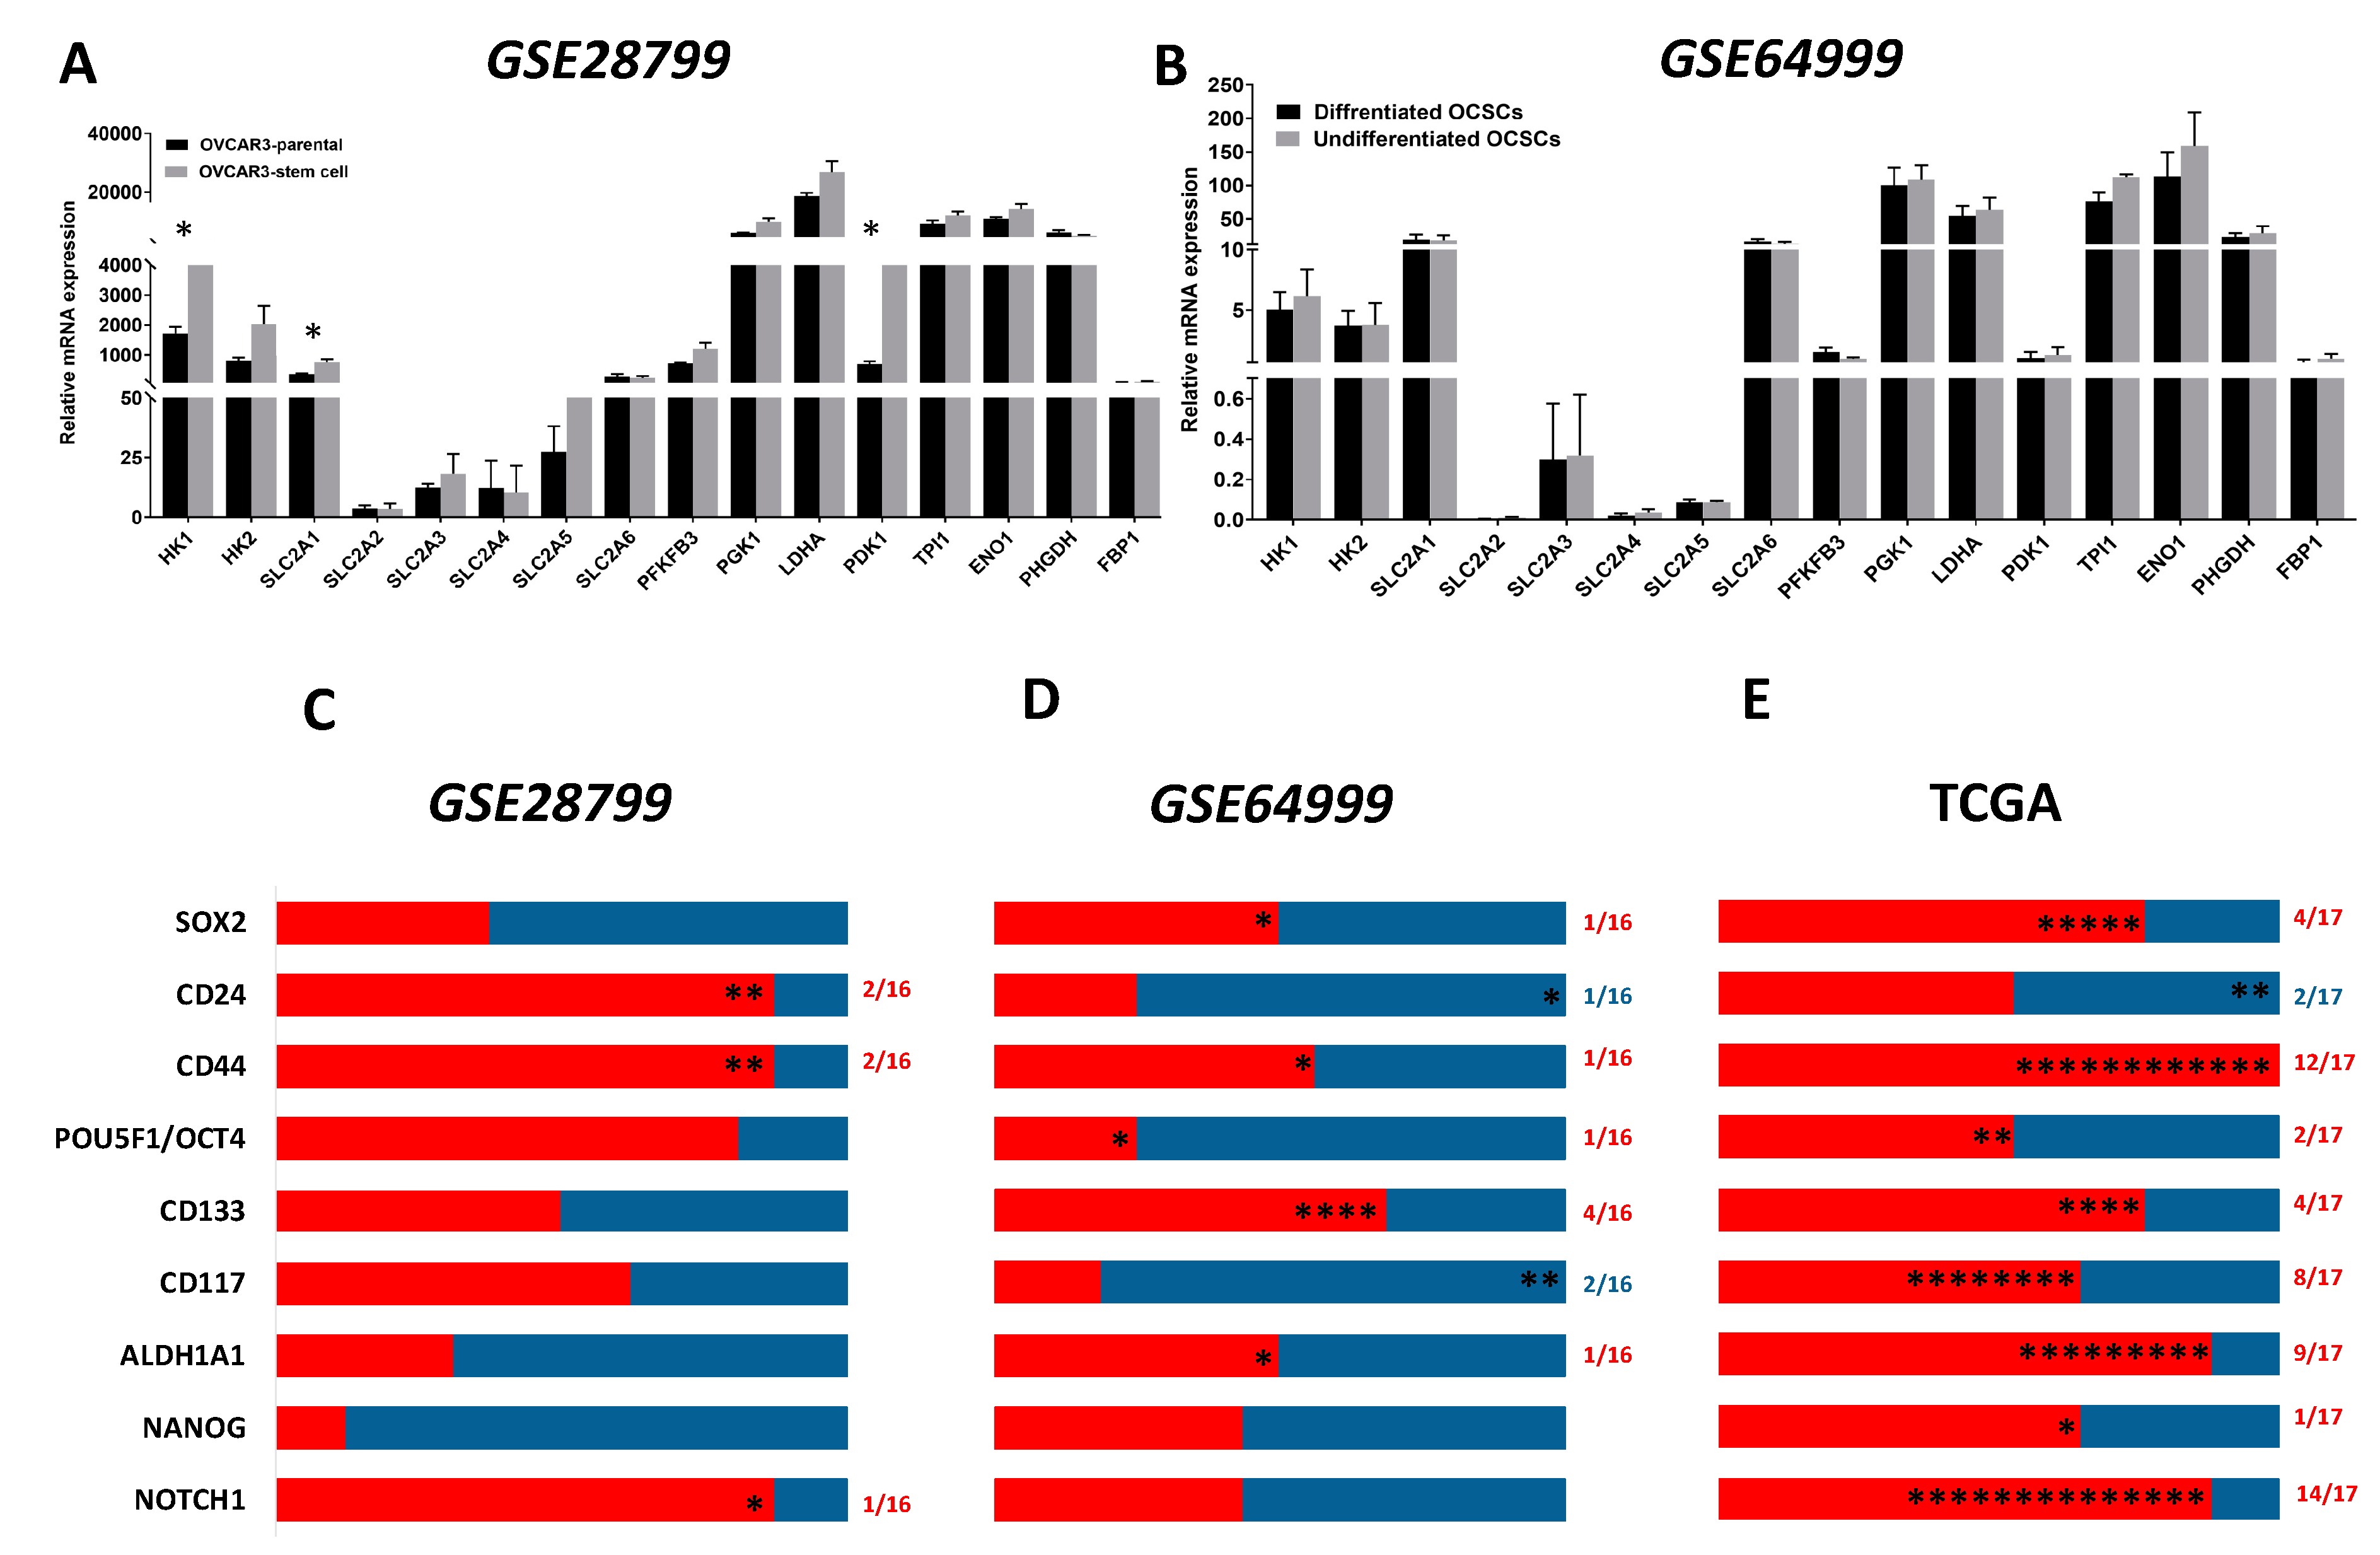
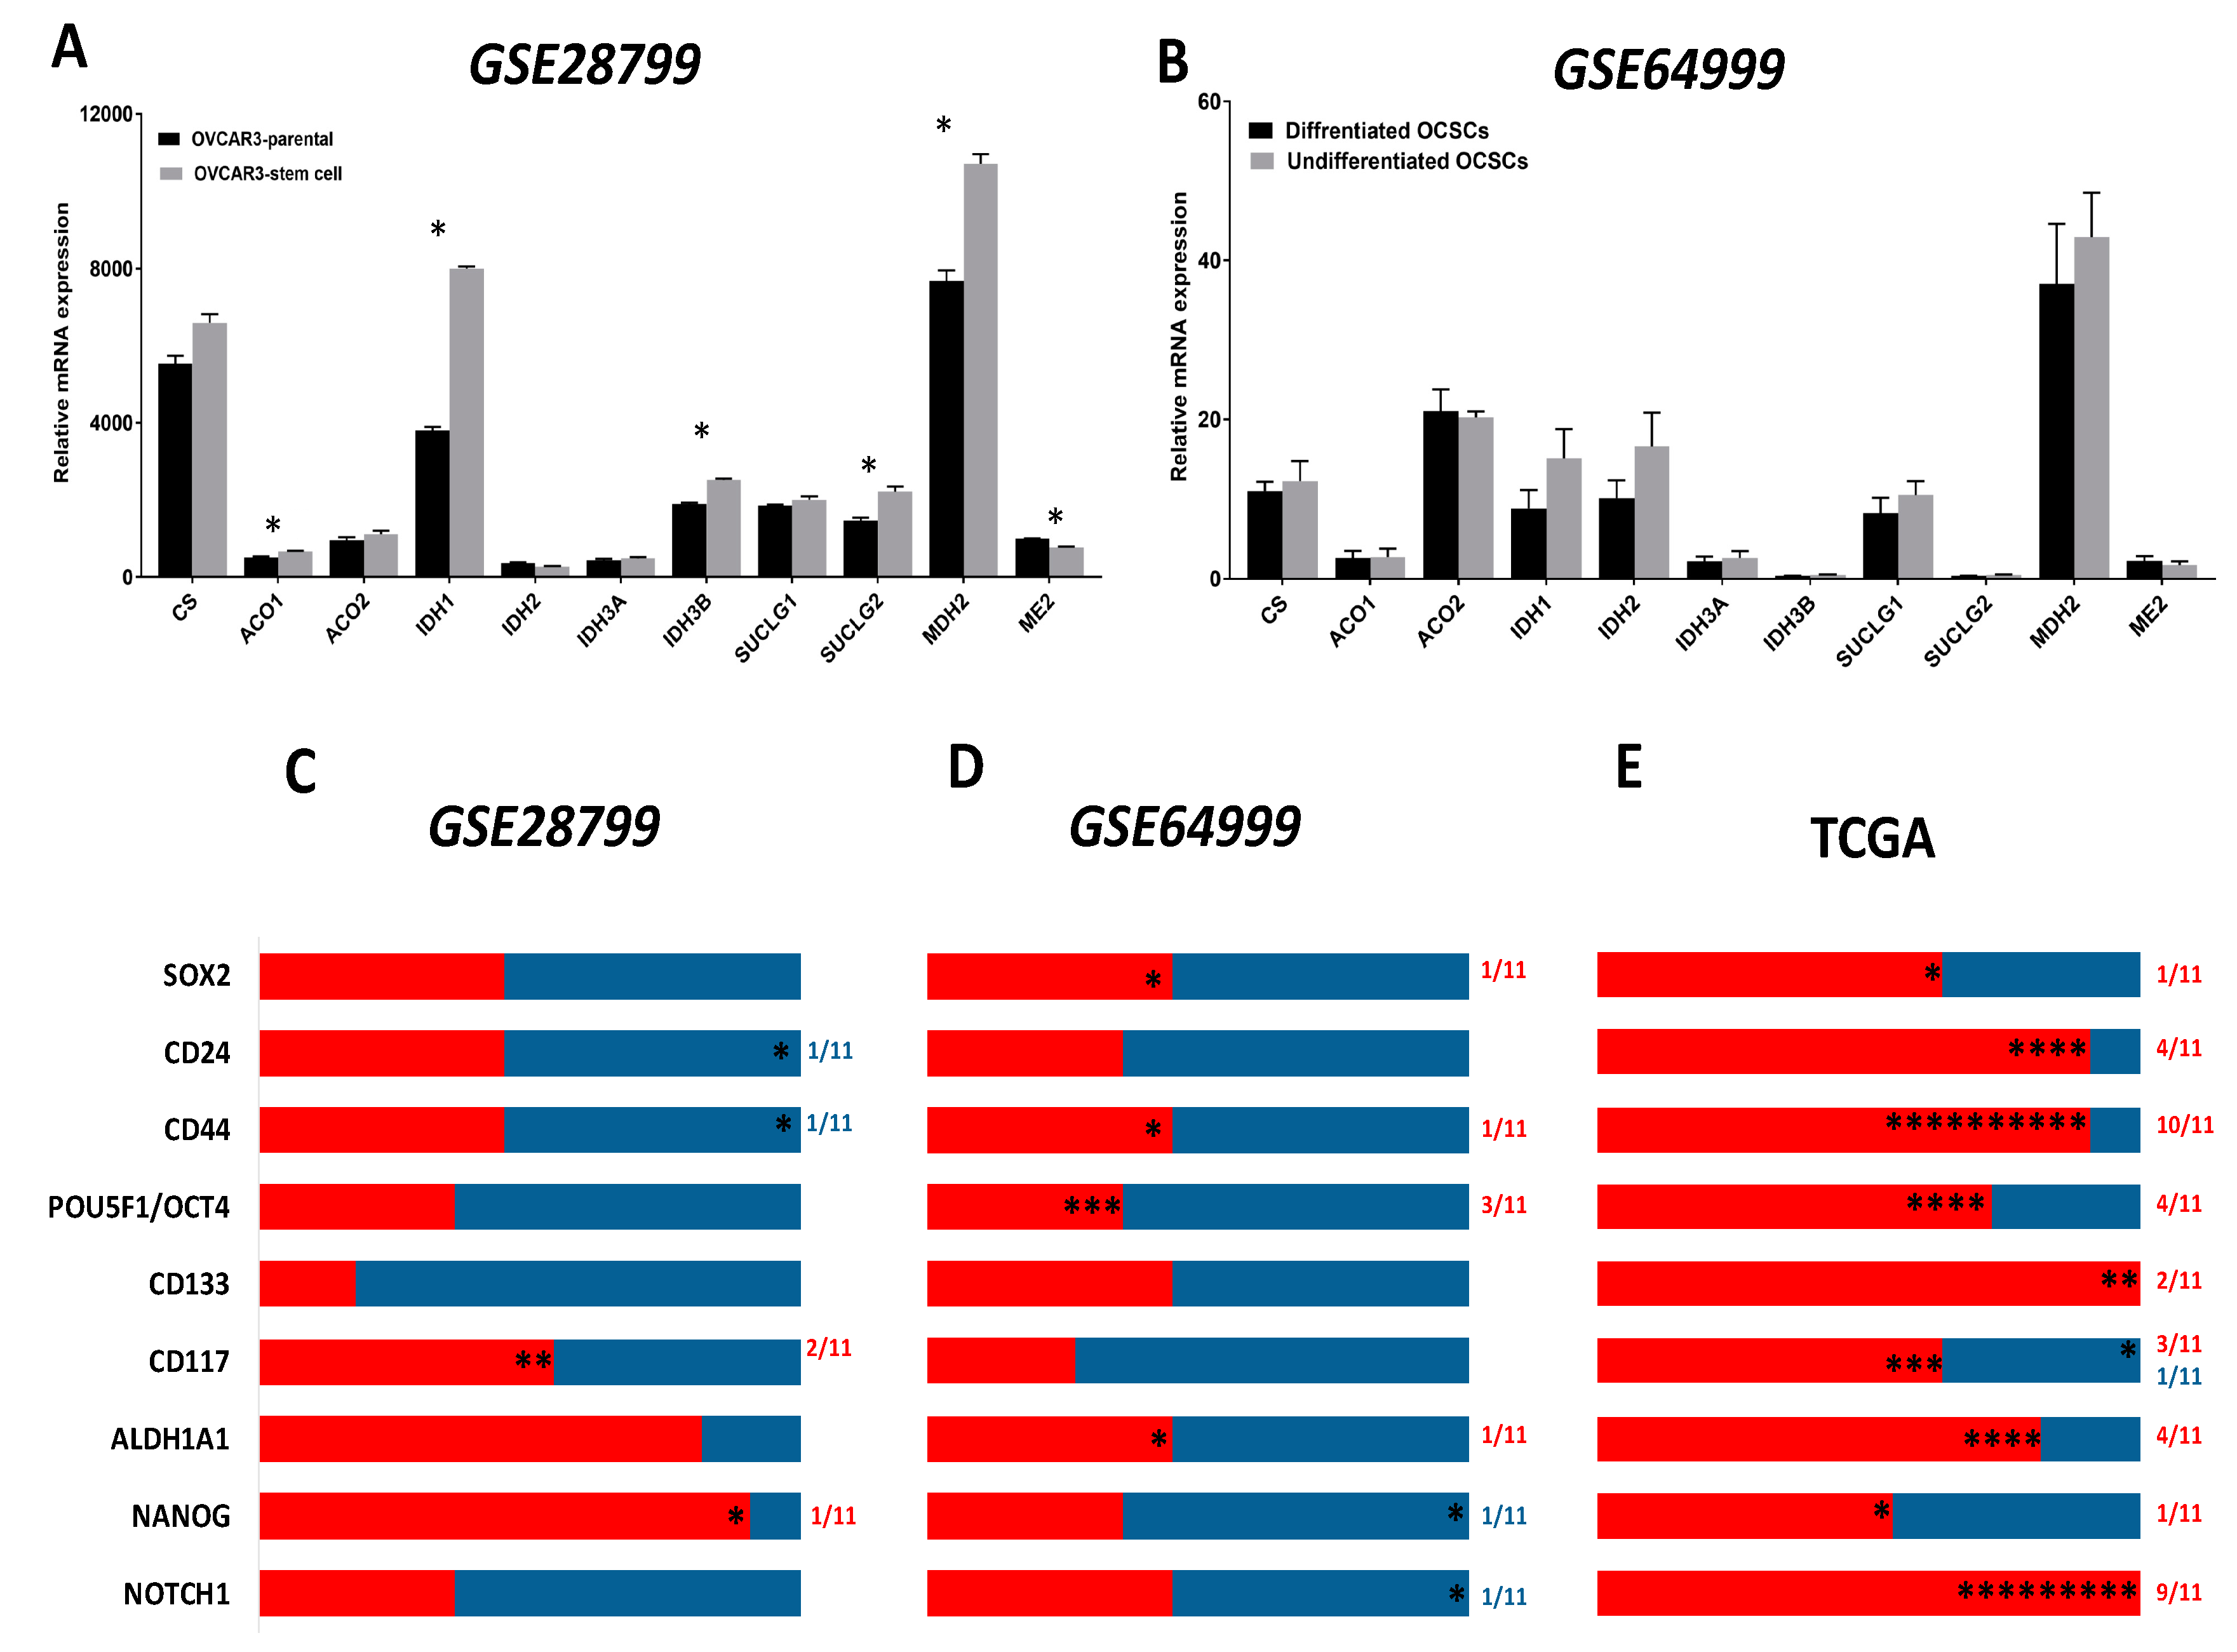
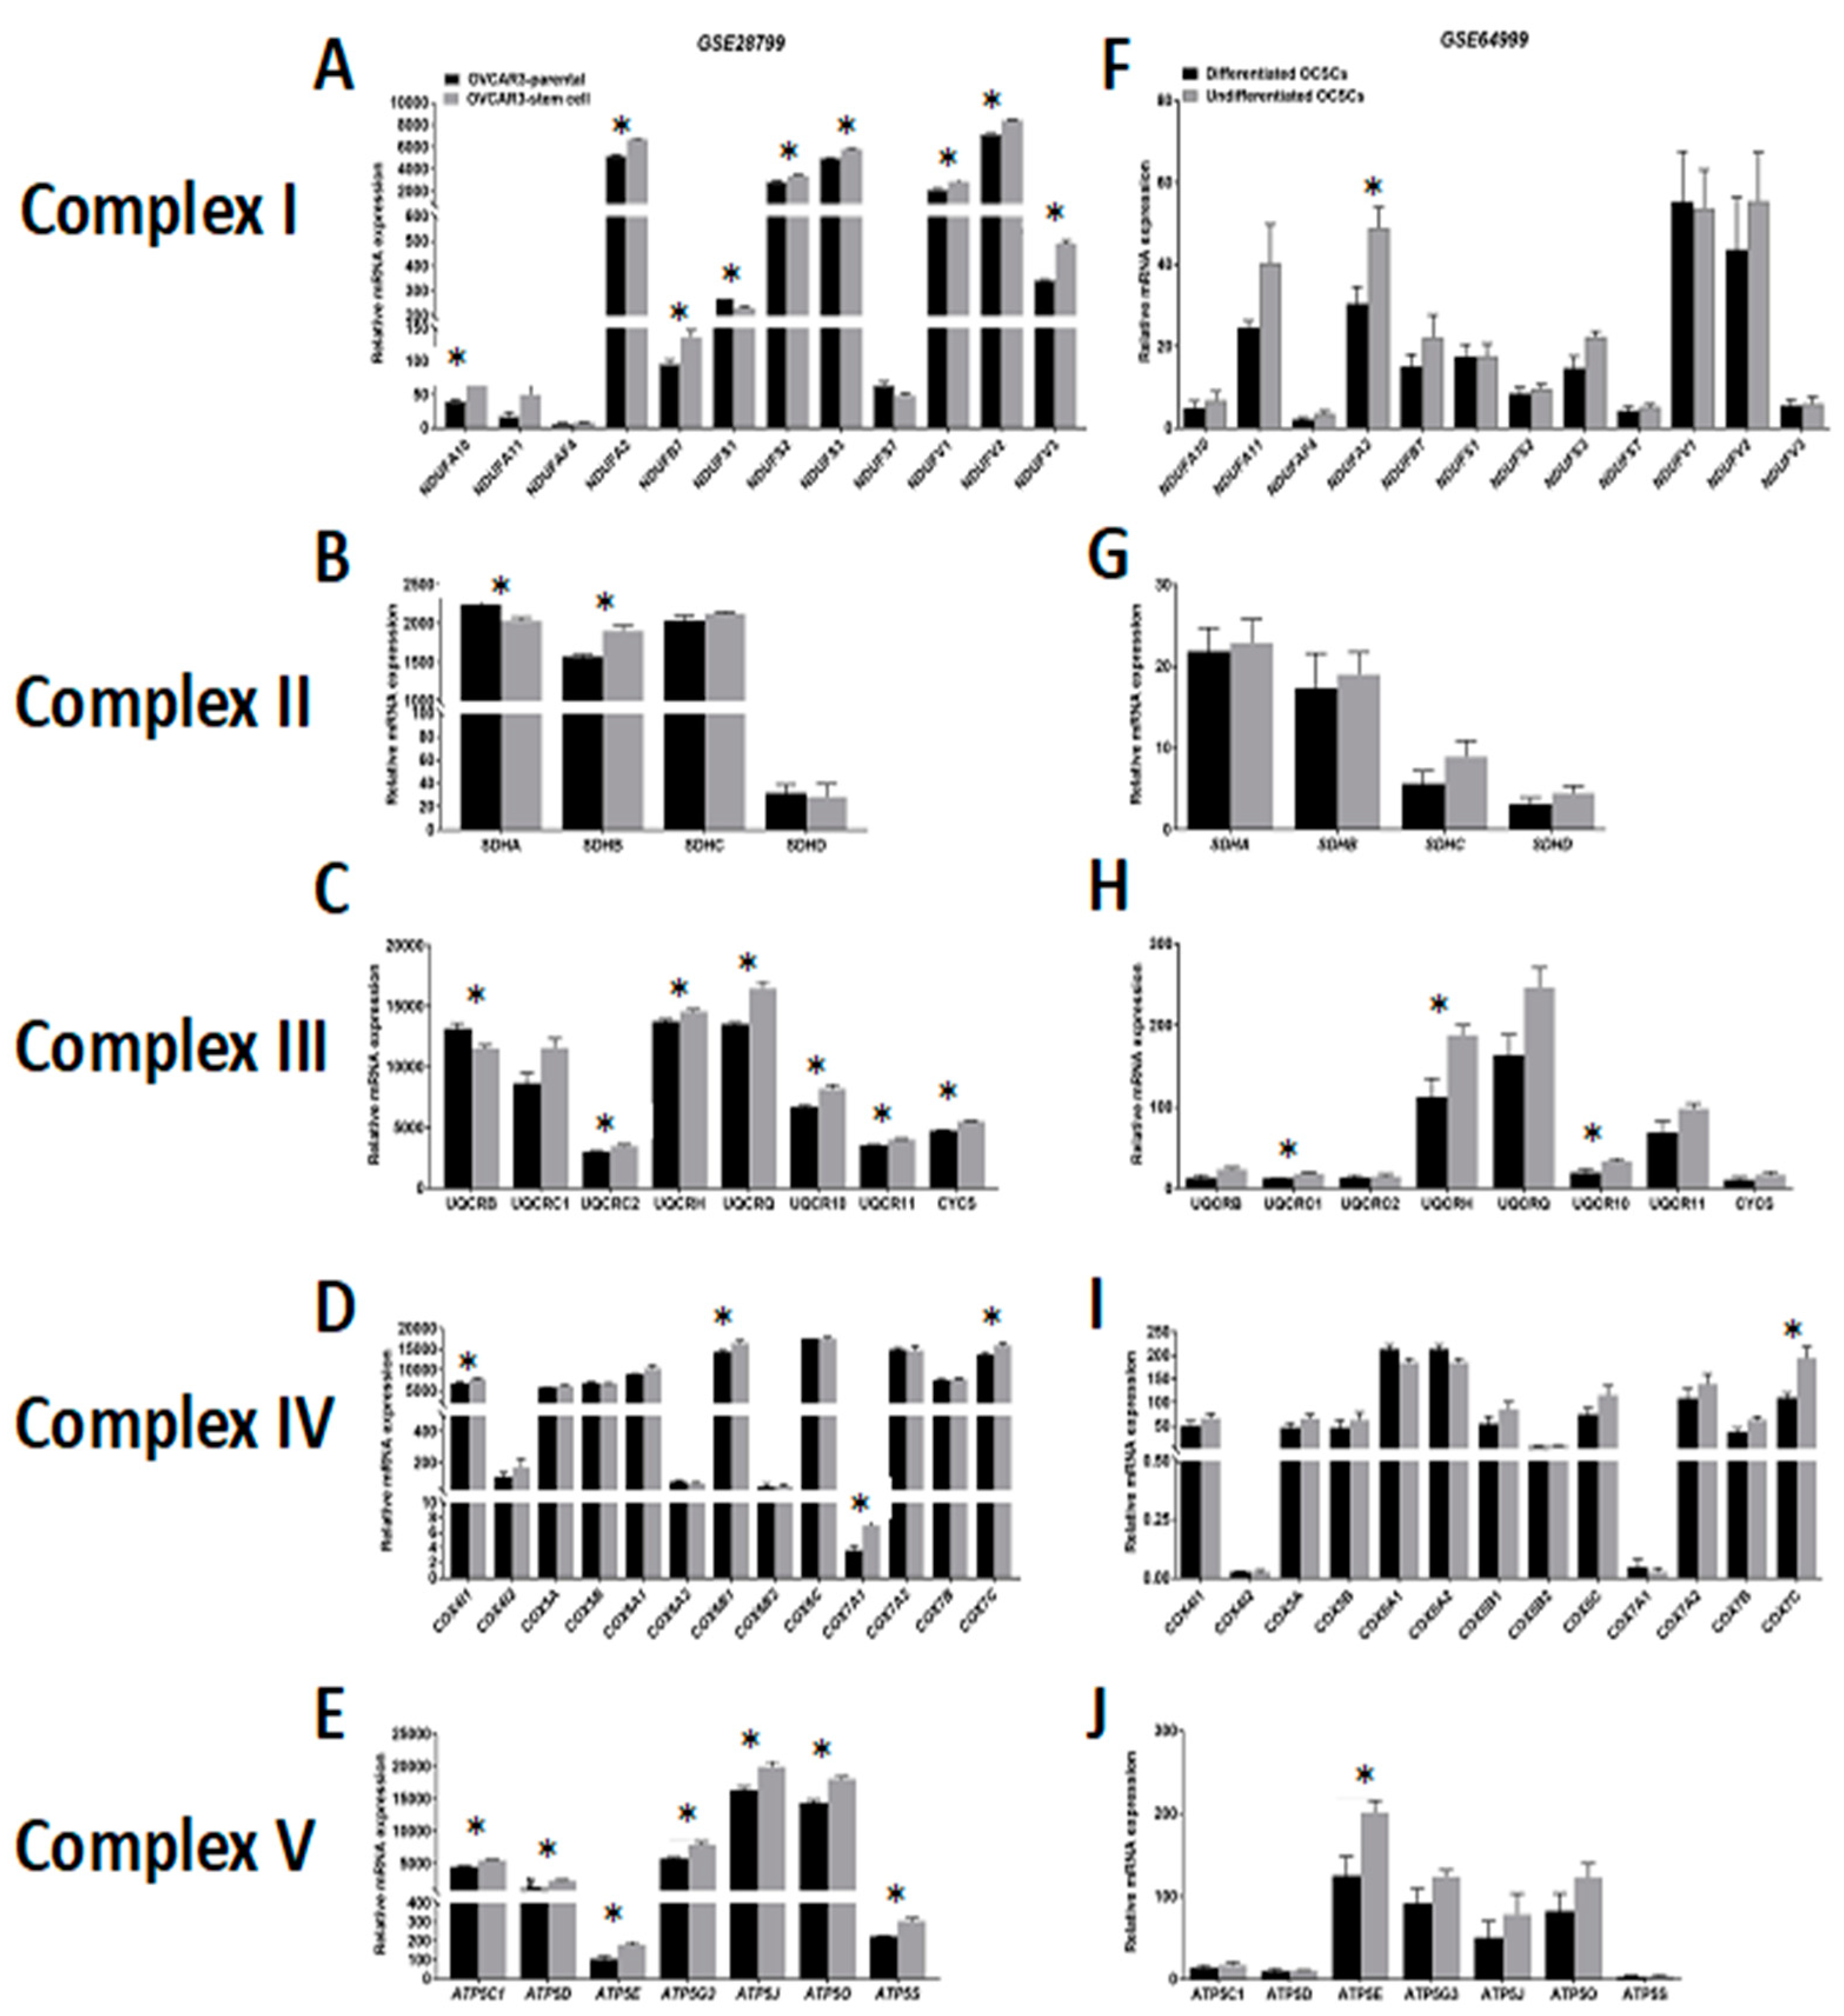
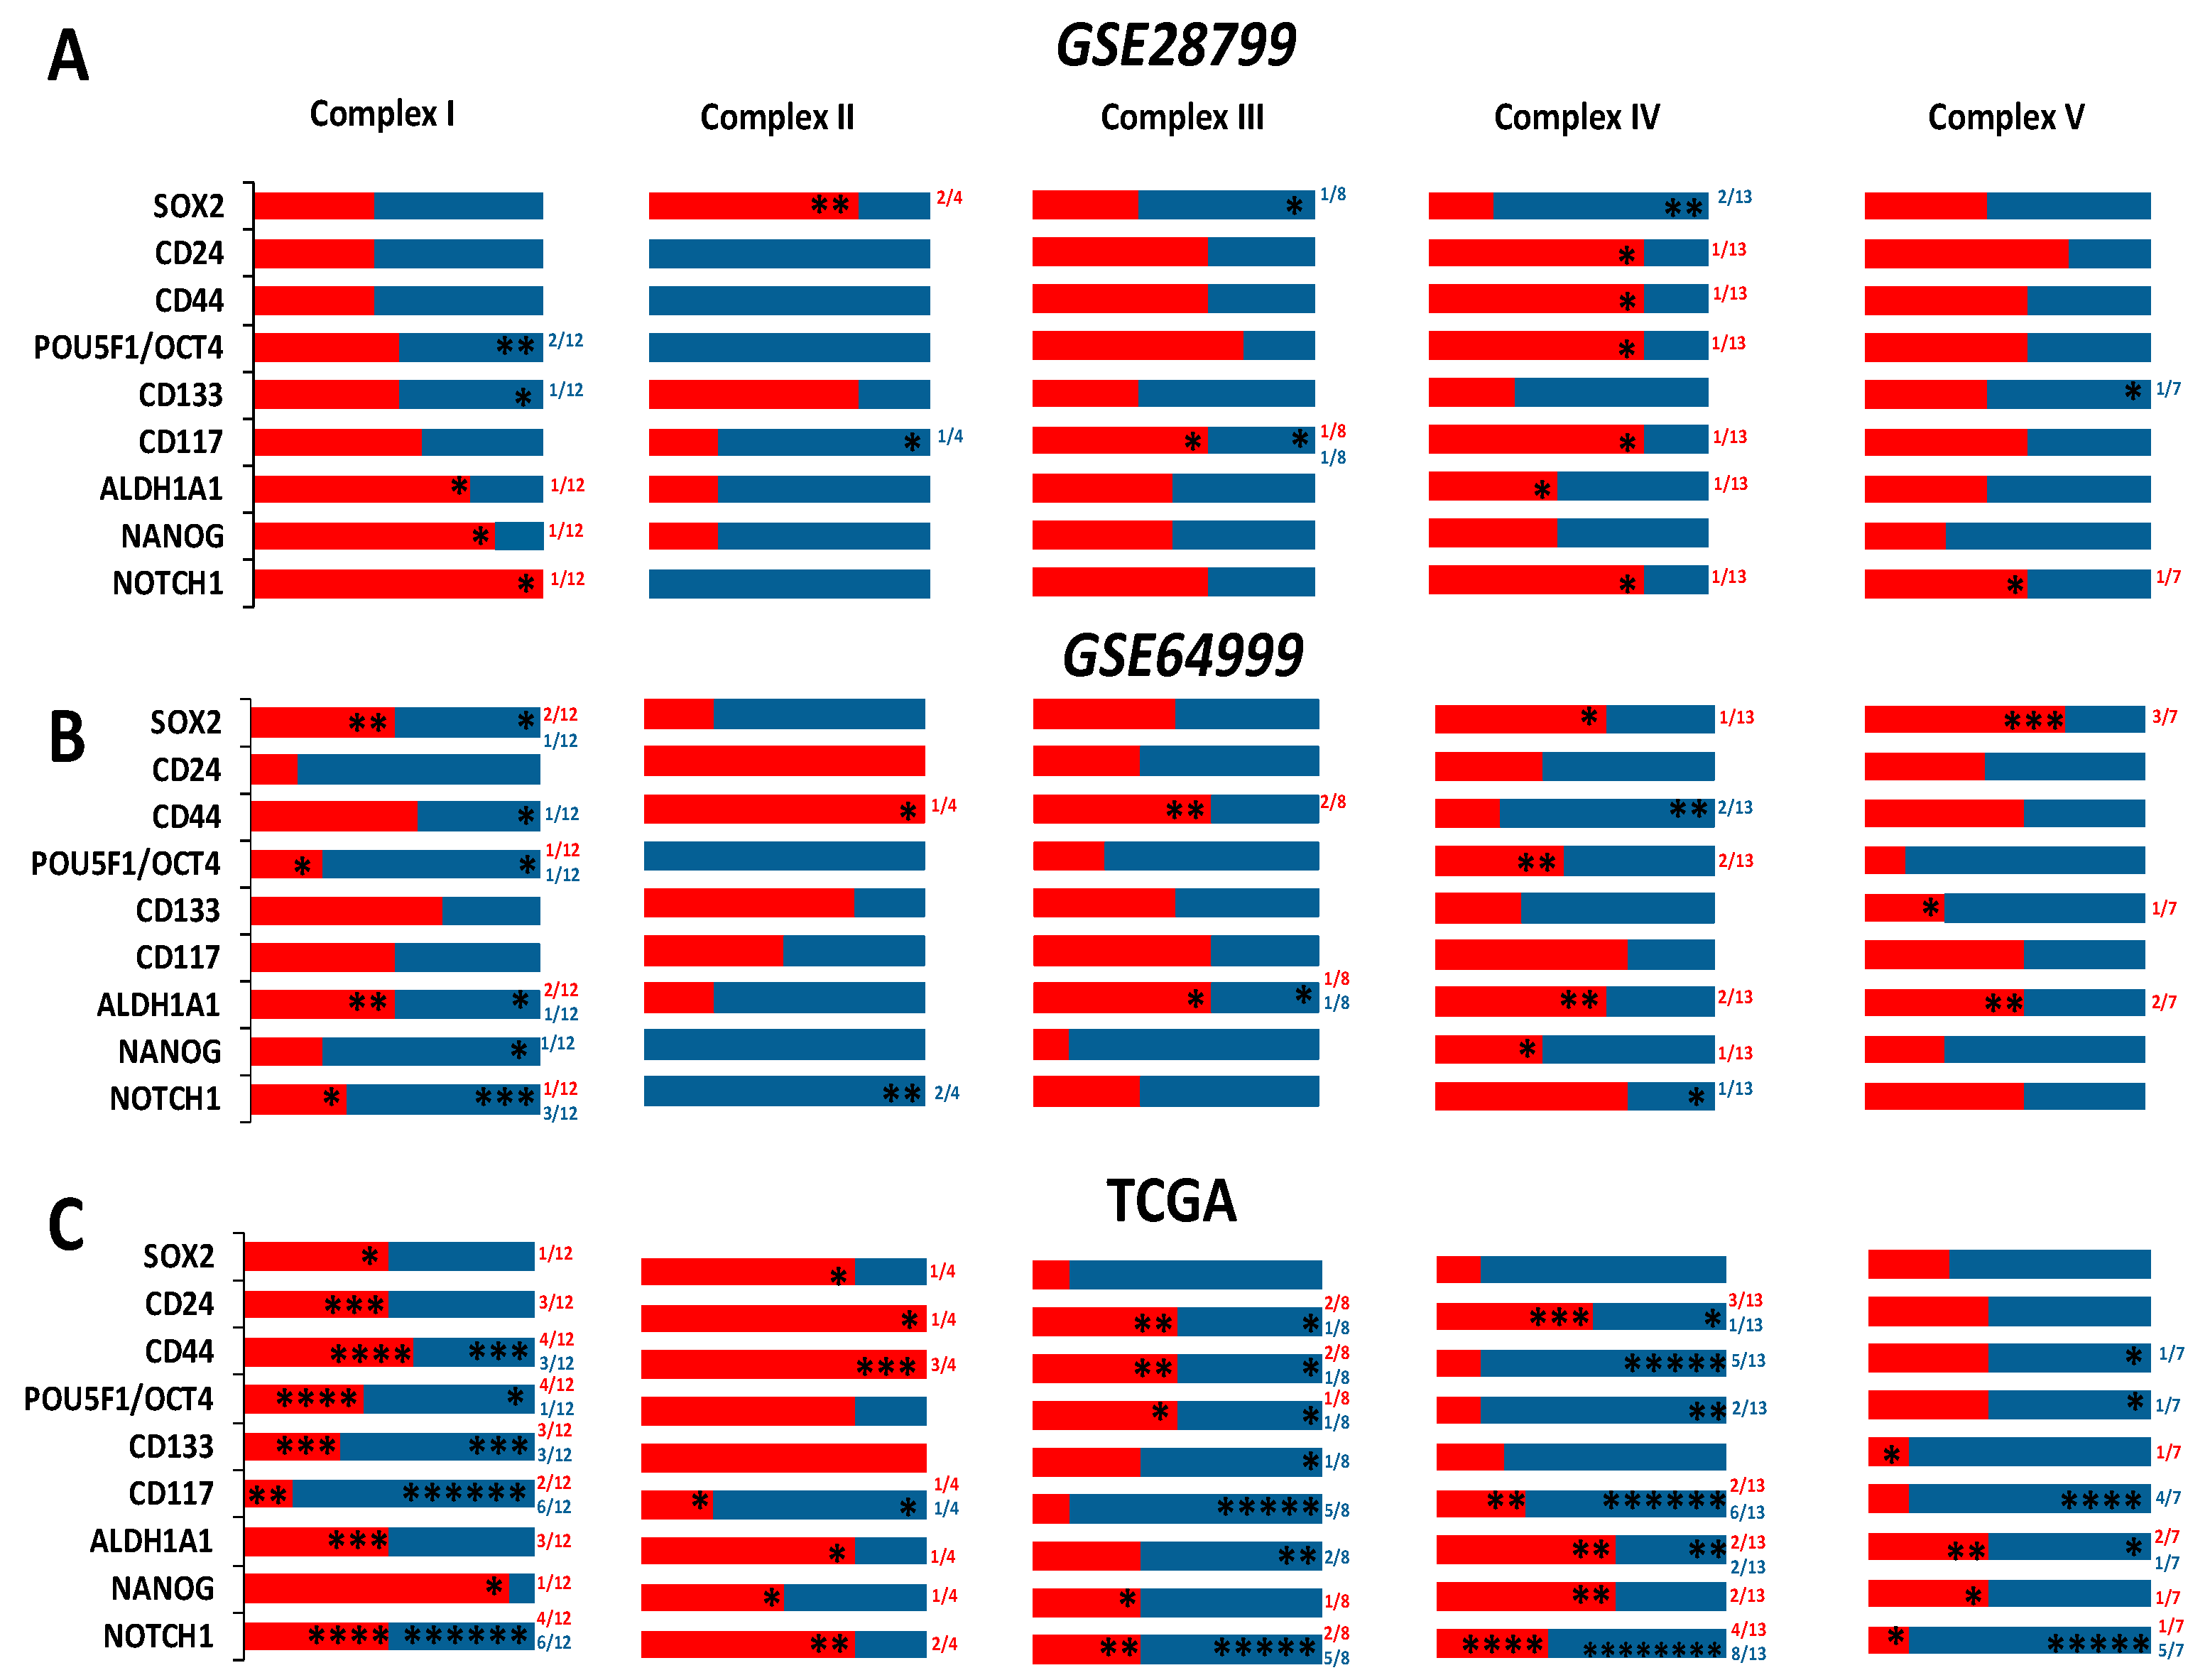
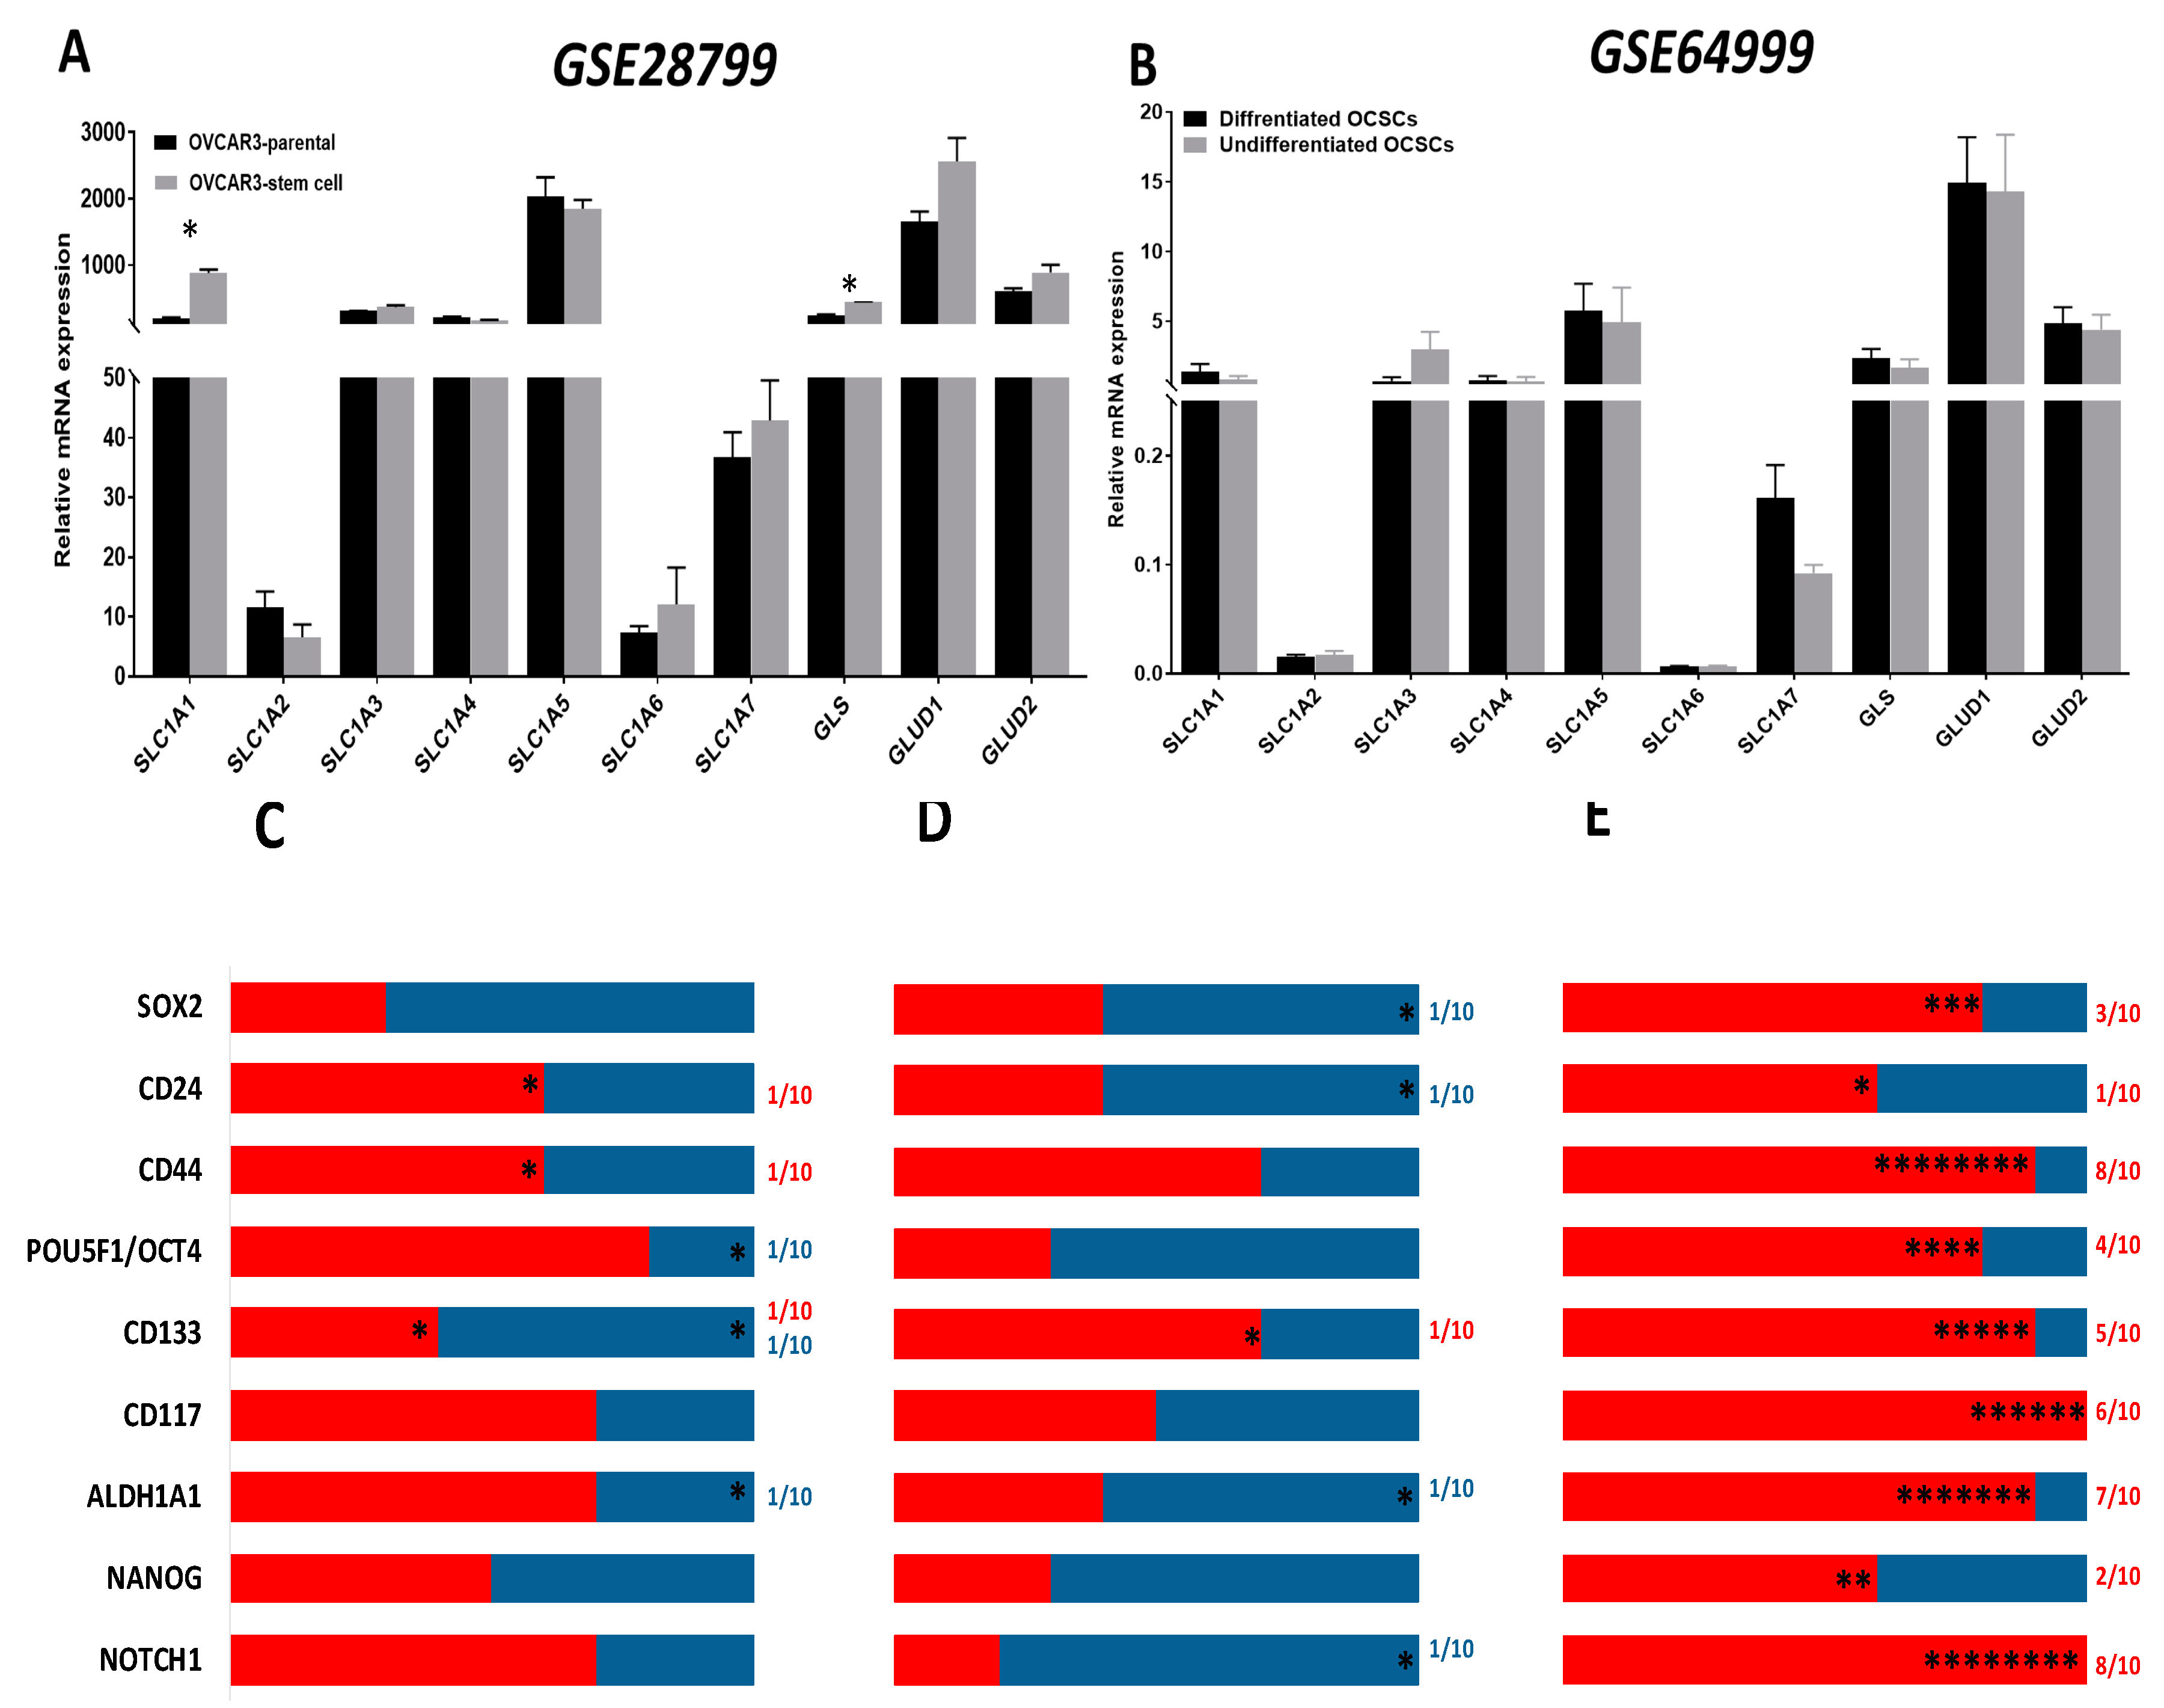
Table 1.
Pearson Correlation between the expression of CSC transcripts and the transcripts of glucose transporters and the key enzymes involved in glycolysis in ovarian cancer specimens from TCGA and curated from GEPIA. Red indicates significant positive and blue indicates negative correlations.
Table 1.
Pearson Correlation between the expression of CSC transcripts and the transcripts of glucose transporters and the key enzymes involved in glycolysis in ovarian cancer specimens from TCGA and curated from GEPIA. Red indicates significant positive and blue indicates negative correlations.
| TCGA | CD44 | CD24 | CD117 | CD133 | ALDH1A1 | SOX2 | 4-Oct | NANOG | NOTCH1 | |||||||||
|---|---|---|---|---|---|---|---|---|---|---|---|---|---|---|---|---|---|---|
| Pearson R | p-Value | Pearson R | p-Value | Pearson R | p-Value | Pearson R | p-Value | Pearson R | p-Value | Pearson R | p-Value | Pearson R | p-Value | Pearson R | p-Value | Pearson R | p-Value | |
| HK1 | 0.29 | 0.00 | 7e−04 | 0.99 | 0.15 | 0.00 | 0.14 | 0.00 | 0.13 | 0.01 | 0.03 | 0.60 | 0.03 | 0.61 | 0.06 | 0.25 | 0.40 | 0.00 |
| HK2 | 0.13 | 0.01 | 0.09 | 0.08 | 0.20 | 2.9e−05 | 0.14 | 0.00 | 0.09 | 0.07 | 0.01 | 0.82 | 0.11 | 0.03 | 0.03 | 0.60 | 0.30 | 4.9e−10 |
| SLC2A1 | 0.09 | 0.07 | 0.00 | 0.95 | 0.23 | 1.7e−06 | 0.04 | 0.42 | 0.10 | 0.03 | 0.00 | 0.87 | 0.00 | 0.95 | 0.03 | 0.60 | 0.22 | 2.9e−06 |
| SLC2A2 | 0.07 | 0.16 | −0.03 | 0.60 | 0.12 | 0.02 | −0.04 | 0.42 | 0.08 | 0.09 | −0.03 | 0.48 | −0.04 | 0.43 | 0.01 | 0.77 | 0.19 | 0.00 |
| SLC2A3 | 0.31 | 9.7e−11 | −0.02 | 0.68 | 0.19 | 0.00 | 0.00 | 0.95 | 0.07 | 0.15 | 0.11 | 0.02 | −0.03 | 0.54 | 0.03 | 0.49 | 0.24 | 3.3e−07 |
| SLC2A4 | 0.01 | 0.77 | 0.04 | 0.37 | 0.19 | 9.4e−05 | 0.01 | 0.87 | 0.00 | 0.97 | 0.09 | 0.06 | 0.01 | 0.77 | 0.09 | 0.06 | 0.18 | 0.00 |
| SLC2A5 | 0.45 | 0.00 | 0.02 | 0.74 | 0.06 | 0.24 | 0.00 | 0.98 | −0.03 | 0.61 | −0.03 | 0.57 | 0.03 | 0.52 | −0.05 | 0.29 | 0.18 | 0.00 |
| SLC2A6 | 0.24 | 5e−07 | −0.12 | 0.01 | 0.00 | 0.90 | 0.00 | 0.89 | 0.05 | 0.31 | 0.00 | 0.86 | −0.04 | 0.40 | −0.05 | 0.28 | 0.29 | 1e−09 |
| PGK1 | 0.30 | 4.4 × 10¹⁰ | −0.01 | 0.82 | 0.02 | 0.63 | 0.02 | 0.69 | 0.19 | 8.7e−05 | 0.10 | 0.04 | 0.00 | 1.00 | 0.04 | 0.45 | 0.14 | 0.00 |
| PFKFB3 | 0.35 | 0.00 | 0.00 | 0.93 | 0.11 | 0.02 | 0.11 | 0.03 | 0.04 | 0.39 | 0.10 | 0.03 | 0.09 | 0.07 | −0.01 | 0.77 | 0.28 | 6.9e−09 |
| LDHA | 0.20 | 3.5e−05 | −0.03 | 0.60 | −0.02 | 0.74 | −0.03 | 0.60 | 0.13 | 0.01 | 0.06 | 0.24 | 0.04 | 0.46 | 0.00 | 0.97 | −0.02 | 0.65 |
| FBP1 | 0.40 | 0.00 | −0.11 | 0.02 | −0.06 | 0.24 | 0.00 | 0.98 | 0.11 | 0.03 | 0.06 | 0.19 | 0.00 | 0.96 | 0.00 | 0.93 | 0.03 | 0.48 |
| PDK1 | 0.12 | 0.01 | 0.02 | 0.66 | 0.04 | 0.38 | 0.06 | 0.23 | 0.24 | 3.9e−07 | 0.04 | 0.41 | 0.04 | 0.42 | 0.01 | 0.80 | 0.13 | 0.01 |
| PDHA | 0.12 | 0.01 | −0.02 | 0.75 | −0.02 | 0.70 | 0.07 | 0.13 | 0.14 | 0.01 | 0.09 | 0.06 | 0.08 | 0.11 | 0.03 | 0.51 | 0.22 | 5.4e−06 |
| TPI1 | 0.07 | 0.15 | 0.05 | 0.33 | −0.04 | 0.47 | −0.06 | 0.25 | 0.03 | 0.56 | 0.02 | 0.75 | −0.01 | 0.77 | 0.08 | 0.10 | −0.02 | 0.74 |
| ENO1 | 0.23 | 1.3e−06 | 0.07 | 0.17 | −0.02 | 0.71 | 0.09 | 0.08 | 0.10 | 0.05 | 0.01 | 0.86 | 0.13 | 0.01 | −0.04 | 0.47 | 0.12 | 0.02 |
| PHGDH | 0.02 | 0.71 | 0.03 | 0.50 | 0.19 | 5.3e−05 | 0.10 | 0.05 | 0.20 | 4.8e−05 | 0.22 | 6.4e−06 | −0.05 | 0.30 | 0.14 | 0.00 | 0.14 | 0.00 |
Table 2.
Correlation of OCSC markers with TCA enzymes in TCGA. Pearson Correlation between the expression of CSC transcripts and the transcripts of the key TCA enzymes in ovarian cancer specimens from TCGA and curated from GEPIA. Red indicates significant positive, blue indicates negative correlations, and black indicates insignificant p-values of either positive or negative correlations.
| TCGA | CD44 | CD24 | CD117 | CD133 | ALDH1A1 | SOX2 | 4-Oct | NANOG | NOTCH1 | |||||||||
|---|---|---|---|---|---|---|---|---|---|---|---|---|---|---|---|---|---|---|
| Pearson R | p-Value | Pearson R | p-Value | Pearson R | p-Value | Pearson R | p-Value | Pearson R | p-Value | Pearson R | p-Value | Pearson R | p-Value | Pearson R | p-Value | Pearson R | p-Value | |
| CS | 0.19 | 8.2e−05 | 0.16 | 0.00 | 0.23 | 9.9e−07 | 0.09 | 0.06 | 0.15 | 0.00 | 0.00 | 0.96 | 0.07 | 0.18 | 0.11 | 0.02 | 0.39 | 0.00 |
| ACO1 | 0.30 | 1.6e−10 | 0.08 | 0.09 | 0.21 | 1.1e−05 | 0.24 | 7.6e−07 | 0.30 | 5.1e−10 | 0.10 | 0.05 | 0.11 | 0.02 | 0.00 | 0.99 | 0.34 | 2.8e−13 |
| ACO2 | 0.18 | 0.00 | 0.11 | 0.02 | −0.06 | 0.17 | 0.04 | 0.41 | −0.03 | 0.58 | −0.03 | 0.58 | 0.10 | 0.05 | −0.04 | 0.45 | 0.24 | 3.6e−07 |
| IDH1 | 0.12 | 0.01 | 0.08 | 0.11 | 0.01 | 0.77 | 0.06 | 0.21 | 0.16 | 0.00 | 0.09 | 0.08 | 0.01 | 0.88 | 0.02 | 0.63 | 0.17 | 0.00 |
| IDH2 | 0.16 | 0.00 | 0.07 | 0.13 | 0.11 | 0.03 | 0.07 | 0.14 | 0.09 | 0.08 | 0.05 | 0.27 | −0.03 | 0.51 | 0.04 | 0.39 | 0.25 | 2.6e−07 |
| IDH3A | 0.16 | 0.00 | −0.09 | 0.06 | −0.04 | 0.44 | 0.07 | 0.15 | 0.09 | 0.06 | 0.04 | 0.37 | −0.03 | 0.58 | −0.01 | 0.77 | 0.24 | 4.2e−07 |
| IDH3B | −0.08 | 0.12 | 0.09 | 0.06 | 0.09 | 0.07 | 0.04 | 0.48 | 0.03 | 0.60 | −0.05 | 0.35 | 0.06 | 0.21 | 0.04 | 0.47 | 0.24 | 6e−07 |
| SUCLG1 | 0.13 | 0.01 | 0.16 | 0.00 | 0.01 | 0.86 | 0.01 | 0.81 | 0.13 | 0.01 | 0.00 | 0.90 | 0.00 | 0.99 | 0.03 | 0.50 | 0.04 | 0.41 |
| SUCLG2 | 0.19 | 9.3e−05 | 0.01 | 0.89 | −0.08 | 0.12 | 0.05 | 0.27 | 0.06 | 0.22 | 0.08 | 0.12 | 0.11 | 0.02 | 0.00 | 0.90 | 0.05 | 0.28 |
| MDH2 | 0.20 | 4.4e−05 | 0.00 | 0.92 | −0.1 | 0.05 | 0.00 | 0.96 | 0.00 | 0.97 | 0.01 | 0.79 | 0.07 | 0.17 | 0.01 | 0.87 | 0.10 | 0.04 |
| ME2 | 0.27 | 9.6e−09 | 0.16 | 0.00 | 0.05 | 0.33 | 0.08 | 0.09 | 0.09 | 0.07 | 0.04 | 0.45 | 0.13 | 0.01 | −0.03 | 0.65 | 0.12 | 0.01 |
Table 3.
Pearson correlation between the expression of CSC transcripts and the transcripts of the key enzymes involved in the ETC in patients’ data curated from TCGA. Red indicates significant positive, blue indicates negative correlations, and black indicates insignificant p-values of either positive or negative correlations.
| TCGA | ||||||||||||||||||
|---|---|---|---|---|---|---|---|---|---|---|---|---|---|---|---|---|---|---|
| CD44 | CD24 | CD117 | CD133 | ALDH1A1 | SOX2 | 4-Oct | NANOG | NOTCH1 | ||||||||||
| Complex I | Pearson R | p-Value | Pearson R | p-Value | Pearson R | p-Value | Pearson R | p-Value | Pearson R | p-Value | Pearson R | p-Value | Pearson R | p-Value | Pearson R | p-Value | Pearson R | p-Value |
| NDUFA10 | 0.04 | 0.44 | 0.02 | 0.72 | −0.02 | 0.72 | −0.03 | 0.52 | 0.09 | 0.06 | −0.02 | 0.62 | −0.03 | 0.53 | 0.00 | 0.93 | 0.10 | 0.05 |
| NDUFA11 | −0.02 | 0.62 | 0.08 | 0.10 | 0.00 | 0.93 | −0.05 | 0.29 | −0.01 | 0.86 | −0.02 | 0.67 | −0.07 | 0.16 | 0.05 | 0.30 | −0.15 | 0.00 |
| NDUFAF4 | −0.12 | 0.01 | 0.23 | 1.6e−06 | −0.06 | 0.22 | −0.09 | 0.05 | 0.03 | 0.54 | −0.02 | 0.76 | 0.00 | 1.00 | 0.05 | 0.29 | −0.13 | 0.01 |
| NDUFA2 | −0.13 | 0.01 | −0.03 | 0.48 | −0.19 | 1e−04 | −0.11 | 0.02 | −0.02 | 0.66 | −0.02 | 0.64 | −0.09 | 0.06 | 0.01 | 0.83 | −0.29 | 1.7e−09 |
| NDUFB7 | −0.12 | 0.01 | −0.02 | 0.67 | −0.15 | 0.00 | −0.09 | 0.06 | −0.05 | 0.32 | −0.04 | 0.40 | −0.07 | 0.15 | 0.03 | 0.49 | −0.18 | 0.00 |
| NDUFS1 | 0.20 | 2.8e−05 | 0.16 | 0.00 | 0.14 | 0.00 | 0.14 | 0.00 | 0.17 | 0.00 | 0.02 | 0.69 | 0.07 | 0.14 | 0.03 | 0.57 | 0.39 | 0.00 |
| NDUFS2 | 0.18 | 0.00 | 0.13 | 0.01 | 0.15 | 0.00 | 0.13 | 0.01 | 0.06 | 0.23 | 0.09 | 0.06 | 0.15 | 0.00 | 0.16 | 0.00 | 0.36 | 1.3e−14 |
| NDUFS3 | 0.12 | 0.01 | −0.05 | 0.29 | −0.12 | 0.01 | −0.02 | 0.74 | 0.00 | 0.93 | 0.04 | 0.39 | 0.04 | 0.39 | 0.02 | 0.62 | −0.10 | 0.05 |
| NDUFS7 | 0.15 | 0.00 | −0.02 | 0.73 | −0.18 | 0.00 | −0.08 | 0.10 | −0.03 | 0.49 | −0.01 | 0.89 | −0.01 | 0.86 | −0.02 | 0.69 | −0.11 | 0.02 |
| NDUFV1 | 0.05 | 0.33 | −0.02 | 0.71 | −0.13 | 0.01 | −0.01 | 0.80 | −0.04 | 0.43 | 0.03 | 0.51 | 0.18 | 0.00 | 0.03 | 0.61 | 0.08 | 0.11 |
| NDUFV2 | −0.02 | 0.71 | 0.05 | 0.29 | −0.11 | 0.02 | 0.15 | 0.00 | 0.02 | 0.65 | 0.06 | 0.18 | −1e−04 | 1.00 | 0.05 | 0.35 | 0.01 | 0.88 |
| NDUFV3 | 0.06 | 0.24 | −0.01 | 0.84 | −0.03 | 0.56 | 0.07 | 0.14 | 0.09 | 0.07 | 0.03 | 0.52 | 0.10 | 0.03 | 0.08 | 0.10 | 0.15 | 0.00 |
| Complex II | ||||||||||||||||||
| SDHA | 0.11 | 0.03 | 0.03 | 0.52 | −0.04 | 0.46 | 0.05 | 0.35 | 0.03 | 0.52 | 0.11 | 0.03 | 0.06 | 0.20 | 0.04 | 0.39 | 0.16 | 0.00 |
| SDHB | 0.18 | 0.00 | 0.09 | 0.07 | −0.05 | 0.28 | 0.05 | 0.29 | −0.02 | 0.76 | −0.05 | 0.29 | 0.08 | 0.10 | −0.03 | 0.56 | 0.03 | 0.54 |
| SDHC | 0.16 | 0.00 | 0.11 | 0.03 | 0.10 | 0.04 | 0.07 | 0.15 | 0.21 | 1.4e−05 | 0.06 | 0.23 | −0.0029 | 0.95 | 0.11 | 0.03 | 0.11 | 0.02 |
| SDHD | 0.03 | 0.59 | 0.08 | 0.09 | −0.12 | 0.01 | 0.02 | 0.72 | 0.00 | 0.96 | 0.02 | 0.75 | 0.04 | 0.46 | −0.04 | 0.43 | −0.03 | 0.48 |
| Complex III | ||||||||||||||||||
| UQCRB | −0.12 | 0.02 | −0.06 | 0.19 | −0.20 | 2.6e−05 | −0.08 | 0.09 | −0.14 | 0.00 | −0.06 | 0.20 | −0.1 | 0.04 | −0.04 | 0.47 | −0.20 | 2.1e−05 |
| UQCRC1 | 0.03 | 0.54 | 0.08 | 0.09 | 0.00 | 0.94 | 0.06 | 0.25 | 0.08 | 0.09 | 0.04 | 0.39 | 0.06 | 0.20 | 0.13 | 0.01 | 0.17 | 0.00 |
| UQCRC2 | 0.21 | 1.3e−05 | 0.17 | 0.00 | 0.05 | 0.31 | 0.07 | 0.17 | 0.00 | 0.92 | −0.06 | 0.23 | 0.15 | 0.00 | 0.04 | 0.37 | 0.07 | 0.16 |
| UQCRH | −0.04 | 0.42 | −0.13 | 0.01 | −0.13 | 0.01 | −0.01 | 0.82 | −0.01 | 0.84 | 0.00 | 1.00 | −0.03 | 0.58 | −0.08 | 0.12 | −0.17 | 0.00 |
| UQCRQ | −0.05 | 0.34 | −0.06 | 0.20 | −0.17 | 0.00 | −0.06 | 0.19 | −0.03 | 0.60 | −0.02 | 0.70 | −0.01 | 0.77 | −0.04 | 0.41 | −0.31 | 3.6e−11 |
| UQCR10 | 0.04 | 0.43 | 0.15 | 0.00 | −0.1 | 0.04 | 0.03 | 0.50 | 0.00 | 0.97 | −0.02 | 0.70 | 0.06 | 0.23 | −0.02 | 0.66 | −0.11 | 0.02 |
| UQCR11 | −0.03 | 0.57 | −0.05 | 0.32 | −0.21 | 9.6e−06 | −0.10 | 0.04 | −0.07 | 0.18 | −0.03 | 0.50 | −0.1 | 0.04 | −0.03 | 0.59 | −0.29 | 8e−10 |
| CYCS | 0.09 | 0.05 | 0.07 | 0.18 | −0.06 | 0.20 | −0.04 | 0.43 | 0.09 | 0.06 | −0.02 | 0.73 | 0.02 | 0.64 | 0.03 | 0.60 | 0.11 | 0.03 |
| Complex IV | ||||||||||||||||||
| COX4I1 | 0.01 | 0.81 | 0.10 | 0.05 | −0.15 | 0.00 | 0.03 | 0.57 | −0.09 | 0.07 | −0.06 | 0.26 | 0.03 | 0.50 | −0.06 | 0.21 | −0.19 | 1e−04 |
| COX4I2 | −0.07 | 0.18 | 0.06 | 0.22 | 0.25 | 2.2e−07 | 0.01 | 0.83 | 0.17 | 0.00 | −0.01 | 0.82 | −0.08 | 0.10 | 0.16 | 0.00 | 0.15 | 0.00 |
| COX5A | 0.00 | 0.95 | −0.09 | 0.08 | −0.19 | 9.3e−05 | −0.04 | 0.42 | 0.00 | 0.95 | −0.04 | 0.43 | −0.04 | 0.42 | −0.05 | 0.31 | −0.13 | 0.01 |
| COX5B | −0.22 | 6.6e−06 | 0.10 | 0.04 | −0.18 | 0.00 | −0.07 | 0.13 | −0.09 | 0.08 | −0.02 | 0.64 | −0.02 | 0.68 | −0.04 | 0.36 | −0.27 | 1.7e−08 |
| COX6A1 | −0.1 | 0.04 | 0.03 | 0.53 | −0.11 | 0.03 | −0.06 | 0.23 | 0.07 | 0.13 | 0.01 | 0.87 | −0.10 | 0.04 | 0.06 | 0.19 | −0.12 | 0.02 |
| COX6A2 | −0.13 | 0.01 | 0.09 | 0.06 | 0.20 | 3.1e−05 | 0.00 | 0.92 | 0.14 | 0.00 | 0.02 | 0.69 | −0.07 | 0.14 | 0.24 | 3.6e−07 | 0.04 | 0.39 |
| COX6B1 | −0.06 | 0.21 | −0.03 | 0.61 | −0.02 | 0.73 | −0.06 | 0.23 | 0.07 | 0.15 | −0.01 | 0.87 | 0.01 | 0.85 | 0.07 | 0.15 | −0.19 | 0.00 |
| COX6B2 | −0.04 | 0.38 | −0.01 | 0.77 | 0.06 | 0.20 | −0.03 | 0.54 | 0.00 | 0.94 | −0.03 | 0.48 | 0.00 | 0.96 | 0.07 | 0.15 | 0.23 | 2.6e−06 |
| COX6C | −0.09 | 0.05 | −0.12 | 0.01 | −0.20 | 5e−05 | −0.032 | 0.51 | −0.13 | 0.01 | −0.04 | 0.39 | −0.12 | 0.01 | −0.01 | 0.91 | −0.12 | 0.01 |
| COX7A1 | −0.02 | 0.64 | −0.06 | 0.24 | 0.13 | 0.01 | −0.03 | 0.56 | 0.08 | 0.09 | −0.04 | 0.38 | −0.06 | 0.19 | 0.02 | 0.67 | 0.00 | 0.99 |
| COX7A2 | −0.08 | 0.09 | 0.09 | 0.05 | −0.04 | 0.40 | −0.09 | 0.06 | 0.02 | 0.74 | 0.00 | 0.93 | −0.08 | 0.09 | 0.01 | 0.87 | −0.19 | 5.8e−05 |
| COX7B | −0.02 | 0.70 | −0.01 | 0.78 | −0.19 | 1e−04 | −0.07 | 0.14 | 0.01 | 0.78 | 0.00 | 0.95 | −0.07 | 0.15 | 0.00 | 0.98 | −0.27 | 1.1e−08 |
| COX7C | −0.21 | 9.9e−06 | 0.03 | 0.55 | −0.08 | 0.09 | −0.09 | 0.08 | −0.10 | 0.04 | −0.09 | 0.06 | 0.00 | 0.96 | −0.01 | 0.84 | −0.30 | 2.8e−10 |
| Complex V | ||||||||||||||||||
| ATP5C1 | 0.03 | 0.51 | 0.08 | 0.11 | −0.06 | 0.24 | −0.06 | 0.22 | −0.02 | 0.62 | 0.01 | 0.87 | −0.05 | 0.36 | −0.05 | 0.28 | −0.07 | 0.13 |
| ATP5D | −0.02 | 0.63 | −0.01 | 0.91 | −0.22 | 7.6e−06 | −0.11 | 0.02 | −0.15 | 0.00 | −0.06 | 0.26 | 0.00 | 0.93 | −0.04 | 0.38 | −0.18 | 0.00 |
| ATP5E | −0.14 | 0.00 | 0.00 | 0.93 | −0.05 | 0.33 | −0.03 | 0.54 | 0.03 | 0.52 | 0.06 | 0.26 | −0.10 | 0.04 | 0.02 | 0.76 | −0.19 | 0.00 |
| ATP5G3 | 0.07 | 0.14 | −0.04 | 0.36 | −0.16 | 0.00 | −0.08 | 0.08 | −0.01 | 0.87 | −0.06 | 0.23 | −0.05 | 0.34 | −0.07 | 0.17 | −0.13 | 0.01 |
| ATP5J | −0.03 | 0.52 | −0.02 | 0.65 | −0.10 | 0.05 | −0.04 | 0.44 | 0.17 | 0.00 | −0.01 | 0.84 | 0.01 | 0.89 | 0.00 | 0.97 | −0.17 | 0.00 |
| ATP5O | −0.10 | 0.04 | −0.02 | 0.75 | −0.10 | 0.03 | −0.06 | 0.23 | −0.07 | 0.14 | −0.07 | 0.14 | 0.06 | 0.25 | 0.04 | 0.46 | −0.19 | 0.00 |
| ATP5S | 0.02 | 0.71 | 0.00 | 0.99 | 0.08 | 0.10 | 0.10 | 0.03 | 0.14 | 0.00 | −0.01 | 0.78 | 0.05 | 0.32 | 0.13 | 0.01 | 0.10 | 0.04 |
Table 4.
Correlation between OCSC markers and lipid transporters and key enzymes in lipid metabolism in TCGA. Red indicates significant positive, and black indicates insignificant p-values of either positive or negative correlations.
Table 4.
Correlation between OCSC markers and lipid transporters and key enzymes in lipid metabolism in TCGA. Red indicates significant positive, and black indicates insignificant p-values of either positive or negative correlations.
| TCGA | CD44 | CD24 | CD117 | CD133 | ALDH1A1 | SOX2 | 4-Oct | NANOG | NOTCH1 | |||||||||
|---|---|---|---|---|---|---|---|---|---|---|---|---|---|---|---|---|---|---|
| Pearson R | p-Value | Pearson R | p-Value | Pearson R | p-Value | Pearson R | p-Value | Pearson R | p-Value | Pearson R | p-Value | Pearson R | p-Value | Pearson R | p-Value | Pearson R | p-Value | |
| FABP4 | 0.04 | 0.43 | −0.04 | 0.44 | 0.05 | 0.28 | −0.07 | 0.13 | 0.05 | 0.33 | −0.04 | 0.43 | 0.00 | 0.87 | −0.06 | 0.21 | 0.07 | 0.13 |
| CD36 | 0.17 | 0.00 | −0.02 | 0.63 | 0.11 | 0.02 | −0.07 | 0.14 | 0.09 | 0.07 | 0.03 | 0.51 | −0.03 | 0.55 | 0.00 | 0.90 | 0.24 | 4e−07 |
| ACLY | 0.21 | 9e−06 | 0.13 | 0.01 | 0.37 | 3.1e−15 | 0.21 | 1.8e−05 | 0.15 | 0.00 | 0.04 | 0.43 | 0.01 | 0.85 | 0.12 | 0.02 | 0.51 | 0.00 |
| ACACA | 0.16 | 0.00 | 0.20 | 3.1e−05 | 0.19 | 0.00 | 0.22 | 4.5e−06 | 0.10 | 0.03 | 0.01 | 0.79 | 0.08 | 0.11 | 0.02 | 0.73 | 0.32 | 6.3e−12 |
| ACACB | 0.10 | 0.04 | 0.00 | 0.99 | 0.27 | 1.7e−08 | 0.11 | 0.02 | 0.13 | 0.01 | 0.03 | 0.58 | 0.10 | 0.04 | 0.12 | 0.02 | 0.40 | 0.00 |
| CPT1A | 0.12 | 0.01 | 0.03 | 0.56 | 0.11 | 0.02 | 0.16 | 0.00 | 0.09 | 0.07 | 0.06 | 0.20 | 0.09 | 0.07 | 0.00 | 0.89 | 0.35 | 7.1e−14 |
| CPT1B | 0.16 | 0.00 | −0.07 | 0.15 | −0.05 | 0.30 | −0.02 | 0.64 | 0.00 | 0.93 | 0.12 | 0.02 | 0.13 | 0.01 | 0.08 | 0.11 | 0.17 | 3e−04 |
| CPT2 | 0.19 | 7.7e−05 | 0.03 | 0.57 | 0.08 | 0.08 | 0.18 | 0.00 | 0.18 | 0.00 | 0.09 | 0.06 | 0.06 | 0.20 | 0.09 | 0.07 | 0.29 | 7.1e−10 |
| FASN | 0.08 | 0.08 | 0.06 | 0.25 | 0.10 | 0.03 | 0.05 | 0.31 | 0.05 | 0.28 | 0.00 | 0.85 | −0.02 | 0.66 | 0.02 | 0.67 | 0.42 | 0.00 |
| SCD1 | 0.27 | 1.3e−08 | 0.06 | 0.20 | 0.11 | 0.02 | 0.08 | 0.10 | 0.08 | 0.12 | 0.11 | 0.03 | −0.05 | 0.28 | −0.02 | 0.67 | 0.27 | 1.5e−08 |
Table 5.
Correlation between OCSC markers and glutamate transporters and key enzymes in glutamate/glutamine metabolism in TCGA. Red indicates significant positive and black indicates insignificant p-values of either positive or negative correlations.
Table 5.
Correlation between OCSC markers and glutamate transporters and key enzymes in glutamate/glutamine metabolism in TCGA. Red indicates significant positive and black indicates insignificant p-values of either positive or negative correlations.
| TCGA | CD44 | CD24 | CD117 | CD133 | ALDH1A1 | SOX2 | 4-Oct | NANOG | NOTCH1 | |||||||||
|---|---|---|---|---|---|---|---|---|---|---|---|---|---|---|---|---|---|---|
| Pearson R | p-Value | Pearson R | p-Value | Pearson R | p-Value | Pearson R | p-Value | Pearson R | p-Value | Pearson R | p-Value | Pearson R | p-Value | Pearson R | p-Value | Pearson R | p-Value | |
| SLC1A1 | 0.32 | 1.2e−11 | 0.10 | 0.05 | 0.04 | 0.39 | 0.20 | 3.9e−05 | 0.12 | 0.01 | 0.15 | 0.00 | 0.18 | 0.00 | −0.04 | 0.40 | 0.09 | 0.06 |
| SLC1A2 | 0.16 | 0.00 | 0.00 | 0.93 | 0.25 | 1e−07 | 0.12 | 0.01 | 0.22 | 4.1e−06 | 0.05 | 0.31 | 0.04 | 0.44 | 0.07 | 0.13 | 0.14 | 0.00 |
| SLC1A3 | 0.20 | 4.6e−05 | 0.08 | 0.12 | 0.09 | 0.08 | 0.18 | 0.00 | −0.04 | 0.47 | 0.08 | 0.11 | 0.20 | 4.8e−05 | −0.01 | 0.82 | 0.15 | 0.00 |
| SLC1A4 | 0.27 | 1.5e−08 | −0.03 | 0.60 | 0.27 | 1.8e−08 | 0.13 | 0.01 | 0.25 | 2.3e−07 | 0.11 | 0.02 | 0.00 | 0.99 | 0.09 | 0.06 | 0.36 | 1.4e−14 |
| SLC1A5 | 0.24 | 3.7e−07 | −0.08 | 0.10 | 0.06 | 0.21 | 0.03 | 0.56 | 0.05 | 0.35 | 0.15 | 0.00 | 0.03 | 0.50 | −0.03 | 0.58 | 0.22 | 7.4e−06 |
| SLC1A6 | −0.02 | 0.64 | 0.02 | 0.76 | 0.03 | 0.53 | 0.02 | 0.69 | 0.00 | 0.96 | 0.01 | 0.78 | −0.04 | 0.38 | 0.06 | 0.21 | 0.04 | 0.40 |
| SLC1A7 | 0.09 | 0.08 | −0.06 | 0.21 | 0.43 | 0.00 | 0.25 | 2.4e−07 | 0.16 | 0.00 | −0.05 | 0.35 | −0.03 | 0.50 | −0.04 | 0.47 | 0.33 | 2e−12 |
| GLS | 0.15 | 0.00 | −0.01 | 0.86 | 0.11 | 0.02 | −0.01 | 0.86 | 0.18 | 0.00 | 0.03 | 0.49 | 0.05 | 0.30 | 0.13 | 0.01 | 0.36 | 2.8e−14 |
| GLUD1 | 0.10 | 0.03 | 0.02 | 0.73 | 0.11 | 0.03 | 0.06 | 0.20 | 0.11 | 0.02 | −0.02 | 0.68 | 0.14 | 0.00 | 0.05 | 0.35 | 0.25 | 2.2e−07 |
| GLUD2 | 0.19 | 7.8e−05 | 0.04 | 0.73 | 0.25 | 2.6e−07 | 0.05 | 0.31 | 0.26 | 4.8e−08 | 0.09 | 0.08 | 0.15 | 0.00 | 0.31 | 9.3e−11 | 0.27 | 1.3e−08 |
© 2020 by the authors. Licensee MDPI, Basel, Switzerland. This article is an open access article distributed under the terms and conditions of the Creative Commons Attribution (CC BY) license (http://creativecommons.org/licenses/by/4.0/).
Share and Cite
MDPI and ACS Style
Ghoneum, A.; Gonzalez, D.; Abdulfattah, A.Y.; Said, N. Metabolic Plasticity in Ovarian Cancer Stem Cells. Cancers 2020, 12, 1267. https://0-doi-org.brum.beds.ac.uk/10.3390/cancers12051267
AMA Style
Ghoneum A, Gonzalez D, Abdulfattah AY, Said N. Metabolic Plasticity in Ovarian Cancer Stem Cells. Cancers. 2020; 12(5):1267. https://0-doi-org.brum.beds.ac.uk/10.3390/cancers12051267
Chicago/Turabian StyleGhoneum, Alia, Daniela Gonzalez, Ammar Yasser Abdulfattah, and Neveen Said. 2020. "Metabolic Plasticity in Ovarian Cancer Stem Cells" Cancers 12, no. 5: 1267. https://0-doi-org.brum.beds.ac.uk/10.3390/cancers12051267
Note that from the first issue of 2016, this journal uses article numbers instead of page numbers. See further details here.