Article

Concurrent TP53 and CDKN2A Gene Aberrations in Newly Diagnosed Mantle Cell Lymphoma Correlate with Chemoresistance and Call for Innovative Upfront Therapy

1
First Department of Internal Medicine-Hematology, General University Hospital and First Faculty of Medicine, Charles University in Prague, 12808 Prague, Czech Republic
2
Institute of Pathological Physiology, First Faculty of Medicine, Charles University in Prague, 12853 Prague, Czech Republic
3
Center of Oncocytogenomics, Institute of Clinical Biochemistry and Laboratory Diagnostics, General University Hospital and First Faculty of Medicine, Charles University in Prague, 12853 Prague, Czech Republic
4
Department of Hemato-Oncology, Faculty of Medicine and Dentistry, Palacky University and University Hospital Olomouc, 77515 Olomouc, Czech Repulbic
5
CLIP, Department of Pediatric Hematology/Oncology, Second Faculty of Medicine and University Hospital in Motol, 15006 Prague, Czech Republic
*
Author to whom correspondence should be addressed.
Submission received: 24 June 2020 / Revised: 24 July 2020 / Accepted: 27 July 2020 / Published: 31 July 2020

Abstract

:
Mantle cell lymphoma (MCL) is a subtype of B-cell lymphoma with a large number of recurrent cytogenetic/molecular aberrations. Approximately 5–10% of patients do not respond to frontline immunochemotherapy. Despite many useful prognostic indexes, a reliable marker of chemoresistance is not available. We evaluated the prognostic impact of seven recurrent gene aberrations including tumor suppressor protein P53 (TP53) and cyclin dependent kinase inhibitor 2A (CDKN2A) in the cohort of 126 newly diagnosed consecutive MCL patients with bone marrow involvement ≥5% using fluorescent in-situ hybridization (FISH) and next-generation sequencing (NGS). In contrast to TP53, no pathologic mutations of CDKN2A were detected by NGS. CDKN2A deletions were found exclusively in the context of other gene aberrations suggesting it represents a later event (after translocation t(11;14) and aberrations of TP53, or ataxia telangiectasia mutated (ATM)). Concurrent deletion of CDKN2A and aberration of TP53 (deletion and/or mutation) represented the most significant predictor of short EFS (median 3 months) and OS (median 10 months). Concurrent aberration of TP53 and CDKN2A is a new, simple, and relevant index of chemoresistance in MCL. Patients with concurrent aberration of TP53 and CDKN2A should be offered innovative anti-lymphoma therapy and upfront consolidation with allogeneic stem cell transplantation.

1. Introduction

Mantle cell lymphoma (MCL) represents a subtype of non-Hodgkin lymphoma with poor prognosis, especially for patients who are resistant to front-line treatment [1,2,3,4,5]. Besides the translocation t(11;14), several recurrent cytogenetic aberrations have been reported [6,7,8,9,10,11,12,13]. Approximately 5–10% of patients with newly diagnosed MCL fail to achieve response to upfront immunochemotherapy regimen. Despite many prognostic markers including MCL international prognostic index (MIPI), proliferation marker Ki-67, deletion or mutation of TP53, deletion of cyclin dependent kinase 2A (CDKN2A), or blastoid morphology, a reliable marker of chemoresistance is not available at diagnosis [14,15,16,17,18].
Based on the so far published data we selected seven candidate genes (TP53, CDKN2A, ataxia teleangiectasia mutated (ATM), B-cell lymphoma 2 (BCL2), oncogene MYC, retinoblastoma protein 1 (RB1) and cyclin-dependent kinase 4 (CDK4)), and analyzed their aberrations using fluorescent in-situ hybridization FISH in 126 consecutive patients with newly diagnosed MCL with bone marrow (BM) involvement ≥5%. In 113 patients with available diagnostic DNA samples, TP53 and CDKN2A mutation status was analyzed by next-generation sequencing (NGS) approach. The analyzed cytogenetic aberrations were correlated with overall response rate and survival (event-free survival—EFS, overall survival—OS).

2. Patients and Methods

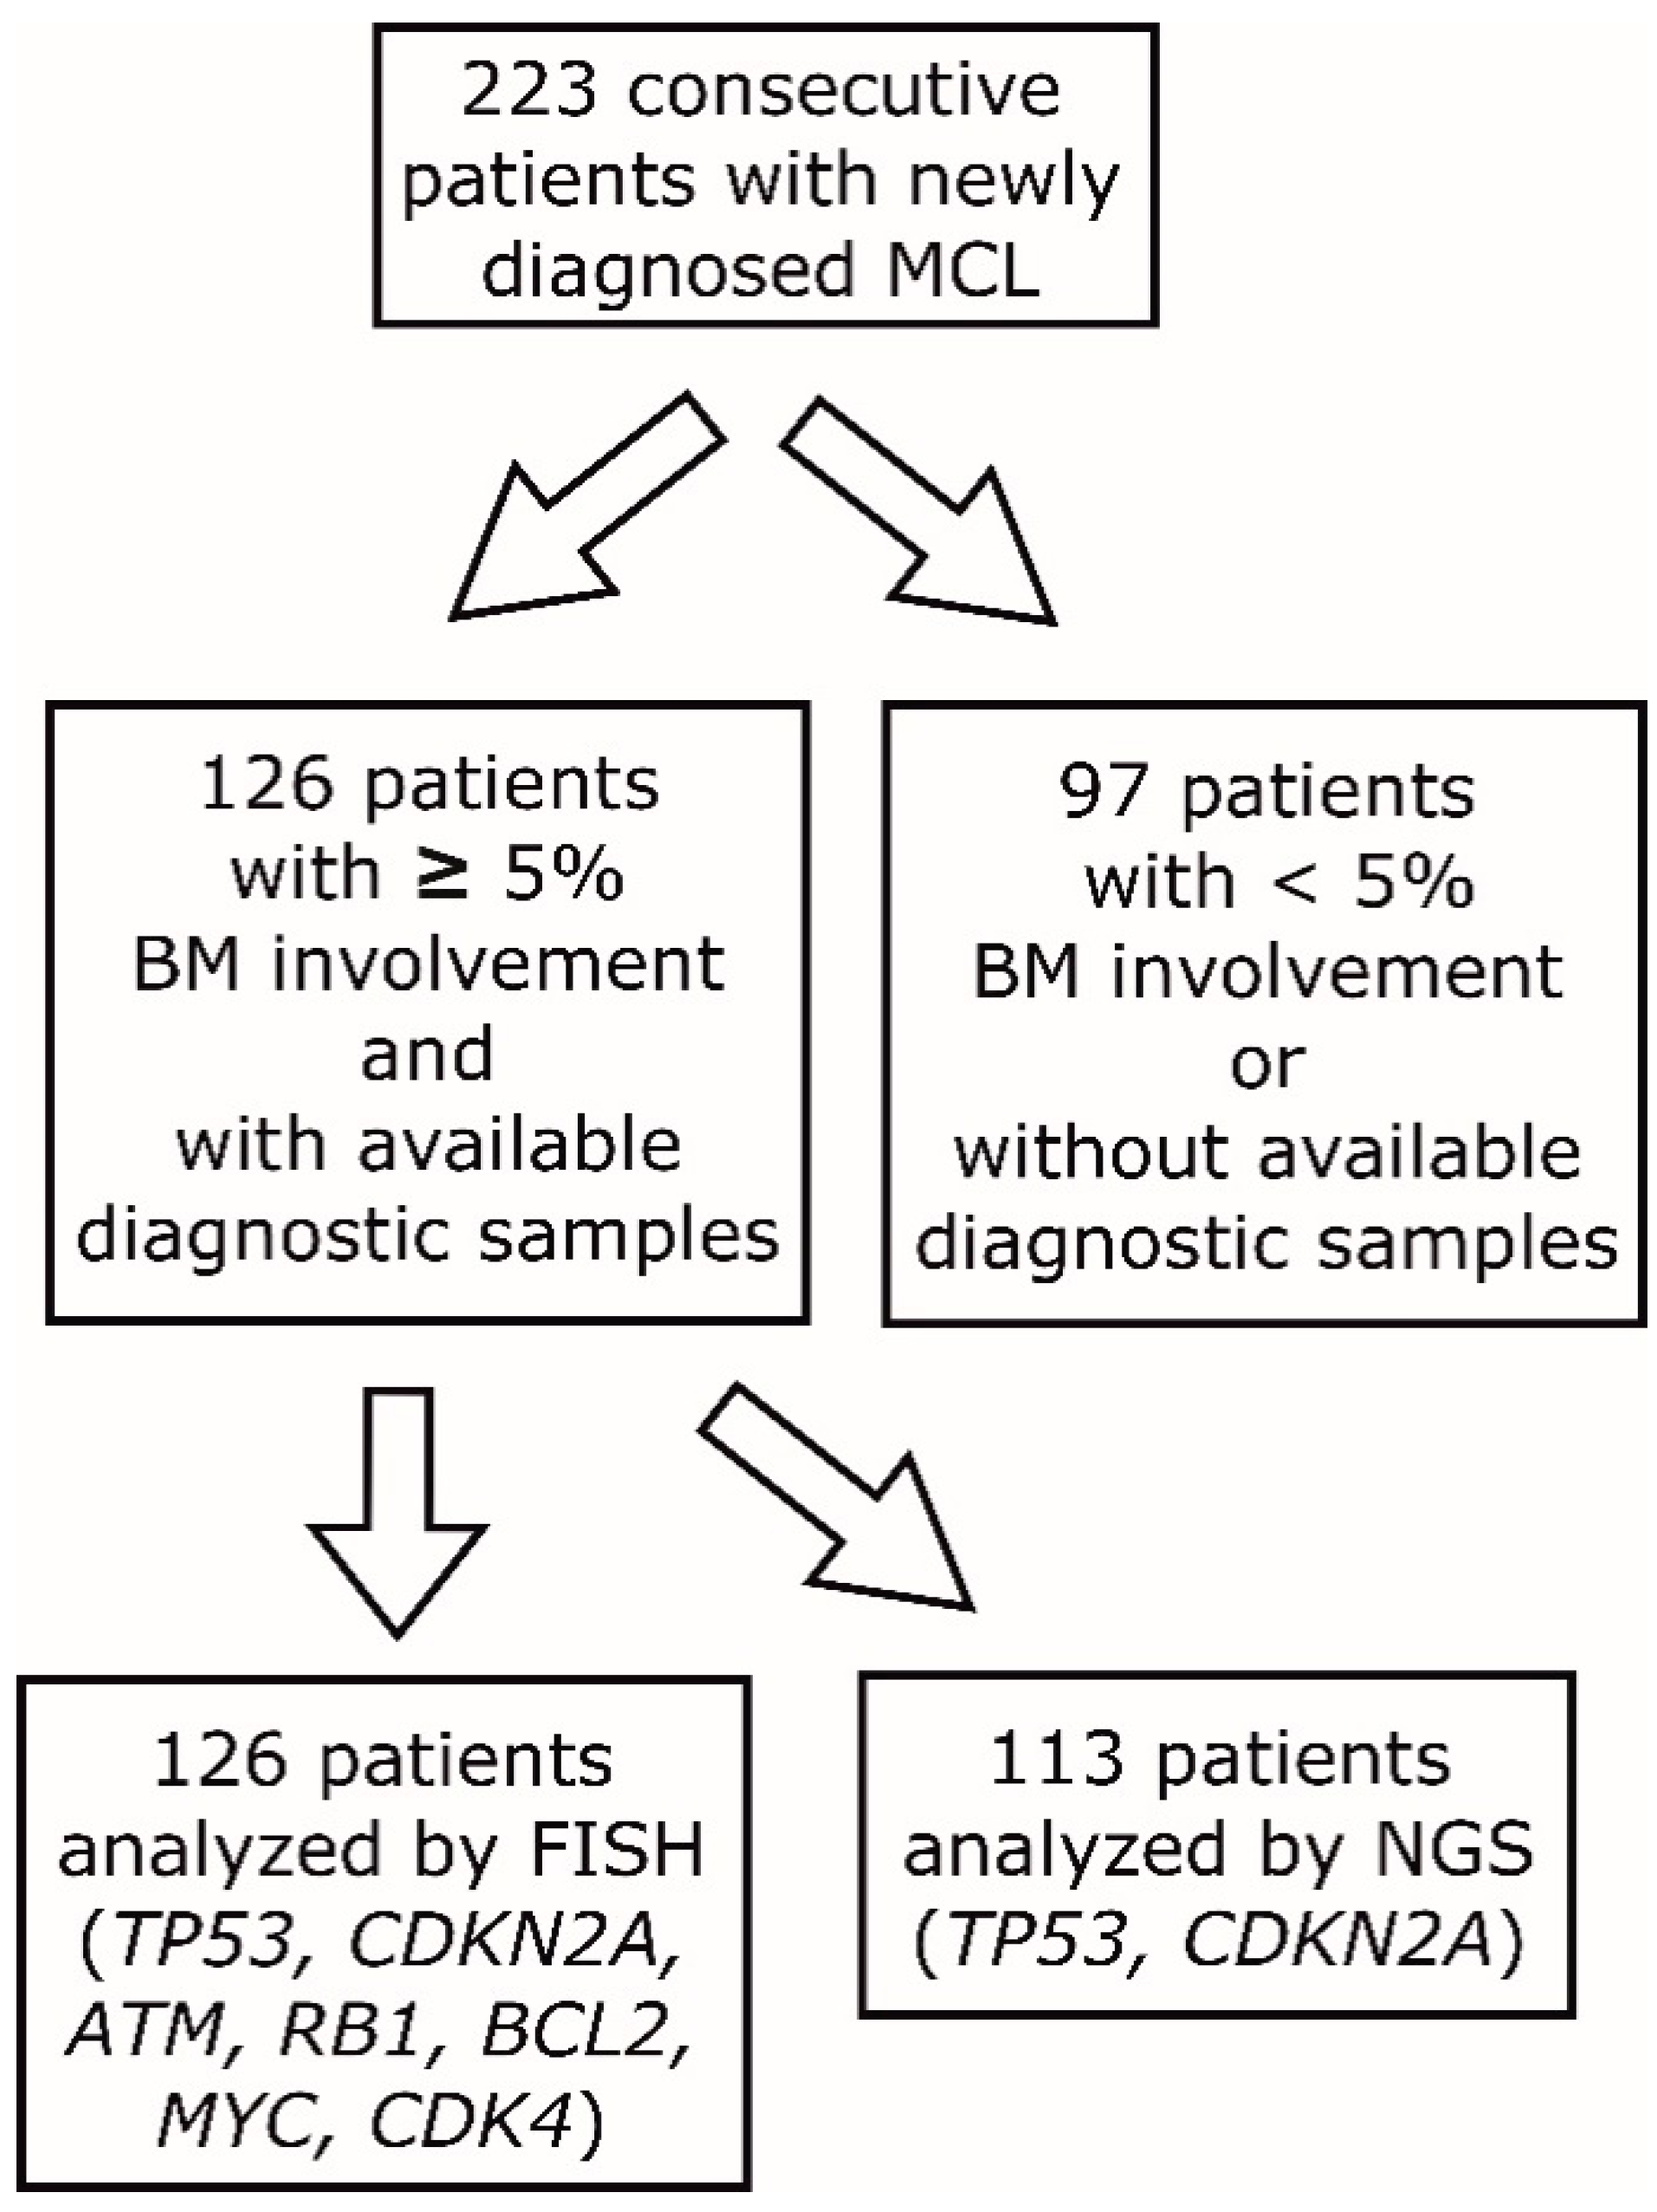
2.1. Patients’ Characteristics

An unselected cohort of 223 patients with newly diagnosed MCL was subject to analysis. Diagnostic samples obtained from 126 newly diagnosed MCL patients with BM infiltration ≥5% were analyzed by fluorescence in situ hybridization (FISH) between 1 January 2009 and 30 June 2018 at the First Department of Internal Medicine-Hematology, General University Hospital and First Faculty of Medicine, Charles University, Prague. The study was approved by University General Hospital Ethics Committee 63/16 from 22 June 2016. From these 126 patients, 113 were subject to mutational analysis of TP53 and CDKN2A genes by next generation sequencing (NGS). In addition, we analyzed baseline characteristics and survival of other 97 patients with newly diagnosed MCL (from the same time period), who were not subject to FISH or NGS analysis due to low BM infiltration (<5%) or lack of material.

2.2. Fluorescence in Situ Hybridization (FISH)

Cytogenetic and FISH analyses were implemented in the Center of Oncocytogenomics, General University Hospital, Charles University in Prague, Czech Republic, accredited according to ISO 15189. Detailed protocols and a list of FISH probes used are available in the Supplementary Materials.

2.3. TP53 and CDKN2A Mutation Assessment by Next-Generation Sequencing (NGS)

NGS was implemented at the University Hospital Olomouc with the regular control of laboratory performance using the internal standards of known mutation load (2% and 5% variant allele frequency-VAF, respectively) in each run and periodic inspection by an external agency. The full coding sequence of the TP53 (exons 2–11 including 2 bp intronic overlap, plus 5′and 3′UTR; NM_000546) and CDKN2A (exons 1–3 including 2 bp intronic overlap, plus 5′and 3′UTR; NM_000077) were analyzed by targeted ultra-deep NGS as reported previously [19,20]. Amplicon-based libraries were sequenced as a paired-end on MiSeq (2 × 151 bp, Illumina, San Diego, CA, USA) with minimum target read depth of 5000x. The detection limit was set up to 1%, and mutations within the range 1–3% were confirmed by replication [20]. All detected variants were manually inspected using the Integrative Genomics Viewer (IGV) and annotated using variant population databases (1000 Genomes, gnomAD, ExAC), clinical mutation databases (ClinVar, COSMIC, IARC TP53 Database) and/or functional prediction tools (SIFT, PolyPhen-2). Only pathogenic or likely pathogenic variants were reported. Polymorphisms were filtered out using variant population databases (1000 Genomes, gnomAD, ExAC). The data can be downloaded as Supplementary Materials from the journal site.

2.4. Statistical Analysis
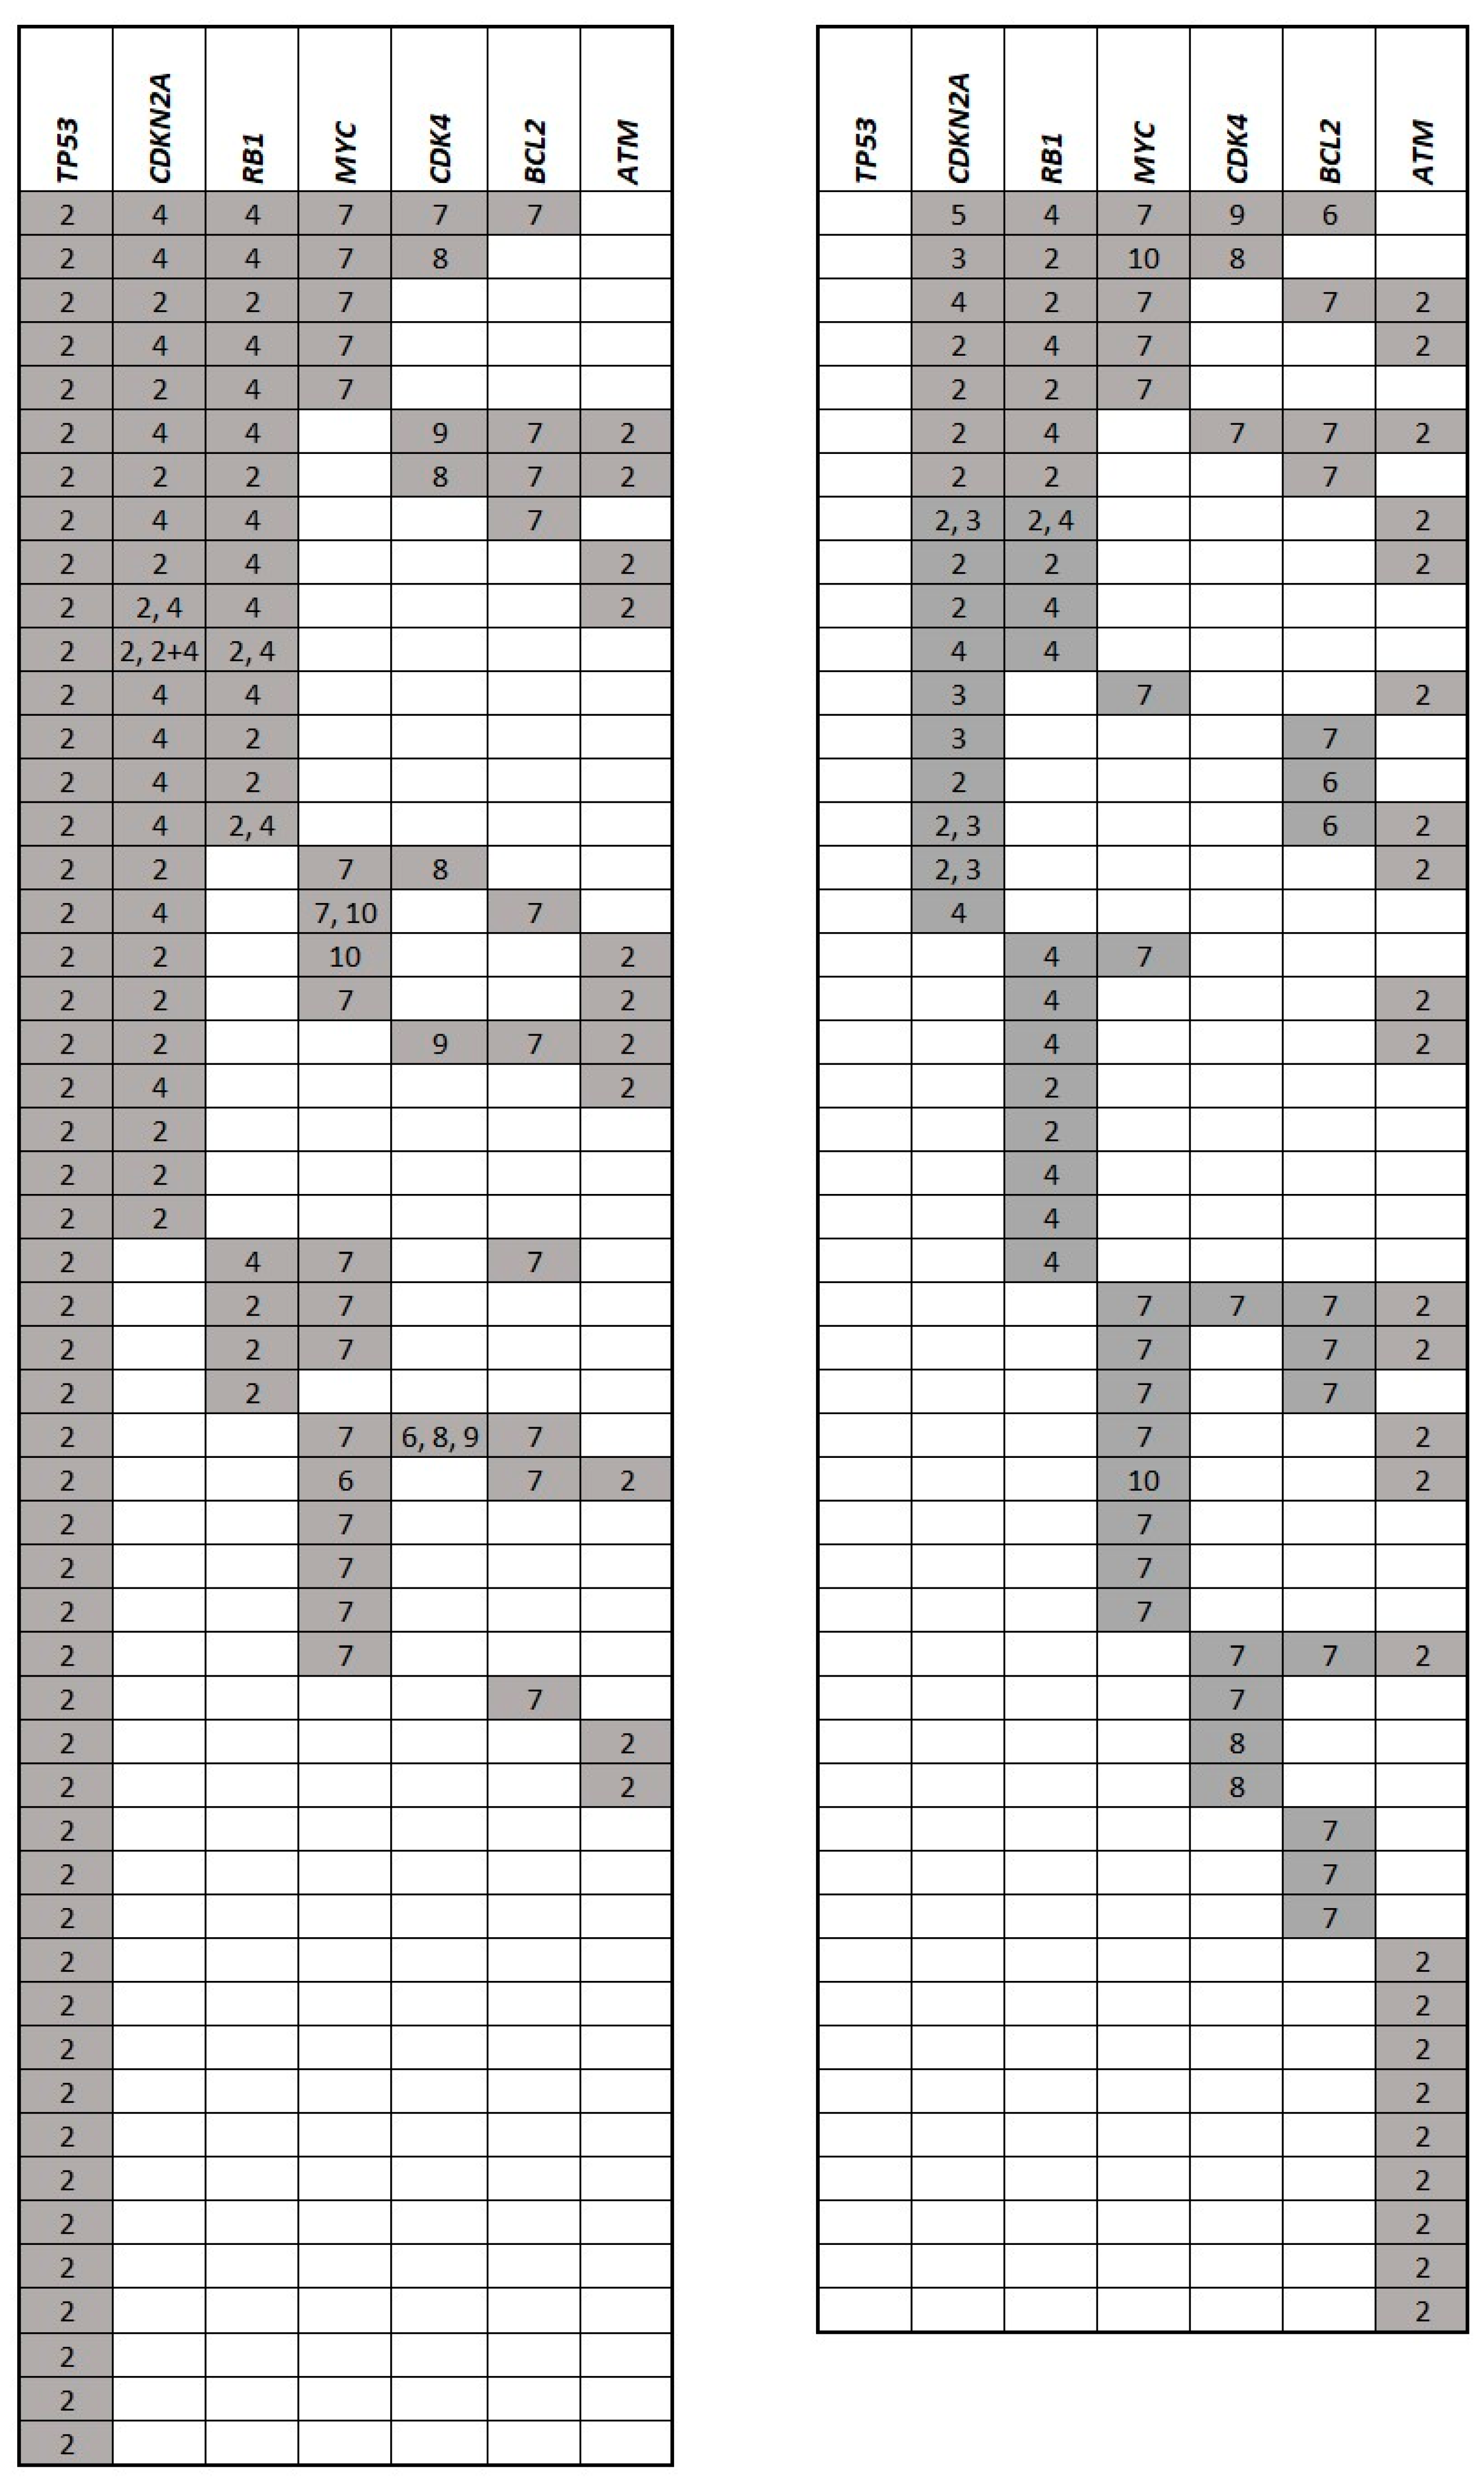
Categorical data were compared by chi-square tests, numerical data with Mann–Whitney U tests. Kaplan–Meier survival analysis was used to estimate EFS and OS, and the statistical significance between survival curves was assessed by a log-rank test. Cox regression multivariate analysis was used to calculate the effect of the variables upon EFS and OS. Data were analyzed using GraphPad Prism version 7.00 for Windows, GraphPad Software, La Jolla, CA, USA, and open-source RStudio, Boston, MA, USA.
We used the Random Forests for Survival, Regression, and Classification R-package to perform all random forests analysis. Variable importance (VIMP) was estimated based on the effect of random permutations on the prediction error. To eliminate the variance of VIMP, all calculations were repeated 100 times and mean values for each VIMP obtained [21].

3. Results

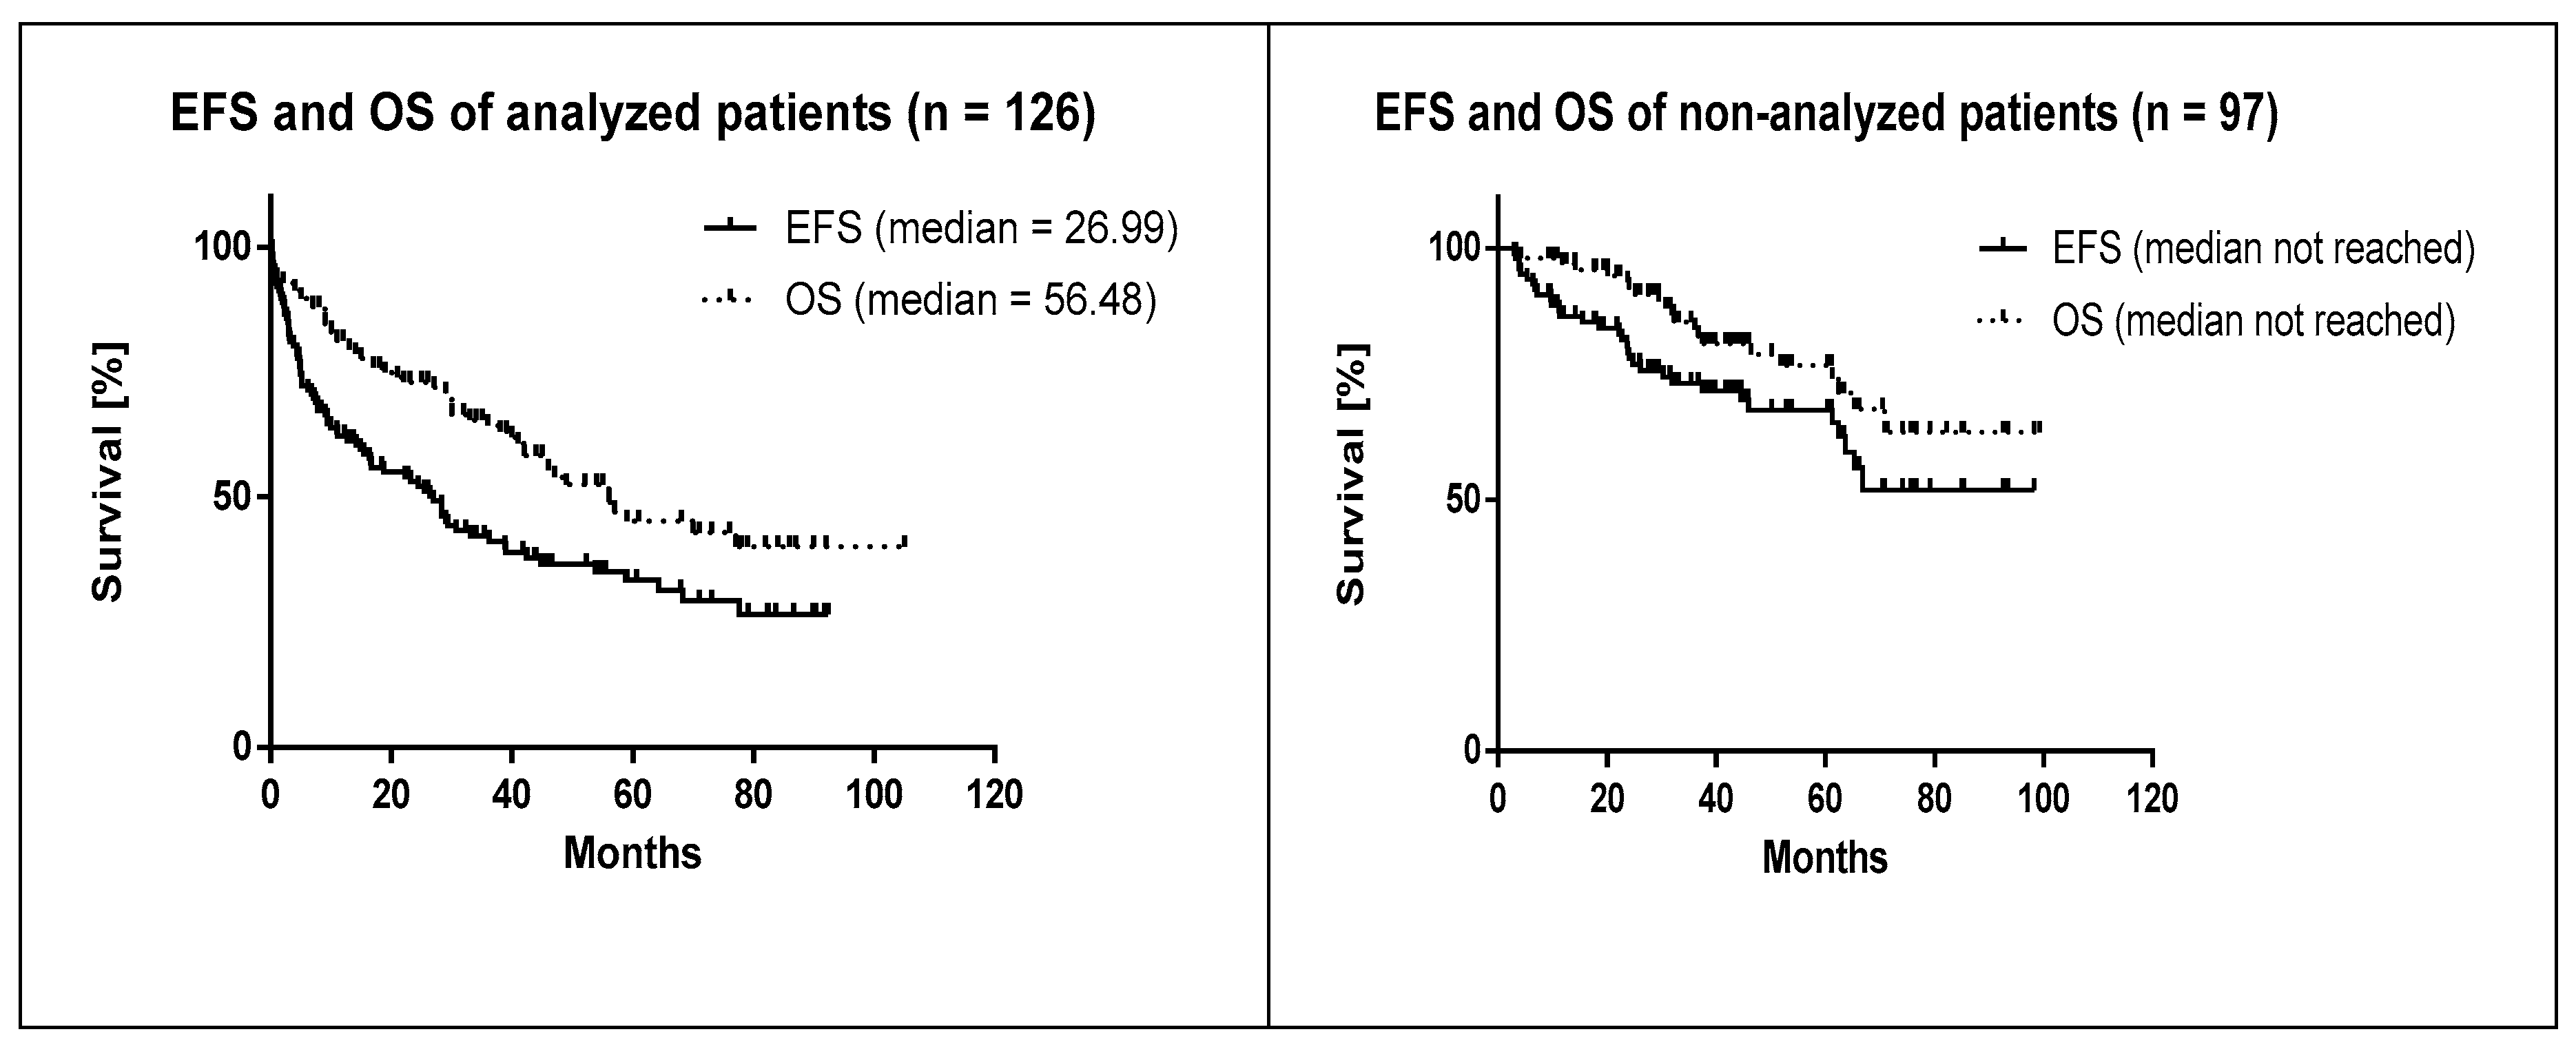
3.1. Baseline Characteristics of the Analyzed Patients

We analyzed prognostic significance of molecular-cytogenetic aberrations of seven genes (TP53, CDKN2A, ATM, BCL2, MYC, RB1, and CDK4) using FISH in 126 consecutive patients with newly diagnosed MCL with BM involvement ≥5% between 1 January 2009 and 30 June 2018 at the Center of Oncocytogenomics, General University Hospital in Prague (Figure 1).
In addition to FISH, mutational analysis of TP53 and CDKN2A genes by NGS was implemented in 113 (87%) patients with available DNA. Baseline characteristics of the analyzed patients are displayed in Table 1.
Because FISH was analyzed only on BM (with infiltration ≥5%) or peripheral blood, but not on formalin-fixed paraffin-embedded tissue sections, the analyzed (FISH) patients (n = 126) represented approx. 57% of all MCL patients (n = 223) diagnosed at the First Dept. of Internal Medicine-Hematology, General University Hospital and First Faculty of Medicine, Charles University, Prague (Figure 1). From the 97 patients (43%) with no available FISH data, 72 patients (74%) had undetectable or low (<5%) infiltration of the BM. Besides that, FISH data were unavailable for 25 patients (26%) (no diagnostic samples available) (Table 1). The applied methodology thus inevitably led to over-representation of high-risk patients according to MIPI in the cohort analyzed by FISH and NGS because patients with <5% infiltration of the BM were not analyzed. Indeed, while 5-year EFS and OS in the analyzed (FISH, NGS) cohort was 33.4 and 44.8%, respectively, 5-year EFS and OS of the non-analyzed cohort was 67.8% and 76.7%. (Figure 2). Median follow-up of the living patients reached 42 and 44 months in the analyzed and non-analyzed cohort, respectively.

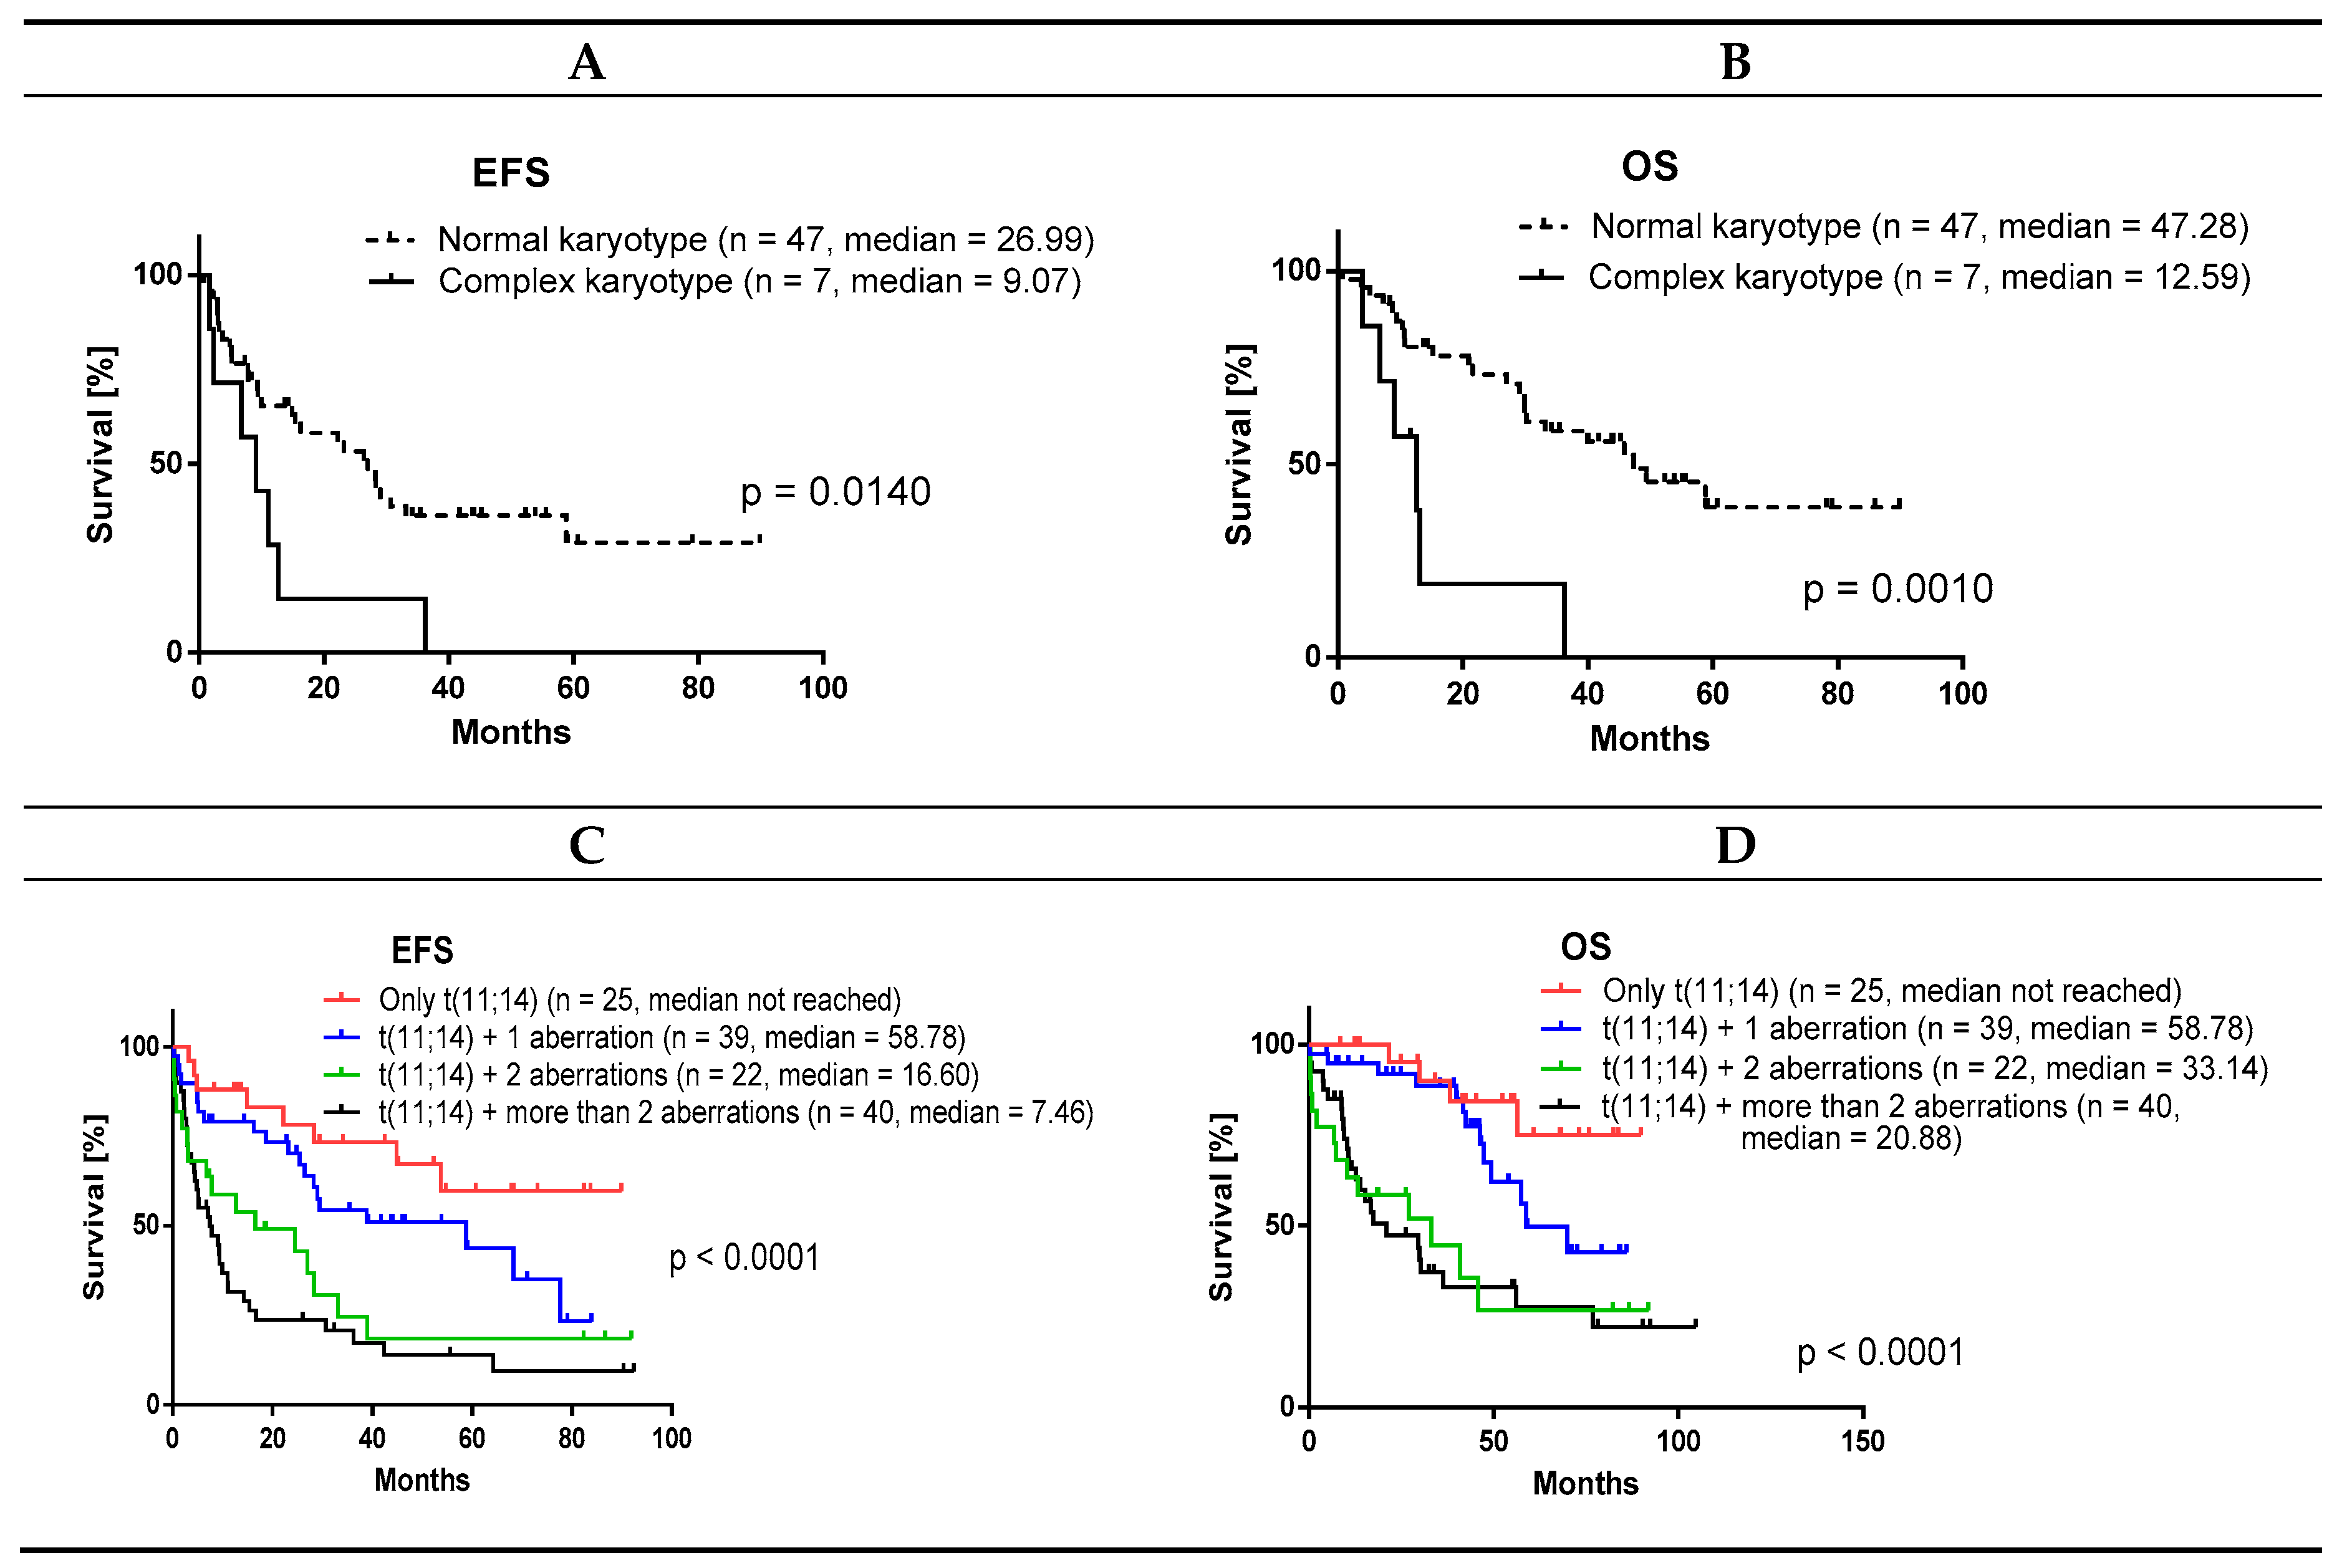
3.2. Correlation of Baseline Clinical and Histopathological Parameters on Survival in the Cohort of 126 Patients with ≥5% BM Involvement

From the analyzed clinical and histopathological factors, the following parameters correlated with EFS and OS in the cohort of 126 patients with ≥5% BM involvement: MIPI (high risk vs. intermediate risk vs. low risk p < 0.0001), Ki-67 (≥30% vs. <30%), B symptoms (present vs. absent), complex karyotype (yes vs. no), type of therapy (intensified vs. R-CHOP-based vs. palliative—for EFS p = 0.0007 and for OS p = 0.0003). Splenomegaly and bulky disease (≥5 cm) correlated with EFS, but not OS (Table S1). Despite the fact that all patients had infiltrated BM, the extent of BM infiltration positively correlated with shorter survival (for EFS, HR = 1.009 for each 1% of increase of BM infiltration, 95% CI = 1.001–1.02, p = 0.0312; for OS, HR = 1.016 for each 1% of increase of BM infiltration, 95% CI = 1.006–1.027, p = 0.002).
Deletion of CDKN2A can be detected almost exclusively in the context of other recurrently found cytogenetic aberrations
Distribution of the analyzed gene aberrations is displayed in Figure 3 and Table S2.
Apart from ATM, all analyzed aberrations correlated with significantly shorter EFS as qualitative variables (i.e., aberration detected versus aberration not detected; Table S1). Except for ATM and MYC, aberrations of the analyzed genes correlated with significantly shorter OS as qualitative variables (Table S1). As few as 25 patients (19.8%) had no detectable gene aberration (apart from the translocation t(11;14)). A single (isolated) gene aberration was observed in 39 patients (31%), and ≥2 aberrations were detected in 62 patients (49.2%). Two, three, four, five, and six aberrations were detected in 22 (17.5%), 16 (12.7%), 16 (12.7%), 5 (4%), and 3 (2.4%) patients, respectively. From 39 patients with an isolated gene aberration, 15 patients had TP53 gene aberration (11.9%), 9 patients had ATM deletion (7.1%), and 5 patients had RB1 deletion (4%). Isolated gene aberrations of BCL2 (n = 3, 2.4%), MYC (n = 3, 2.4%), CDK4 (n = 3, 2.4%), and CDKN2A (n = 1, 0.8%) were rare. In addition, the only patient with isolated CDKN2A deletion had chromosome 9 monosomy (Figure 3, Table S2). A Pearson chi-square test of seven analyzed aberrations revealed that CDKN2A gene deletion correlated with aberrations of TP53, BCL2, RB1, and CDK4, while aberration of BCL2 correlated with CDK4. No other correlations were found among the seven analyzed genes (Table 2).
Distribution of the analyzed aberrations of 101 patients with at least one detected aberration including TP53 mutation (except for the translocation t(11;14)). Each row represents one patient, gray squares represent aberrated genes, numbers represent type of aberration: 2 = monoallelic deletion (in case of TP53 and/or mutation), 3 = bialellic deletion, 4 = monosomy, 5 = nullisomy, 6 = amplification, 7 = gain, 8 = trisomy, 9 = tetrasomy, 10 = MYC rearrangement; more numbers represent different subclones (e.g., 2,3 represent patients, in which both monoallelic and biallelic deletions of CDKN2A were detected).
TP53 mutation and TP53 deletion are both associated with adverse prognosis in MCL, while pathogenic CDKN2A mutations were not detected.
TP53 gene aberration, either mutation, or deletion, was detected in 52 out of 126 patients (41.3%). Thirty-one of the analyzed patients (59.6%) with TP53 aberration had both deletion and mutation of the TP53 gene, while mutation without deletion, and deletion without mutation was detected in 12 (23.1%) and 5 (9.6%) patients. Another four patients (7.7%) had TP53 deletion, but, due to lack of material, mutational analysis was not performed. Because TP53 deletion and mutation significantly correlated with each other with respect to survival parameters (EFS and OS), we used TP53 aberration (defined as TP53 mutation and/or deletion) for all analyses (Tables S3 and S4, Figure S1). In addition to TP53, mutational analysis of CDKN2A gene was implemented by NGS, but no pathological mutations were identified.
A total number of gene aberrations is a strong predictor of outcome.
We confirmed that a complex karyotype significantly correlated with shorter survival (Figure 4A,B). Likewise, a total number of FISH aberrations (including TP53 mutation) also correlated with EFS and OS. Interestingly, the biggest difference was observed between any two of the seven gene aberrations compared to any single (isolated) aberration, while three or more aberrations were not significantly worse predictors than two aberrations (Figure 4C,D). The total number of aberrations positively correlated with the male sex (Mann–Whitney U test p = 0.045).
Concurrent TP53 aberration and CDKN2A deletion predicts chemoresistance.
We asked which of the two analyzed gene aberrations belonged to the most relevant pretreatment markers associated with the worst clinical outcome. First, Cox regression revealed that both TP53 and CDKN2A aberrations independently correlated with shorter EFS and OS, while BCL2 aberration correlated with shorter OS (Table 3). Second, a random forest analysis of the seven gene aberrations analyzed revealed that CDKN2A deletion is the most important predictor of short EFS and OS (Figure S2A,B). Third, random forest analysis of all 21 possible aberration pairs unveiled that concurrent TP53 gene aberration (TP53mut/del) and CDKN2A deletion (CDKN2Adel) was the strongest predictor of short EFS, and together with concurrent CDKN2A and BCL2 aberrations also predictor of short OS. (Figure S2C,D).
Survival parameters of patients with concurrent TP53mut/del and CDKN2Adel are shown in Figure 5.
Subanalysis of patients with concurrent TP53mut/del and CDKN2Adel is given in Table S5. The biggest differences between the patients with concurrent TP53mut/del and CDKN2Adel and the remaining analyzed patients included frequency of CNS involvement (33% vs. 9%), B-symptoms (71% vs. 34%), MIPI (MIPI 3 in 79% vs. 58%) and Ki-67 ≥30% (85% vs. 40% in remaining patients). Only 38% and 17% of patients with concurrent TP53mut/del and CDKN2Adel achieved response and complete response, respectively (compared to 79% and 56% of the patients without concurrent TP53mut/del and CDKN2Adel). At the time of database lock, 96% and 21% of patients with concurrent TP53mut/del and CDKN2Adel had an event and were alive, respectively (compared to 54% and 65% in the remaining analyzed patients).

4. Discussion

As few as 25 patients (19.8%) had no detectable gene aberration (apart from the translocation t(11;14)). This is almost identical finding to that of Dalfau-Larue et al., who reported in their landmark analysis of 135 younger MCL patients from the European MCL Younger trial that only 24 patients (21%) displayed no copy number alteration (CNA) in any analyzed loci [18]. Delfau-Larue et al. analyzed CNA of similar genes to our own selection including TP53, CDKN2A, ATM, RB1, CDK4, and MYC (but not BCL2). Remarkably, the distribution of CNAs of the analyzed genes in the report of Dalfau-Larue was similar to our own data including RB1 deletions (26% compared to 33%), ATM deletions (25% compared to 28%), CDKN2A deletions (25% compared to 33%), TP53 deletions (22% compared to 32% of TP53 gene deletions detected by FISH), MYC aberrations (18% compared to 26%), and CDK4 gains (8% compared to 12%) (Figure 3, Table S2). The overall lower incidence of all analyzed CNAs in the study of Delafau-Larue et al. compared to our own data can be explained by differences in the analyzed cohorts of patients. The significantly higher number of high-risk MIPI patients in our cohort (68%) compared to that of Delfau-Larue (25%) can be explained not only by different median age, but also by the fact that clinical trials usually do not enroll non-fit patients (slow go, no go) with poor performance status or serious comorbidities. In a recently published study by Wang et al., MYC rearrangements, but not MYC CNAs correlated with shorter OS independent of MIPI and Ki-67 [11]. In our study, 4 and 28 patients had MYC rearrangements and CNAs, respectively (one patient harbored both types of aberrations). While MYC aberrations correlated with shorter EFS in univariate analysis, its prognostic significance was lost in multivariate analysis (Table 3). In addition, MYC rearrangements were found exclusively in the context of other analyzed aberrations, suggesting it represents a later event similar to CDKN2A loss.
In the manuscript by Clot et al., 39 nodal MCL patients (62% belonging to high-risk MIPI group- exactly the same number as in our own analyzed cohort) were analyzed for TP53 aberration and CDKN2A deletion (besides other analyzed genes) [17]. Curiously, 36% and 33% of the analyzed patients had TP53 aberration and CDKN2A deletion, respectively (compared to 41% and 33% in our study). In addition, 13% patients had both TP53 aberration and CDKN2A deletion (compared to 19% in our own study). Thus far, published results thus clearly confirm that both TP53 aberrations and CDKN2A deletions are frequent in MCL, and that both are associated with adverse outcome.

4.1. TP53 Deletions and Mutations

Eskelund et al. recently reported that TP53 mutations (detected in 20 patients, 11%) had significantly worse outcomes compared to TP53 deletions (detected in 29 patients, 16%) [16]. In his report, only nine patients (47% patients from the TP53 mutated cases, and 31% patients from the TP53 deleted cases) had both TP53 aberrations. In the study by Obr et al., 50% of patients with TP53 deletions (with available sample for NGS) also had TP53 mutations [19]. In our study, from 126 patients analyzed by FISH (for TP53 deletion), 113 patients were also analyzed by NGS for TP53 mutation. TP53 aberration was observed in 52 patients (41.3% from 126), 40 patients had TP53 deletion (31.7% from 126) and 43 patients had TP53 mutation (38.1% from 113 analyzed by NGS). Thirty-one patients had both TP53 aberrations (77.5% and 72.1% of the patients analyzed by FISH and NGS, respectively). Mutation without deletion of TP53 was detected in 12 out of 43 patients (27.9%) analyzed by NGS. Deletion without mutation of TP53 was detected in 9 out of 40 patients (22.5%) analyzed by FISH, but only in 5 out of 43 (11.6%) patients analyzed also by NGS (Tables S2 and S3). Interestingly, similar results have been reported for chronic lymphocytic leukemia (CLL) patients, where >70% of patients with TP53 deletion also carried a TP53 mutation [23]. Explanation for the observed differences between our data and the study of Eskelund et al. [16] might include different study cohorts (transplant-eligible patients included in clinical trials versus unselected, predominantly elderly patients with BM infiltration), and different methods for detection of TP53 deletions (droplet digital polymerase chain reaction versus conventional FISH). Notably, in the study of Eskelund et al., patients with TP53 mutation without deletion had a higher incidence of concurrent CDKN2A deletion (58%) compared to patients with TP53 deletion without mutation (41%), which might at least partially explain the different prognostic impact of TP53 mutation compared to deletion reported by the Nordic group.

4.2. Survival Analysis

Besides TP53, CDKN2A belongs to established prognostic markers in MCL [18]. CDKN2A deletion was observed in 41 out of 126 patients (32.5%) and represented the second most frequent aberration in the analyzed cohort. The data suggest that CDKN2A deletions represent late events in MCL because virtually all CDKN2A gene deletions were detected in the context of other genetic aberrations (Figure 3). Pearson’s analysis confirmed that CDKN2A correlated with incidence of all analyzed gene aberrations except for ATM deletion. In addition, CDKN2A deletions also correlated with male sex, MIPI, proliferation index by Ki-67, B-symptoms, CNS disease, and complex karyotype. The higher incidence of analyzed aberrations (especially CDKN2A and RB1 deletions) observed in men might at least partially explain their worse outcome compared to women.

4.3. Concurrent Aberration of TP53 and Deletion of CDKN2A Is Associated with Chemoresistance

Concurrent CDKN2A deletion and TP53 aberration were associated with chemoresistance to currently used upfront immunochemotherapy. We thus confirmed the findings of Delfau-Larue et al. on a real-life cohort of predominantly elderly MCL patients (median age 68 compared to 56 years) with significantly higher proportion of high-risk MIPI (62% compared to 25%). Subanalysis of these patients is given in Table S5. Recently, Streich et al. reported that MCL with blastoid and pleomorphic morphology frequently harbor both TP53 and CDKN2A/B aberrations, and that these cases are characterized by frequent chromothripsis [24]. Curiously, in sharp contrast to MCL, aberrations of TP53 and CDKN2A were mutually exclusive in Burkitt lymphoma and were very rarely observed in diffuse large B cell lymphoma [25,26,27]. In indolent lymphoproliferative malignancies, namely CLL and follicular lymphoma, deletions of CDKN2A are rare, and CDKN2A inactivation frequently correlates with the transformation to an aggressive lymphoma with adverse prognosis [28,29,30,31]. From this perspective, MCL patients with concurrent TP53mut/del and CDKN2Adel might be regarded as patients with “transformed” MCL and consequently with similarly adverse prognosis. Only three younger patients with concurrent TP53mut/del and CDKN2Adel were successfully treated with salvage therapy and allogeneic stem cell transplantation (allo-SCT).

5. Conclusions

The molecular/cytogenetic index TP53del/mut and CDKN2Adel represents a novel, simple, and reliable pretreatment prognostic factor that identifies patients who do not profit from currently used therapies based on immunochemotherapy. Importantly, the combination of both aberrations represents a significantly more relevant prognostic marker of poor outcome compared to the isolated aberration of either gene. Patients with concurrent TP53mut/del and CDKN2Adel might profit from innovative treatments, e.g., Bruton’s tyrosine kinase inhibitors, ideally in combination with other anti-lymphoma drugs (e.g., BH3-mimetics), and from upfront consolidation with allogeneic stem cell transplantation.

Supplementary Materials

The following are available online at https://0-www-mdpi-com.brum.beds.ac.uk/2072-6694/12/8/2120/s1, Supplementary Methods: Fluorescence in situ hybridization (FISH); Table S1: Univariate analysis: correlation of analyzed gene aberrations and selected clinical and laboratory parameters with survival; Table S2: Distribution of the analyzed gene aberrations; Table S3: TP53 mutation types and positions; Table S4: Univariate analysis of TP53 mutation and TP53 deletion; Table S5: Baseline characteristics and response to therapy of the patients with concurrent aberration of TP53 and CDKN2A (compared to remaining patients); Figure S1: Survival parameters in the TP53 mutation and TP53 deletion cohorts; Figure S2: Random Forest analysis of analyzed aberrations.

Author Contributions

Conceptualization, P.K., M.T., Z.Z., E.K.; methodology, M.S., P.B.; software, M.S., P.B.; validation, P.K., M.T.; formal analysis, D.M., P.B., M.S.; investigation, D.M., A.B., E.P., K.F., L.P., A.P.; resources, P.K., E.K., M.T., Z.Z.; data curation, D.M., A.B., E.K., Z.Z.; writing—original draft preparation, P.K., D.M.; writing—review and editing, P.K., M.T., A.O., E.K., Z.Z.; visualization, D.M.; supervision, P.K.; project administration, P.K.; funding acquisition, P.K., M.T., A.O., E.K., Z.Z. All authors have read and agreed to the published version of the manuscript.

Funding

P.K. was supported by Ministry of Health of the Czech Republic grant AZV 17-28980A, all rights reserved, Grant Agency of the Czech Republic GA20-25308S, Charles University Center of Excellence UNCE/MED/016 and Ministry of Education, Youth and Sports grants PROGRES Q26/LF1 and PROGRES Q28/LF1; Z.Z., E.P. and L.P. was supported by RVO-VFN64165; A.O., E.K. and A.P. were supported by MH CZ—DRO (FNOl, 00098892) and IGA_LF_2020_002, IGA_LF_2020_016.

Conflicts of Interest

The authors declare no competing financial interest.

References

  1. Klener, P. Advances in Molecular Biology and Targeted Therapy of Mantle Cell Lymphoma. Int. J. Mol. Sci. 2019, 20, 4417. [Google Scholar] [CrossRef] [PubMed] [Green Version]
  2. Cheah, C.Y.; Seymour, J.F.; Wang, M.L. Mantle Cell Lymphoma. J. Clin. Oncol. 2016, 34, 1256–1269. [Google Scholar] [CrossRef] [PubMed]
  3. Jain, P.; Wang, M. Mantle cell lymphoma: 2019 update on the diagnosis, pathogenesis, prognostication, and management. Am. J. Hematol. 2019, 94, 710–725. [Google Scholar] [CrossRef] [PubMed] [Green Version]
  4. Maddocks, K. Update on mantle cell lymphoma. Blood 2018, 132, 1647–1656. [Google Scholar] [CrossRef] [PubMed]
  5. Rule, S. The modern approach to mantle cell lymphoma. Hematol. Oncol. 2019, 37, 66–69. [Google Scholar] [CrossRef] [PubMed] [Green Version]
  6. Zhang, J.; Jima, D.; Moffitt, A.B.; Liu, Q.; Czader, M.; Hsi, E.D.; Fedoriw, Y.; Dunphy, C.H.; Richards, K.L.; Gill, J.I.; et al. The genomic landscape of mantle cell lymphoma is related to the epigenetically determined chromatin state of normal B cells. Blood J. Am. Soc. Hematol. 2014, 123, 2988–2996. [Google Scholar] [CrossRef]
  7. Bea, S.; Valdes-Mas, R.; Navarro, A.; Salaverria, I.; Martín-Garcia, D.; Jares, P.; Giné, E.; Pinyol, M.; Royo, C.; Nadeu, F.; et al. Landscape of somatic mutations and clonal evolution in mantle cell lymphoma. Proc. Natl. Acad. Sci. USA 2013, 110, 18250–18255. [Google Scholar] [CrossRef] [Green Version]
  8. Yang, P.; Zhang, W.; Wang, J.; Liu, Y.; An, R.; Jing, H. Genomic landscape and prognostic analysis of mantle cell lymphoma. Cancer Gene Ther. 2018, 25, 129–140. [Google Scholar] [CrossRef]
  9. Ahmed, M.; Zhang, L.; Nomie, K.; Lam, L.; Wang, M. Gene mutations and actionable genetic lesions in mantle cell lymphoma. Oncotarget 2016, 7, 58638–58648. [Google Scholar] [CrossRef] [Green Version]
  10. Kridel, R.; Meissner, B.; Rogic, S.; Boyle, M.; Telenius, A.; Woolcock, B.; Gunawardana, J.; Jenkins, C.; Cochrane, C.; Ben-Neriah, S.; et al. Whole transcriptome sequencing reveals recurrent NOTCH1 mutations in mantle cell lymphoma. Blood 2012, 119, 1963–1971. [Google Scholar] [CrossRef]
  11. Wang, L.; Tang, G.; Medeiros, L.J.; Xu, J.; Huang, W.; Yin, C.C.; Wang, M.; Jain, P.; Lin, P.; Li, S. MYC rearrangement but not extra MYC copies is an independent prognostic factor in patients with mantle cell lymphoma. Haematologica 2020, 105. [Google Scholar] [CrossRef] [PubMed] [Green Version]
  12. Ferrero, S.; Rossi, D.; Rinaldi, A.; Bruscaggin, A.; Spina, V.; Eskelund, C.W.; Evangelista, A.; Moia, R.; Kwee, I.; Dahl, C. KMT2D mutations and TP53 disruptions are poor prognostic biomarkers in mantle cell lymphoma receiving high-dose therapy: A FIL study. Haematologica 2020, 105, 1604–1612. [Google Scholar] [CrossRef] [PubMed] [Green Version]
  13. Hill, H.A.; Qi, X.; Jain, P.; Nomie, K.; Wang, Y.; Zhou, S.; Wang, M.L. Genetic mutations and features of mantle cell lymphoma: A systematic review and meta-analysis. Blood Adv. 2020, 4, 2927–2938. [Google Scholar] [CrossRef] [PubMed]
  14. Hoster, E.; Dreyling, M.; Klapper, W.; Gisselbrecht, C.; Van Hoof, A.; Kluin-Nelemans, H.C.; Pfreundschuh, M.; Reiser, M.; Metzner, B.; Einsele, H.; et al. A new prognostic index (MIPI) for patients with advanced-stage mantle cell lymphoma. Blood 2008, 111, 558–565. [Google Scholar] [CrossRef]
  15. Hoster, E.; Rosenwald, A.; Berger, F.; Bernd, H.W.; Hartmann, S.; Loddenkemper, C.; Barth, T.F.; Brousse, N.; Pileri, S.; Rymkiewicz, G.; et al. Prognostic Value of Ki-67 Index, Cytology, and Growth Pattern in Mantle-Cell Lymphoma: Results from Randomized Trials of the European Mantle Cell Lymphoma Network. J. Clin. Oncol. 2016, 34, 1386–1394. [Google Scholar] [CrossRef]
  16. Eskelund, C.W.; Dahl, C.; Hansen, J.W.; Westman, M.; Kolstad, A.; Pedersen, L.B.; Montano-Almendras, C.P.; Husby, S.; Freiburghaus, C.; Ek, S.; et al. TP53 mutations identify younger mantle cell lymphoma patients who do not benefit from intensive chemoimmunotherapy. Blood J. Am. Soc. Hematol. 2017, 130, 1903–1910. [Google Scholar] [CrossRef] [Green Version]
  17. Clot, G.; Jares, P.; Gine, E.; Navarro, A.; Royo, C.; Pinyol, M.; Martín-Garcia, D.; Demajo, S.; Espinet, B.; Salar, A.; et al. A gene signature that distinguishes conventional and leukemic nonnodal mantle cell lymphoma helps predict outcome. Blood 2018, 132, 413–422. [Google Scholar] [CrossRef] [Green Version]
  18. Delfau-Larue, M.H.; Klapper, W.; Berger, F.; Jardin, F.; Briere, J.; Salles, G.; Casasnovas, O.; Feugier, P.; Haioun, C.; Ribrag, V.; et al. High-Dose cytarabine does not overcome the adverse prognostic value of CDKN2A and TP53 deletions in mantle cell lymphoma. Blood J. Am. Soc. Hematol. 2015, 126, 604–611. [Google Scholar] [CrossRef] [Green Version]
  19. Obr, A.; Prochazka, V.; Jirkuvova, A.; Urbánková, H.; Kriegova, E.; Schneiderová, P.; Vatolíková, M.; Papajík, T. TP53 Mutation and Complex Karyotype Portends a Dismal Prognosis in Patients with Mantle Cell Lymphoma. Clin. Lymphoma Myeloma Leuk. 2018, 18, 762–768. [Google Scholar] [CrossRef]
  20. Petrackova, A.; Vasinek, M.; Sedlarikova, L.; Dyskova, T.; Schneiderova, P.; Novosad, T.; Papajik, T.; Kriegova, E. Standardization of Sequencing Coverage Depth in NGS: Recommendation for Detection of Clonal and Subclonal Mutations in Cancer Diagnostics. Front. Oncol. 2019, 9, 851. [Google Scholar] [CrossRef]
  21. Ishwaran, H.; Lu, M. Standard errors and confidence intervals for variable importance in random forest regression, classification, and survival. Stat. Med. 2019, 38, 558–582. [Google Scholar] [CrossRef] [PubMed]
  22. Cheson, B.D.; Horning, S.J.; Coiffier, B.; Shipp, M.A.; Fisher, R.I.; Connors, J.M.; Lister, T.A.; Vose, J.; Grillo-López, A.; Hagenbeek, A.; et al. Report of an international workshop to standardize response criteria for non-Hodgkin’s lymphomas. NCI Sponsored International Working Group. J. Clin. Oncol. 1999, 17, 1244. [Google Scholar] [CrossRef] [PubMed]
  23. Zenz, T.; Krober, A.; Scherer, K.; Häbe, S.; Bühler, A.; Benner, A.; Denzel, T.; Winkler, D.; Edelmann, J.; Schwänen, C.; et al. Monoallelic TP53 inactivation is associated with poor prognosis in chronic lymphocytic leukemia: Results from a detailed genetic characterization with long-term follow-up. Blood J. Am. Soc. Hematol. 2008, 112, 3322–3329. [Google Scholar] [CrossRef] [PubMed]
  24. Streich, L.; Sukhanova, M.; Lu, X.; Chen, Y.H.; Venkataraman, G.; Mathews, S.; Zhang, S.; Kelemen, K.; Segal, J.; Gao, J.; et al. Aggressive morphologic variants of mantle cell lymphoma characterized with high genomic instability showing frequent chromothripsis, CDKN2A/B loss, and TP53 mutations: A multi-institutional study. Genes Chromosomes Cancer 2020, 59, 484–494. [Google Scholar] [CrossRef] [PubMed]
  25. Sanchez-Beato, M.; Saez, A.I.; Navas, I.C.; Algara, P.; Mateo, M.S.; Villuendas, R.; Camacho, F.; Sánchez-Aguilera, A.; Sánchez, E.; Piris, M.A. Overall survival in aggressive B-Cell lymphomas is dependent on the accumulation of alterations in p53, p16, and p27. Am. J. Pathol. 2001, 159, 205–213. [Google Scholar] [CrossRef] [Green Version]
  26. Lopez, C.; Kleinheinz, K.; Aukema, S.M.; Rohde, M.; Bernhart, S.H.; Hübschmann, D.; Wagener, R.; Toprak, U.H.; Raimondi, F.; Kreuz, M.; et al. Genomic and transcriptomic changes complement each other in the pathogenesis of sporadic Burkitt lymphoma. Nat. Commun. 2019, 10, 1459. [Google Scholar] [CrossRef] [Green Version]
  27. Bolen, C.R.; Klanova, M.; Trneny, M.; Sehn, L.H.; He, J.; Tong, J.; Paulson, J.N.; Kim, E.; Vitolo, U.; Di Rocco, A.; et al. Prognostic impact of somatic mutations in diffuse large B-Cell lymphoma and relationship to cell-of-origin: Data from the phase III GOYA study. Haematologica 2019, 105, 227892. [Google Scholar] [CrossRef] [Green Version]
  28. Rossi, D.; Spina, V.; Gaidano, G. Biology and treatment of Richter syndrome. Blood 2018, 131, 2761–2772. [Google Scholar] [CrossRef] [Green Version]
  29. Chigrinova, E.; Rinaldi, A.; Kwee, I.; Rossi, D.; Rancoita, P.M.; Strefford, J.C.; Oscier, D.; Stamatopoulos, K.; Papadaki, T.; Berger, F.; et al. Two main genetic pathways lead to the transformation of chronic lymphocytic leukemia to Richter syndrome. Blood J. Am. Soc. Hematol. 2013, 122, 2673–2682. [Google Scholar] [CrossRef] [Green Version]
  30. Kwiecinska, A.; Ichimura, K.; Berglund, M.; Dinets, A.; Sulaiman, L.; Collins, V.P.; Larsson, C.; Porwit, A.; Lagercrantz, S.B. Amplification of 2p as a genomic marker for transformation in lymphoma. Genes Chromosomes Cancer 2014, 53, 750–768. [Google Scholar] [CrossRef] [Green Version]
  31. Pasqualucci, L.; Khiabanian, H.; Fangazio, M.; Vasishtha, M.; Messina, M.; Holmes, A.B.; Ouillette, P.; Trifonov, V.; Rossi, D.; Tabbò, F.; et al. Genetics of follicular lymphoma transformation. Cell Rep. 2014, 6, 130–140. [Google Scholar] [CrossRef] [PubMed] [Green Version]
Figure 1. Flow chart of patient analysis. BM = bone marrow, FISH = fluorescent in-situ hybridization, NGS = next-generation sequencing.
Cancers 12 02120 g001
Figure 2. Survival in patients with bone marrow involvement ≥5% compared to patients without available diagnostic samples. EFS = event-free survival, OS = overall survival.
Cancers 12 02120 g002
Figure 3. Distribution of the analyzed aberrations of 101 patients with at least one detected aberration including TP53 mutation except for the translocation t(11;14). Each row represents one patient, gray squares represent aberrated genes, numbers represent type of aberration: 2 = monoallelic deletion (in case of TP53 and/or mutation), 3 = bialellic deletion, 4 = monosomy, 5 = nullisomy, 6 = amplification, 7 = gain, 8 = trisomy, 9 = tetrasomy, 10 = MYC rearrangement.
Cancers 12 02120 g003
Figure 4. Complex karyotype and total number of gene aberrations correlates with shorter survival. (A,C) EFS; (B,D) OS. EFS = event-free survival; OS = overall survival.
Cancers 12 02120 g004
Figure 5. Patients with concurrent TP53 and CDKN2A aberrations have significantly shorter survival than isolated aberrations. Patients in groups TP53 and CDKN2A are patients with TP53 aberrations or CDKN2A deletions that are not contained in the TP53+CDKN2A subcohort. (A) EFS, (B) OS. EFS = event-free survival, OS = overall survival.
Cancers 12 02120 g005
Table 1. Baseline characteristics and response to therapy of the analyzed and non-analyzed patients.
Cohort126 Patients with Bone Marrow Involvement ≥5%97 Patients with No Available Diagnostic Samples
Numbers (N) or percentages (%)N%N%
All patients126579743
M88707375
F38302425
Age (median; years)6866
Age (range; years)29–8240–87
<65 years47374445
≥65 years79635355
Stage I–II0077
Stage III001313
Stage IV1261007779
Ki-67 ≥ 30% *36473848
MIPI 119152526
MIPI 229233435
MIPI 378623839
B-symptoms52413233
BM infiltration1261007375
BM infiltration ≥5%1261002526
Nodal involvement108868891
Splenomegaly89714647
Extra-hematological involvement50404748
Bulky disease (≥5 cm)45362728
CNS involvement **171377
Intensified therapy37295052
R-CHOP-like therapy71563839
Palliative therapy8677
Watch and wait7611
Died before initiation of therapy3200
Died during induction9700
ORR (CR/PR)90719295
CR61487375
PR29231920
SD4333
PD151200
Event78623233
Relapse48381819
Death **55442122
M = male; F = female; MIPI = MCL international prognostic index; BM = bone marrow; CNS = central nervous system; ORR = overall response rate; CR = complete remission; PR = partial remission; SD = stable disease; PD = progressive disease; R-CHOP = R(ituximab + C(yclopohosphamide) + H(ydroxydaunomycin) + O(ncovin) + P(rednisone); response was assessed by international workshop criteria published by Cheson et al. in 1999 [22]. * of the analyzed samples, ** anytime from diagnosis until database lock; differences >20% between cohorts are highlighted in gray.
Table 2. Correlation between the analyzed gene aberrations.
CDK4RB1BCL2ATMTP53CDKN2AMYC
CDK410.138<0.0010.2600.6510.0160.055
RB1 10.3840.8470.191<0.0010.074
BCL2 10.0910.9650.0120.055
ATM 10.1640.050.706
TP53 10.0060.071
CDKN2A 10.065
MYC 1
The table shows p-values of Pearson’s chi-squared test. Statistically significant results are underlined and printed in bold fonts.
Table 3. Effect of the analyzed gene aberrations with survival parameters: multivariate analysis. (A) Event-Free Survival; (B) Overall Survival.
A. Event-Free SurvivalB. Overall Survival
GeneHR95% CIpGeneHR95% CIp
CDK41.60.8–3.10.218CDK41.70.8–3.70.205
RB10.90.5–1.60.803RB11.20.6–2.20.645
BCL21.50.8–2.50.287BCL22.61.4–4.80.004
ATM1.10.7–1.90.667ATM1.00.6–2.00.921
TP532.31.4–3.60.001TP532.21.2–3.80.008
CDKN2A2.61.5–4.70.001CDKN2A2.51.2–4.90.011
MYC1.61.0–2.60.06MYC1.20.7–2.20.507
Tables show Cox’s proportional hazard model; HR = hazard ratio, CI = confidence interval p = p-value; statistically significant results are highlighted in gray.

