RNA Sequencing of Hepatobiliary Cancer Cell Lines: Data and Applications to Mutational and Transcriptomic Profiling

 , , , , and
Abstract
:Simple Summary
Abstract

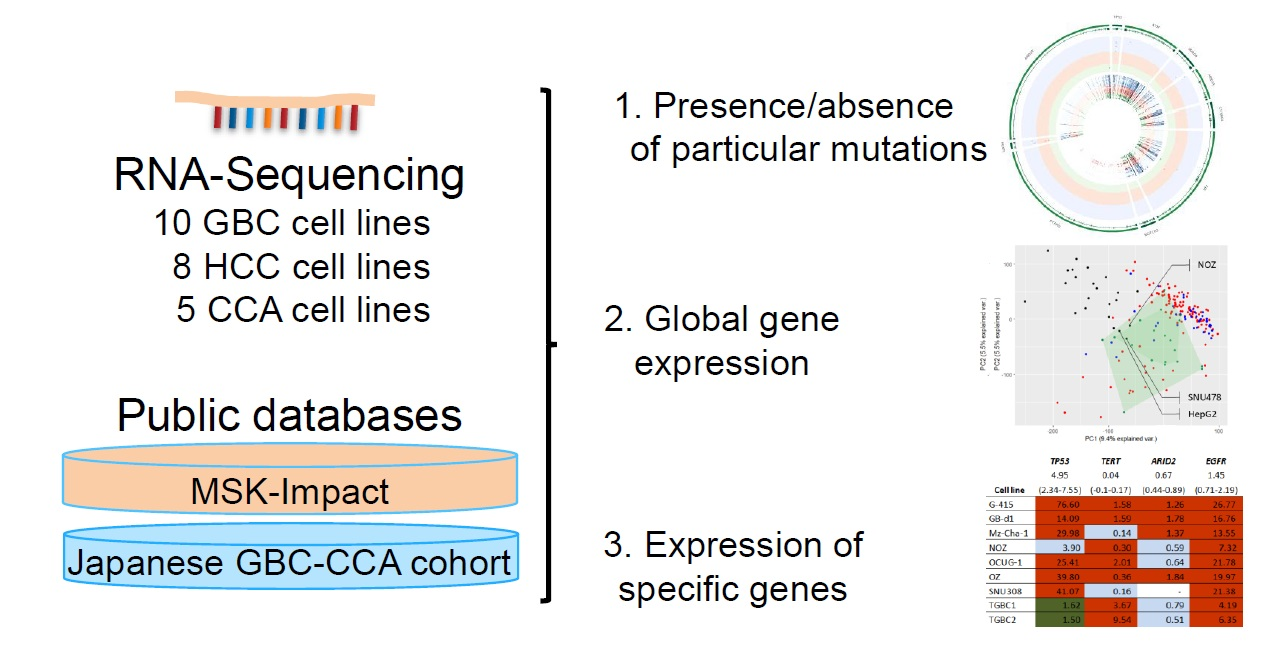
1. Introduction
2. Results
2.1. General Sequencing Statistics
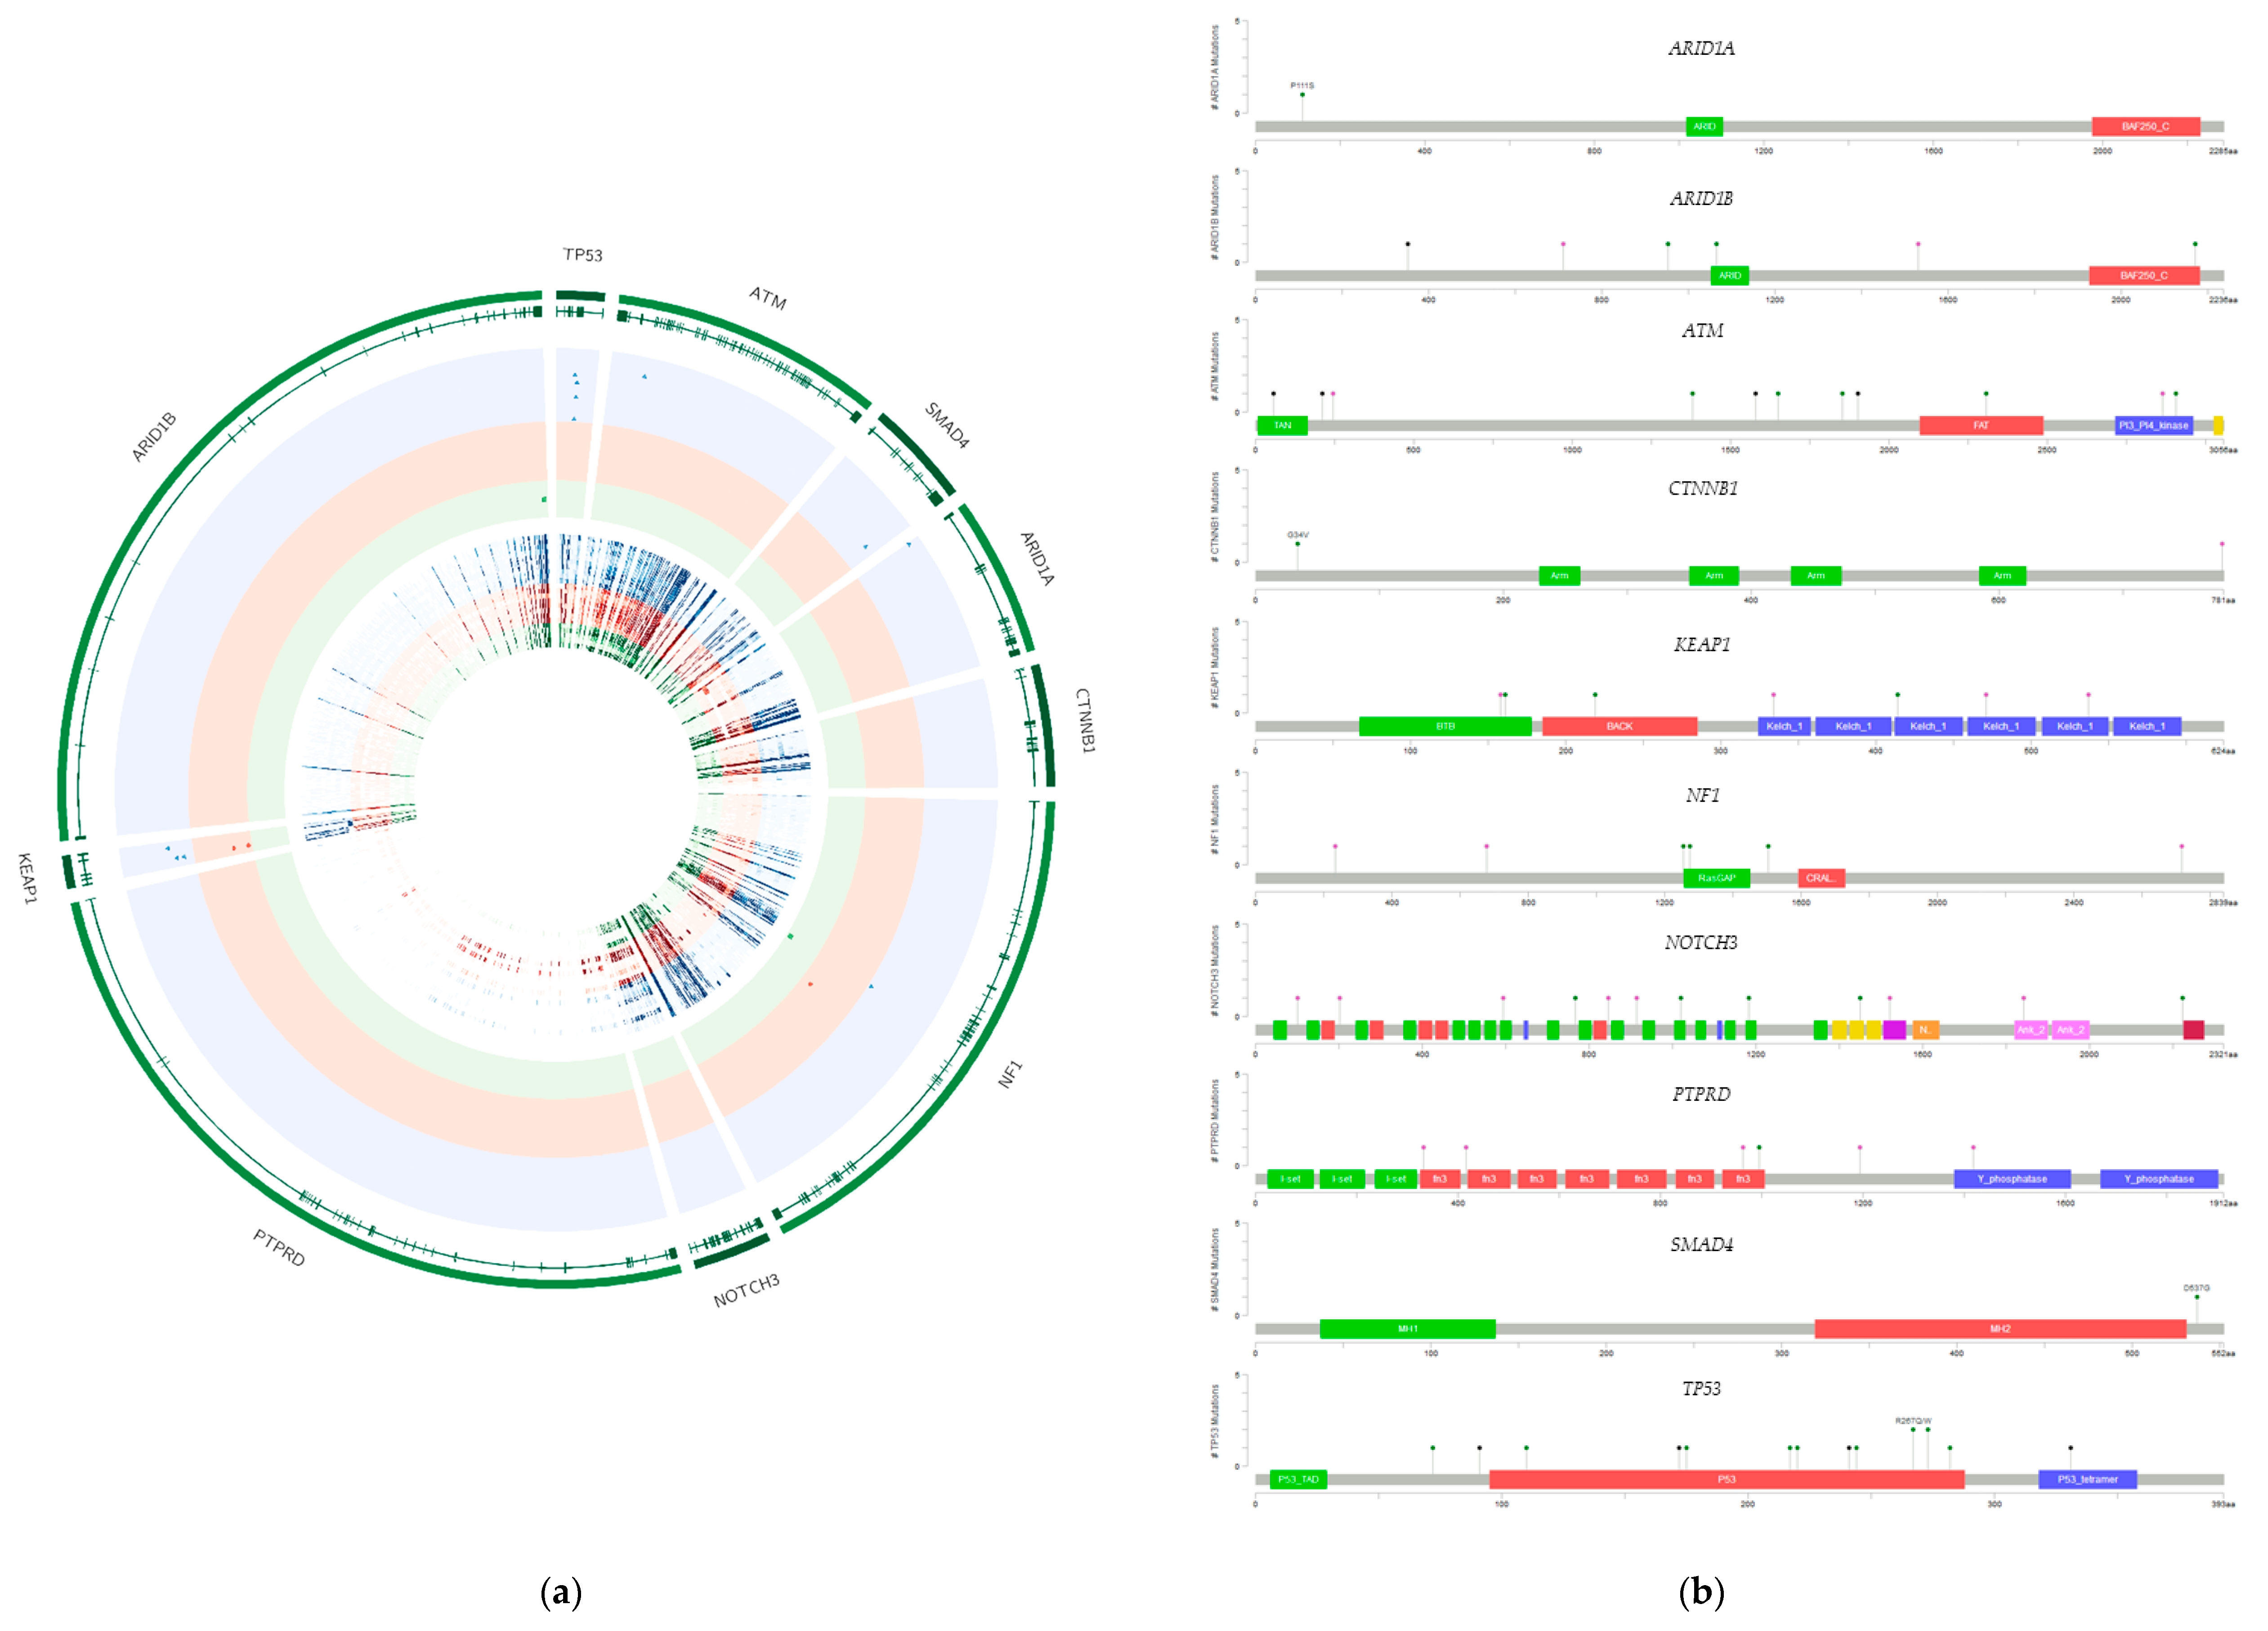
2.2. Presence of Specific Mutations in the Investigated Cell Lines
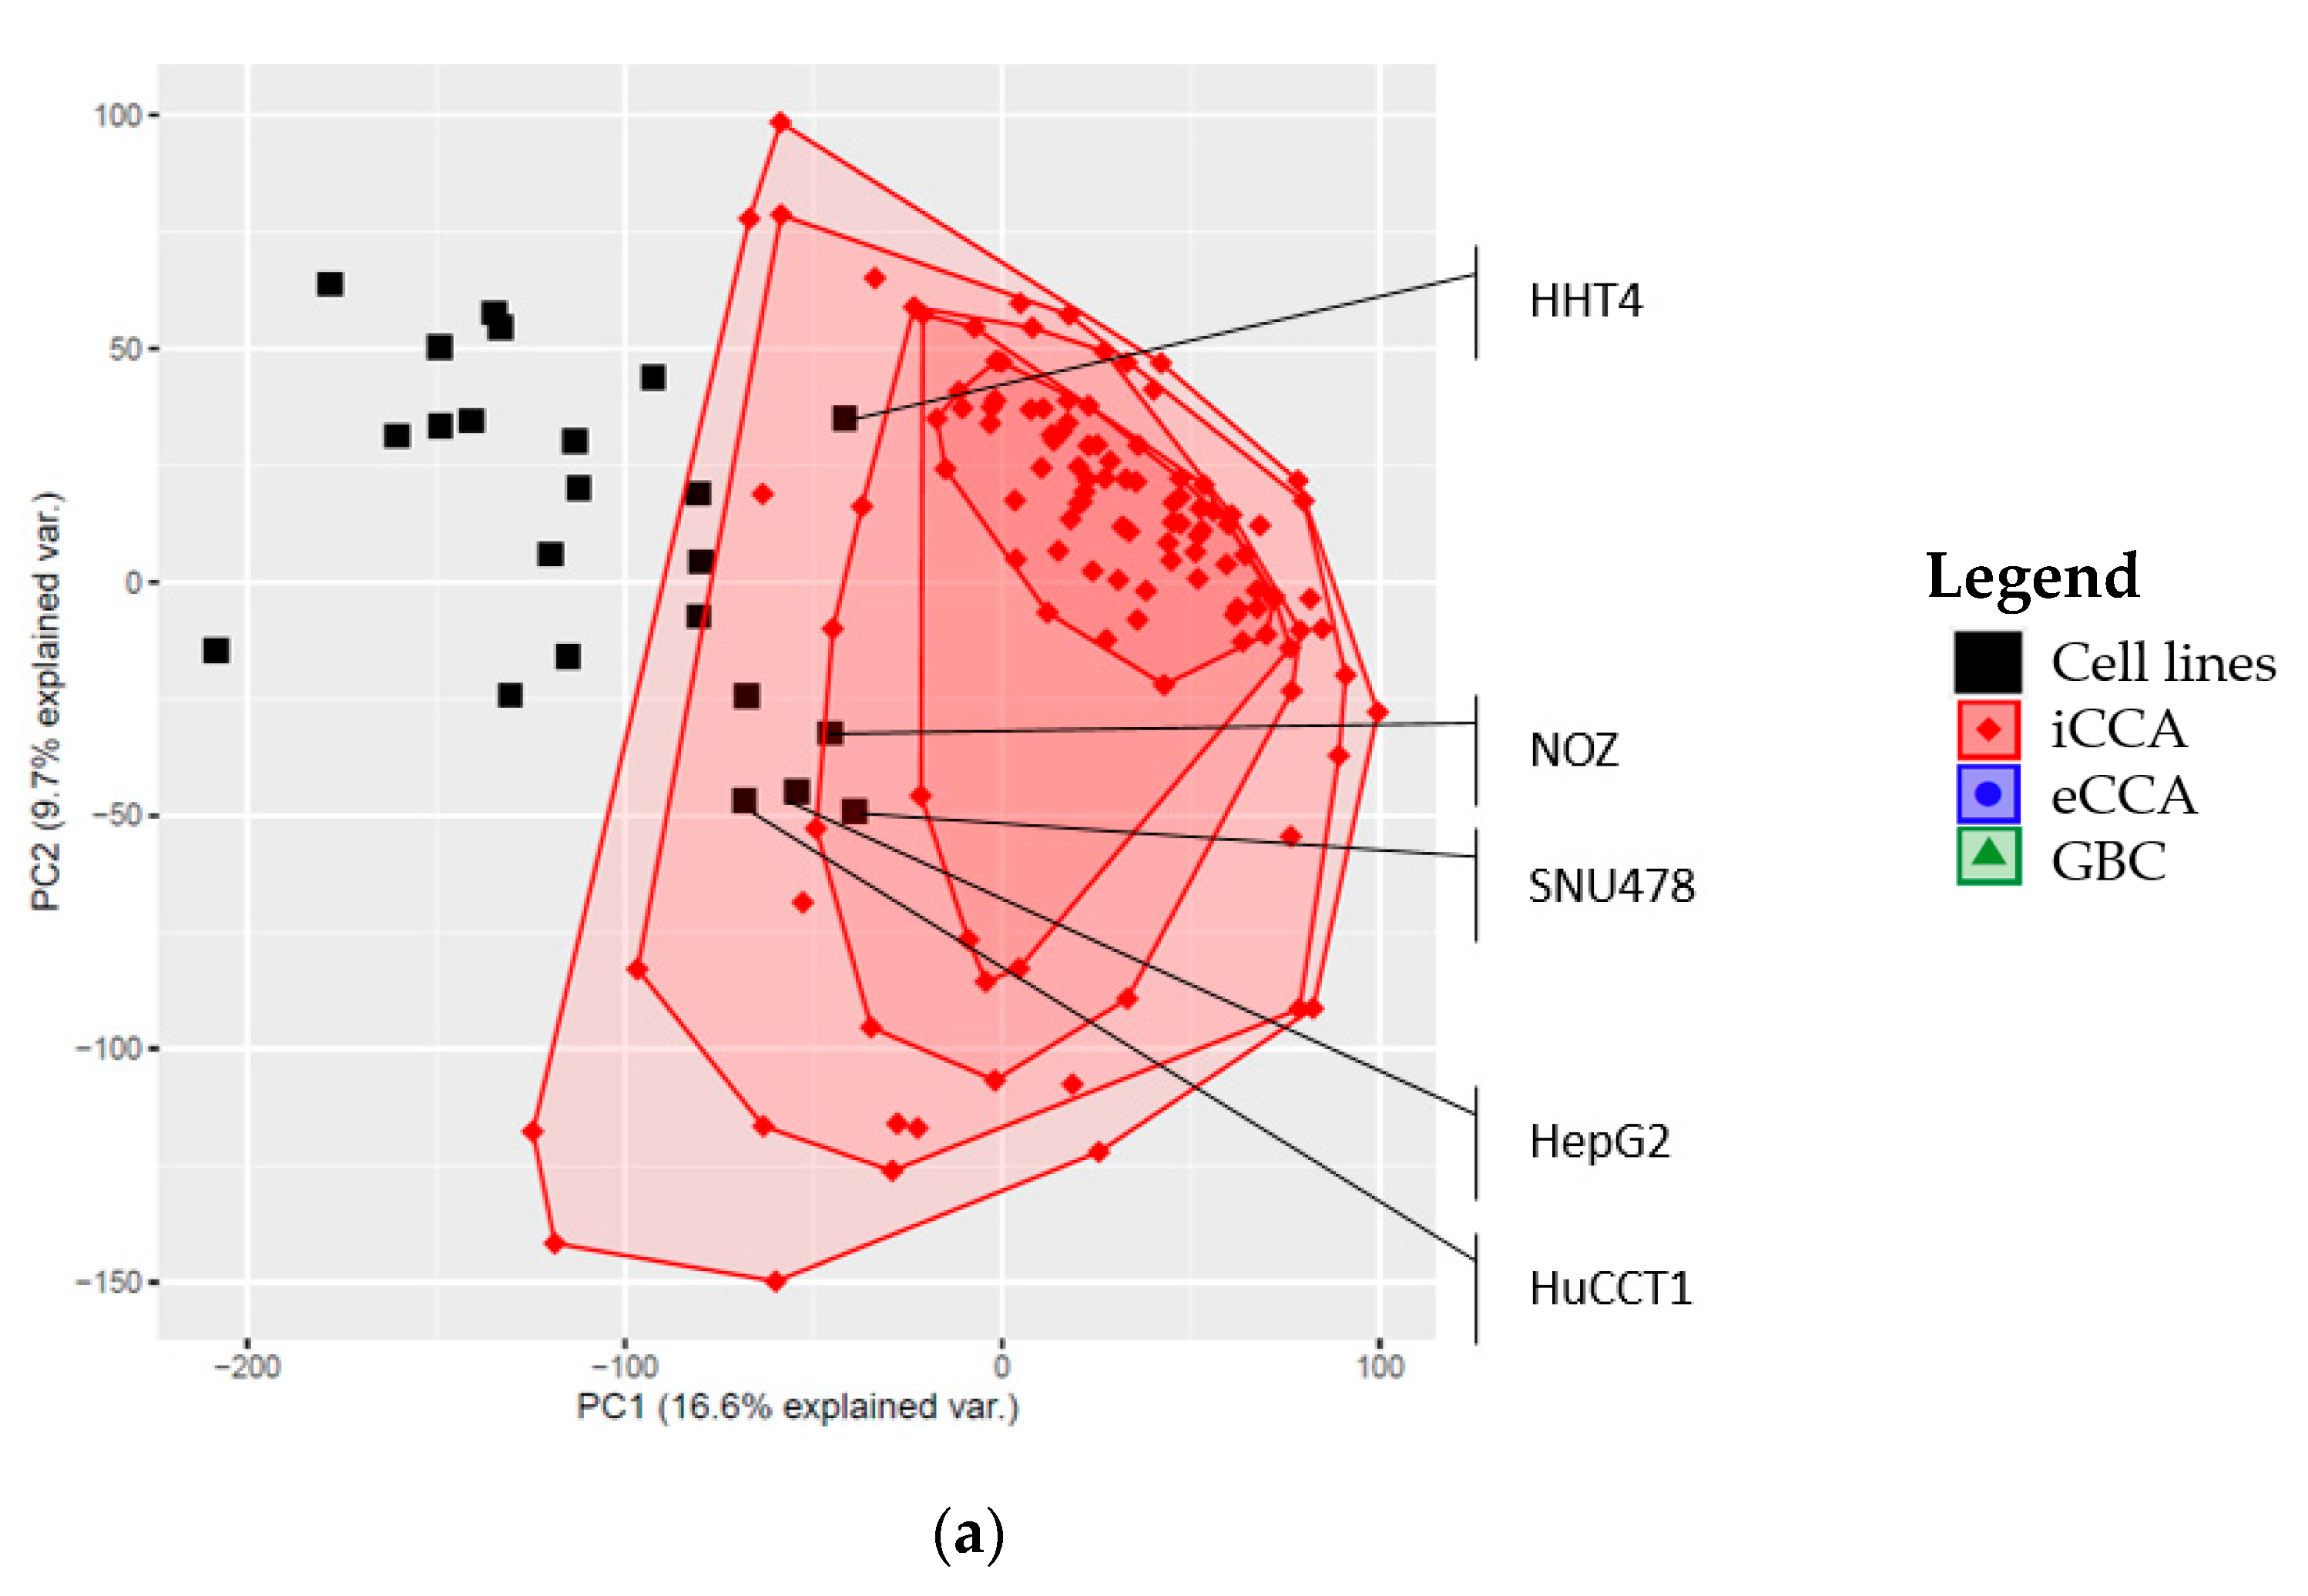
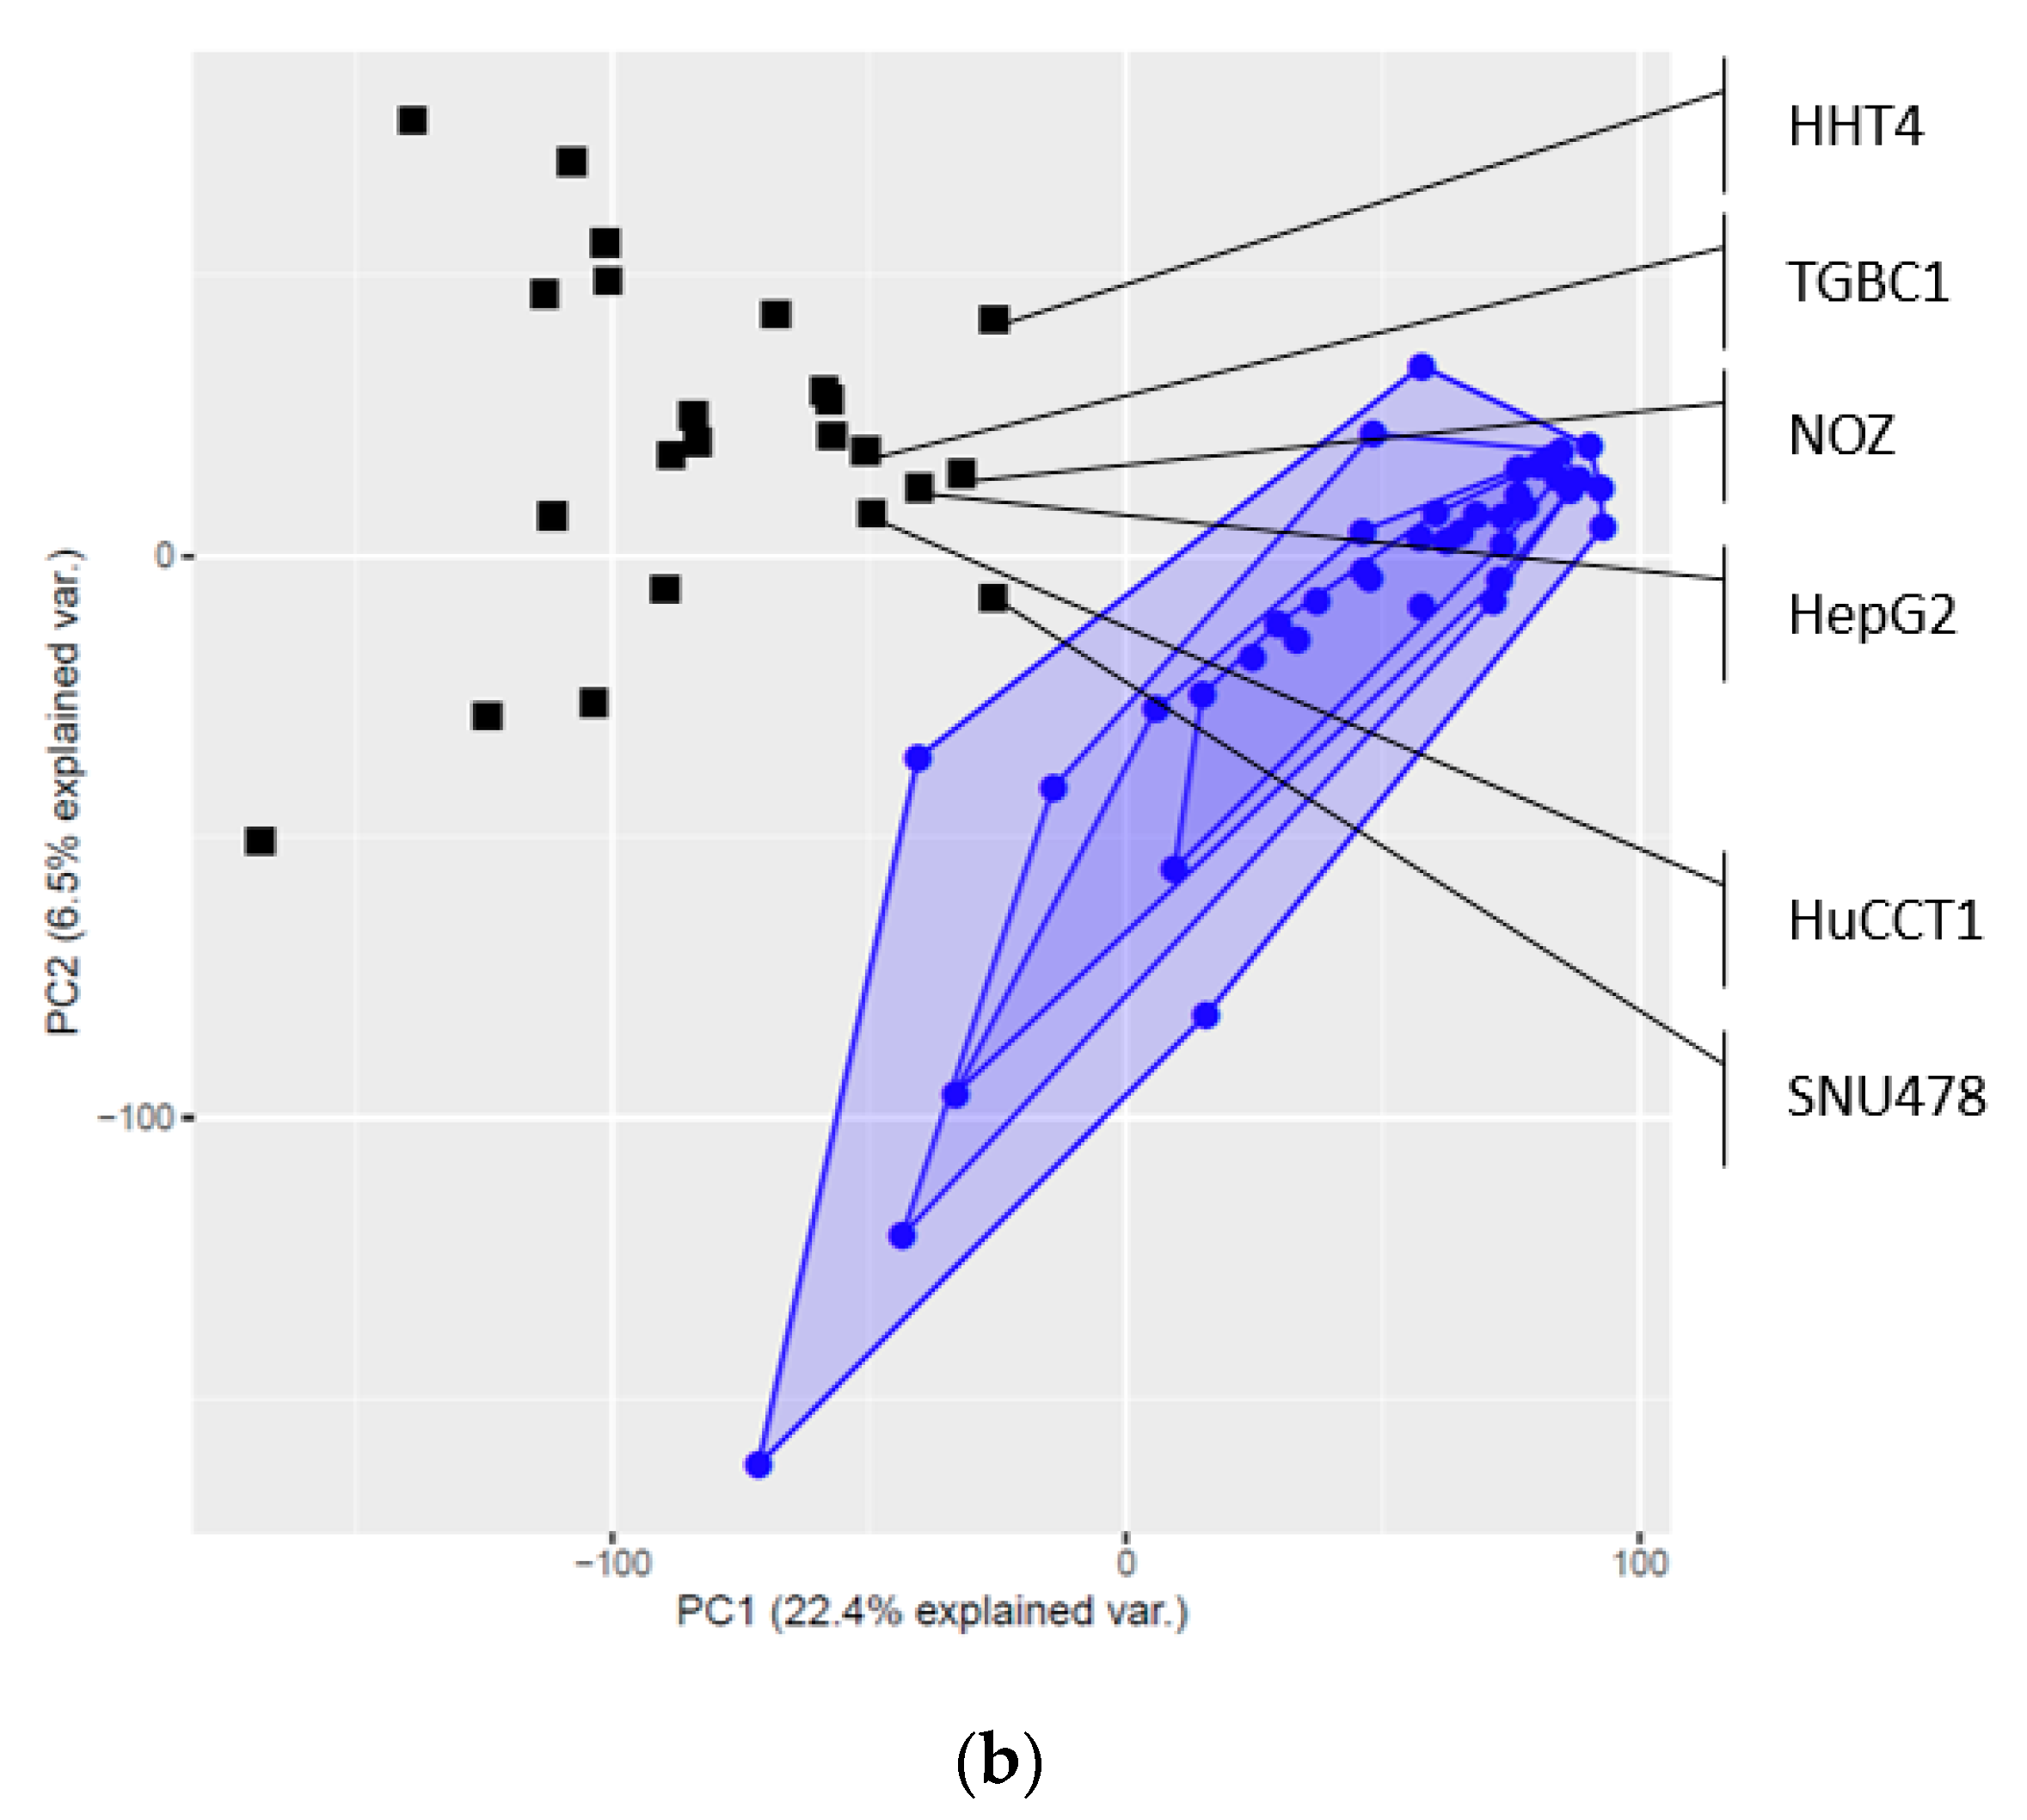
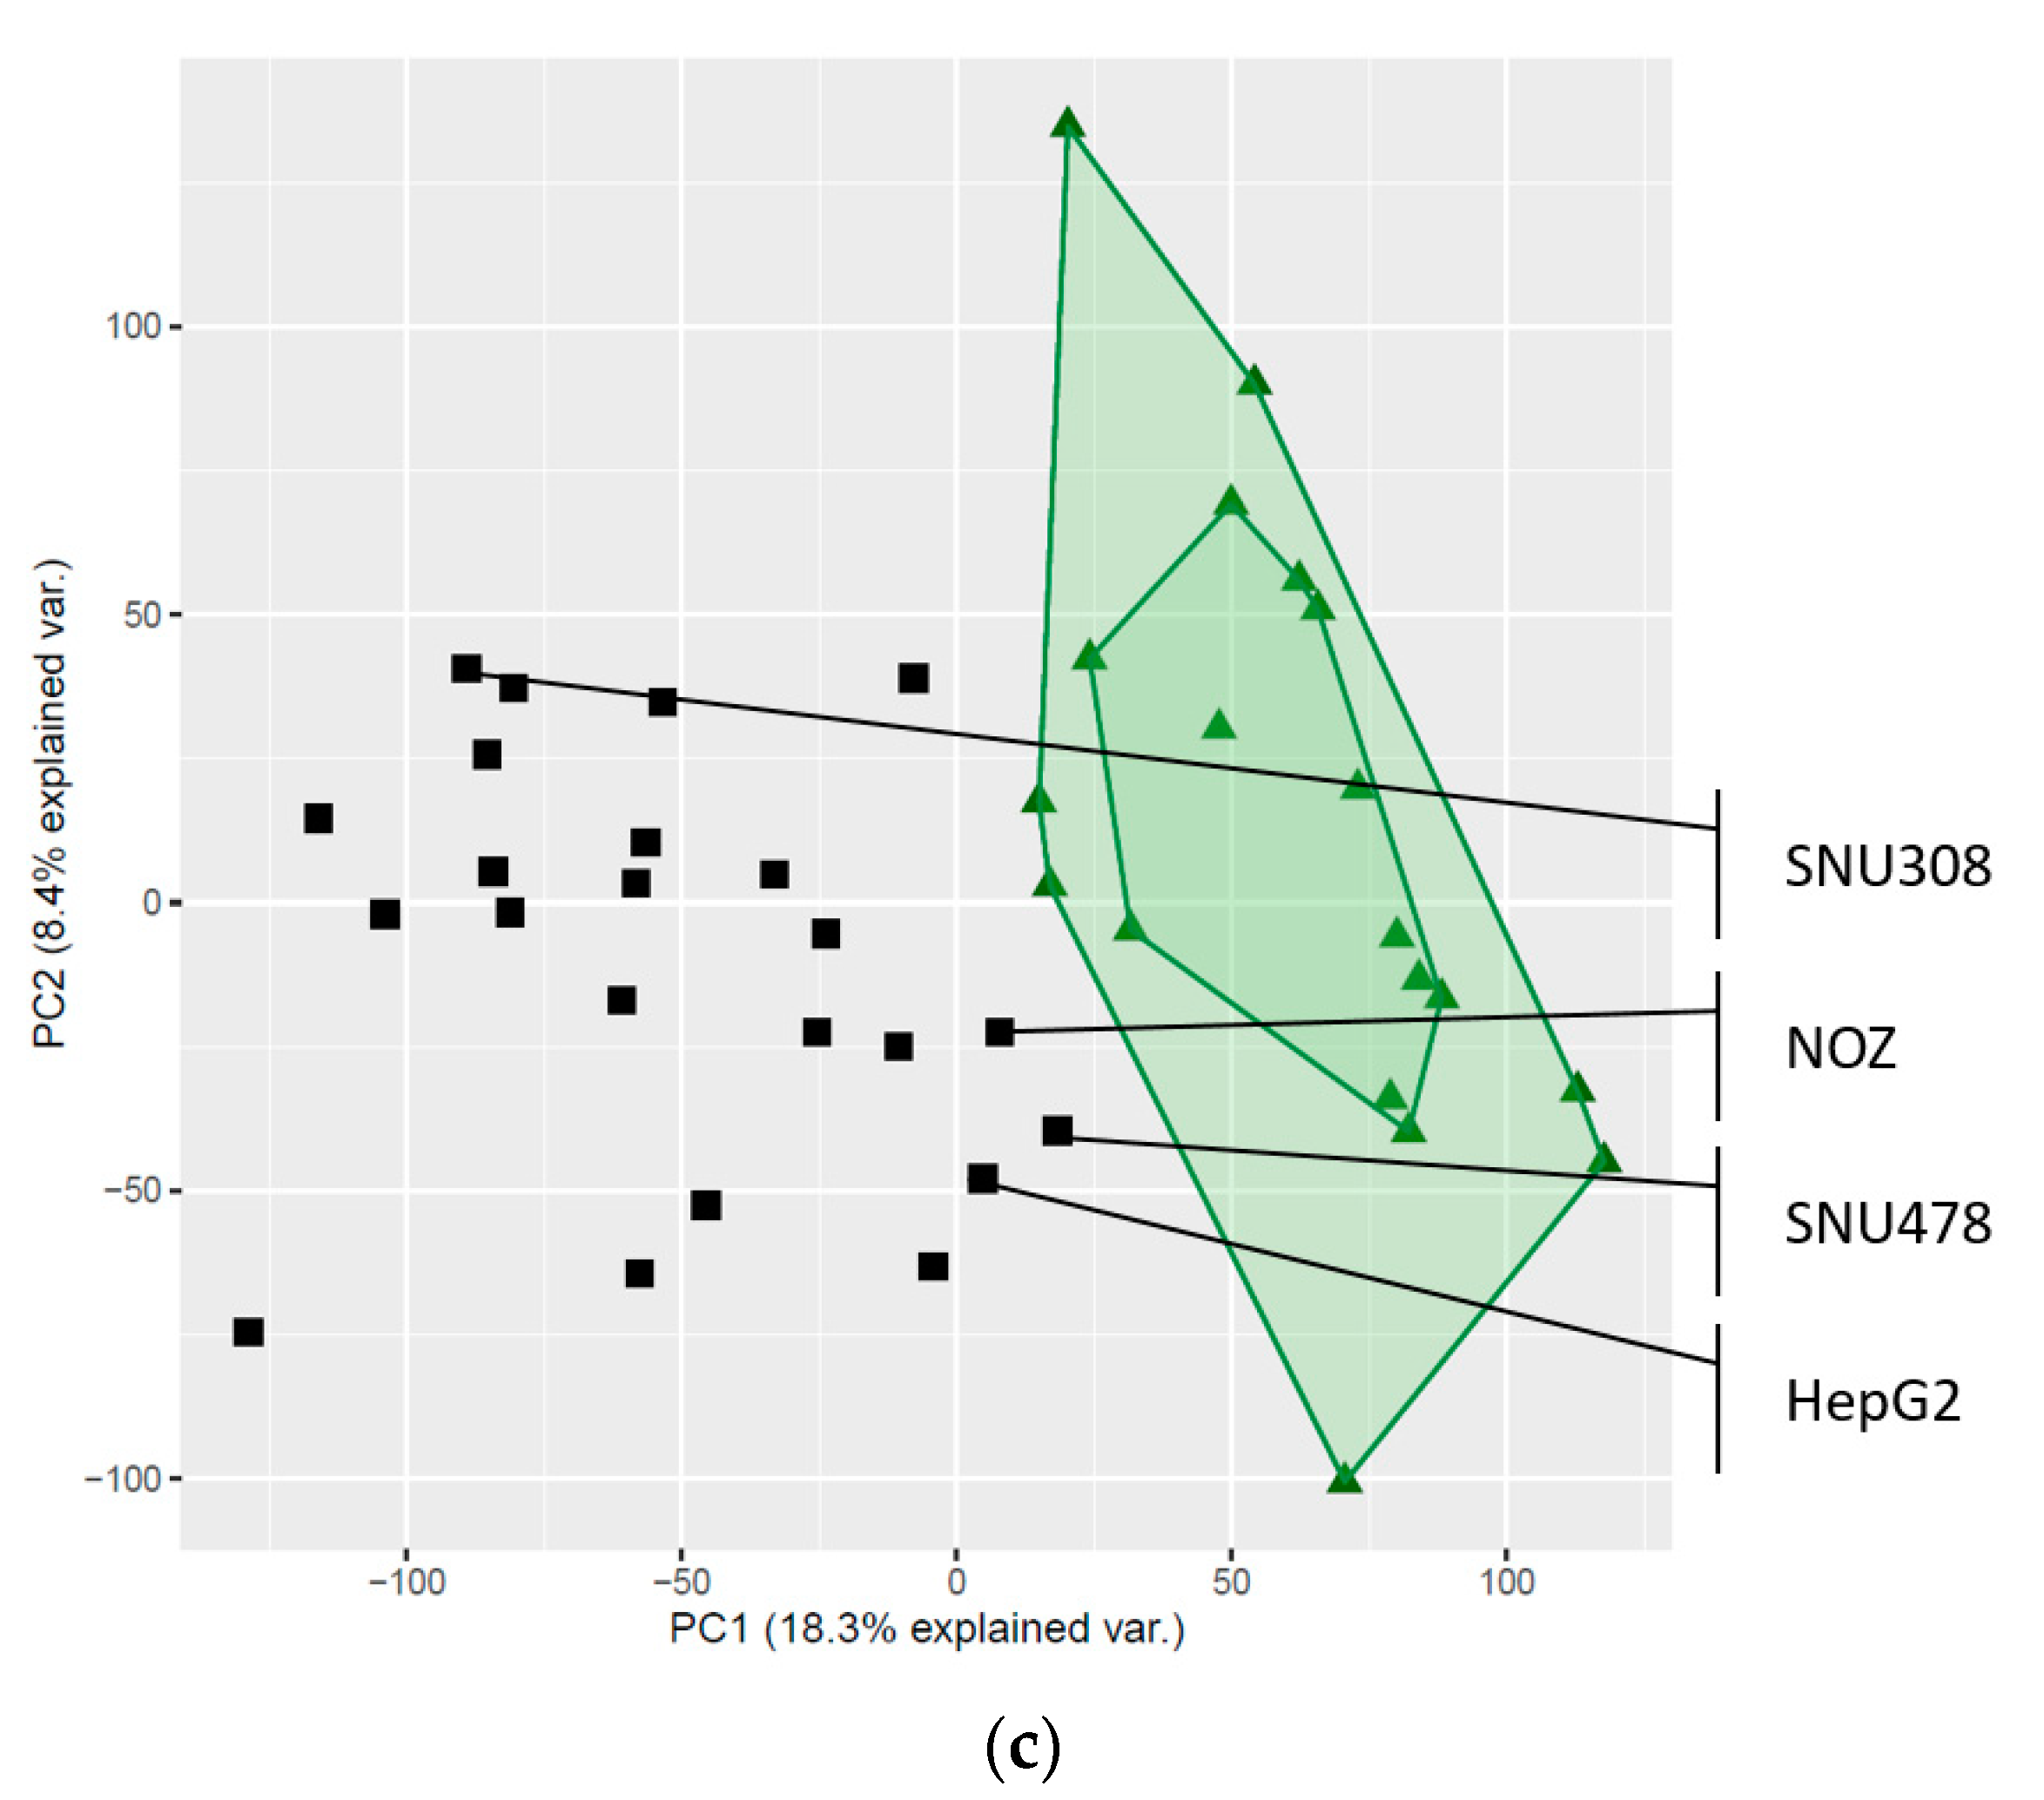
2.3. Global Gene Expression Patterns of the Investigated Cell Lines
2.4. Expression Levels of Specific Genes in the Investigated Cell Lines
3. Discussion
4. Materials and Methods
4.1. Characterized Hepatobiliary Cancer Cell Lines, Contamination Testing, and RNA Extraction and Sequencing
4.2. Quality Control, Pre-Processing, and Statistical Analysis of RNA Sequencing Data
4.3. External Data Used for the Exemplary Applications
4.4. Validation of Gene Expression Results
5. Conclusions
Supplementary Materials
Author Contributions
Funding
Conflicts of Interest
References
- Klinghammer, K.; Walther, W.; Hoffmann, J. Choosing wisely—Preclinical test models in the era of precision medicine. Cancer Treat. Rev. 2017, 55, 36–45. [Google Scholar] [CrossRef] [PubMed]
- Barretina, J.; Caponigro, G.; Stransky, N.; Venkatesan, K.; Margolin, A.A.; Kim, S.; Wilson, C.J.; Lehar, J.; Kryukov, G.V.; Sonkin, D.; et al. The Cancer Cell Line Encyclopedia enables predictive modelling of anticancer drug sensitivity. Nature 2012, 483, 603–607. [Google Scholar] [CrossRef] [PubMed]
- Iorio, F.; Knijnenburg, T.A.; Vis, D.J.; Bignell, G.R.; Menden, M.P.; Schubert, M.; Aben, N.; Gonçalves, E.; Barthorpe, S.; Lightfoot, H.; et al. A Landscape of Pharmacogenomic Interactions in Cancer. Cell 2016, 166, 740–754. [Google Scholar] [CrossRef] [PubMed] [Green Version]
- Smirnov, P.; Kofia, V.; Maru, A.; Freeman, M.; Ho, C.; El-Hachem, N.; Adam, G.-A.; Ba-Alawi, W.; Safikhani, Z.; Haibe-Kains, B. PharmacoDB: An integrative database for mining in vitro anticancer drug screening studies. Nucleic Acids Res. 2017, 46, D994–D1002. [Google Scholar] [CrossRef] [PubMed] [Green Version]
- Kabbach, G.; Assi, H.A.; Bolotin, G.; Schuster, M.; Lee, H.J.; Tadros, M. Hepatobiliary Tumors: Update on Diagnosis and Management. J. Clin. Transl. Hepatol. 2015, 3, 169–181. [Google Scholar] [CrossRef]
- Bray, F.; Ferlay, J.; Soerjomataram, I.; Siegel, R.L.; Torre, L.A.; Jemal, A. Global cancer statistics 2018: GLOBOCAN estimates of incidence and mortality worldwide for 36 cancers in 185 countries. CA Cancer J. Clin. 2018, 68, 394–424. [Google Scholar] [CrossRef] [Green Version]
- Shaffer, E.; Hundal, R. Gallbladder cancer: Epidemiology and outcome. Clin. Epidemiol. 2014, 6, 99–109. [Google Scholar] [CrossRef]
- Rizvi, S.; Gores, G.J. Pathogenesis, Diagnosis, and Management of Cholangiocarcinoma. Gastroenterology 2013, 145, 1215–1229. [Google Scholar] [CrossRef] [Green Version]
- Macias, R.I.R.; Kornek, M.; Rodrigues, P.M.; Paiva, N.; Castro, R.E.; Urban, S.; Pereira, S.P.; Cadamuro, M.; Rupp, C.; Loosen, S.H.; et al. Diagnostic and prognostic biomarkers in cholangiocarcinoma. Liver Int. 2019, 39, 108–122. [Google Scholar] [CrossRef] [Green Version]
- Lapitz, A.; Arbelaiz, A.; O’Rourke, C.J.; Lavín, J.L.; La La Casta, A.; Ibarra, C.; Jimeno, J.P.; Santos-Laso, A.; Izquierdo-Sanchez, L.; Krawczyk, M.; et al. Patients with Cholangiocarcinoma Present Specific RNA Profiles in Serum and Urine Extracellular Vesicles Mirroring the Tumor Expression: Novel Liquid Biopsy Biomarkers for Disease Diagnosis. Cells 2020, 9, 721. [Google Scholar] [CrossRef] [Green Version]
- Li, M.; Zhang, Z.; Li, X.; Ye, J.; Wu, X.; Tan, Z.; Liu, C.; Shen, B.; Wang, X.-A.; Wu, W.; et al. Whole-exome and targeted gene sequencing of gallbladder carcinoma identifies recurrent mutations in the ErbB pathway. Nat. Genet. 2014, 46, 872–876. [Google Scholar] [CrossRef] [PubMed]
- Zehir, A.; Benayed, R.; Shah, R.; Syed, A.; Middha, S.; Kim, H.R.; Srinivasan, P.; Gao, J.; Chakravarty, D.; Devlin, S.M.; et al. Mutational landscape of metastatic cancer revealed from prospective clinical sequencing of 10,000 patients. Nat. Med. 2017, 23, 703–713. [Google Scholar] [CrossRef] [PubMed]
- Cerami, E.; Gao, J.; Dogrusoz, U.; Gross, B.E.; Sumer, S.O.; Aksoy, B.A.; Skanderup, A.J.; Byrne, C.J.; Heuer, M.L.; Larsson, E.; et al. The cBio Cancer Genomics Portal: An Open Platform for Exploring Multidimensional Cancer Genomics Data: Figure 1. Cancer Discov. 2012, 2, 401–404. [Google Scholar] [CrossRef] [PubMed] [Green Version]
- Gao, J.; Aksoy, B.A.; Dogrusoz, U.; Dresdner, G.; Gross, B.; Sumer, S.O.; Sun, Y.; Skanderup, A.J.; Sinha, R.; Larsson, E.; et al. Integrative Analysis of Complex Cancer Genomics and Clinical Profiles Using the cBioPortal. Sci. Signal. 2013, 6, pl1. [Google Scholar] [CrossRef] [Green Version]
- Nakamura, H.; Arai, Y.; Totoki, Y.; Shirota, T.; ElZawahry, A.; Kato, M.; Hama, N.; Hosoda, F.; Urushidate, T.; Ohashi, S.; et al. Genomic spectra of biliary tract cancer. Nat. Genet. 2015, 47, 1003–1010. [Google Scholar] [CrossRef]
- Tate, J.G.; Bamford, S.; Jubb, H.C.; Sondka, Z.; Beare, D.M.; Bindal, N.; Boutselakis, H.; Cole, C.G.; Creatore, C.; Dawson, E.; et al. COSMIC: The Catalogue Of Somatic Mutations In Cancer. Nucleic Acids Res. 2019, 47, D941–D947. [Google Scholar] [CrossRef] [Green Version]
- Klijn, C.; Settleman, J.; Seshagiri, S.; Zhang, Z. Abstract A1-19: A comprehensive transcriptional portrait of human cancer cell lines. Cancer Genom. Epigenom. 2015, 75. [Google Scholar] [CrossRef]
- García, P.; Bizama, C.; Rosa, L.; Espinoza, J.A.; Weber, H.; Cerda-Infante, J.; Sánchez, M.; Montecinos, V.P.; Lorenzo-Bermejo, J.; Boekstegers, F.; et al. Functional and genomic characterization of three novel cell lines derived from a metastatic gallbladder cancer tumor. Boil. Res. 2020, 53, 1–17. [Google Scholar] [CrossRef] [Green Version]
- Hudson, A.M.; Yates, T.; Li, Y.; Trotter, E.W.; Fawdar, S.; Chapman, P.; Lorigan, P.; Biankin, A.V.; Miller, C.J.; Brognard, J. Discrepancies in cancer genomic sequencing highlight opportunities for driver mutation discovery. Cancer Res. 2014, 74, 6390–6396. [Google Scholar] [CrossRef] [Green Version]
- Leroy, B.; Girard, L.; Hollestelle, A.; Minna, J.D.; Gazdar, A.F.; Soussi, T. Analysis of TP53 Mutation Status in Human Cancer Cell Lines: A Reassessment. Hum. Mutat. 2014, 35, 756–765. [Google Scholar] [CrossRef]
- Bairoch, A. The Cellosaurus, a Cell-Line Knowledge Resource. J. Biomol. Tech. JBT 2018, 29, 25. [Google Scholar] [CrossRef] [PubMed]
- Budhu, A.; Chen, Y.; Kim, J.W.; Forgues, M.; Valerie, K.; Harris, C.C.; Wang, X. Induction of a unique gene expression profile in primary human hepatocytes by hepatitis C virus core, NS3 and NS5A proteins. Carcinogenesis 2007, 28, 1552–1560. [Google Scholar] [CrossRef] [PubMed] [Green Version]
- López-Terrada, D.; Cheung, S.W.; Finegold, M.J.; Knowles, B.B. Hep G2 is a hepatoblastoma-derived cell line. Hum. Pathol. 2009, 40, 1512–1515. [Google Scholar] [CrossRef] [PubMed]
- Jiang, W.; Wang, X.W.; Unger, T.; Forgues, M.; Kim, J.W.; Hussain, S.; Bowman, E.; Spillare, E.A.; Lipsky, M.M.; Meck, J.M.; et al. Cooperation of tumor-derived HBx mutants and p53-249ser mutant in regulating cell proliferation, anchorage-independent growth and aneuploidy in a telomerase-immortalized normal human hepatocyte-derived cell line. Int. J. Cancer 2009, 127, 1011–1020. [Google Scholar] [CrossRef]
- Ploeger, C.; Waldburger, N.; Fraas, A.; Goeppert, B.; Pusch, S.; Breuhahn, K.; Wang, X.; Schirmacher, P.; Roessler, S. Chromosome 8p tumor suppressor genes SH2D4A and SORBS3 cooperate to inhibit interleukin-6 signaling in hepatocellular carcinoma. Hepatology 2016, 64, 828–842. [Google Scholar] [CrossRef] [Green Version]
- Available online: https://www.bioinformatics.babraham.ac.uk/projects/fastqc/ (accessed on 3 September 2020).
- Schmieder, R.; Edwards, R.A. Quality control and preprocessing of metagenomic datasets. Bioinformatics 2011, 27, 863–864. [Google Scholar] [CrossRef] [Green Version]
- Dobin, A.; Davis, C.A.; Schlesinger, F.; Drenkow, J.; Zaleski, C.; Jha, S.; Batut, P.; Chaisson, M.; Gingeras, T.R. STAR: Ultrafast universal RNA-seq aligner. Bioinformatics 2012, 29, 15–21. [Google Scholar] [CrossRef]
- Available online: http://broadinstitute.github.io/picard/ (accessed on 3 September 2020).
- McKenna, A.; Hanna, M.; Banks, E.; Sivachenko, A.; Cibulskis, K.; Kernytsky, A.; Garimella, K.; Altshuler, D.; Gabriel, S.; Daly, M.; et al. The Genome Analysis Toolkit: A MapReduce framework for analyzing next-generation DNA sequencing data. Genome Res. 2010, 20, 1297–1303. [Google Scholar] [CrossRef] [Green Version]
- Okonechnikov, K.; Conesa, A.; García-Alcalde, F. Qualimap 2: Advanced multi-sample quality control for high-throughput sequencing data. Bioinformatics 2015, 32, 292–294. [Google Scholar] [CrossRef]
- Wang, K.; Li, M.; Hakonarson, H. ANNOVAR: Functional annotation of genetic variants from high-throughput sequencing data. Nucleic Acids Res. 2010, 38, e164. [Google Scholar] [CrossRef]
- Krzywinski, M.; Schein, J.; Birol, I.; Connors, J.; Gascoyne, R.; Horsman, D.; Jones, S.J.M.; Marra, M.A. Circos: An information aesthetic for comparative genomics. Genome Res. 2009, 19, 1639–1645. [Google Scholar] [CrossRef] [PubMed] [Green Version]
- Liao, Y.; Smyth, G.K.; Shi, W. featureCounts: An efficient general purpose program for assigning sequence reads to genomic features. Bioinformatics 2013, 30, 923–930. [Google Scholar] [CrossRef] [PubMed] [Green Version]
- Available online: https://cran.r-project.org/web/packages/depth/index.html (accessed on 3 September 2020).
- Available online: https://heidata.uni-heidelberg.de/dataset.xhtml?persistentId=doi:10.11588/data/SCGJHQ (accessed on 3 September 2020).
- Available online: https://www.ebi.ac.uk/ega/studies/EGAS00001000950 (accessed on 3 September 2020).
- Umu, S.U.; Langseth, H.; Bucher-Johannessen, C.; Fromm, B.; Keller, A.; Meese, E.; Lauritzen, M.; Leithaug, M.; Lyle, R.; Rounge, T.B. A comprehensive profile of circulating RNAs in human serum. RNA Biol. 2018, 15, 242–250. [Google Scholar] [CrossRef] [PubMed] [Green Version]


| Cell Line | Gene | ||||||||||||||||||||||||||||||||||||||||
|---|---|---|---|---|---|---|---|---|---|---|---|---|---|---|---|---|---|---|---|---|---|---|---|---|---|---|---|---|---|---|---|---|---|---|---|---|---|---|---|---|---|
| Proportion of Primary GBC Tumours in MSK-IMPACT with One or More Mutations | |||||||||||||||||||||||||||||||||||||||||
| Type | Name | TP53 | ATM | SMAD4 | ARID1A | ARID1B | CTNNB1 | KEAP1 | NF1 | NOTCH3 | PTPRD | ||||||||||||||||||||||||||||||
| 44% | 33% | 28% | 22% | 11% | 11% | 11% | 11% | 11% | 11% | ||||||||||||||||||||||||||||||||
| A | B | C | D | A | B | C | D | A | B | C | D | A | B | C | D | A | B | C | D | A | B | C | D | A | B | C | D | A | B | C | D | A | B | C | D | A | B | C | D | ||
| GBC | G-415 | ||||||||||||||||||||||||||||||||||||||||
| GB-d1 | x | ||||||||||||||||||||||||||||||||||||||||
| Mz-Cha-1 | x | ||||||||||||||||||||||||||||||||||||||||
| NOZ | x | ||||||||||||||||||||||||||||||||||||||||
| OCUG-1 | x | ||||||||||||||||||||||||||||||||||||||||
| OZ | |||||||||||||||||||||||||||||||||||||||||
| SNU308 | x | x | x | x | x | x | |||||||||||||||||||||||||||||||||||
| TGBC1 | x | x | x | x | x | x | |||||||||||||||||||||||||||||||||||
| TGBC2 | x | ||||||||||||||||||||||||||||||||||||||||
| YoMi | x | x | |||||||||||||||||||||||||||||||||||||||
| HCC | Hep3B | x | x | ||||||||||||||||||||||||||||||||||||||
| HepG2 | x | x | |||||||||||||||||||||||||||||||||||||||
| HHT4 | |||||||||||||||||||||||||||||||||||||||||
| HLE | x | x | x | x | |||||||||||||||||||||||||||||||||||||
| HLF | x | ||||||||||||||||||||||||||||||||||||||||
| HuH1 | x | x | x | x | x | x | x | ||||||||||||||||||||||||||||||||||
| HuH6 | x | x | x | x | x | x | |||||||||||||||||||||||||||||||||||
| HuH7 | x | x | x | x | x | x | x | x | |||||||||||||||||||||||||||||||||
| CCA | EGI-1 | x | x | x | |||||||||||||||||||||||||||||||||||||
| HuCCT1 | x | x | x | ||||||||||||||||||||||||||||||||||||||
| KMCH | x | ||||||||||||||||||||||||||||||||||||||||
| SNU478 | x | x | |||||||||||||||||||||||||||||||||||||||
| TFK-1 | x | ||||||||||||||||||||||||||||||||||||||||
| Gene-Specific Median TPM Expression Value | |||||||||||||
|---|---|---|---|---|---|---|---|---|---|---|---|---|---|
| Gene Name | TP53 | TERT | ARID2 | EGFR | CCND1 | CCND3 | ERBB3 | KMT2D | KMT2C | TET1 | TET2 | TET3 | |
| Median TPM | 4.95 | 0.04 | 0.67 | 1.45 | 45.04 | 1.73 | 33.08 | 6.16 | 0.68 | 0.04 | 0.42 | 0.42 | |
| 5th percentile–95th percentile | 2.34–7.55 | −0.1–0.17 | 0.44–0.89 | 0.71–2.19 | 6.02–84.06 | 0.79–2.66 | 30.23–34.71 | 3.49–8.82 | 0.42–0.94 | −0.04–0.11 | 0.17–0.9 | 0.37–0.9 | |
| RNA Sequencing | GB-d1 | 14.09 | 1.59 | 1.78 | 16.76 | 184.35 | 2.88 | 39.69 | 34.67 | 1.27 | 0.05 | 1.22 | 1.43 |
| Mz-Cha-1 | 29.98 | 0.14 | 1.37 | 13.55 | 100.15 | 5.06 | 57.79 | 41.35 | 3.43 | 0.04 | 0.59 | 2.19 | |
| NOZ | 3.90 | 0.30 | 0.59 | 7.32 | 151.95 | 3.15 | 1.98 | 21.87 | 1.49 | 0.06 | 0.26 | 1.03 | |
| OCUG-1 | 25.41 | 2.01 | 0.64 | 21.78 | 30.05 | 2.91 | 31.73 | 10.56 | 3.85 | 0.10 | 0.57 | 0.56 | |
| OZ | 39.80 | 0.36 | 1.84 | 19.97 | 149.99 | 2.85 | 198.17 | 69.93 | 3.18 | 0.06 | 1.12 | 4.59 | |
| SNU308 | 41.07 | 0.16 | - | 21.38 | 201.48 | 1.67 | 35.15 | 56.81 | 2.62 | 0.11 | 1.93 | 2.51 | |
| TGBC1 | 1.62 | 3.67 | 0.79 | 4.19 | 81.09 | 2.26 | 31 | 20.34 | 2.22 | 0.26 | 0.53 | 1.19 | |
| TGBC2 | 1.50 | 9.54 | 0.51 | 6.35 | 106.40 | 7.28 | 3.16 | 19.03 | 1.53 | 0.11 | 0.80 | 1.58 | |
| YoMi | 4.71 | 0.30 | 3.20 | 24.72 | 256.11 | 6.54 | 284.89 | 66.87 | 5.01 | - | 2.20 | 8.11 | |
| small RNA Sequencing | GB-d1 | 2.07 | 0.45 | 5.25 | 49.02 | 83.05 | 2.53 | 9.65 | 37.48 | 3.35 | 0.58 | 2.13 | 10.45 |
| Mz-Cha-1 | 2.58 | 0.14 | 5.06 | 37.27 | 39.53 | 2.33 | 15.43 | 39.12 | 10.45 | 1.07 | 1.39 | 9.86 | |
| NOZ | 0.79 | - | 3.82 | 28.94 | 94.33 | 3.19 | 0.34 | 26.37 | 5.09 | 1.27 | 0.71 | 8.12 | |
| OCUG-1 | 8.61 | 2.66 | 3.64 | 122.31 | 27.62 | 11.73 | 18.83 | 37.79 | 24.93 | 5.39 | 3.74 | 3.67 | |
| OZ | 7.29 | 0.31 | 9.89 | 53.12 | 132.32 | 5.01 | 25.38 | 54.95 | 8.71 | 0.71 | 2.25 | 47.57 | |
| SNU308 | 2.10 | 0.23 | 0.20 | 17.52 | 51.47 | 1.21 | 2.61 | 23.03 | 2.87 | - | 0.81 | 5.73 | |
| TGBC1 | 1.06 | 2.99 | 3.94 | 26.63 | 75.96 | 4.78 | 12.90 | 57.30 | 12.75 | 9.97 | 1.62 | 14.45 | |
| TGBC2 | 0.70 | 6.54 | 2.86 | 16.29 | 60.75 | 6.23 | 0.58 | 34.57 | 3.86 | 0.53 | 0.53 | 10.22 | |
| YoMi | 1.03 | 0.43 | 10.73 | 30.21 | 150.31 | 13.48 | 68.40 | 52.66 | 15.80 | 0.86 | 2.93 | 30.39 | |
| % concordance | 33 | 78 | 44 | 100 | 44 | 67 | 22 | 100 | 100 | 11 | 56 | 89 | |
© 2020 by the authors. Licensee MDPI, Basel, Switzerland. This article is an open access article distributed under the terms and conditions of the Creative Commons Attribution (CC BY) license (http://creativecommons.org/licenses/by/4.0/).
Share and Cite
Scherer, D.; Dávila López, M.; Goeppert, B.; Abrahamsson, S.; González Silos, R.; Nova, I.; Marcelain, K.; Roa, J.C.; Ibberson, D.; Umu, S.U.; et al. RNA Sequencing of Hepatobiliary Cancer Cell Lines: Data and Applications to Mutational and Transcriptomic Profiling. Cancers 2020, 12, 2510. https://0-doi-org.brum.beds.ac.uk/10.3390/cancers12092510
Scherer D, Dávila López M, Goeppert B, Abrahamsson S, González Silos R, Nova I, Marcelain K, Roa JC, Ibberson D, Umu SU, et al. RNA Sequencing of Hepatobiliary Cancer Cell Lines: Data and Applications to Mutational and Transcriptomic Profiling. Cancers. 2020; 12(9):2510. https://0-doi-org.brum.beds.ac.uk/10.3390/cancers12092510
Chicago/Turabian StyleScherer, Dominique, Marcela Dávila López, Benjamin Goeppert, Sanna Abrahamsson, Rosa González Silos, Igor Nova, Katherine Marcelain, Juan C. Roa, David Ibberson, Sinan U. Umu, and et al. 2020. "RNA Sequencing of Hepatobiliary Cancer Cell Lines: Data and Applications to Mutational and Transcriptomic Profiling" Cancers 12, no. 9: 2510. https://0-doi-org.brum.beds.ac.uk/10.3390/cancers12092510