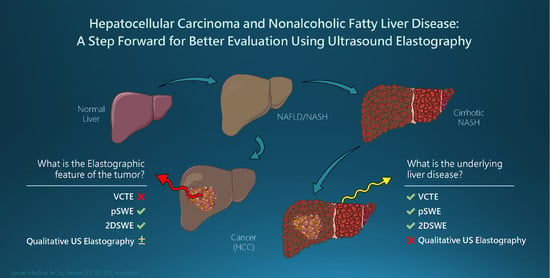
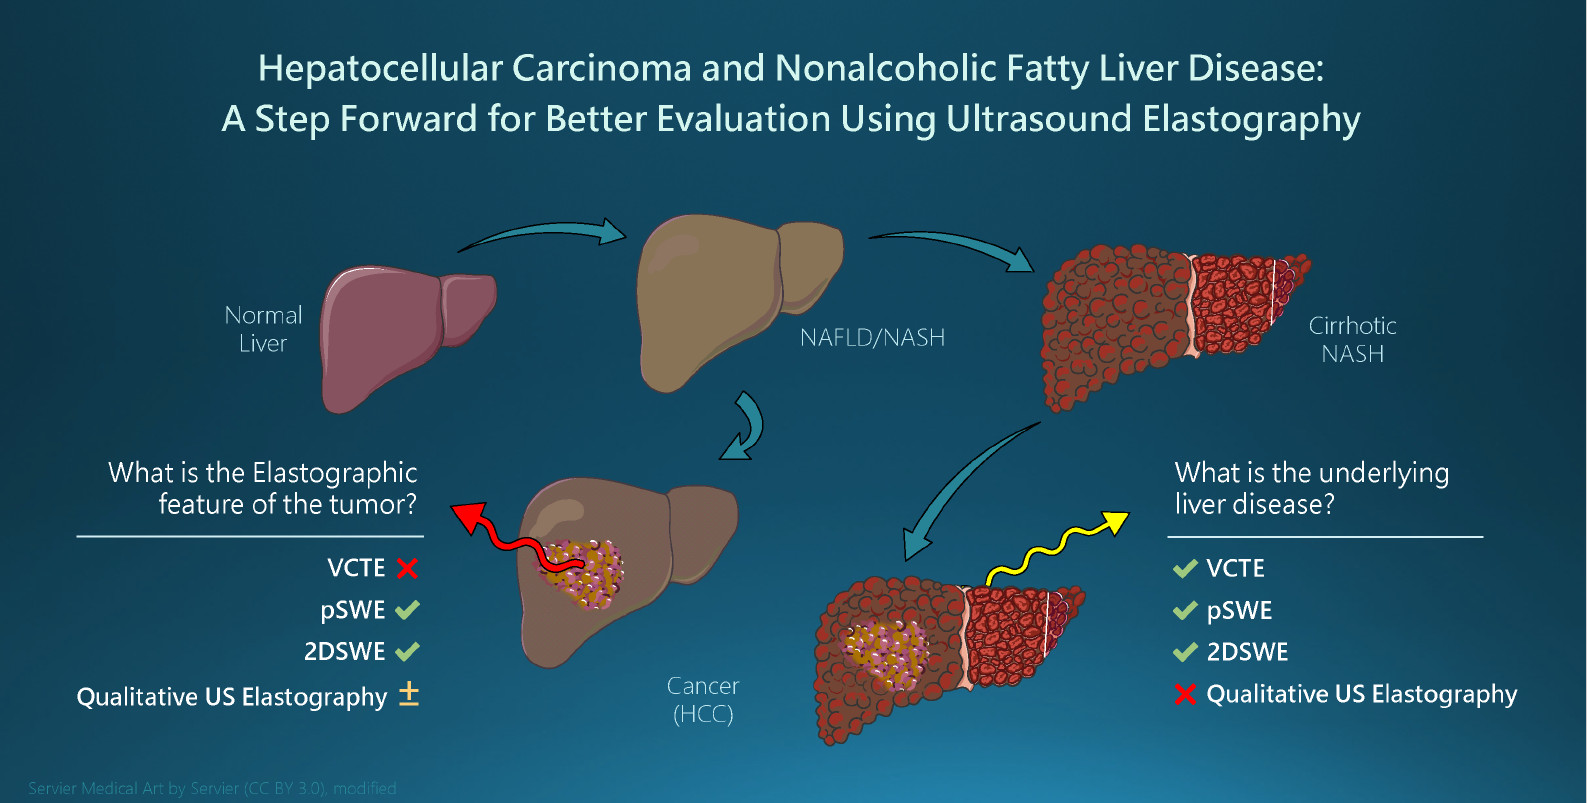
Hepatocellular Carcinoma and Non-Alcoholic Fatty Liver Disease: A Step Forward for Better Evaluation Using Ultrasound Elastography

 ,
,  ,
, 
 and
and
Abstract
:Simple Summary
Abstract
1. Introduction
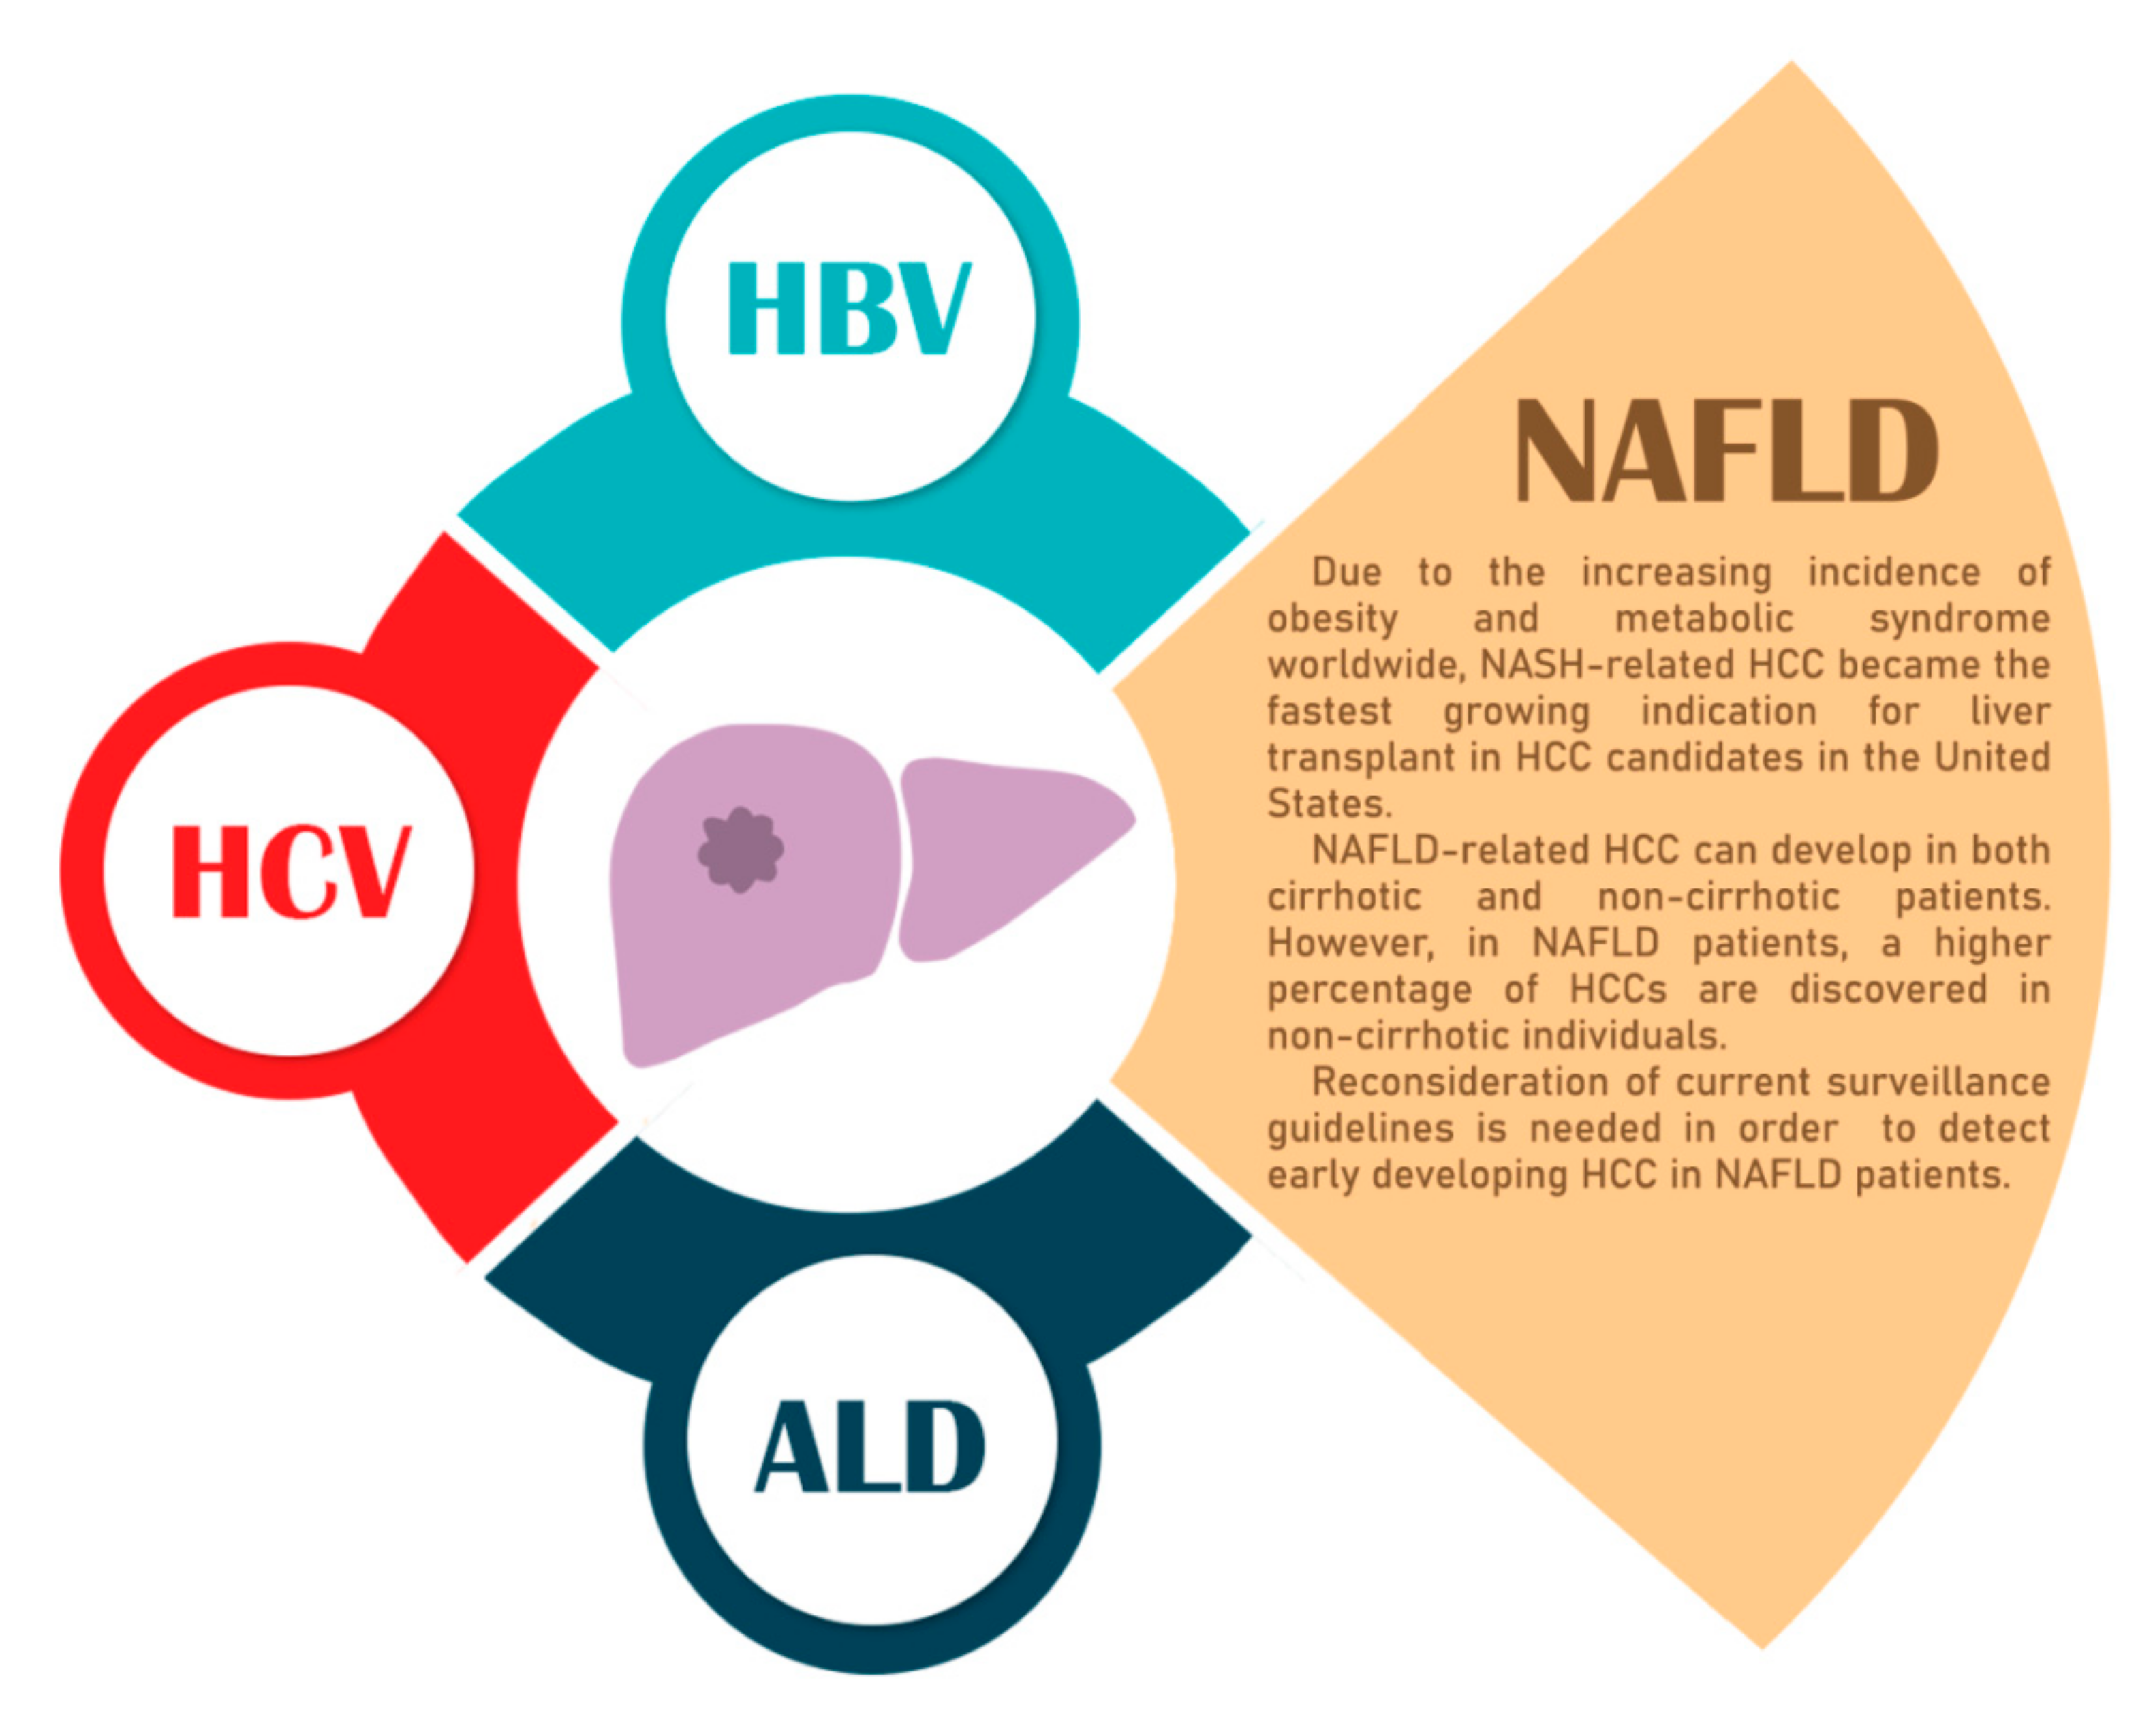
2. Clinical Considerations: The HCC-NAFLD-NASH Trio
3. The Main Elastographic Techniques
- Vibration controlled transient elastography—VCTE (FibroScan®, Echosens, Paris, France)
- Point Shear wave elastography (ARFI-based technique): VTQ (Siemens Healthcare, Berlin, Germany), ElastPQ (Philips Healthcare, Amsterdam, The Netherlands), SWM (Hitachi Aloka Medical, Tokyo, Japan), QelaXto® (Esaote, Genoa, Italy), S-shearwave® (Samsung, Seoul, South Korea), STQ® (Mindray, Shenzhen, China)
- 2D-Shear wave elastography (ARFI-based technique): SSI (SuperSonic Imagine, Aixplorer®, Aix-en-Provence, France), ElastQ® (Philips, Healthcare, Amsterdam, The Netherlands), 2D-SWE.GE (GE Healthcare, Chicago, IL, USA), ToSWE (Toshiba Medical Systems, Tokyo, Japan), STE® (Mindray, Shenzhen, China)
3.1. Vibration Controlled Transient Elastography (VCTE)
Controlled Attenuation Parameter—A Novel Tool for Steatosis Assessment Using VCTE
3.2. Point Shear Wave Elastography (pSWE)
3.3. Two-Dimensional SWE (2D-SWE)
3.4. Strain Elastography (SE)
4. Confounders: Factors Influencing Liver Stiffness Independent of Liver Fibrosis
5. Indications, Advantages, and Limitations of the Quantitative Ultrasonic Elastography Technology
6. Liver Parenchyma Characterization in NAFLD Patients with Superimposed HCC
6.1. Performance of VCTE for Liver Fibrosis Assessment in NAFLD
VCTE—Impediments and Resolutions
6.2. pSWE Performance in Assessing Fibrosis in NAFLD
6.3. Performance of 2D-SWE in Evaluating Fibrosis in NAFLD Patients
6.4. Steatosis Evaluation in NAFLD Patients Using the Controlled Attenuation Parameter (CAP)
6.5. Prognosis Value of LS and CAP Measurement in NAFLD
7. Ultrasound Elastography: A New Tool in the Characterization of Hepatocellular Carcinoma in Non-Alcoholic Fatty Liver Disease
7.1. The Evaluation of FLLs Using pSWE Methods
7.2. 2D-SWE Evaluation of FLLs
8. Conclusions
Author Contributions
Funding
Acknowledgments
Conflicts of Interest
References
- Younossi, Z.M.; Koenig, A.B.; Abdelatif, D.; Fazel, Y.; Henry, L.; Wymer, M. Global epidemiology of nonalcoholic fatty liver disease-Meta-analytic assessment of prevalence, incidence, and outcomes. Hepatology 2016, 64, 73–84. [Google Scholar] [CrossRef] [PubMed] [Green Version]
- Chooi, Y.C.; Ding, C.; Magkos, F. The epidemiology of obesity. Metab. Clin. Exp. 2019, 92, 6–10. [Google Scholar] [CrossRef] [PubMed] [Green Version]
- Goldberg, D.; Ditah, I.C.; Saeian, K.; Lalehzari, M.; Aronsohn, A.; Gorospe, E.C.; Charlton, M. Changes in the Prevalence of Hepatitis C Virus Infection, Nonalcoholic Steatohepatitis, and Alcoholic Liver Disease Among Patients With Cirrhosis or Liver Failure on the Waitlist for Liver Transplantation. Gastroenterology 2017, 152, 1090–1099. [Google Scholar] [CrossRef] [PubMed] [Green Version]
- Younossi, Z.; Stepanova, M.; Ong, J.P.; Jacobson, I.M.; Bugianesi, E.; Duseja, A.; Eguchi, Y.; Wong, V.W.; Negro, F.; Yilmaz, Y.; et al. Nonalcoholic Steatohepatitis Is the Fastest Growing Cause of Hepatocellular Carcinoma in Liver Transplant Candidates. Clin. Gastroenterol. Hepatol. 2019, 17, 748–755. [Google Scholar] [CrossRef] [PubMed] [Green Version]
- Sanyal, A.; Poklepovic, A.; Moyneur, E.; Barghout, V. Population-based risk factors and resource utilization for HCC: US perspective. Curr. Med. Res. Opin. 2010, 26, 2183–2191. [Google Scholar] [CrossRef]
- Mittal, S.; El-Serag, H.B.; Sada, Y.H.; Kanwal, F.; Duan, Z.; Temple, S.; May, S.B.; Kramer, J.R.; Richardson, P.A.; Davila, J.A. Hepatocellular Carcinoma in the Absence of Cirrhosis in United States Veterans is Associated with Nonalcoholic Fatty Liver Disease. Clin. Gastroenterol. Hepatol. 2016, 14, 124–131. [Google Scholar] [CrossRef] [Green Version]
- Marrero, J.A.; Kulik, L.M.; Sirlin, C.B.; Zhu, A.X.; Finn, R.S.; Abecassis, M.M.; Roberts, L.R.; Heimbach, J.K. Diagnosis, Staging, and Management of Hepatocellular Carcinoma: 2018 Practice Guidance by the American Association for the Study of Liver Diseases. Hepatology 2018, 68, 723–750. [Google Scholar] [CrossRef] [Green Version]
- Samoylova, M.L.; Mehta, N.; Roberts, J.P.; Yao, F.Y. Predictors of Ultrasound Failure to Detect Hepatocellular Carcinoma. Liver Transpl. 2018, 24, 1171–1177. [Google Scholar] [CrossRef] [Green Version]
- Thompson, S.M.; Garg, I.; Ehman, E.C.; Sheedy, S.P.; Bookwalter, C.A.; Carter, R.E.; Roberts, L.R.; Venkatesh, S.K. Non-alcoholic fatty liver disease-associated hepatocellular carcinoma: Effect of hepatic steatosis on major hepatocellular carcinoma features at MRI. Br. J. Radiol. 2018, 91, 20180345. [Google Scholar] [CrossRef]
- Al-Sharhan, F.; Dohan, A.; Barat, M.; Feddal, A.; Terris, B.; Pol, S.; Mallet, V.; Soyer, P. MRI presentation of hepatocellular carcinoma in non-alcoholic steatohepatitis (NASH). Eur. J. Radiol. 2019, 119, 108648. [Google Scholar] [CrossRef]
- Anstee, Q.M.; Reeves, H.L.; Kotsiliti, E.; Govaere, O.; Heikenwalder, M. From NASH to HCC: Current concepts and future challenges. Nat. Rev. Gastroenterol. Hepatol. 2019, 16, 411–428. [Google Scholar] [CrossRef] [PubMed]
- Zhou, J.H.; Cai, J.J.; She, Z.G.; Li, H.L. Noninvasive evaluation of nonalcoholic fatty liver disease: Current evidence and practice. World J. Gastroenterol. 2019, 25, 1307–1326. [Google Scholar] [CrossRef] [PubMed]
- Diehl, A.M.; Day, C. Cause, Pathogenesis, and Treatment of Nonalcoholic Steatohepatitis. N. Engl. J. Med. 2017, 377, 2063–2072. [Google Scholar] [CrossRef]
- Marchesini, G.; Roden, M.; Vettor, R. Response to: Comment to “EASL-EASD-EASO Clinical Practice Guidelines for the management of non-alcoholic fatty liver disease”. J. Hepatol. 2017, 66, 466–467. [Google Scholar] [CrossRef] [PubMed] [Green Version]
- Baffy, G.; Brunt, E.M.; Caldwell, S.H. Hepatocellular carcinoma in non-alcoholic fatty liver disease: An emerging menace. J. Hepatol. 2012, 56, 1384–1391. [Google Scholar] [CrossRef] [Green Version]
- Margini, C.; Dufour, J.F. The story of HCC in NAFLD: From epidemiology, across pathogenesis, to prevention and treatment. Liver Int. 2016, 36, 317–324. [Google Scholar] [CrossRef] [Green Version]
- Karagozian, R.; Derdak, Z.; Baffy, G. Obesity-associated mechanisms of hepatocarcinogenesis. Metab. Clin. Exp. 2014, 63, 607–617. [Google Scholar] [CrossRef]
- Thorgeirsson, S.S.; Grisham, J.W. Molecular pathogenesis of human hepatocellular carcinoma. Nat. Genet. 2002, 31, 339–346. [Google Scholar] [CrossRef]
- Farazi, P.A.; DePinho, R.A. Hepatocellular carcinoma pathogenesis: From genes to environment. Nat. Rev. Cancer 2006, 6, 674–687. [Google Scholar] [CrossRef]
- Kanwal, F.; Kramer, J.R.; Mapakshi, S.; Natarajan, Y.; Chayanupatkul, M.; Richardson, P.A.; Li, L.; Desiderio, R.; Thrift, A.P.; Asch, S.M.; et al. Risk of Hepatocellular Cancer in Patients With Non-Alcoholic Fatty Liver Disease. Gastroenterology 2018, 155, 1828–1837. [Google Scholar] [CrossRef] [Green Version]
- Yang, J.D.; Ahmed, F.; Mara, K.C.; Addissie, B.D.; Allen, A.M.; Gores, G.J.; Roberts, L.R. Diabetes Is Associated With Increased Risk of Hepatocellular Carcinoma in Patients With Cirrhosis From Nonalcoholic Fatty Liver Disease. Hepatology 2020, 71, 907–916. [Google Scholar] [CrossRef] [PubMed]
- Llovet, J.M.; Zucman-Rossi, J.; Pikarsky, E.; Sangro, B.; Schwartz, M.; Sherman, M.; Gores, G. Hepatocellular carcinoma. Nat. Rev. Dis. Primers 2016, 2, 16018. [Google Scholar] [CrossRef] [PubMed]
- Loomba, R.; Lim, J.K.; Patton, H.; El-Serag, H.B. AGA Clinical Practice Update on Screening and Surveillance for Hepatocellular Carcinoma in Patients With Nonalcoholic Fatty Liver Disease: Expert Review. Gastroenterology 2020, 158, 1822–1830. [Google Scholar] [CrossRef] [PubMed] [Green Version]
- Cholankeril, G.; Patel, R.; Khurana, S.; Satapathy, S.K. Hepatocellular carcinoma in non-alcoholic steatohepatitis: Current knowledge and implications for management. World J. Hepatol. 2017, 9, 533–543. [Google Scholar] [CrossRef]
- Mittal, S.; Sada, Y.H.; El-Serag, H.B.; Kanwal, F.; Duan, Z.; Temple, S.; May, S.B.; Kramer, J.R.; Richardson, P.A.; Davila, J.A. Temporal trends of nonalcoholic fatty liver disease-related hepatocellular carcinoma in the veteran affairs population. Clin. Gastroenterol. Hepatol. 2015, 13, 594–601. [Google Scholar] [CrossRef] [Green Version]
- Guzman, G.; Brunt, E.M.; Petrovic, L.M.; Chejfec, G.; Layden, T.J.; Cotler, S.J. Does nonalcoholic fatty liver disease predispose patients to hepatocellular carcinoma in the absence of cirrhosis? Arch. Pathol. Lab. Med. 2008, 132, 1761–1766. [Google Scholar] [CrossRef]
- Marrero, J.A.; Fontana, R.J.; Su, G.L.; Conjeevaram, H.S.; Emick, D.M.; Lok, A.S. NAFLD may be a common underlying liver disease in patients with hepatocellular carcinoma in the United States. Hepatology 2002, 36, 1349–1354. [Google Scholar] [CrossRef]
- Reddy, S.K.; Steel, J.L.; Chen, H.W.; DeMateo, D.J.; Cardinal, J.; Behari, J.; Humar, A.; Marsh, J.W.; Geller, D.A.; Tsung, A. Outcomes of curative treatment for hepatocellular cancer in nonalcoholic steatohepatitis versus hepatitis C and alcoholic liver disease. Hepatology 2012, 55, 1809–1819. [Google Scholar] [CrossRef]
- Noureddin, M.; Rinella, M.E. Nonalcoholic Fatty liver disease, diabetes, obesity, and hepatocellular carcinoma. Clin. Liver Dis. 2015, 19, 361–379. [Google Scholar] [CrossRef]
- Plaz Torres, M.C.; Bodini, G.; Furnari, M.; Marabotto, E.; Zentilin, P.; Strazzabosco, M.; Giannini, E.G. Surveillance for Hepatocellular Carcinoma in Patients with Non-Alcoholic Fatty Liver Disease: Universal or Selective? Cancers 2020, 12, 1422. [Google Scholar] [CrossRef]
- Srinivasa Babu, A.; Wells, M.L.; Teytelboym, O.M.; Mackey, J.E.; Miller, F.H.; Yeh, B.M.; Ehman, R.L.; Venkatesh, S.K. Elastography in Chronic Liver Disease: Modalities, Techniques, Limitations, and Future Directions. Radiographics 2016, 36, 1987–2006. [Google Scholar] [CrossRef] [PubMed]
- Sarvazyan, A.; Hall, T.J.; Urban, M.W.; Fatemi, M.; Aglyamov, S.R.; Garra, B.S. An Overview of Elastography—An Emerging Branch of Medical Imaging. Curr. Med. Imaging Rev. 2011, 7, 255–282. [Google Scholar] [CrossRef] [PubMed]
- Ferraioli, G.; Filice, C.; Castera, L.; Choi, B.I.; Sporea, I.; Wilson, S.R.; Cosgrove, D.; Dietrich, C.F.; Amy, D.; Bamber, J.C.; et al. WFUMB guidelines and recommendations for clinical use of ultrasound elastography: Part 3: Liver. Ultrasound Med. Biol. 2015, 41, 1161–1179. [Google Scholar] [CrossRef] [PubMed] [Green Version]
- European Association for Study of, L.; Asociacion Latinoamericana para el Estudio del, H. EASL-ALEH Clinical Practice Guidelines: Non-invasive tests for evaluation of liver disease severity and prognosis. J. Hepatol. 2015, 63, 237–264. [Google Scholar] [CrossRef] [Green Version]
- Dietrich, C.F.; Bamber, J.; Berzigotti, A.; Bota, S.; Cantisani, V.; Castera, L.; Cosgrove, D.; Ferraioli, G.; Friedrich-Rust, M.; Gilja, O.H.; et al. EFSUMB Guidelines and Recommendations on the Clinical Use of Liver Ultrasound Elastography, Update 2017 (Long Version). Ultraschall Med. 2017, 38, e16–e47. [Google Scholar] [CrossRef] [Green Version]
- Jung, K.S.; Kim, S.U. Clinical applications of transient elastography. Clin. Mol. Hepatol. 2012, 18, 163–173. [Google Scholar] [CrossRef]
- Ferraioli, G. Review of Liver Elastography Guidelines. J. Ultrasound Med. 2019, 38, 9–14. [Google Scholar] [CrossRef] [Green Version]
- Sigrist, R.M.S.; Liau, J.; Kaffas, A.E.; Chammas, M.C.; Willmann, J.K. Ultrasound Elastography: Review of Techniques and Clinical Applications. Theranostics 2017, 7, 1303–1329. [Google Scholar] [CrossRef]
- Lupsor-Platon, M. Noninvasive Evaluation of Fibrosis and Steatosis in Nonalcoholic Fatty Liver Disease by Elastographic Methods. In Non-Alcoholic Fatty Liver Disease, Molecular Bases, Prevention and Treatment; Baez, R.V., Ed.; IntechOpen: London, UK, 2017. [Google Scholar] [CrossRef] [Green Version]
- Mikolasevic, I.; Orlic, L.; Franjic, N.; Hauser, G.; Stimac, D.; Milic, S. Transient elastography (FibroScan((R))) with controlled attenuation parameter in the assessment of liver steatosis and fibrosis in patients with nonalcoholic fatty liver disease—Where do we stand? World J. Gastroenterol. 2016, 22, 7236–7251. [Google Scholar] [CrossRef]
- Papatheodoridi, M.; Cholongitas, E. Diagnosis of Non-alcoholic Fatty Liver Disease (NAFLD): Current Concepts. Curr. Pharm. Des. 2018, 24, 4574–4586. [Google Scholar] [CrossRef]
- Wong, G.L.; Wong, V.W.; Chim, A.M.; Yiu, K.K.; Chu, S.H.; Li, M.K.; Chan, H.L. Factors associated with unreliable liver stiffness measurement and its failure with transient elastography in the Chinese population. J. Gastroenterol. Hepatol. 2011, 26, 300–305. [Google Scholar] [CrossRef] [PubMed]
- Myers, R.P.; Pomier-Layrargues, G.; Kirsch, R.; Pollett, A.; Duarte-Rojo, A.; Wong, D.; Beaton, M.; Levstik, M.; Crotty, P.; Elkashab, M. Feasibility and diagnostic performance of the FibroScan XL probe for liver stiffness measurement in overweight and obese patients. Hepatology 2012, 55, 199–208. [Google Scholar] [CrossRef] [PubMed]
- Xia, B.; Wang, F.; Friedrich-Rust, M.; Zhou, F.; Zhu, J.; Yang, H.; Ruan, W.; Zeng, Z. Feasibility and Efficacy of Transient Elastography using the XL probe to diagnose liver fibrosis and cirrhosis: A meta-analysis. Medicine 2018, 97, e11816. [Google Scholar] [CrossRef] [PubMed]
- Arieira, C.; Monteiro, S.; Xavier, S.; Dias de Castro, F.; Magalhaes, J.; Marinho, C.; Pinto, R.; Costa, W.; Pinto Correia, J.; Cotter, J. Transient elastography: Should XL probe be used in all overweight patients? Scand. J. Gastroenterol. 2019, 54, 1022–1026. [Google Scholar] [CrossRef] [PubMed]
- Sasso, M.; Beaugrand, M.; de Ledinghen, V.; Douvin, C.; Marcellin, P.; Poupon, R.; Sandrin, L.; Miette, V. Controlled attenuation parameter (CAP): A novel VCTE guided ultrasonic attenuation measurement for the evaluation of hepatic steatosis: Preliminary study and validation in a cohort of patients with chronic liver disease from various causes. Ultrasound Med. Biol. 2010, 36, 1825–1835. [Google Scholar] [CrossRef]
- Ferraioli, G.; Wong, V.W.; Castera, L.; Berzigotti, A.; Sporea, I.; Dietrich, C.F.; Choi, B.I.; Wilson, S.R.; Kudo, M.; Barr, R.G. Liver Ultrasound Elastography: An Update to the World Federation for Ultrasound in Medicine and Biology Guidelines and Recommendations. Ultrasound Med. Biol. 2018, 44, 2419–2440. [Google Scholar] [CrossRef] [Green Version]
- Sasso, M.; Miette, V.; Sandrin, L.; Beaugrand, M. The controlled attenuation parameter (CAP): A novel tool for the non-invasive evaluation of steatosis using Fibroscan. Clin. Res. Hepatol. Gastroenterol. 2012, 36, 13–20. [Google Scholar] [CrossRef]
- Karlas, T.; Petroff, D.; Sasso, M.; Fan, J.G.; Mi, Y.Q.; de Ledinghen, V.; Kumar, M.; Lupsor-Platon, M.; Han, K.H.; Cardoso, A.C.; et al. Individual patient data meta-analysis of controlled attenuation parameter (CAP) technology for assessing steatosis. J. Hepatol. 2017, 66, 1022–1030. [Google Scholar] [CrossRef]
- de Ledinghen, V.; Vergniol, J.; Capdepont, M.; Chermak, F.; Hiriart, J.B.; Cassinotto, C.; Merrouche, W.; Foucher, J.; Brigitte le, B. Controlled attenuation parameter (CAP) for the diagnosis of steatosis: A prospective study of 5323 examinations. J. Hepatol. 2014, 60, 1026–1031. [Google Scholar] [CrossRef]
- de Ledinghen, V.; Hiriart, J.B.; Vergniol, J.; Merrouche, W.; Bedossa, P.; Paradis, V. Controlled Attenuation Parameter (CAP) with the XL Probe of the Fibroscan((R)): A Comparative Study with the M Probe and Liver Biopsy. Dig. Dis. Sci. 2017, 62, 2569–2577. [Google Scholar] [CrossRef]
- Chan, W.K.; Nik Mustapha, N.R.; Mahadeva, S.; Wong, V.W.; Cheng, J.Y.; Wong, G.L. Can the same controlled attenuation parameter cut-offs be used for M and XL probes for diagnosing hepatic steatosis? J. Gastroenterol. Hepatol. 2018, 33, 1787–1794. [Google Scholar] [CrossRef] [PubMed]
- Sasso, M.; Audiere, S.; Kemgang, A.; Gaouar, F.; Corpechot, C.; Chazouilleres, O.; Fournier, C.; Golsztejn, O.; Prince, S.; Menu, Y.; et al. Liver Steatosis Assessed by Controlled Attenuation Parameter (CAP) Measured with the XL Probe of the FibroScan: A Pilot Study Assessing Diagnostic Accuracy. Ultrasound Med. Biol. 2016, 42, 92–103. [Google Scholar] [CrossRef] [PubMed]
- Lupsor, M.; Badea, R.; Stefanescu, H.; Sparchez, Z.; Branda, H.; Serban, A.; Maniu, A. Performance of a new elastographic method (ARFI technology) compared to unidimensional transient elastography in the noninvasive assessment of chronic hepatitis C. Preliminary results. J. Gastrointest. Liver Dis. JGLD 2009, 18, 303–310. [Google Scholar]
- Zhai, L.; Palmeri, M.L.; Bouchard, R.R.; Nightingale, R.W.; Nightingale, K.R. An integrated indenter-ARFI imaging system for tissue stiffness quantification. Ultrason. Imaging 2008, 30, 95–111. [Google Scholar] [CrossRef] [Green Version]
- Mauldin, F.W., Jr.; Zhu, H.T.; Behler, R.H.; Nichols, T.C.; Gallippi, C.M. Robust principal component analysis and clustering methods for automated classification of tissue response to ARFI excitation. Ultrasound Med. Biol. 2008, 34, 309–325. [Google Scholar] [CrossRef] [Green Version]
- Frulio, N.; Trillaud, H. Ultrasound elastography in liver. Diagn. Interv. Imaging 2013, 94, 515–534. [Google Scholar] [CrossRef] [Green Version]
- Kudo, M.; Shiina, T.; Moriyasu, F.; Iijima, H.; Tateishi, R.; Yada, N.; Fujimoto, K.; Morikawa, H.; Hirooka, M.; Sumino, Y.; et al. JSUM ultrasound elastography practice guidelines: Liver. J. Med Ultrason. 2013, 40, 325–357. [Google Scholar] [CrossRef]
- Lupsor-Platon, M.; Badea, R.; Gersak, M.; Maniu, A.; Rusu, I.; Suciu, A.; Vicas, C.; Stefanescu, H.; Urs, R.; Al Hajjar, N. Noninvasive Assessment of Liver Diseases using 2D Shear Wave Elastography. J. Gastrointest. Liver Dis. JGLD 2016, 25, 525–532. [Google Scholar] [CrossRef]
- Rus, G.; Faris, I.H.; Torres, J.; Callejas, A.; Melchor, J. Why Are Viscosity and Nonlinearity Bound to Make an Impact in Clinical Elastographic Diagnosis? Sensors 2020, 20, 2379. [Google Scholar] [CrossRef]
- Mueller, S.; Sandrin, L. Liver stiffness: A novel parameter for the diagnosis of liver disease. Hepatic Med. Evid. Res. 2010, 2, 49–67. [Google Scholar] [CrossRef] [Green Version]
- Petta, S.; Maida, M.; Macaluso, F.S.; Di Marco, V.; Camma, C.; Cabibi, D.; Craxi, A. The severity of steatosis influences liver stiffness measurement in patients with nonalcoholic fatty liver disease. Hepatology 2015, 62, 1101–1110. [Google Scholar] [CrossRef] [PubMed]
- Petta, S.; Wong, V.W.; Camma, C.; Hiriart, J.B.; Wong, G.L.; Marra, F.; Vergniol, J.; Chan, A.W.; Di Marco, V.; Merrouche, W.; et al. Improved noninvasive prediction of liver fibrosis by liver stiffness measurement in patients with nonalcoholic fatty liver disease accounting for controlled attenuation parameter values. Hepatology 2017, 65, 1145–1155. [Google Scholar] [CrossRef] [PubMed]
- Wong, G.L.; Chan, H.L.; Choi, P.C.; Chan, A.W.; Lo, A.O.; Chim, A.M.; Wong, V.W. Association between anthropometric parameters and measurements of liver stiffness by transient elastography. Clin. Gastroenterol. Hepatol. 2013, 11, 295–302. [Google Scholar] [CrossRef]
- Wong, V.W.; Irles, M.; Wong, G.L.; Shili, S.; Chan, A.W.; Merrouche, W.; Shu, S.S.; Foucher, J.; Le Bail, B.; Chan, W.K.; et al. Unified interpretation of liver stiffness measurement by M and XL probes in non-alcoholic fatty liver disease. Gut 2019, 68, 2057–2064. [Google Scholar] [CrossRef]
- Tapper, E.B.; Loomba, R. Noninvasive imaging biomarker assessment of liver fibrosis by elastography in NAFLD. Nat. Rev. Gastroenterol. Hepatol. 2018, 15, 274–282. [Google Scholar] [CrossRef]
- Bamber, J.; Cosgrove, D.; Dietrich, C.F.; Fromageau, J.; Bojunga, J.; Calliada, F.; Cantisani, V.; Correas, J.M.; D’Onofrio, M.; Drakonaki, E.E.; et al. EFSUMB guidelines and recommendations on the clinical use of ultrasound elastography. Part 1: Basic principles and technology. Ultraschall Med. 2013, 34, 169–184. [Google Scholar] [CrossRef] [PubMed] [Green Version]
- Friedrich-Rust, M.; Romen, D.; Vermehren, J.; Kriener, S.; Sadet, D.; Herrmann, E.; Zeuzem, S.; Bojunga, J. Acoustic radiation force impulse-imaging and transient elastography for non-invasive assessment of liver fibrosis and steatosis in NAFLD. Eur. J. Radiol. 2012, 81, e325–e331. [Google Scholar] [CrossRef]
- Berzigotti, A.; Ferraioli, G.; Bota, S.; Gilja, O.H.; Dietrich, C.F. Novel ultrasound-based methods to assess liver disease: The game has just begun. Dig. Liver Dis. 2018, 50, 107–112. [Google Scholar] [CrossRef] [PubMed]
- Pfeifer, L.; Strobel, D.; Neurath, M.F.; Wildner, D. Liver stiffness assessed by acoustic radiation force impulse (ARFI) technology is considerably increased in patients with cholestasis. Ultraschall Med. 2014, 35, 364–367. [Google Scholar] [CrossRef]
- Wang, C.Z.; Zheng, J.; Huang, Z.P.; Xiao, Y.; Song, D.; Zeng, J.; Zheng, H.R.; Zheng, R.Q. Influence of measurement depth on the stiffness assessment of healthy liver with real-time shear wave elastography. Ultrasound Med. Biol. 2014, 40, 461–469. [Google Scholar] [CrossRef]
- Gersak, M.M.; Badea, R.; Lenghel, L.M.; Vasilescu, D.; Botar-Jid, C.; Dudea, S.M. Influence of Food Intake on 2-D Shear Wave Elastography Assessment of Liver Stiffness in Healthy Subjects. Ultrasound Med. Biol. 2016, 42, 1295–1302. [Google Scholar] [CrossRef] [PubMed]
- Abe, T.; Kuroda, H.; Fujiwara, Y.; Yoshida, Y.; Miyasaka, A.; Kamiyama, N.; Takikawa, Y. Accuracy of 2D shear wave elastography in the diagnosis of liver fibrosis in patients with chronic hepatitis C. J. Clin. Ultrasound 2018, 46, 319–327. [Google Scholar] [CrossRef] [PubMed]
- Wang, K.; Lu, X.; Zhou, H.; Gao, Y.; Zheng, J.; Tong, M.; Wu, C.; Liu, C.; Huang, L.; Jiang, T.; et al. Deep learning Radiomics of shear wave elastography significantly improved diagnostic performance for assessing liver fibrosis in chronic hepatitis B: A prospective multicentre study. Gut 2019, 68, 729–741. [Google Scholar] [CrossRef] [PubMed]
- Obara, N.; Ueno, Y.; Fukushima, K.; Nakagome, Y.; Kakazu, E.; Kimura, O.; Wakui, Y.; Kido, O.; Ninomiya, M.; Kogure, T.; et al. Transient elastography for measurement of liver stiffness measurement can detect early significant hepatic fibrosis in Japanese patients with viral and nonviral liver diseases. J. Gastroenterol. 2008, 43, 720–728. [Google Scholar] [CrossRef]
- Yoneda, M.; Yoneda, M.; Mawatari, H.; Fujita, K.; Endo, H.; Iida, H.; Nozaki, Y.; Yonemitsu, K.; Higurashi, T.; Takahashi, H.; et al. Noninvasive assessment of liver fibrosis by measurement of stiffness in patients with nonalcoholic fatty liver disease (NAFLD). Dig. Liver Dis. 2008, 40, 371–378. [Google Scholar] [CrossRef]
- Siddiqui, M.S.; Vuppalanchi, R.; Van Natta, M.L.; Hallinan, E.; Kowdley, K.V.; Abdelmalek, M.; Neuschwander-Tetri, B.A.; Loomba, R.; Dasarathy, S.; Brandman, D.; et al. Vibration-Controlled Transient Elastography to Assess Fibrosis and Steatosis in Patients With Nonalcoholic Fatty Liver Disease. Clin. Gastroenterol. Hepatol. 2019, 17, 156–163. [Google Scholar] [CrossRef]
- Kumar, R.; Rastogi, A.; Sharma, M.K.; Bhatia, V.; Tyagi, P.; Sharma, P.; Garg, H.; Chandan Kumar, K.N.; Bihari, C.; Sarin, S.K. Liver stiffness measurements in patients with different stages of nonalcoholic fatty liver disease: Diagnostic performance and clinicopathological correlation. Dig. Dis. Sci. 2013, 58, 265–274. [Google Scholar] [CrossRef]
- Petta, S.; Vanni, E.; Bugianesi, E.; Di Marco, V.; Camma, C.; Cabibi, D.; Mezzabotta, L.; Craxi, A. The combination of liver stiffness measurement and NAFLD fibrosis score improves the noninvasive diagnostic accuracy for severe liver fibrosis in patients with nonalcoholic fatty liver disease. Liver Int. Off. J. Int. Assoc. Study Liver 2015, 35, 1566–1573. [Google Scholar] [CrossRef] [Green Version]
- Xiao, G.; Zhu, S.; Xiao, X.; Yan, L.; Yang, J.; Wu, G. Comparison of laboratory tests, ultrasound, or magnetic resonance elastography to detect fibrosis in patients with nonalcoholic fatty liver disease: A meta-analysis. Hepatology 2017, 66, 1486–1501. [Google Scholar] [CrossRef]
- Eddowes, P.J.; Sasso, M.; Allison, M.; Tsochatzis, E.; Anstee, Q.M.; Sheridan, D.; Guha, I.N.; Cobbold, J.F.; Deeks, J.J.; Paradis, V.; et al. Accuracy of FibroScan Controlled Attenuation Parameter and Liver Stiffness Measurement in Assessing Steatosis and Fibrosis in Patients with Nonalcoholic Fatty Liver Disease. Gastroenterology 2019, 156, 1717–1730. [Google Scholar] [CrossRef] [Green Version]
- Furlan, A.; Tublin, M.E.; Yu, L.; Chopra, K.B.; Lippello, A.; Behari, J. Comparison of 2D Shear Wave Elastography, Transient Elastography, and MR Elastography for the Diagnosis of Fibrosis in Patients With Nonalcoholic Fatty Liver Disease. AJR Am. J. Roentgenol. 2020, 214, W20–W26. [Google Scholar] [CrossRef]
- Hsu, C.; Caussy, C.; Imajo, K.; Chen, J.; Singh, S.; Kaulback, K.; Le, M.D.; Hooker, J.; Tu, X.; Bettencourt, R.; et al. Magnetic Resonance vs Transient Elastography Analysis of Patients With Nonalcoholic Fatty Liver Disease: A Systematic Review and Pooled Analysis of Individual Participants. Clin. Gastroenterol. Hepatol. 2019, 17, 630–637. [Google Scholar] [CrossRef] [PubMed] [Green Version]
- Jiang, W.; Huang, S.; Teng, H.; Wang, P.; Wu, M.; Zhou, X.; Ran, H. Diagnostic accuracy of point shear wave elastography and transient elastography for staging hepatic fibrosis in patients with non-alcoholic fatty liver disease: A meta-analysis. BMJ Open 2018, 8, e021787. [Google Scholar] [CrossRef] [PubMed] [Green Version]
- Lee, M.S.; Bae, J.M.; Joo, S.K.; Woo, H.; Lee, D.H.; Jung, Y.J.; Kim, B.G.; Lee, K.L.; Kim, W. Prospective comparison among transient elastography, supersonic shear imaging, and ARFI imaging for predicting fibrosis in nonalcoholic fatty liver disease. PLoS ONE 2017, 12, e0188321. [Google Scholar] [CrossRef] [PubMed]
- Boursier, J.; Vergniol, J.; Guillet, A.; Hiriart, J.B.; Lannes, A.; Le Bail, B.; Michalak, S.; Chermak, F.; Bertrais, S.; Foucher, J.; et al. Diagnostic accuracy and prognostic significance of blood fibrosis tests and liver stiffness measurement by FibroScan in non-alcoholic fatty liver disease. J. Hepatol. 2016, 65, 570–578. [Google Scholar] [CrossRef]
- Cassinotto, C.; Boursier, J.; de Ledinghen, V.; Lebigot, J.; Lapuyade, B.; Cales, P.; Hiriart, J.B.; Michalak, S.; Bail, B.L.; Cartier, V.; et al. Liver stiffness in nonalcoholic fatty liver disease: A comparison of supersonic shear imaging, FibroScan, and ARFI with liver biopsy. Hepatology 2016, 63, 1817–1827. [Google Scholar] [CrossRef]
- Imajo, K.; Kessoku, T.; Honda, Y.; Tomeno, W.; Ogawa, Y.; Mawatari, H.; Fujita, K.; Yoneda, M.; Taguri, M.; Hyogo, H.; et al. Magnetic Resonance Imaging More Accurately Classifies Steatosis and Fibrosis in Patients With Nonalcoholic Fatty Liver Disease Than Transient Elastography. Gastroenterology 2016, 150, 626–637. [Google Scholar] [CrossRef] [Green Version]
- Pathik, P.; Ravindra, S.; Ajay, C.; Prasad, B.; Jatin, P.; Prabha, S. Fibroscan versus simple noninvasive screening tools in predicting fibrosis in high-risk nonalcoholic fatty liver disease patients from Western India. Ann. Gastroenterol. 2015, 28, 281–286. [Google Scholar]
- Kwok, R.; Tse, Y.K.; Wong, G.L.; Ha, Y.; Lee, A.U.; Ngu, M.C.; Chan, H.L.; Wong, V.W. Systematic review with meta-analysis: Non-invasive assessment of non-alcoholic fatty liver disease—The role of transient elastography and plasma cytokeratin-18 fragments. Aliment. Pharmacol. Ther. 2014, 39, 254–269. [Google Scholar] [CrossRef]
- Lupsor, M.; Badea, R.; Stefanescu, H.; Grigorescu, M.; Serban, A.; Radu, C.; Crisan, D.; Sparchez, Z.; Iancu, S.; Maniu, A. Performance of unidimensional transient elastography in staging non-alcoholic steatohepatitis. J. Gastrointest. Liver Dis. 2010, 19, 53–60. [Google Scholar]
- Wong, V.W.; Vergniol, J.; Wong, G.L.; Foucher, J.; Chan, H.L.; Le Bail, B.; Choi, P.C.; Kowo, M.; Chan, A.W.; Merrouche, W.; et al. Diagnosis of fibrosis and cirrhosis using liver stiffness measurement in nonalcoholic fatty liver disease. Hepatology 2010, 51, 454–462. [Google Scholar] [CrossRef] [PubMed]
- Lupsor-Platon, M. Noninvasive Assessment of Diffuse Liver Diseases Using Vibration-Controlled Transient Elastography (VCTE); Lupsor-Platon, M., Ed.; IntechOpen: London, UK, 2019; Volume Ultrasound Elastography. [Google Scholar]
- Castera, L.; Foucher, J.; Bernard, P.H.; Carvalho, F.; Allaix, D.; Merrouche, W.; Couzigou, P.; de Ledinghen, V. Pitfalls of liver stiffness measurement: A 5-year prospective study of 13,369 examinations. Hepatology 2010, 51, 828–835. [Google Scholar] [CrossRef] [PubMed]
- Foucher, J.; Castera, L.; Bernard, P.H.; Adhoute, X.; Laharie, D.; Bertet, J.; Couzigou, P.; de Ledinghen, V. Prevalence and factors associated with failure of liver stiffness measurement using FibroScan in a prospective study of 2114 examinations. Eur. J. Gastroenterol. Hepatol. 2006, 18, 411–412. [Google Scholar] [CrossRef] [PubMed]
- Wong, V.W.; Vergniol, J.; Wong, G.L.; Foucher, J.; Chan, A.W.; Chermak, F.; Choi, P.C.; Merrouche, W.; Chu, S.H.; Pesque, S.; et al. Liver stiffness measurement using XL probe in patients with nonalcoholic fatty liver disease. Am. J. Gastroenterol. 2012, 107, 1862–1871. [Google Scholar] [CrossRef]
- Oeda, S.; Takahashi, H.; Imajo, K.; Seko, Y.; Ogawa, Y.; Moriguchi, M.; Yoneda, M.; Anzai, K.; Aishima, S.; Kage, M.; et al. Accuracy of liver stiffness measurement and controlled attenuation parameter using FibroScan((R)) M/XL probes to diagnose liver fibrosis and steatosis in patients with nonalcoholic fatty liver disease: A multicenter prospective study. J. Gastroenterol. 2020, 55, 428–440. [Google Scholar] [CrossRef]
- Zhang, X.; Wong, G.L.; Wong, V.W. Application of transient elastography in nonalcoholic fatty liver disease. Clin. Mol. Hepatol. 2020, 26, 128–141. [Google Scholar] [CrossRef] [Green Version]
- Friedrich-Rust, M.; Nierhoff, J.; Lupsor, M.; Sporea, I.; Fierbinteanu-Braticevici, C.; Strobel, D.; Takahashi, H.; Yoneda, M.; Suda, T.; Zeuzem, S.; et al. Performance of Acoustic Radiation Force Impulse imaging for the staging of liver fibrosis: A pooled meta-analysis. J. Viral Hepat. 2012, 19, e212–e219. [Google Scholar] [CrossRef]
- Palmeri, M.L.; Wang, M.H.; Rouze, N.C.; Abdelmalek, M.F.; Guy, C.D.; Moser, B.; Diehl, A.M.; Nightingale, K.R. Noninvasive evaluation of hepatic fibrosis using acoustic radiation force-based shear stiffness in patients with nonalcoholic fatty liver disease. J. Hepatol. 2011, 55, 666–672. [Google Scholar] [CrossRef] [Green Version]
- Fierbinteanu Braticevici, C.; Sporea, I.; Panaitescu, E.; Tribus, L. Value of acoustic radiation force impulse imaging elastography for non-invasive evaluation of patients with nonalcoholic fatty liver disease. Ultrasound Med. Biol. 2013, 39, 1942–1950. [Google Scholar] [CrossRef]
- Guzman-Aroca, F.; Frutos-Bernal, M.D.; Bas, A.; Lujan-Mompean, J.A.; Reus, M.; Berna-Serna Jde, D.; Parrilla, P. Detection of non-alcoholic steatohepatitis in patients with morbid obesity before bariatric surgery: Preliminary evaluation with acoustic radiation force impulse imaging. Eur. Radiol. 2012, 22, 2525–2532. [Google Scholar] [CrossRef]
- Osaki, A.; Kubota, T.; Suda, T.; Igarashi, M.; Nagasaki, K.; Tsuchiya, A.; Yano, M.; Tamura, Y.; Takamura, M.; Kawai, H.; et al. Shear wave velocity is a useful marker for managing nonalcoholic steatohepatitis. World J. Gastroenterol. 2010, 16, 2918–2925. [Google Scholar] [CrossRef] [PubMed]
- Liu, H.; Fu, J.; Hong, R.; Liu, L.; Li, F. Acoustic Radiation Force Impulse Elastography for the Non-Invasive Evaluation of Hepatic Fibrosis in Non-Alcoholic Fatty Liver Disease Patients: A Systematic Review & Meta-Analysis. PLoS ONE 2015, 10, e0127782. [Google Scholar] [CrossRef] [Green Version]
- Lin, Y.; Li, H.; Jin, C.; Wang, H.; Jiang, B. The diagnostic accuracy of liver fibrosis in non-viral liver diseases using acoustic radiation force impulse elastography: A systematic review and meta-analysis. PLoS ONE 2020, 15, e0227358. [Google Scholar] [CrossRef] [Green Version]
- Jiang, T.; Tian, G.; Zhao, Q.; Kong, D.; Cheng, C.; Zhong, L.; Li, L. Diagnostic Accuracy of 2D-Shear Wave Elastography for Liver Fibrosis Severity: A Meta-Analysis. PLoS ONE 2016, 11, e0157219. [Google Scholar] [CrossRef]
- Li, C.; Zhang, C.; Li, J.; Huo, H.; Song, D. Diagnostic Accuracy of Real-Time Shear Wave Elastography for Staging of Liver Fibrosis: A Meta-Analysis. Med. Sci. Monit. 2016, 22, 1349–1359. [Google Scholar] [CrossRef] [PubMed] [Green Version]
- Lee, D.H.; Cho, E.J.; Bae, J.S.; Lee, J.Y.; Yu, S.J.; Kim, H.; Lee, K.B.; Han, J.K.; Choi, B.I. Accuracy of 2-dimensional Shear Wave Elastography and Attenuation Imaging for Evaluation of Patients With Nonalcoholic Steatohepatitis. Clin. Gastroenterol. Hepatol. 2020. [Google Scholar] [CrossRef] [PubMed]
- Takeuchi, H.; Sugimoto, K.; Oshiro, H.; Iwatsuka, K.; Kono, S.; Yoshimasu, Y.; Kasai, Y.; Furuichi, Y.; Sakamaki, K.; Itoi, T. Liver fibrosis: Noninvasive assessment using supersonic shear imaging and FIB4 index in patients with non-alcoholic fatty liver disease. J. Med. Ultrason. 2018, 45, 243–249. [Google Scholar] [CrossRef]
- Cui, J.; Heba, E.; Hernandez, C.; Haufe, W.; Hooker, J.; Andre, M.P.; Valasek, M.A.; Aryafar, H.; Sirlin, C.B.; Loomba, R. Magnetic resonance elastography is superior to acoustic radiation force impulse for the Diagnosis of fibrosis in patients with biopsy-proven nonalcoholic fatty liver disease: A prospective study. Hepatology 2016, 63, 453–461. [Google Scholar] [CrossRef]
- Cassinotto, C.; Lapuyade, B.; Ait-Ali, A.; Vergniol, J.; Gaye, D.; Foucher, J.; Bailacq-Auder, C.; Chermak, F.; Le Bail, B.; de Ledinghen, V. Liver fibrosis: Noninvasive assessment with acoustic radiation force impulse elastography--comparison with FibroScan M and XL probes and FibroTest in patients with chronic liver disease. Radiology 2013, 269, 283–292. [Google Scholar] [CrossRef]
- Yoneda, M.; Suzuki, K.; Kato, S.; Fujita, K.; Nozaki, Y.; Hosono, K.; Saito, S.; Nakajima, A. Nonalcoholic fatty liver disease: US-based acoustic radiation force impulse elastography. Radiology 2010, 256, 640–647. [Google Scholar] [CrossRef] [Green Version]
- Herrmann, E.; de Ledinghen, V.; Cassinotto, C.; Chu, W.C.; Leung, V.Y.; Ferraioli, G.; Filice, C.; Castera, L.; Vilgrain, V.; Ronot, M.; et al. Assessment of biopsy-proven liver fibrosis by two-dimensional shear wave elastography: An individual patient data-based meta-analysis. Hepatology 2018, 67, 260–272. [Google Scholar] [CrossRef] [PubMed]
- Ochi, H.; Hirooka, M.; Koizumi, Y.; Miyake, T.; Tokumoto, Y.; Soga, Y.; Tada, F.; Abe, M.; Hiasa, Y.; Onji, M. Real-time tissue elastography for evaluation of hepatic fibrosis and portal hypertension in nonalcoholic fatty liver diseases. Hepatology 2012, 56, 1271–1278. [Google Scholar] [CrossRef] [PubMed]
- Lupsor-Platon, M.; Feier, D.; Stefanescu, H.; Tamas, A.; Botan, E.; Sparchez, Z.; Maniu, A.; Badea, R. Diagnostic accuracy of controlled attenuation parameter measured by transient elastography for the non-invasive assessment of liver steatosis: A prospective study. J. Gastrointest. Liver Dis. 2015, 24, 35–42. [Google Scholar] [CrossRef] [PubMed]
- Wang, Y.; Fan, Q.; Wang, T.; Wen, J.; Wang, H.; Zhang, T. Controlled attenuation parameter for assessment of hepatic steatosis grades: A diagnostic meta-analysis. Int. J. Clin. Exp. Med. 2015, 8, 17654–17663. [Google Scholar]
- Shen, F.; Zheng, R.D.; Mi, Y.Q.; Wang, X.Y.; Pan, Q.; Chen, G.Y.; Cao, H.X.; Chen, M.L.; Xu, L.; Chen, J.N.; et al. Controlled attenuation parameter for non-invasive assessment of hepatic steatosis in Chinese patients. World J. Gastroenterol. 2014, 20, 4702–4711. [Google Scholar] [CrossRef]
- Ferraioli, G.; Soares Monteiro, L.B. Ultrasound-based techniques for the diagnosis of liver steatosis. World J. Gastroenterol. 2019, 25, 6053–6062. [Google Scholar] [CrossRef]
- Pu, K.; Wang, Y.; Bai, S.; Wei, H.; Zhou, Y.; Fan, J.; Qiao, L. Diagnostic accuracy of controlled attenuation parameter (CAP) as a non-invasive test for steatosis in suspected non-alcoholic fatty liver disease: A systematic review and meta-analysis. BMC Gastroenterol. 2019, 19, 51. [Google Scholar] [CrossRef] [Green Version]
- Angulo, P.; Kleiner, D.E.; Dam-Larsen, S.; Adams, L.A.; Bjornsson, E.S.; Charatcharoenwitthaya, P.; Mills, P.R.; Keach, J.C.; Lafferty, H.D.; Stahler, A.; et al. Liver Fibrosis, but No Other Histologic Features, Is Associated With Long-term Outcomes of Patients With Nonalcoholic Fatty Liver Disease. Gastroenterology 2015, 149, 389–397. [Google Scholar] [CrossRef] [Green Version]
- Ekstedt, M.; Hagstrom, H.; Nasr, P.; Fredrikson, M.; Stal, P.; Kechagias, S.; Hultcrantz, R. Fibrosis stage is the strongest predictor for disease-specific mortality in NAFLD after up to 33 years of follow-up. Hepatology 2015, 61, 1547–1554. [Google Scholar] [CrossRef] [Green Version]
- Dulai, P.S.; Singh, S.; Patel, J.; Soni, M.; Prokop, L.J.; Younossi, Z.; Sebastiani, G.; Ekstedt, M.; Hagstrom, H.; Nasr, P.; et al. Increased risk of mortality by fibrosis stage in nonalcoholic fatty liver disease: Systematic review and meta-analysis. Hepatology 2017, 65, 1557–1565. [Google Scholar] [CrossRef]
- Hagstrom, H.; Nasr, P.; Ekstedt, M.; Hammar, U.; Stal, P.; Hultcrantz, R.; Kechagias, S. Fibrosis stage but not NASH predicts mortality and time to development of severe liver disease in biopsy-proven NAFLD. J. Hepatol. 2017, 67, 1265–1273. [Google Scholar] [CrossRef] [PubMed]
- Shili-Masmoudi, S.; Wong, G.L.; Hiriart, J.B.; Liu, K.; Chermak, F.; Shu, S.S.; Foucher, J.; Tse, Y.K.; Bernard, P.H.; Yip, T.C.; et al. Liver stiffness measurement predicts long-term survival and complications in non-alcoholic fatty liver disease. Liver Int. 2020, 40, 581–589. [Google Scholar] [CrossRef] [PubMed]
- Singh, S.; Fujii, L.L.; Murad, M.H.; Wang, Z.; Asrani, S.K.; Ehman, R.L.; Kamath, P.S.; Talwalkar, J.A. Liver stiffness is associated with risk of decompensation, liver cancer, and death in patients with chronic liver diseases: A systematic review and meta-analysis. Clin. Gastroenterol. Hepatol. 2013, 11, 1573–1584. [Google Scholar] [CrossRef] [PubMed] [Green Version]
- Masuzaki, R.; Tateishi, R.; Yoshida, H.; Yoshida, H.; Sato, S.; Kato, N.; Kanai, F.; Sugioka, Y.; Ikeda, H.; Shiina, S.; et al. Risk assessment of hepatocellular carcinoma in chronic hepatitis C patients by transient elastography. J. Clin. Gastroenterol. 2008, 42, 839–843. [Google Scholar] [CrossRef] [PubMed]
- Masuzaki, R.; Tateishi, R.; Yoshida, H.; Goto, E.; Sato, T.; Ohki, T.; Imamura, J.; Goto, T.; Kanai, F.; Kato, N.; et al. Prospective risk assessment for hepatocellular carcinoma development in patients with chronic hepatitis C by transient elastography. Hepatology 2009, 49, 1954–1961. [Google Scholar] [CrossRef]
- Feier, D.; Lupsor Platon, M.; Stefanescu, H.; Badea, R. Transient elastography for the detection of hepatocellular carcinoma in viral C liver cirrhosis. Is there something else than increased liver stiffness? J. Gastrointest. Liver Dis. 2013, 22, 283–289. [Google Scholar]
- Jung, K.S.; Kim, S.U.; Ahn, S.H.; Park, Y.N.; Kim, D.Y.; Park, J.Y.; Chon, C.Y.; Choi, E.H.; Han, K.H. Risk assessment of hepatitis B virus-related hepatocellular carcinoma development using liver stiffness measurement (FibroScan). Hepatology 2011, 53, 885–894. [Google Scholar] [CrossRef]
- Jeon, M.Y.; Lee, H.W.; Kim, S.U.; Heo, J.Y.; Han, S.; Kim, B.K.; Park, J.Y.; Kim, D.Y.; Ahn, S.H.; Han, K.H. Subcirrhotic liver stiffness by FibroScan correlates with lower risk of hepatocellular carcinoma in patients with HBV-related cirrhosis. Hepatol. Int. 2017, 11, 268–276. [Google Scholar] [CrossRef]
- Kim, D.Y.; Song, K.J.; Kim, S.U.; Yoo, E.J.; Park, J.Y.; Ahn, S.H.; Han, K.H. Transient elastography-based risk estimation of hepatitis B virus-related occurrence of hepatocellular carcinoma: Development and validation of a predictive model. OncoTargets Ther. 2013, 6, 1463–1469. [Google Scholar] [CrossRef] [Green Version]
- Wong, G.L.; Chan, H.L.; Wong, C.K.; Leung, C.; Chan, C.Y.; Ho, P.P.; Chung, V.C.; Chan, Z.C.; Tse, Y.K.; Chim, A.M.; et al. Liver stiffness-based optimization of hepatocellular carcinoma risk score in patients with chronic hepatitis B. J. Hepatol. 2014, 60, 339–345. [Google Scholar] [CrossRef]
- Lee, H.W.; Ahn, S.H. Prediction models of hepatocellular carcinoma development in chronic hepatitis B patients. World J. Gastroenterol. 2016, 22, 8314–8321. [Google Scholar] [CrossRef] [PubMed]
- Margini, C.; Murgia, G.; Stirnimann, G.; De Gottardi, A.; Semmo, N.; Casu, S.; Bosch, J.; Dufour, J.F.; Berzigotti, A. Prognostic Significance of Controlled Attenuation Parameter in Patients With Compensated Advanced Chronic Liver Disease. Hepatol. Commun. 2018, 2, 929–940. [Google Scholar] [CrossRef] [PubMed] [Green Version]
- Liu, K.; Wong, V.W.; Lau, K.; Liu, S.D.; Tse, Y.K.; Yip, T.C.; Kwok, R.; Chan, A.Y.; Chan, H.L.; Wong, G.L. Prognostic Value of Controlled Attenuation Parameter by Transient Elastography. Am. J. Gastroenterol. 2017, 112, 1812–1823. [Google Scholar] [CrossRef] [PubMed]
- Scheiner, B.; Steininger, L.; Semmler, G.; Unger, L.W.; Schwabl, P.; Bucsics, T.; Paternostro, R.; Ferlitsch, A.; Trauner, M.; Reiberger, T.; et al. Controlled attenuation parameter does not predict hepatic decompensation in patients with advanced chronic liver disease. Liver Int. Off. J. Int. Assoc. Study Liver 2019, 39, 127–135. [Google Scholar] [CrossRef] [PubMed] [Green Version]
- Akima, T.; Tamano, M.; Hiraishi, H. Liver stiffness measured by transient elastography is a predictor of hepatocellular carcinoma development in viral hepatitis. Hepatol. Res. 2011, 41, 965–970. [Google Scholar] [CrossRef] [PubMed]
- Merchante, N.; Rivero-Juarez, A.; Tellez, F.; Merino, D.; Jose Rios-Villegas, M.; Marquez-Solero, M.; Omar, M.; Macias, J.; Camacho, A.; Perez-Perez, M.; et al. Liver stiffness predicts clinical outcome in human immunodeficiency virus/hepatitis C virus-coinfected patients with compensated liver cirrhosis. Hepatology 2012, 56, 228–238. [Google Scholar] [CrossRef]
- Park, H.; Park, J.Y.; Kim, D.Y.; Ahn, S.H.; Chon, C.Y.; Han, K.H.; Kim, S.U. Characterization of focal liver masses using acoustic radiation force impulse elastography. World J. Gastroenterol. 2013, 19, 219–226. [Google Scholar] [CrossRef]
- Akdogan, E.; Yilmaz, F.G. The role of acoustic radiation force impulse elastography in the differentiation of benign and malignant focal liver masses. Turk. J. Gastroenterol. 2018, 29, 456–463. [Google Scholar] [CrossRef] [Green Version]
- Kim, J.E.; Lee, J.Y.; Bae, K.S.; Han, J.K.; Choi, B.I. Acoustic radiation force impulse elastography for focal hepatic tumors: Usefulness for differentiating hemangiomas from malignant tumors. Korean J. Radiol. 2013, 14, 743–753. [Google Scholar] [CrossRef] [Green Version]
- Davies, G.; Koenen, M. Acoustic radiation force impulse elastography in distinguishing hepatic haemangiomata from metastases: Preliminary observations. Br. J. Radiol. 2011, 84, 939–943. [Google Scholar] [CrossRef]
- Gallotti, A.; D’Onofrio, M.; Romanini, L.; Cantisani, V.; Pozzi Mucelli, R. Acoustic Radiation Force Impulse (ARFI) ultrasound imaging of solid focal liver lesions. Eur. J. Radiol. 2012, 81, 451–455. [Google Scholar] [CrossRef] [PubMed]
- Frulio, N.; Laumonier, H.; Carteret, T.; Laurent, C.; Maire, F.; Balabaud, C.; Bioulac-Sage, P.; Trillaud, H. Evaluation of liver tumors using acoustic radiation force impulse elastography and correlation with histologic data. J. Ultrasound Med. 2013, 32, 121–130. [Google Scholar] [CrossRef] [PubMed]
- Dong, Y.; Wang, W.P.; Xu, Y.; Cao, J.; Mao, F.; Dietrich, C.F. Point shear wave speed measurement in differentiating benign and malignant focal liver lesions. Med. Ultrason. 2017, 19, 259–264. [Google Scholar] [CrossRef] [PubMed] [Green Version]
- Guo, L.H.; Wang, S.J.; Xu, H.X.; Sun, L.P.; Zhang, Y.F.; Xu, J.M.; Wu, J.; Fu, H.J.; Xu, X.H. Differentiation of benign and malignant focal liver lesions: Value of virtual touch tissue quantification of acoustic radiation force impulse elastography. Med. Oncol. 2015, 32, 68. [Google Scholar] [CrossRef] [PubMed]
- Zhang, P.; Zhou, P.; Tian, S.M.; Qian, Y.; Li, J.L.; Li, R.Z. Diagnostic performance of contrast-enhanced sonography and acoustic radiation force impulse imaging in solid liver lesions. J. Ultrasound Med. 2014, 33, 205–214. [Google Scholar] [CrossRef] [PubMed]
- Yu, H.; Wilson, S.R. Differentiation of benign from malignant liver masses with Acoustic Radiation Force Impulse technique. Ultrasound Q. 2011, 27, 217–223. [Google Scholar] [CrossRef]
- Heide, R.; Strobel, D.; Bernatik, T.; Goertz, R.S. Characterization of focal liver lesions (FLL) with acoustic radiation force impulse (ARFI) elastometry. Ultraschall Med. 2010, 31, 405–409. [Google Scholar] [CrossRef]
- Galati, G.; De Vincentis, A.; Gallo, P.; Guidi, A.; Vespasiani-Gentilucci, U.; Picardi, A. Diagnostic value of Virtual Touch Quantification (VTQ(R)) for differentiation of hemangiomas from malignant focal liver lesions. Med. Ultrason. 2019, 21, 371–376. [Google Scholar] [CrossRef]
- Cho, S.H.; Lee, J.Y.; Han, J.K.; Choi, B.I. Acoustic radiation force impulse elastography for the evaluation of focal solid hepatic lesions: Preliminary findings. Ultrasound Med. Biol. 2010, 36, 202–208. [Google Scholar] [CrossRef]
- Wu, J.P.; Shu, R.; Zhao, Y.Z.; Ma, G.L.; Xue, W.; He, Q.J.; Hao, M.N.; Liu, Y. Comparison of contrast-enhanced ultrasonography with virtual touch tissue quantification in the evaluation of focal liver lesions. J. Clin. Ultrasound 2016, 44, 347–353. [Google Scholar] [CrossRef]
- Shuang-Ming, T.; Ping, Z.; Ying, Q.; Li-Rong, C.; Ping, Z.; Rui-Zhen, L. Usefulness of acoustic radiation force impulse imaging in the differential diagnosis of benign and malignant liver lesions. Acad. Radiol. 2011, 18, 810–815. [Google Scholar] [CrossRef] [PubMed]
- Kapoor, A.; Kapoor, A.; Mahajan, G.; Sidhu, B.S.; Lakhanpal, V.P. Real-time elastography in differentiating metastatic from nonmetastatic liver nodules. Ultrasound Med. Biol. 2011, 37, 207–213. [Google Scholar] [CrossRef] [PubMed]
- Ying, L.; Lin, X.; Xie, Z.L.; Tang, F.Y.; Hu, Y.P.; Shi, K.Q. Clinical utility of acoustic radiation force impulse imaging for identification of malignant liver lesions: A meta-analysis. Eur. Radiol. 2012, 22, 2798–2805. [Google Scholar] [CrossRef] [PubMed]
- Hasab Allah, M.; Salama, R.M.; Marie, M.S.; Mandur, A.A.; Omar, H. Utility of point shear wave elastography in characterisation of focal liver lesions. Expert Rev. Gastroenterol. Hepatol. 2018, 12, 201–207. [Google Scholar] [CrossRef]
- Frulio, N.; Trillaud, H.; Perez, P.; Asselineau, J.; Vandenhende, M.; Hessamfar, M.; Bonnet, F.; Maire, F.; Delaune, J.; De Ledinghen, V.; et al. Acoustic Radiation Force Impulse (ARFI) and Transient Elastography (TE) for evaluation of liver fibrosis in HIV-HCV co-infected patients. BMC Infect. Dis. 2014, 14, 405. [Google Scholar] [CrossRef]
- Taimr, P.; Klompenhouwer, A.J.; Thomeer, M.G.J.; Hansen, B.E.; Ijzermans, J.N.M.; de Man, R.A.; de Knegt, R.J. Can point shear wave elastography differentiate focal nodular hyperplasia from hepatocellular adenoma. J. Clin. Ultrasound 2018, 46, 380–385. [Google Scholar] [CrossRef] [Green Version]
- Hu, X.; Huang, X.; Chen, H.; Zhang, T.; Hou, J.; Song, A.; Ding, L.; Liu, W.; Wu, H.; Meng, F. Diagnostic effect of shear wave elastography imaging for differentiation of malignant liver lesions: A meta-analysis. BMC Gastroenterol. 2019, 19, 60. [Google Scholar] [CrossRef] [Green Version]
- Correas, J.M.; Tissier, A.M.; Khairoune, A.; Vassiliu, V.; Mejean, A.; Helenon, O.; Memo, R.; Barr, R.G. Prostate cancer: Diagnostic performance of real-time shear-wave elastography. Radiology 2015, 275, 280–289. [Google Scholar] [CrossRef] [Green Version]
- Zhang, B.; Ma, X.; Wu, N.; Liu, L.; Liu, X.; Zhang, J.; Yang, J.; Niu, T. Shear wave elastography for differentiation of benign and malignant thyroid nodules: A meta-analysis. J. Ultrasound Med. 2013, 32, 2163–2169. [Google Scholar] [CrossRef]
- Berg, W.A.; Cosgrove, D.O.; Dore, C.J.; Schafer, F.K.; Svensson, W.E.; Hooley, R.J.; Ohlinger, R.; Mendelson, E.B.; Balu-Maestro, C.; Locatelli, M.; et al. Shear-wave elastography improves the specificity of breast US: The BE1 multinational study of 939 masses. Radiology 2012, 262, 435–449. [Google Scholar] [CrossRef]
- Park, H.S.; Kim, Y.J.; Yu, M.H.; Jung, S.I.; Jeon, H.J. Shear Wave Elastography of Focal Liver Lesion: Intraobserver Reproducibility and Elasticity Characterization. Ultrasound Q. 2015, 31, 262–271. [Google Scholar] [CrossRef] [PubMed]
- Ronot, M.; Di Renzo, S.; Gregoli, B.; Duran, R.; Castera, L.; Van Beers, B.E.; Vilgrain, V. Characterization of fortuitously discovered focal liver lesions: Additional information provided by shearwave elastography. Eur. Radiol. 2015, 25, 346–358. [Google Scholar] [CrossRef] [PubMed]
- Gennisson, J.L.; Deffieux, T.; Fink, M.; Tanter, M. Ultrasound elastography: Principles and techniques. Diagn. Interv. Imaging 2013, 94, 487–495. [Google Scholar] [CrossRef] [PubMed]
- Tian, W.S.; Lin, M.X.; Zhou, L.Y.; Pan, F.S.; Huang, G.L.; Wang, W.; Lu, M.D.; Xie, X.Y. Maximum Value Measured by 2-D Shear Wave Elastography Helps in Differentiating Malignancy from Benign Focal Liver Lesions. Ultrasound Med. Biol. 2016, 42, 2156–2166. [Google Scholar] [CrossRef]
- Guibal, A.; Boularan, C.; Bruce, M.; Vallin, M.; Pilleul, F.; Walter, T.; Scoazec, J.Y.; Boublay, N.; Dumortier, J.; Lefort, T. Evaluation of shearwave elastography for the characterisation of focal liver lesions on ultrasound. Eur. Radiol. 2013, 23, 1138–1149. [Google Scholar] [CrossRef]
- Wang, W.; Zhang, J.C.; Tian, W.S.; Chen, L.D.; Zheng, Q.; Hu, H.T.; Wu, S.S.; Guo, Y.; Xie, X.Y.; Lu, M.D.; et al. Shear wave elastography-based ultrasomics: Differentiating malignant from benign focal liver lesions. Abdom. Radiol. 2020. [Google Scholar] [CrossRef]
- Grgurevic, I.; Bokun, T.; Salkic, N.N.; Brkljacic, B.; Vukelic-Markovic, M.; Stoos-Veic, T.; Aralica, G.; Rakic, M.; Filipec-Kanizaj, T.; Berzigotti, A. Liver elastography malignancy prediction score for noninvasive characterization of focal liver lesions. Liver Int. 2018, 38, 1055–1063. [Google Scholar] [CrossRef]
- Gerber, L.; Fitting, D.; Srikantharajah, K.; Weiler, N.; Kyriakidou, G.; Bojunga, J.; Schulze, F.; Bon, D.; Zeuzem, S.; Friedrich-Rust, M. Evaluation of 2D- Shear Wave Elastography for Characterisation of Focal Liver Lesions. J. Gastrointest. Liver Dis. 2017, 26, 283–290. [Google Scholar] [CrossRef]
- Hwang, J.A.; Jeong, W.K.; Song, K.D.; Kang, K.A.; Lim, H.K. 2-D Shear Wave Elastography for Focal Lesions in Liver Phantoms: Effects of Background Stiffness, Depth and Size of Focal Lesions on Stiffness Measurement. Ultrasound Med. Biol. 2019, 45, 3261–3268. [Google Scholar] [CrossRef]


| Elastographic Technique | Indications | Se (Min-Max)/Sp (Min-Max) according to the EASL-ALEH Guide [34] | Advantages | Limitations |
|---|---|---|---|---|
| VCTE | HCV: First-line assessment [34,35] | 56–97%/32–96% |
|
|
| HBV: Useful to identify cirrhotic patients | 52–98%/38–98% | |||
| NAFLD: Can be used to exclude cirrhosis | 67–100%/64–91% | |||
| ALD: Can be used to exclude cirrhosis | 80–86%/83–91% | |||
| Point quantification SWE | HCV: First-line assessment [35] | 68–100%/70–98% |
| |
| HBV: Useful to identify cirrhotic patients | 50–100%/70–92% | |||
| Two-dimensional SWE (2D-SWE) | HCV: First-line assessment [35] | 75.9–91.4%/88.2–90.8% 1 |
| |
| HBV: Useful to identify those cirrhotic patients | 50.7–81.5%/70.4–88.4% 2 |
| Fibrosis Stage | ≥F1 | ≥F2 | ≥F3 | ≥F4 | |||||||||
|---|---|---|---|---|---|---|---|---|---|---|---|---|---|
| Study | Cut-Off (kPa) | AUROC | Se/Sp (%) | Cut-Off (kPa) | AUROC | Se/Sp (%) | Cut-Off (kPa) | AUROC | Se/Sp (%) | Cut-Off (kPa) | AUROC | Se/Sp (%) | |
| Eddowes et al. [81] (n = 373) | N/S | 8.2 1 6.1 2 12.1 3 | 0.77 | 71/70 90/38 44/91 | 9.7 1 7.1 2 14.1 3 | 0.80 | 71/75 90/50 48/90 | 13.6 1 10.9 2 20.9 3 | 0.89 | 85/79 91/70 59/90 | |||
| Furlan et al. [82] (n = 59) | N/S | 8.8 1 4.8 2 8.8 3 | 0.77 | 51.2/94.4 90.2/50 51.2/94.4 | 6.7 1 6.2 2 10.5 3 | 0.86 | 86.4/70.3 90.9/59.5 50/91.9 | N/S | |||||
| Hsu et al. [83] (n = 230 *) | 6.2 | 0.818 | 65.6/67.1 | 7.6 | 0.866 | 76.3/79.6 | 8.8 | 0.841 | 77.2/78 | 11.8 | 0.836 | 80/81 | |
| Siddiqui et al. [77] (n = 393) | 4.9 | 0.74 | 90/31 | 8.6 1 5.6 2 11.9 3 | 0.79 | 66/80 90/44 40/90 | 8.6 1 6.5 2 12.1 3 | 0.83 | 80.74 90/47 52/90 | 13.1 1 12.1 2 14.9 3 | 0.93 | 89/86 90/82 69/90 | |
| Wong et al. [65] (n = 496) | M probe | N/S | N/S | > 15 kPa | 0.90 | 28.6/98.7 | >15 kPa | 0.87 | 46.9/95.5 | ||||
| XL probe | N/S | N/S | 0.80 | 31.3/96.5 | 0.86 | 48.6/93 | |||||||
| Jiang et al. [84] (n = 1753 *) | N/S | N/S | 0.85 | 77/80 | N/S | 0.92 | 79/89 | N/S | 0.96 | 90/91 | |||
| Lee et al. [85] (n = 94) | N/S | 7.4 | 0.757 | 62.5/91.7 | 8.0 | 0.870 | 82.6/84.9 | 10.8 | 0.882 | 91.7/81.2 | |||
| Petta et al. [63] (n = 324) | N/S | 8.5 | 0.808 | N/S | 10.1 | 0.861 | N/S | ||||||
| Xiao et al. [80] (n = 429 *) | M probe | N/S | 5.8 6.65–7 7.25–11 | 0.83 | 91.7/57.4 74.1/68.8 65.7/84.5 | 6.95–7.25 7.6–8 8.7–9 9.6–11.4 | 0.87 | 69.2/66.3 88.9/77.2 83.3/78 80.1/89.9 | 7.9–8.4 10.3–11.3 11.5–11.95 13.4–22.3 | 0.92 | 96.5/77.7 87.7/86.3 77.5/88.8 78.2/90.8 | ||
| XL probe | N/S | 4.8–8.2 | 0.82 | 75.8/64.8 | 5.7–9.3 | 0.86 | 75.3/74 | 7.2–16 | 0.94 | 87.8/82 | |||
| Boursier et al. [86] (n = 452) | N/S | N/S | 0.842 | N/S | 8.7 | 0.831 | 88.4/62.9 | N/S | 0.864 | N/S | |||
| Cassinotto et al. [87] (n = 291) | N/S | 6.2 | 0.82 | 90/45 | 8.2 | 0.86 | 90/61 | 9.5 | 0.87 | 92/62 | |||
| Imajo et al. [88] (n = 142) | 7 | 0.78 | 61.7/100 | 11 | 0.82 | 65.2/88.7 | 11.4 | 0.88 | 85.7/83.8 | 14 | 0.92 | 100/75.9 | |
| Pathik et al. [89] (n = 110) | N/S | 9.1 | N/S | N/S | 12 | 0.91 | 90/80 | 20 | N/S | 90/80 | |||
| Kwok et al. [90] (n = 854) | N/S | 6.7–7.7 | 0.79–0.987 | 79/75 | 8–10.4 | 0.76–0.98 | 85/85 | 10.3–17.5 | 0.91–0.99 | 92/92 | |||
| Kumar et al. [78] (n = 205) | 6.1 | 0.82 | 78/68 | 7 | 0.85 | 77/78 | 9 5 7.8 2 11.2 3 | 0.94 | 85/88 96/78 71/93 | 11.8 5 10.6 2 19.4 3 | 0.96 | 90/88 100/82 70/98 | |
| Myers et al. [43] (n = 75) | M probe | N/S | 7.8 | 0.86 | 82/78 | N/S | 0.87 | N/S | 22.3 | 0.88 | 80/91 | ||
| XL probe | N/S | 6.4 | 0.85 | 81/66 | N/S | 0.90 | N/S | 16.0 | 0.95 | 100/91 | |||
| Lupsor et al. [91] (n = 72) | 5.3 | 0.879 | 86.1/88.9 | 6.8 | 0.789 | 66.67/84.31 | 10.2 | 0.978 | 100/96.87 | N/S | |||
| Wong et al. [92] (n = 246) | N/S | 5.8 2 7 4 9 3 | 0.84 | 91.1/50.3 79.2/75.9 52.5/91.7 | 7.9 2 8.7 4 9 3 | 0.94 | 91.1/75.3 83.9/83.2 75/91.6 | 10.3 2 10.3 4 11.4 3 | 0.95 | 92/87.8 92/87.8 76/91 | |||
| Yoneda et al. [76] (n = 97) | 5.9 | 0.93 | 86.1/88.9 | 6.65 | 0.865 | 88.2/73.9 | 9.8 | 0.904 | 85.2/81.4 | 17.5 | 0.991 | 100/96.6 | |
| Fibrosis Stage | ≥F2 | ≥F3 | ≥F4 | ||||||
|---|---|---|---|---|---|---|---|---|---|
| Study | Cut-Off (m/s) | AUROC | Se/Sp (%) | Cut-Off (m/s) | AUROC | Se/Sp (%) | Cut-Off (m/s) | AUROC | Se/Sp (%) |
| Lin et al. (n = 1147 1) [105] | 1.3 | 0.89 | 85/83 | 2.06 | 0.94 | 90/90 | 1.89 | 0.94 | 90/95 |
| Jiang et al. (n = 982 1) [84] | N/S | 0.86 | 70/84 | N/S | 0.94 | 89/88 | N/S | 0.95 | 89/91 |
| Lee et al. (n = 94) [85] | 1.35 | 0.657 | 46.2/93.2 | 1.43 | 0.873 | 70/93.7 | 1.50 | 0.92 | 75/90.7 |
| Cassinotto et al. (n = 291) [87] | 0.95 1.32 | 0.77 | 90/36 56/91 | 1.15 1.53 | 0.84 | 90/63 59/90 | 1.3 2.04 | 0.84 | 90/67 44/90 |
| Cui et al.(n = 125) [110] | 1.34 | 0.848 | 81.8/78.3 | 1.34 | 0.896 | 95.2/74 | 2.48 | 0.862 | 77.8/93.1 |
| Fierbinteanu et al. (n = 64) [101] | 1.165 | 0.944 | 84.8/90.3 | 1.48 | 0.982 | 86.4/95.2 | 1.635 | 0.984 | 91.7/92.3 |
| Cassinotto et al. (n = 321) [111] | 1.38 | 0.81 | 71/78 | 1.57 | 0.85 | 75/80 | 1.61 | 0.88 | 74/78 |
| Friedrich-Rust et al. 2 (n = 57) [68] | N/S | 0.66 | N/S | N/S | 0.71 | N/S | N/S | 0.74 | N/S |
| Osaki et al. (n = 23 3) [103] | 1.79 ± 0.78 | N/S | N/S | 2.20 ± 0.74 | N/S | N/S | 2.90 ± 1.01 | N/S | N/S |
| Yoneda et al. (n = 54) [112] | N/S | 1.77 | 0.93 | 100/91 | 1.90 | 0.937 | 100/96 | ||
| Fibrosis Stage | ≥F1 | ≥F2 | ≥F3 | ≥F4 | ||||||||
|---|---|---|---|---|---|---|---|---|---|---|---|---|
| Study | Cut-Off (kPa) | AUROC | Se/Sp (%) | Cut-Off (kPa) | AUROC | Se/Sp (%) | Cut-Off (kPa) | AUROC | Se/Sp (%) | Cut-Off (kPa) | AUROC | Se/Sp (%) |
| Lee et al. (n = 102) [108] | 6.3 | 0.82 | 63/88 | 7.6 | 0.87 | 89/77 | 9.0 | 0.95 | 100/85 | N/S | ||
| Herrmann et al. (n = 156) [113] | N/S | 7.1 | 0.855 | N/S | 9.2 | 0.928 | N/S | 13.0 | 0.917 | N/S | ||
| Takeuchi et al. (n = 71) [109] | 6.61 | 0.82 | 79/67 | 11.57 | 0.75 | 52/44 | 13.07 | 0.82 | 63/57 | 15.73 | 0.90 | 100/82 |
| Lee et al. (n = 94) [85] | N/S | 8.3 | 0.759 | 87/55.3 | 10.7 | 0.809 | 90/61.2 | 15.1 | 0.906 | 90/78 | ||
| Xiao et al. (n = 429 1) [80] | N/S | 2.67–9.4 | 0.89 | 85/94.4 | 3.02–10.6 | 0.91 | 89.9/91.8 | 3.36 | 0.97 | 100/85.6 | ||
| Cassinotto et al. (n = 291) [87] | N/S | 6.3 3 8.7 4 | 0.86 | 90/50 3 71/90 4 | 8.3 3 10.7 4 | 0.89 | 91/71 3 71/90 4 | 10.5 3 14.5 4 | 0.88 | 90/72 3 58/90 4 | ||
| Ochi et al. (n = 181) [114] | 2.47 2 | 0.838 | 0.649/0.969 | 2.76 2 | 0.853 | 86/88.6 | 3.02 2 | 0.878 | 88.2/91.5 | 3.36 2 | 0.965 | 100/85.6 |
| Study | Cut-Off Value Malignant Versus Benign (m/s) | Se/Sp (%) | HCC | Metastases | Hemangiomas | FNH | Hepatocellular Adenoma | Statistically Significant/Not Significant Difference between SWV of HCC and Other FLLs |
|---|---|---|---|---|---|---|---|---|
| Park et al. [139] | 1.82 | 71.8/75 | 2.48 ± 0.84 (n = 24) | 2.35 ± 1.18 (n = 8) | 1.83 ± 0.62 (n = 5) | 0.97 ± 0.48 (n = 3) | N/S | Significant difference: HCC—benign lesions (p = 0.006) |
| Akdogan et al. [140] | 2.32 | 93/60 | 2.75 ± 0.53 (n = 10) | 3.59 ± 0.51 (n = 22) | 2.15 ± 0.73 (n = 34) | 3.22 ± 0.18 (n = 4) | N/S | No significant difference: HCC—hemangiomas (p > 0.05) Significant difference: HCC—metastatic lesions (p < 0.05) |
| Kim et al. [141] | 2.73 | 96.4/65.8 | 2.66 ± 0.94 (n = 26) | 2.82 ± 0.96 (n = 24) with colon cancer metastasis 3.70 ± 0.61 (n = 20) | 1.80 ± 0.57 (n = 28) | N/S | N/S | No significant difference: HCC—hemangiomas (p > 0.05) |
| Davies et al. [142] | 2.5 | 97.1/100 | N/S | 4.23 ± 0.59 (n = 10) | 1.35 ± 0.48 (n = 35) | N/S | N/S | N/S |
| Gallotti et al. [143] | N/S | N/S | 2.17 ± 0.85 (n = 6) | 2.87 ± 1.13 (n = 9) | 2.30 ± 0.95 (n = 7) | 2.75 ± 0.95 (n = 13) | 1.25 ± 0.37 (n = 5) | No significant difference: HCC—hemangiomas. Significant difference: HCC—adenomas (p < 0.05) |
| Frulio et al. [144] | N/S | N/S | 2.4 ± 1.01 (n = 24) | 3.0 ± 1.36 (n = 12) | 2.14 ± 0.49 (n = 15) | 3.14 ± 0.63 (n = 19) | 1.90 ± 0.86 (n = 9) | No significant difference: malignant—benign groups (p N/S). |
| Dong et al. [145] | 2.06 | 80.6/88 | 2.63 (range 1.84–5.68) (n = 104) | 2.78 (range 1.02–3.15) (n = 11) | 1.5 (range 0.79–2.61) (n = 11) | 1.35 (range 0.69–2.94) (n = 5) | N/S | Significant difference: Malignant—benign lesions (p < 0.05) |
| Guo et al. [146] | 2.13 | 83.3/77.9 | 3.07 ± 0.89 (n = 24) | 2.74 ± 1.06 (n = 26) | 1.48 ± 0.70 (n = 47) | 2.30 ± 1.18 (n = 7) | N/S | Significant difference: HCC—hemangiomas (p < 0.001) Significant difference: HCC—focal fatty degeneration (not mentioned in the current table, p = 0.006) |
| Zhang et al. [147] | 2.16 | 81.3/74.1 | 2.59 ± 0.91 (n = 61) | 3.20 ± 0.62 (n = 39) | 1.33 ± 0.38 (n = 28) | 1.90 ± 0.45 (n = 14) | N/S | Significant difference: Malignant—benign lesions (p < 0.01) |
| Yu et al. [148] | 2.72 | 69/89 | 2.49 ± 1.07 (n = 28) | 2.73 ± 0.89 (n = 13) | 1.75 ± 0.80 (n = 35) | 2.18 ± 0.84 (n = 15) | 1.79 ± 0.14 (n = 2) | Significant difference: HCC—benign lesions (p < 0.01, overlap) Significant difference: HCC—hemangiomas (p < 0.01) |
| Heide et al. [149] | N/S | N/S | 2.63 ± 1.09 (n = 5) | 2.88 ± 1.16 (n = 17) | 2.36 ± 0.77 (n = 13) | 3.11 ± 0.93 (n = 17) | 2.23 ± 0.97 (n = 2) | No significant difference: Malignant—benign lesions (p = 0.23). |
| Galati et al. [150] | 2.0 | 74.6/80.7 | 2.47 ± 1.425 (n = 39) | 3.29 ± 1.2325 (n = 28) | 1.34 ± 0.9125 (n = 52) | N/S | N/S | Significant difference: Malignant lesions—hemangiomas (p N/S) |
| Cho et al. [151] | 2.0 | 74/82 | 2.45 ± 0.81 (n = 17) | 2.18 ± 0.96 (n = 8) | 1.51 ± 0.71 (n = 17) | N/S | N/S | Significant difference: HCC—hemangiomas (p < 0.05) |
| Wu et al. [152] | 2.22 | 51.9/85.7 | Malignant: 2.25 ± 0.80 (n = 27) | Benign: 1.70 ± 0.58 (n = 28) | Significant difference: Malignant—benign lesions (p = 0.007) | |||
| Shuang-Ming et al. [153] | 2.22 | 89.7/95 | Malignant: 3.16 ± 0.80 (n = 68) | Benign: 1.47 ± 0.53 (n = 60) | Significant difference: Malignant—benign lesions (p < 0.001) | |||
| Kapoor et al. [154] | 2.5 | 88/83 | 2.4 (range 1.28–3.5) (n = 7) | 3.28 (range 2.9–3.65) (n = 18) | Benign: 1.83 (range 1.26–2.39) (n = 15) | Significant difference: HCC—metastatic nodules (p = 0.008) | ||
| Study | Cut-Off Value Malignant Versus Benign | Se/Sp (%) | HCC | Metastases | Hemangiomas | FNH | Hepatocellular Adenoma | Statistically Significant/Not Significant Difference between Stiffness of HCC and Other FLLs |
|---|---|---|---|---|---|---|---|---|
| Tian et al.1 [166] | 39.60 | 87.74/83.67 | 61.83 ± 28.87 (n = 103)/Parenchyma: 15.94 ± 7.37 | 90.32 ± 54.71 (n = 35)/Parenchyma: 10.93 ± 36.64 | 20.56 ± 10.74 (n = 37)/Parenchyma: 9.04 ± 2.44 | 38.72 ± 18.65(n = 15)/Parenchyma: 9.09 ± 2.64 | N/S | Significant difference: Intrahepatic cholangiocarcinomas—HCC (p < 0.0001) Significant difference: metastases—HCC (p = 0.0237) Significant difference: malignant—benign lesions (p < 0.001) Significant difference: HCC—FNHs (HCC > FNH, p = 0.0012) |
| Guibal et al. [167] | N/S | N/S | 14.86 ± 10 (n = 26) | 28.8 ± 16 (n = 53) | 13.8 ± 5.5 (n = 22) | 33 ± 14.7 (n = 16) | 9.4 ± 4.3 (n = 10) | Significant difference: HCC—cholangiocarcinomas (p = 0.0004) Significant difference: HCC—metastases (p = 0.0059) |
| Wang et al. [168] | 25.76 (Emean), 0.85 (combined score) | 92.59/87.50 (combined score) | 39.31 ± 12.50 (n = 83) | 56.99 ± 33.13 (n = 24) | 13.71 ± 9.24 (n = 33) | 30.56 ± 11.86 (n = 11) | N/S | N/S |
| Ronot et al. [164] | N/S | N/S | 19.6 (n = 1) | N/S | 17.1 ± 7 (n = 20) | 33.3 ± 12.7 (n = 60) | 19.7 ± 9.8 (n = 17) | No significant difference: Malignant—benign lesions (p = 0.64) |
| Grgurevic et al. [169] | 22.3 | 83/86 | 29.57 ± 11.67 (n = 57) | 37.93 ± 10.61 (n = 94) | 14.10 ± 6.44 (n = 71) | 30.51 ± 32.05 (n = 20) | N/S | Significant difference: Malignant—benign lesions (p < 0.001) |
| Gerber et al. [170] | 20.7 | 79.7/62 | 44.8 (range 15.8–97) (n = 16) | 29.5 (range 4.1–142.9) (n = 41) | 16.35 (range 5.4–71.9) (n = 18) | 16.55 (range 2.1–69.7) (n = 18) | 8.9 (n = 1) | Significant difference: Malignant—benign lesions (p < 0.0001) Significant difference: Cholangiocarcinomas—HCC (p = 0.033) Significant difference: Cholangiocarcinomas—metastases (p = 0.0079) |
© 2020 by the authors. Licensee MDPI, Basel, Switzerland. This article is an open access article distributed under the terms and conditions of the Creative Commons Attribution (CC BY) license (http://creativecommons.org/licenses/by/4.0/).
Share and Cite
Lupsor-Platon, M.; Serban, T.; Silion, A.-I.; Tirpe, A.; Florea, M. Hepatocellular Carcinoma and Non-Alcoholic Fatty Liver Disease: A Step Forward for Better Evaluation Using Ultrasound Elastography. Cancers 2020, 12, 2778. https://0-doi-org.brum.beds.ac.uk/10.3390/cancers12102778
Lupsor-Platon M, Serban T, Silion A-I, Tirpe A, Florea M. Hepatocellular Carcinoma and Non-Alcoholic Fatty Liver Disease: A Step Forward for Better Evaluation Using Ultrasound Elastography. Cancers. 2020; 12(10):2778. https://0-doi-org.brum.beds.ac.uk/10.3390/cancers12102778
Chicago/Turabian StyleLupsor-Platon, Monica, Teodora Serban, Alexandra-Iulia Silion, Alexandru Tirpe, and Mira Florea. 2020. "Hepatocellular Carcinoma and Non-Alcoholic Fatty Liver Disease: A Step Forward for Better Evaluation Using Ultrasound Elastography" Cancers 12, no. 10: 2778. https://0-doi-org.brum.beds.ac.uk/10.3390/cancers12102778