
Bacterial, Archaea, and Viral Transcripts (BAVT) Expression in Gynecological Cancers and Correlation with Regulatory Regions of the Genome

 , , ,
, , , 
Abstract
:Simple Summary
Abstract
1. Introduction
2. Materials and Methods
2.1. Clinical Data
2.2. Biological Data
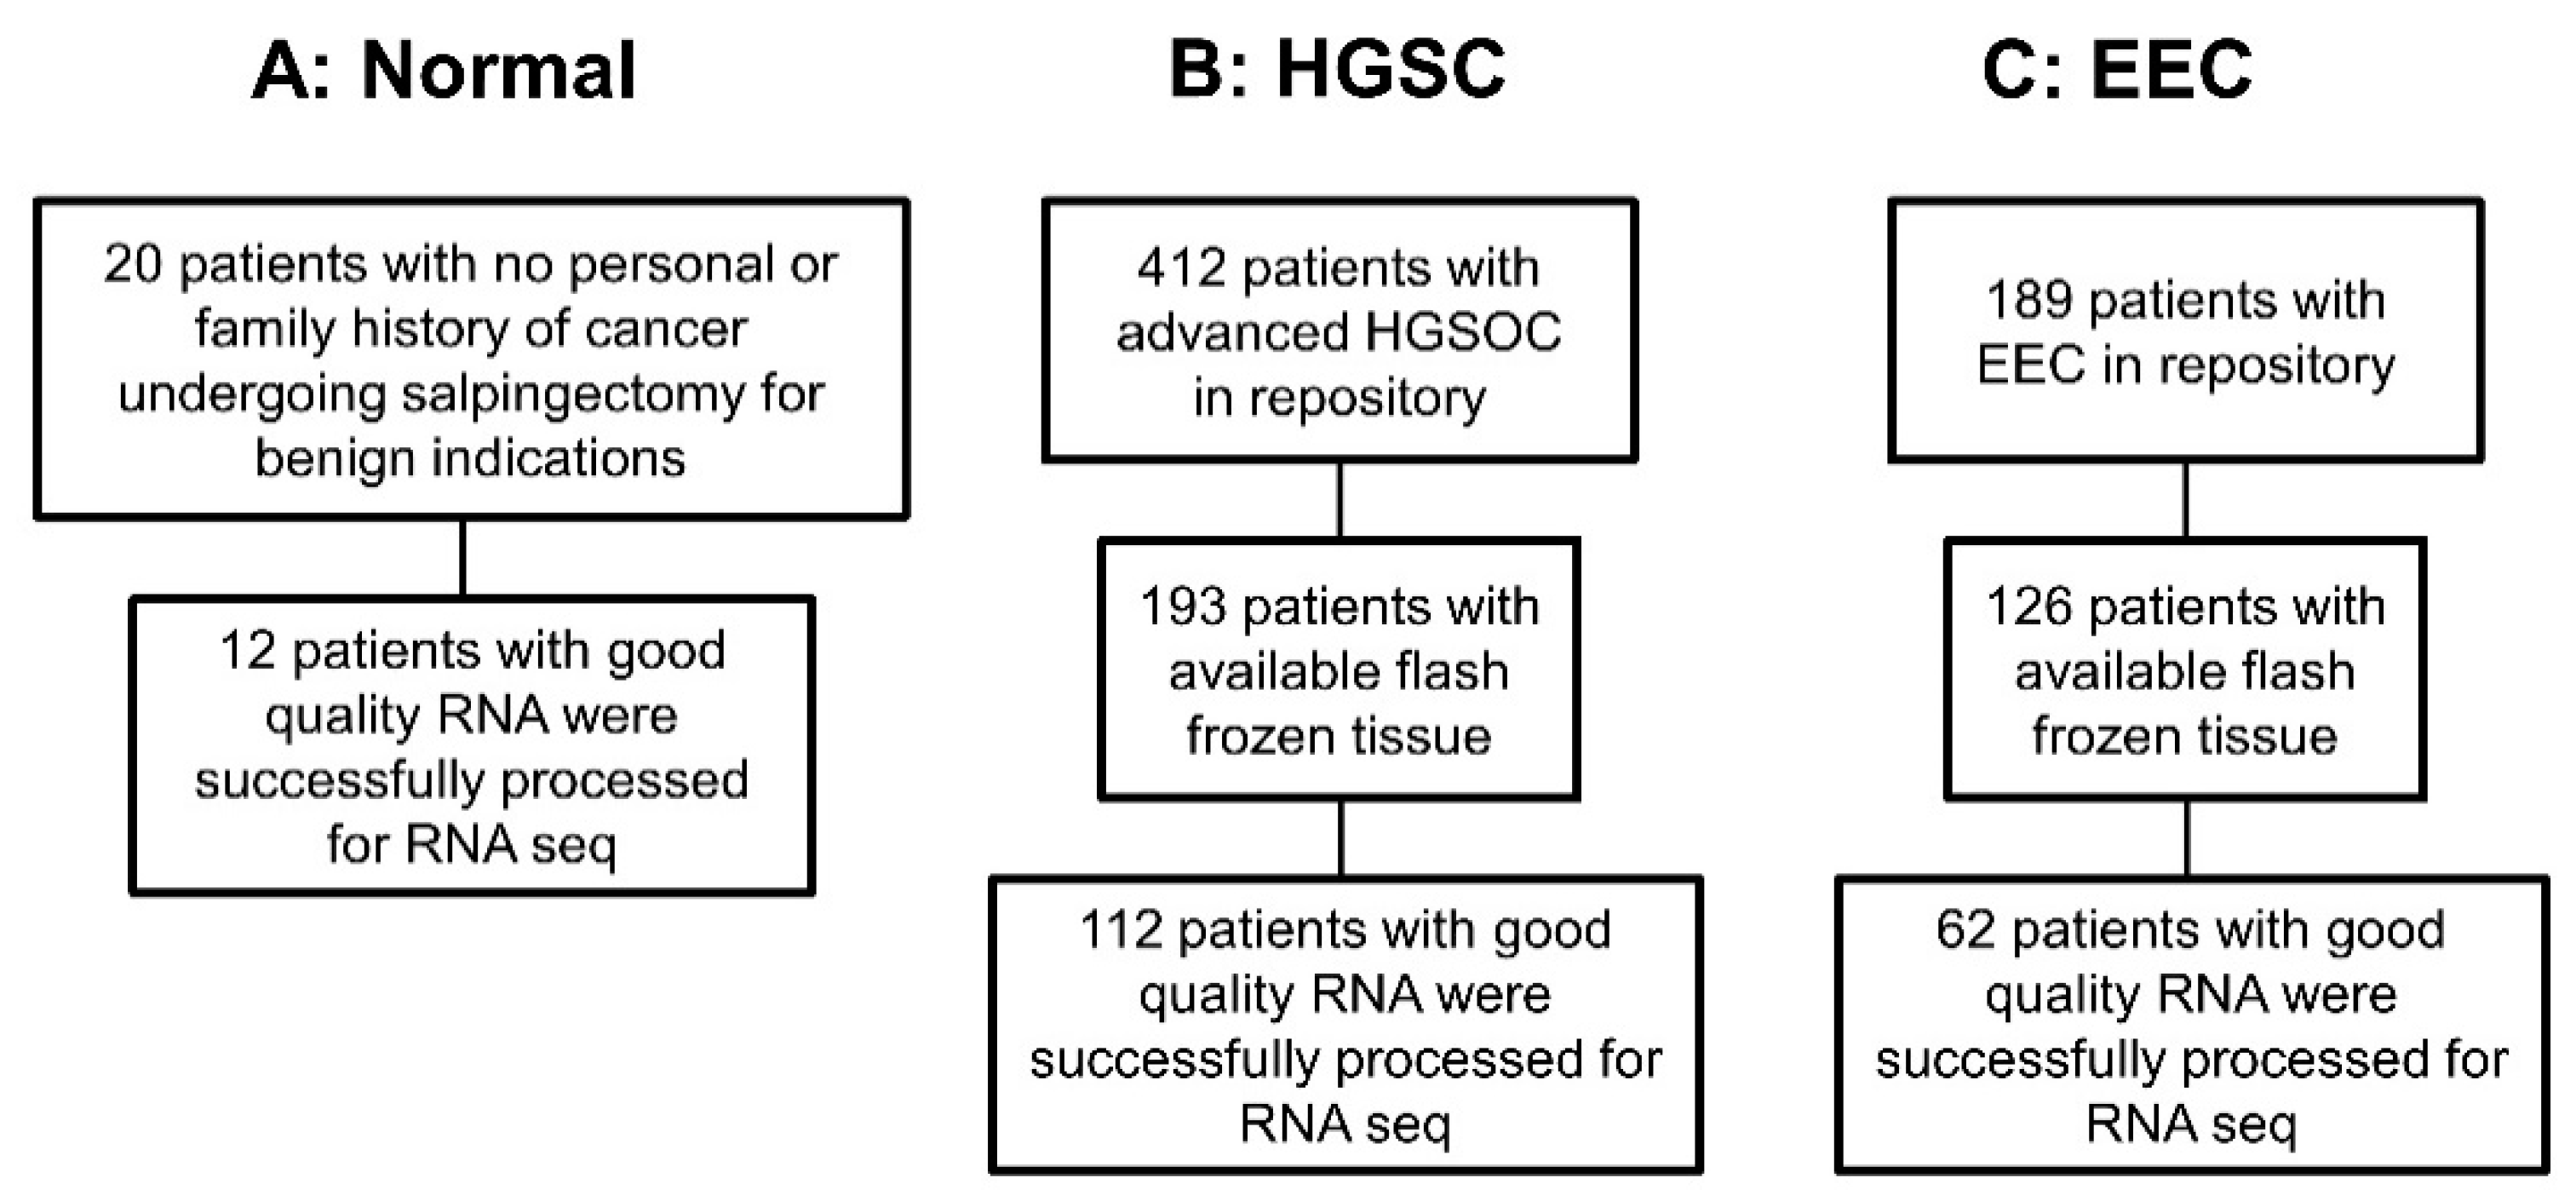
2.2.1. Samples
2.2.2. DNA and RNA Purification and Sequencing
2.2.3. Metagenomics Classification
2.3. Statistical Analysis
2.3.1. Association of BAVT with HGSC
2.3.2. Differences of BAVT Expression between HGSC and EEC
2.3.3. Validation of Differential BAVT between HGSC and EEC in TCGA Dataset
2.3.4. Correlations between BAVT Expression and Gene and lncRNA Expressions
2.3.5. Power Calculation
2.4. Bioinformatics
2.4.1. Mapping Significant Transcripts to the Human Genome
2.4.2. Pathway Enrichment Analysis
3. Results
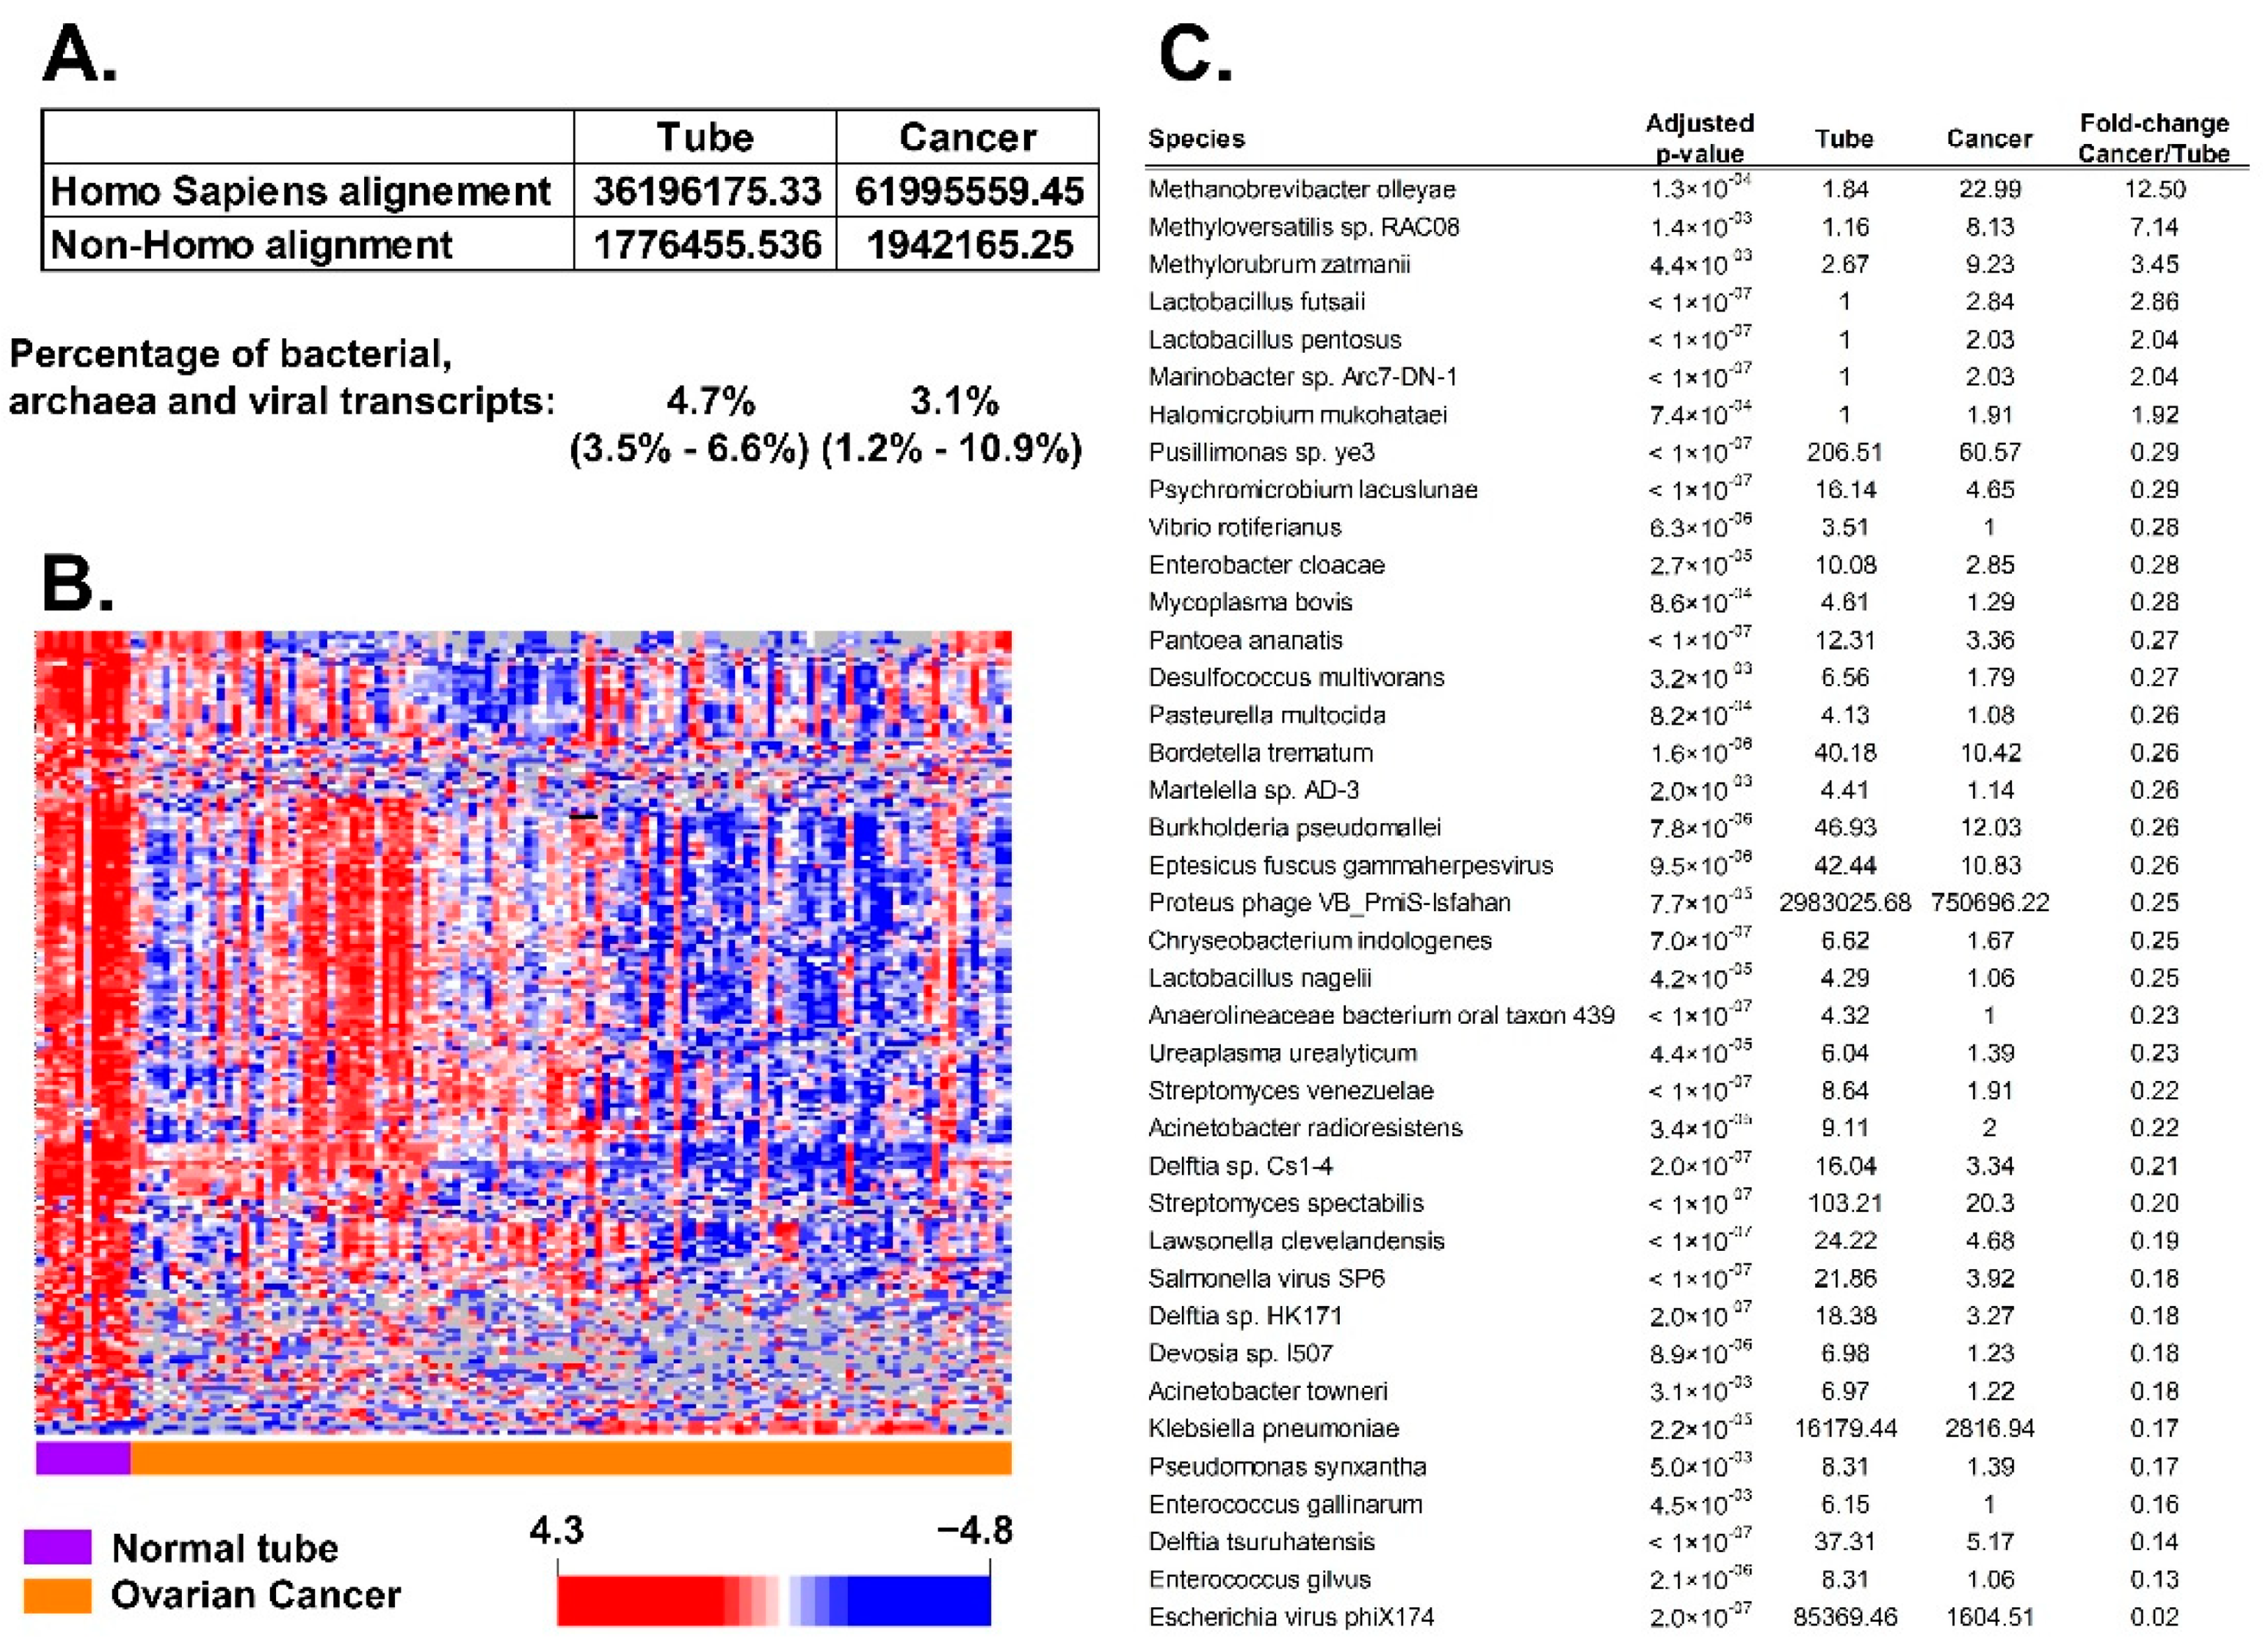
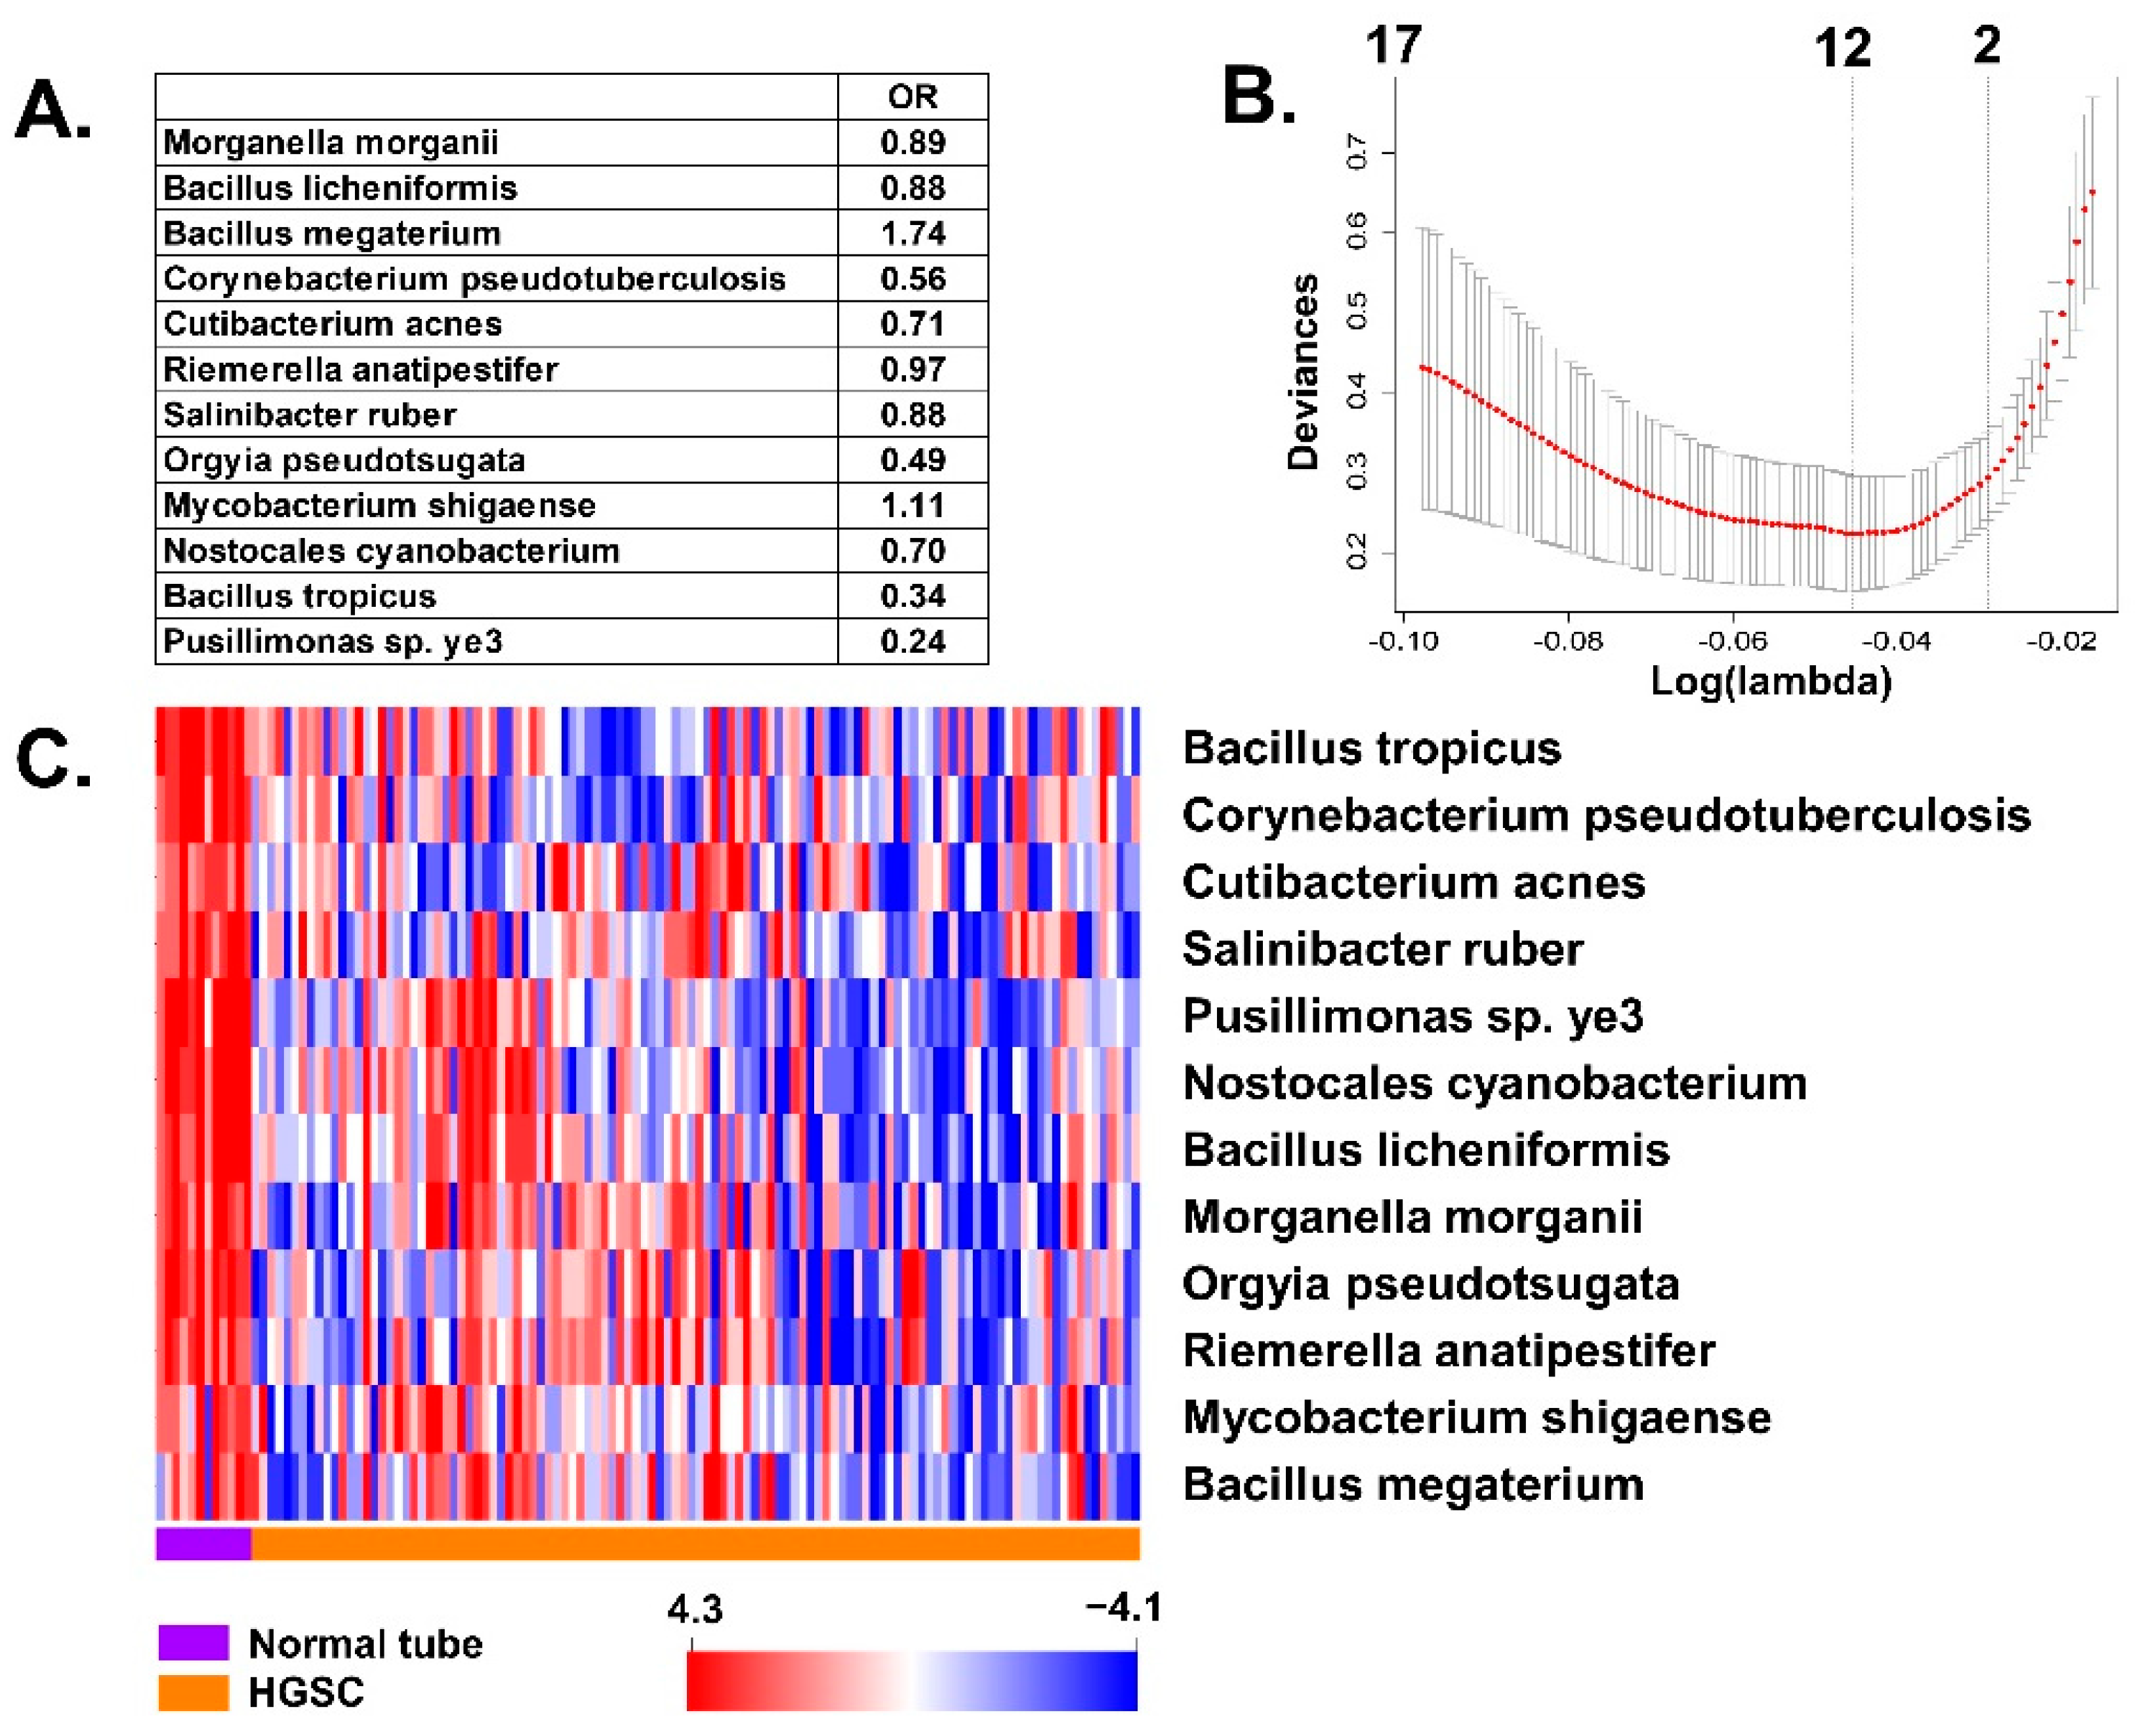
3.1. Association of BAVT with HGSC
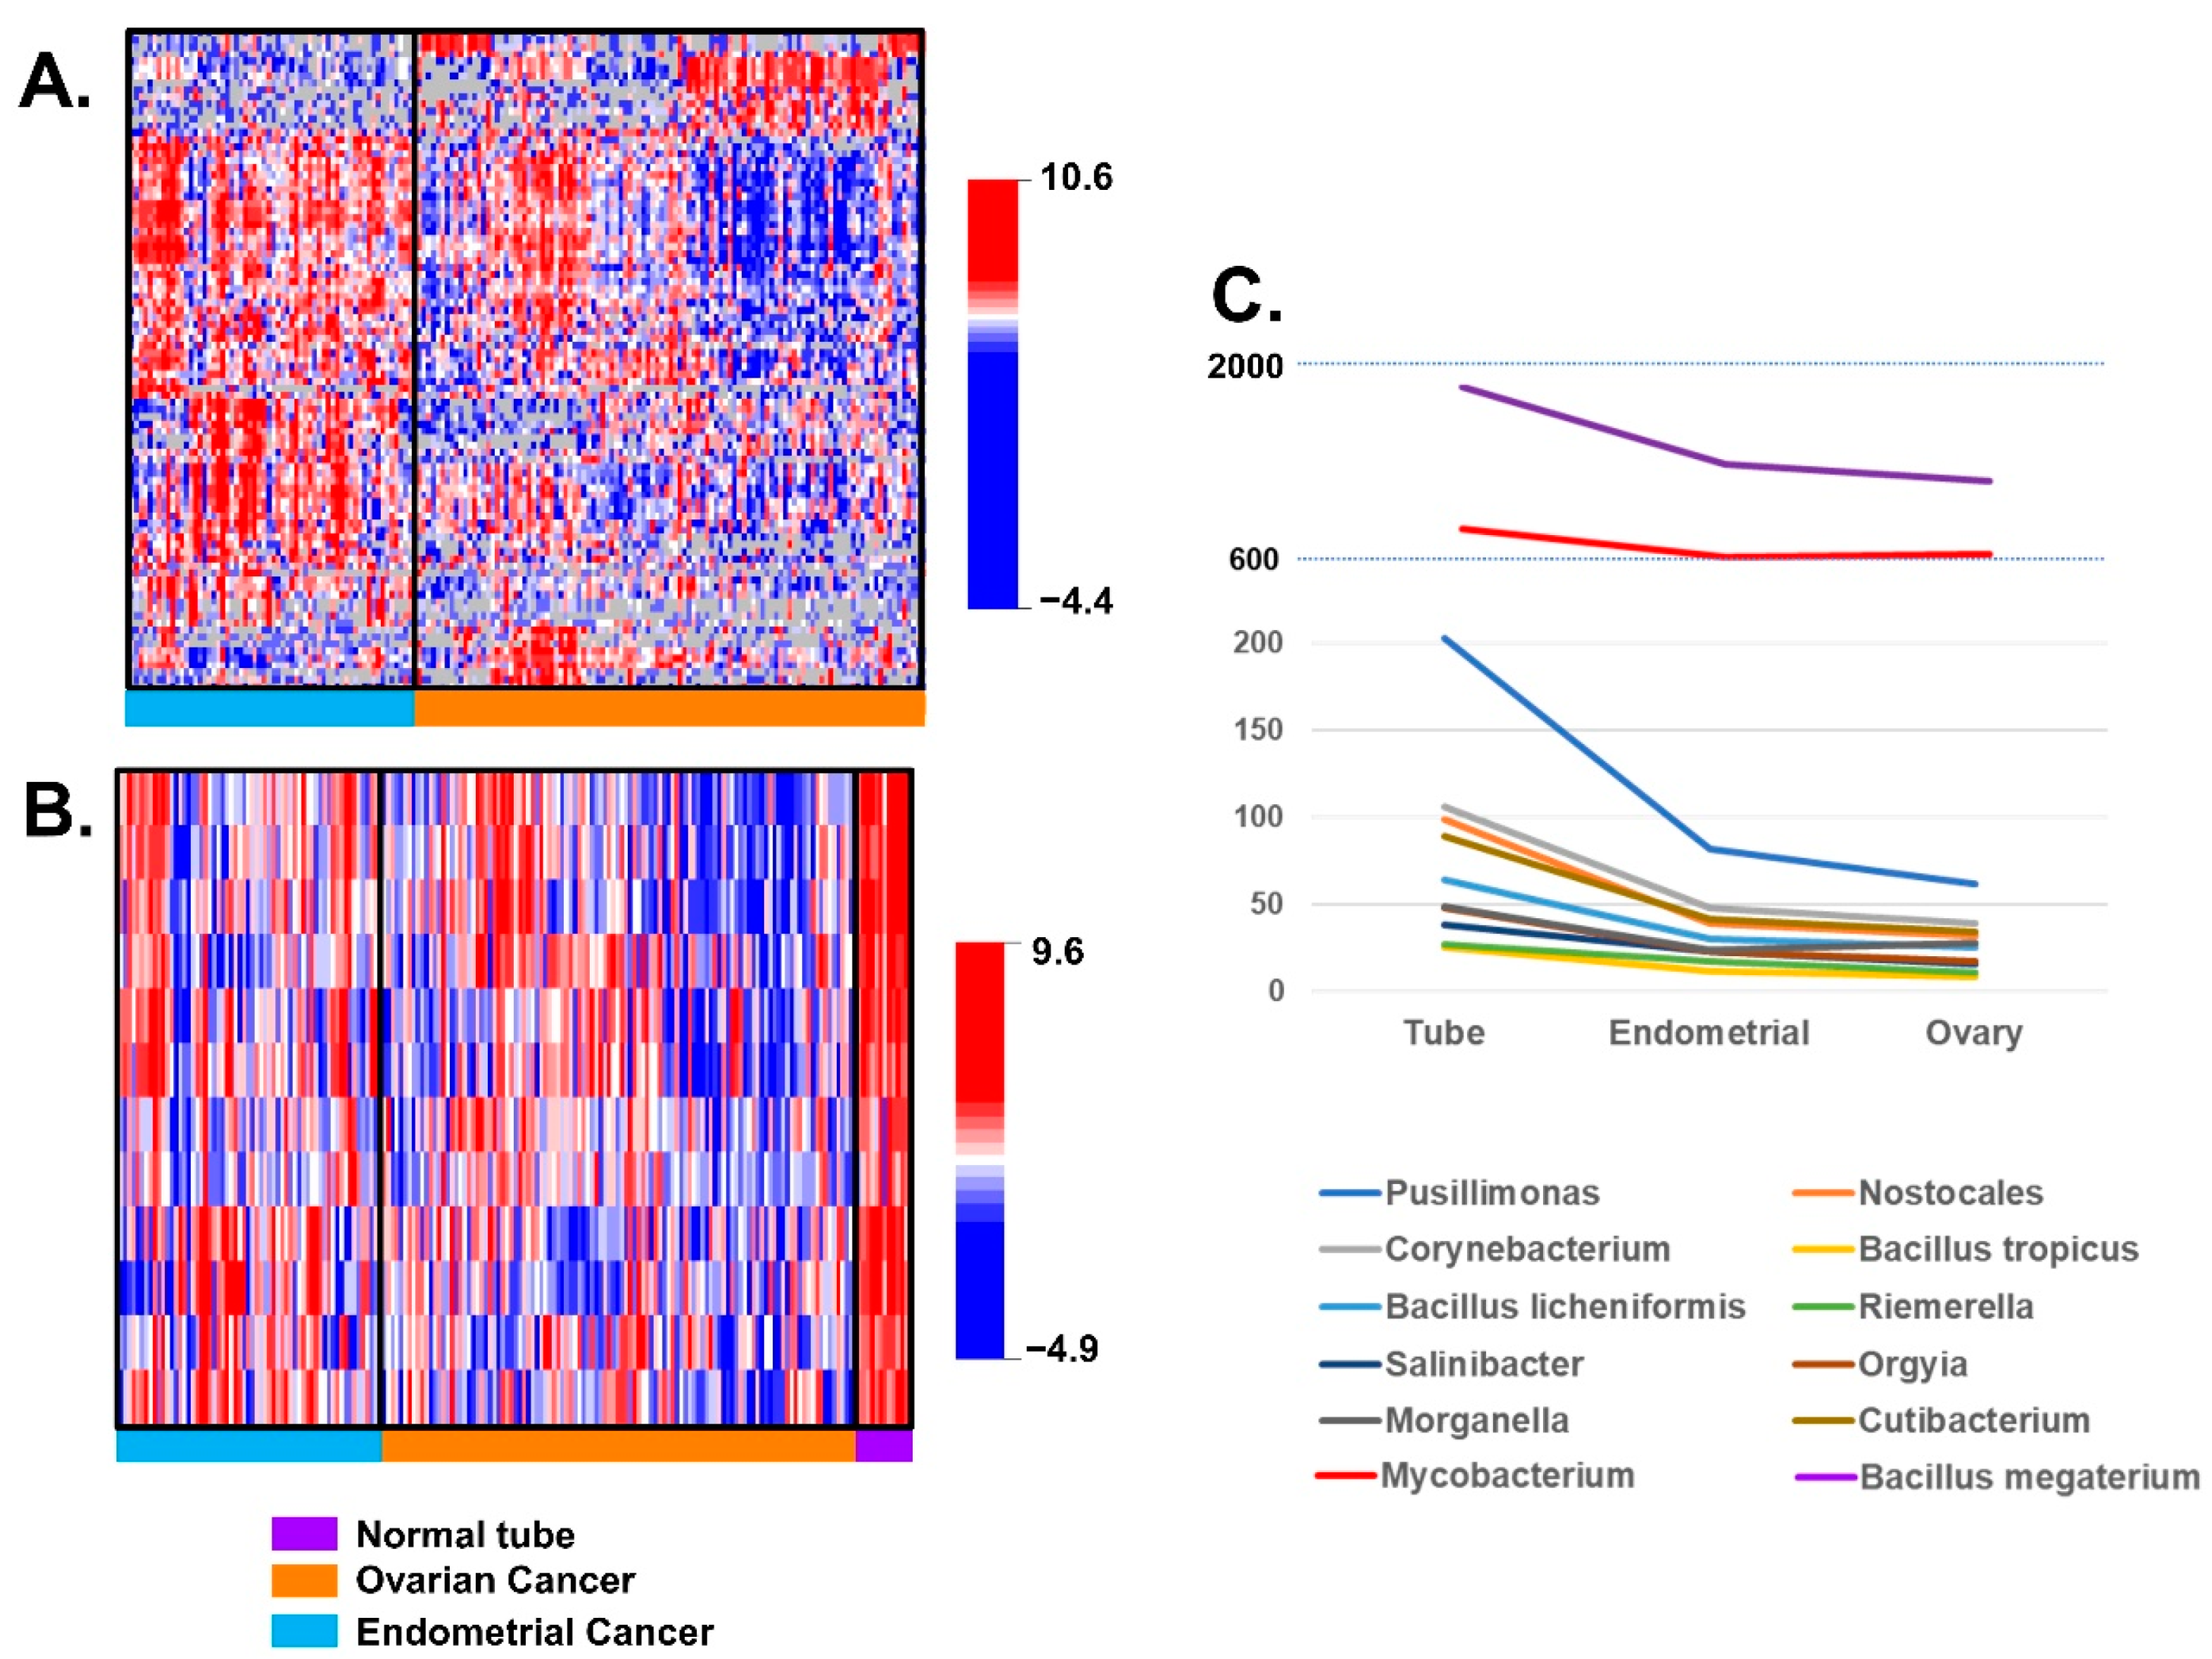
3.2. Differences of BAVT Expression between HGSC and EEC
3.3. Validation of BAVT Analysis in TCGA Dataset
3.4. Mapping Significant BAVT and Correlation with Gene and lncRNA Expression
3.5. Pathway Enrichment Analysis
4. Discussion
5. Conclusions
Supplementary Materials
Author Contributions
Funding
Institutional Review Board Statement
Informed Consent Statement
Data Availability Statement
Conflicts of Interest
References
- Plummer, M.; de Martel, C.; Vignat, J.; Ferlay, J.; Bray, F.; Franceschi, S. Global burden of cancers attributable to infections in 2012: A synthetic analysis. Lancet Glob. Health 2016, 4, e609–e616. [Google Scholar] [CrossRef] [Green Version]
- Van Tine, B.A.; Kappes, J.C.; Banerjee, N.S.; Knops, J.; Lai, L.; Steenbergen, R.D.; Meijer, C.L.; Snijders, P.J.; Chatis, P.; Broker, T.R.; et al. Clonal selection for transcriptionally active viral oncogenes during progression to cancer. J. Virol. 2004, 78, 11172–11186. [Google Scholar] [CrossRef] [PubMed] [Green Version]
- Kim, S.S.; Ruiz, V.E.; Carroll, J.D.; Moss, S.F. Helicobacter pylori in the pathogenesis of gastric cancer and gastric lymphoma. Cancer Lett. 2011, 305, 228–238. [Google Scholar] [CrossRef] [PubMed] [Green Version]
- Huybrechts, I.; Zouiouich, S.; Loobuyck, A.; Vandenbulcke, Z.; Vogtmann, E.; Pisanu, S.; Iguacel, I.; Scalbert, A.; Indave, I.; Smelov, V.; et al. The human microbiome in relation to cancer risk: A systematic review of epidemiologic studies. Cancer Epidemiol. Biomarkers Prev. 2020, 29, 1856–1868. [Google Scholar] [CrossRef]
- Fried, B.; Reddy, A.; Mayer, D. Helminths in human carcinogenesis. Cancer Lett. 2011, 305, 239–249. [Google Scholar] [CrossRef]
- Kostic, A.D.; Gevers, D.; Pedamallu, C.S.; Michaud, M.; Duke, F.; Earl, A.M.; Ojesina, A.I.; Jung, J.; Bass, A.J.; Tabernero, J.; et al. Genomic analysis identifies association of fusobacterium with colorectal carcinoma. Genome Res. 2012, 22, 292–298. [Google Scholar] [CrossRef] [PubMed] [Green Version]
- Martin, H.M.; Campbell, B.J.; Hart, C.A.; Mpofu, C.; Nayar, M.; Singh, R.; Englyst, H.; Williams, H.F.; Rhodes, J.M. Enhanced escherichia coli adherence and invasion in crohn’s disease and colon cancer. Gastroenterology 2004, 127, 80–93. [Google Scholar] [CrossRef]
- Biarc, J.; Nguyen, I.S.; Pini, A.; Gosse, F.; Richert, S.; Thierse, D.; Van Dorsselaer, A.; Leize-Wagner, E.; Raul, F.; Klein, J.P.; et al. Carcinogenic properties of proteins with pro-inflammatory activity from streptococcus infantarius (formerly s.Bovis). Carcinogenesis 2004, 25, 1477–1484. [Google Scholar] [CrossRef]
- Human Microbiome Project, C. Structure, function and diversity of the healthy human microbiome. Nature 2012, 486, 207–214. [Google Scholar] [CrossRef] [Green Version]
- Lloyd-Price, J.; Mahurkar, A.; Rahnavard, G.; Crabtree, J.; Orvis, J.; Hall, A.B.; Brady, A.; Creasy, H.H.; McCracken, C.; Giglio, M.G.; et al. Strains, functions and dynamics in the expanded human microbiome project. Nature 2017, 550, 61–66. [Google Scholar] [CrossRef]
- Robinson, K.M.; Crabtree, J.; Mattick, J.S.; Anderson, K.E.; Dunning Hotopp, J.C. Distinguishing potential bacteria-tumor associations from contamination in a secondary data analysis of public cancer genome sequence data. Microbiome 2017, 5, 9. [Google Scholar] [CrossRef] [Green Version]
- Li, F.; Chen, C.; Wei, W.; Wang, Z.; Dai, J.; Hao, L.; Song, L.; Zhang, X.; Zeng, L.; Du, H.; et al. The metagenome of the female upper reproductive tract. Gigascience 2018, 7. [Google Scholar] [CrossRef]
- Shih, I.M.; Wang, Y.; Wang, T.L. The origin of ovarian cancer species and precancerous landscape. Am. J. Pathol. 2021, 191, 26–39. [Google Scholar] [CrossRef]
- Newtson, A.M.; Devor, E.J.; Gonzalez Bosquet, J. Prediction of epithelial ovarian cancer outcomes with integration of genomic data. Clin. Obstet. Gynecol. 2020, 63, 92–108. [Google Scholar] [CrossRef]
- Santillan, M.K.; Leslie, K.K.; Hamilton, W.S.; Boese, B.J.; Ahuja, M.; Hunter, S.K.; Santillan, D.A. Collection of a lifetime: A practical approach to developing a longitudinal collection of women’s healthcare biological samples. Eur. J. Obstet. Gynecol. Reprod. Biol. 2014, 179, 94–99. [Google Scholar] [CrossRef] [Green Version]
- Reyes, H.D.; Devor, E.J.; Warrier, A.; Newtson, A.M.; Mattson, J.; Wagner, V.; Duncan, G.N.; Leslie, K.K.; Gonzalez-Bosquet, J. Differential DNA methylation in high-grade serous ovarian cancer (hgsoc) is associated with tumor behavior. Sci. Rep. 2019, 9, 17996. [Google Scholar] [CrossRef]
- Salinas, E.A.; Miller, M.D.; Newtson, A.M.; Sharma, D.; McDonald, M.E.; Keeney, M.E.; Smith, B.J.; Bender, D.P.; Goodheart, M.J.; Thiel, K.W.; et al. A prediction model for preoperative risk assessment in endometrial cancer utilizing clinical and molecular variables. Int. J. Mol. Sci. 2019, 20, 1205. [Google Scholar] [CrossRef] [Green Version]
- Schroeder, A.; Mueller, O.; Stocker, S.; Salowsky, R.; Leiber, M.; Gassmann, M.; Lightfoot, S.; Menzel, W.; Granzow, M.; Ragg, T. The rin: An rna integrity number for assigning integrity values to rna measurements. BMC Mol. Biol. 2006, 7, 3. [Google Scholar] [CrossRef] [Green Version]
- Kim, D.; Song, L.; Breitwieser, F.P.; Salzberg, S.L. Centrifuge: Rapid and sensitive classification of metagenomic sequences. Genome Res. 2016, 26, 1721–1729. [Google Scholar] [CrossRef] [Green Version]
- Anders, S.; Huber, W. Differential expression analysis for sequence count data. Genome Biol 2010, 11, R106. [Google Scholar] [CrossRef] [Green Version]
- Storey, J.D.; Tibshirani, R. Statistical significance for genomewide studies. Proc. Natl. Acad. Sci. USA. 2003, 100, 9440–9445. [Google Scholar] [CrossRef] [Green Version]
- Friedman, J.; Hastie, T.; Tibshirani, R. Regularization paths for generalized linear models via coordinate descent. J. Stat. Software 2010, 33, 1–22. [Google Scholar] [CrossRef] [Green Version]
- Quinlan, A.R.; Hall, I.M. Bedtools: A flexible suite of utilities for comparing genomic features. Bioinformatics 2010, 26, 841–842. [Google Scholar] [CrossRef] [Green Version]
- Kim, D.; Paggi, J.M.; Park, C.; Bennett, C.; Salzberg, S.L. Graph-based genome alignment and genotyping with hisat2 and hisat-genotype. Nat. Biotechnol. 2019, 37, 907–915. [Google Scholar] [CrossRef]
- Li, H.; Handsaker, B.; Wysoker, A.; Fennell, T.; Ruan, J.; Homer, N.; Marth, G.; Abecasis, G.; Durbin, R.; Genome Project Data Processing, S. The sequence alignment/map format and samtools. Bioinformatics 2009, 25, 2078–2079. [Google Scholar] [CrossRef] [Green Version]
- Chen, Y.; Ye, W.; Zhang, Y.; Xu, Y. High speed blastn: An accelerated megablast search tool. Nucleic Acids Res. 2015, 43, 7762–7768. [Google Scholar] [CrossRef] [PubMed] [Green Version]
- Dobin, A.; Davis, C.A.; Schlesinger, F.; Drenkow, J.; Zaleski, C.; Jha, S.; Batut, P.; Chaisson, M.; Gingeras, T.R. Star: Ultrafast universal rna-seq aligner. Bioinformatics 2013, 29, 15–21. [Google Scholar] [CrossRef]
- Liao, Y.; Smyth, G.K.; Shi, W. Featurecounts: An efficient general purpose program for assigning sequence reads to genomic features. Bioinformatics 2014, 30, 923–930. [Google Scholar] [CrossRef] [Green Version]
- Sun, Z.; Nair, A.; Chen, X.; Prodduturi, N.; Wang, J.; Kocher, J.P. Uclncr: Ultrafast and comprehensive long non-coding rna detection from rna-seq. Sci. Rep. 2017, 7, 14196. [Google Scholar] [CrossRef] [Green Version]
- Kanehisa, M.; Goto, S.; Kawashima, S.; Okuno, Y.; Hattori, M. The kegg resource for deciphering the genome. Nucleic Acids Res. 2004, 32, D277–D280. [Google Scholar] [CrossRef] [Green Version]
- Yu, G.; Wang, L.G.; Han, Y.; He, Q.Y. Clusterprofiler: An r package for comparing biological themes among gene clusters. Omics 2012, 16, 284–287. [Google Scholar] [CrossRef]
- Bhatt, A.P.; Redinbo, M.R.; Bultman, S.J. The role of the microbiome in cancer development and therapy. CA Cancer J. Clin. 2017, 67, 326–344. [Google Scholar] [CrossRef] [Green Version]
- Cantalupo, P.G.; Katz, J.P.; Pipas, J.M. Viral sequences in human cancer. Virology 2018, 513, 208–216. [Google Scholar] [CrossRef]
- Rodriguez, R.M.; Hernandez, B.Y.; Menor, M.; Deng, Y.; Khadka, V.S. The landscape of bacterial presence in tumor and adjacent normal tissue across 9 major cancer types using tcga exome sequencing. Comput. Struct. Biotechnol. J. 2020, 18, 631–641. [Google Scholar] [CrossRef]
- Yu, J.; Feng, Q.; Wong, S.H.; Zhang, D.; Liang, Q.Y.; Qin, Y.; Tang, L.; Zhao, H.; Stenvang, J.; Li, Y.; et al. Metagenomic analysis of faecal microbiome as a tool towards targeted non-invasive biomarkers for colorectal cancer. Gut 2017, 66, 70–78. [Google Scholar] [CrossRef]
- Sherwani, M.A.; Tufail, S.; Muzaffar, A.F.; Yusuf, N. The skin microbiome and immune system: Potential target for chemoprevention? Photodermatol. Photoimmunol. Photomed. 2018, 34, 25–34. [Google Scholar] [CrossRef] [PubMed] [Green Version]
- Shillitoe, E.J. The microbiome of oral cancer. Crit. Rev. Oncog. 2018, 23, 153–160. [Google Scholar] [CrossRef]
- Robles, M.S.; Leonardo, E.; Criado, L.M.; Izquierdo, M.; Martinez, A.C. Inhibitor of apoptosis protein from orgyia pseudotsugata nuclear polyhedrosis virus provides a costimulatory signal required for optimal proliferation of developing thymocytes. J. Immunol. 2002, 168, 1770–1779. [Google Scholar] [CrossRef] [Green Version]
- Davidsson, S.; Molling, P.; Rider, J.R.; Unemo, M.; Karlsson, M.G.; Carlsson, J.; Andersson, S.O.; Elgh, F.; Soderquis, B.; Andren, O. Frequency and typing of propionibacterium acnes in prostate tissue obtained from men with and without prostate cancer. Infect. Agent Cancer 2016, 11, 26. [Google Scholar] [CrossRef] [Green Version]
- Hatsuse, M.; Daikoku, Y.; Taminishi, Y.; Fuchida, S.I.; Takemura, Y.; Okano, A.; Murakami, S.; Shimazaki, C. Possible contribution of disseminated mycobacterium shigaense infection to development of splenic marginal zone lymphoma. Rinsho Ketsueki 2018, 59, 878–883. [Google Scholar]
- Dey, G.; Bharti, R.; Das, A.K.; Sen, R.; Mandal, M. Resensitization of akt induced docetaxel resistance in breast cancer by ’iturin a’ a lipopeptide molecule from marine bacteria bacillus megaterium. Sci. Rep. 2017, 7, 17324. [Google Scholar] [CrossRef] [Green Version]
- Cannistra, S.A. Cancer of the ovary. N. Engl. J. Med. 2004, 351, 2519–2529. [Google Scholar] [CrossRef] [PubMed]
- Whittemore, A.S.; Harris, R.; Itnyre, J. Characteristics relating to ovarian cancer risk: Collaborative analysis of 12 us case-control studies. Ii. Invasive epithelial ovarian cancers in white women. Collaborative ovarian cancer group. Am. J. Epidemiol. 1992, 136, 1184–1203. [Google Scholar] [CrossRef]
- Hill, C.J.; Fakhreldin, M.; Maclean, A.; Dobson, L.; Nancarrow, L.; Bradfield, A.; Choi, F.; Daley, D.; Tempest, N.; Hapangama, D.K. Endometriosis and the fallopian tubes: Theories of origin and clinical implications. J. Clin. Med. 2020, 9, 1905. [Google Scholar] [CrossRef]
- Murakami, K.; Kotani, Y.; Nakai, H.; Matsumura, N. Endometriosis-associated ovarian cancer: The origin and targeted therapy. Cancers 2020, 12, 1676. [Google Scholar] [CrossRef] [PubMed]
- Maccio, A.; Madeddu, C. Inflammation and ovarian cancer. Cytokine 2012, 58, 133–147. [Google Scholar] [CrossRef] [Green Version]
- O’Brien, K.M.; Tworoger, S.S.; Harris, H.R.; Anderson, G.L.; Weinberg, C.R.; Trabert, B.; Kaunitz, A.M.; D’Aloisio, A.A.; Sandler, D.P.; Wentzensen, N. Association of powder use in the genital area with risk of ovarian cancer. JAMA 2020, 323, 49–59. [Google Scholar] [CrossRef] [PubMed]
- Nene, N.R.; Reisel, D.; Leimbach, A.; Franchi, D.; Jones, A.; Evans, I.; Knapp, S.; Ryan, A.; Ghazali, S.; Timms, J.F.; et al. Association between the cervicovaginal microbiome, brca1 mutation status, and risk of ovarian cancer: A case-control study. Lancet Oncol. 2019, 20, 1171–1182. [Google Scholar] [CrossRef]
- Jiang, N.; Dai, Q.; Su, X.; Fu, J.; Feng, X.; Peng, J. Role of pi3k/akt pathway in cancer: The framework of malignant behavior. Mol. Biol Rep. 2020, 47, 4587–4629. [Google Scholar] [CrossRef]
- Olopade, O.I.; Bohlander, S.K.; Pomykala, H.; Maltepe, E.; Van Melle, E.; Le Beau, M.M.; Diaz, M.O. Mapping of the shortest region of overlap of deletions of the short arm of chromosome 9 associated with human neoplasia. Genomics 1992, 14, 437–443. [Google Scholar] [CrossRef]
- Akula, S.M.; Pramod, N.P.; Wang, F.Z.; Chandran, B. Integrin alpha3beta1 (cd 49c/29) is a cellular receptor for kaposi’s sarcoma-associated herpesvirus (kshv/hhv-8) entry into the target cells. Cell 2002, 108, 407–419. [Google Scholar] [CrossRef] [Green Version]
- Mabuchi, S.; Kuroda, H.; Takahashi, R.; Sasano, T. The pi3k/akt/mtor pathway as a therapeutic target in ovarian cancer. Gynecol. Oncol. 2015, 137, 173–179. [Google Scholar] [CrossRef]
- Wen, W.; Liang, W.; Wu, J.; Kowolik, C.M.; Buettner, R.; Scuto, A.; Hsieh, M.Y.; Hong, H.; Brown, C.E.; Forman, S.J.; et al. Targeting jak1/stat3 signaling suppresses tumor progression and metastasis in a peritoneal model of human ovarian cancer. Mol. Cancer Ther. 2014, 13, 3037–3048. [Google Scholar] [CrossRef] [Green Version]
- Li, H.; Zeng, J.; Shen, K. Pi3k/akt/mtor signaling pathway as a therapeutic target for ovarian cancer. Arch. Gynecol. Obstet. 2014, 290, 1067–1078. [Google Scholar] [CrossRef] [PubMed]
- Philip, C.A.; Laskov, I.; Beauchamp, M.C.; Marques, M.; Amin, O.; Bitharas, J.; Kessous, R.; Kogan, L.; Baloch, T.; Gotlieb, W.H.; et al. Inhibition of pi3k-akt-mtor pathway sensitizes endometrial cancer cell lines to parp inhibitors. BMC Cancer 2017, 17, 638. [Google Scholar] [CrossRef] [PubMed]
- Yan, B.; Freiwald, T.; Chauss, D.; Wang, L.; West, E.; Bibby, J.; Olson, M.; Kordasti, S.; Portilla, D.; Laurence, A.; et al. Sars-cov2 drives jak1/2-dependent local and systemic complement hyper-activation. Res. Sq. 2020. [Google Scholar] [CrossRef]
- Wei, W.; Lv, S.; Zhang, C.; Tian, Y. Potential role of hgf-parp-1 signaling in invasion of ovarian cancer cells. Int. J. Clin. Exp. Pathol. 2018, 11, 3310–3317. [Google Scholar]
- Mallmann-Gottschalk, N.; Sax, Y.; Kimmig, R.; Lang, S.; Brandau, S. Egfr-specific tyrosine kinase inhibitor modifies nk cell-mediated antitumoral activity against ovarian cancer cells. Int. J. Mol. Sci. 2019, 20, 4693. [Google Scholar] [CrossRef] [Green Version]
- Weickhardt, A.J.; Price, T.J.; Chong, G.; Gebski, V.; Pavlakis, N.; Johns, T.G.; Azad, A.; Skrinos, E.; Fluck, K.; Dobrovic, A.; et al. Dual targeting of the epidermal growth factor receptor using the combination of cetuximab and erlotinib: Preclinical evaluation and results of the phase ii dux study in chemotherapy-refractory, advanced colorectal cancer. J. Clin. Oncol. 2012, 30, 1505–1512. [Google Scholar] [CrossRef]
- Naccache, S.N.; Greninger, A.L.; Lee, D.; Coffey, L.L.; Phan, T.; Rein-Weston, A.; Aronsohn, A.; Hackett, J., Jr.; Delwart, E.L.; Chiu, C.Y. The perils of pathogen discovery: Origin of a novel parvovirus-like hybrid genome traced to nucleic acid extraction spin columns. J. Virol. 2013, 87, 11966–11977. [Google Scholar] [CrossRef] [PubMed] [Green Version]


| Species | TaxID | Nucleotides | Tube | Cancer |
|---|---|---|---|---|
| Morganella morganii | 582 | NZ_CP033056.1 | 107.72 | 105.56 |
| Bacillus licheniformis | 1402 | NZ_CP021669.1 | 75.95 | 76.12 |
| Bacillus megaterium | 1404 | NZ_CP026740.1 | 121.36 | 122.05 |
| NZ_CP026741.1 | 133.93 | 132.99 | ||
| Corynebacterium pseudotuberculosis | 1719 | NZ_CP046731.1 | 199.59 | 201.63 |
| NZ_CP046732.1 | 199.59 | 201.63 | ||
| Cutibacterium acnes | 1747 | NZ_AP019664.1 | 262.37 | 253.21 |
| NZ_CP012351.1 | 265.00 | 258.35 | ||
| NZ_CP012352.1 | 301.50 | 266.20 | ||
| NZ_CP012354.1 | 266.00 | 243.00 | ||
| NZ_CP012355.1 | 261.00 | 265.87 | ||
| NZ_CP012647.1 | 264.69 | 259.79 | ||
| Riemerella anatipestifer | 34,085 | NZ_CP029760.1 | 125.79 | 141.15 |
| NZ_CP045564.1 | 84.00 | 89.71 | ||
| NZ_LT906475.1 | 85.11 | 79.47 | ||
| Salinibacter ruber | 146,919 | NZ_CP030356.1 | 23.20 | 28.50 |
| NZ_CP030716.1 | 26.94 | 27.13 | ||
| Orgyia pseudotsugata multiple nucleopolyhedrovirus | 262,177 | NC_001875.2 | 148.10 | 160.98 |
| Mycobacterium shigaense | 722,731 | NZ_CP022927.1 | 127.22 | 126.70 |
| Nostocales cyanobacterium HT-58-2 | 1,940,762 | NZ_CP019636.1 | 58.18 | 57.39 |
| Bacillus tropicus | 2,026,188 | NZ_CP041081.1 | 223.61 | 212.87 |
| Pusillimonas sp. ye3 | 2,028,345 | NZ_CP022987.1 | 89.07 | 87.06 |
| lncRNA | mRNA | r2 | p-Value |
|---|---|---|---|
| AL163541.1 | MIR4539 | 0.32 | 0.0002 |
| AL163541.1 | FXYD7 | 0.32 | 0.0003 |
| AL163541.1 | ARL9 | 0.31 | 0.0004 |
| AL163541.1 | KCNQ5-AS1 | 0.31 | 0.0004 |
| AL163541.1 | ZNF433 | −0.30 | 0.0008 |
| AL163541.1 | MIR933 | 0.29 | 0.0010 |
| AL163541.1 | FXYD5 | 0.29 | 0.0010 |
| AL163541.1 | OR8B8 | 0.29 | 0.0012 |
| AL163541.1 | MYCNOS | −0.29 | 0.0013 |
| AL163541.1 | RYBP | −0.29 | 0.0013 |
| AL163541.1 | RNU6-69P | −0.28 | 0.0014 |
| AL163541.1 | SLC22A6 | −0.28 | 0.0016 |
| AL163541.1 | ANO10 | −0.28 | 0.0016 |
| AL163541.1 | PANO1 | 0.28 | 0.0016 |
| AL163541.1 | LOC642366 | 0.28 | 0.0019 |
| AL163541.1 | POLM | 0.27 | 0.0020 |
| AL163541.1 | SMC6 | −0.27 | 0.0029 |
| AL163541.1 | MIR4733 | −0.26 | 0.0030 |
| AL163541.1 | ZNF90 | −0.26 | 0.0033 |
| AL163541.1 | TTC32 | −0.26 | 0.0033 |
| AL163541.1 | VTRNA1-1 | −0.26 | 0.0034 |
| AL163541.1 | MIR466 | 0.26 | 0.0035 |
| AL163541.1 | IFNA21 | 0.26 | 0.0036 |
| AL163541.1 | DKKL1 | −0.26 | 0.0036 |
| AL163541.1 | MYCN | −0.26 | 0.0038 |
| AL163541.1 | MIR5582 | −0.26 | 0.0039 |
| AL163541.1 | TAF1B | −0.26 | 0.0039 |
| AL163541.1 | RDX | −0.26 | 0.0039 |
| AL163541.1 | RPS12 | 0.26 | 0.0041 |
| AL163541.1 | KRTAP24-1 | 0.26 | 0.0041 |
| AL163541.1 | PDCD6IPP2 | −0.26 | 0.0041 |
| AL163541.1 | GJC2 | 0.25 | 0.0043 |
| AL163541.1 | ITGA3 | 0.25 | 0.0044 |
| AL163541.1 | ANXA8 | 0.25 | 0.0044 |
| AL163541.1 | MIR3944 | 0.25 | 0.0045 |
| AL163541.1 | MIR3126 | 0.25 | 0.0047 |
| AL163541.1 | ZNF676 | −0.25 | 0.0048 |
| AL163541.1 | FAM50B | 0.25 | 0.0049 |
| AL163541.1 | MESDC2 | −0.25 | 0.0050 |
| ID | Description | p-Value | Symbols |
|---|---|---|---|
| hsa05168 | Herpes simplex virus 1 infection | 0.002 | ZNF433/ZNF90/IFNA21/ZNF676/JAK1 |
| hsa04151 | PI3K-Akt signaling pathway | 0.003 | IFNA21/ITGA3/HGF/JAK1 |
| hsa05171 | Coronavirus disease—COVID-19 | 0.008 | IFNA21/RPS12/JAK1 |
| hsa01521 | EGFR tyrosine kinase inhibitor resistance | 0.009 | HGF/JAK1 |
| hsa05165 | Human papillomavirus infection | 0.021 | IFNA21/ITGA3/JAK1 |
| hsa03450 | Non-homologous end-joining | 0.024 | POLM |
| hsa05162 | Measles | 0.027 | IFNA21/JAK1 |
| hsa05160 | Hepatitis C | 0.033 | IFNA21/JAK1 |
| hsa04217 | Necroptosis | 0.034 | IFNA21/JAK1 |
| hsa04630 | JAK-STAT signaling pathway | 0.035 | IFNA21/JAK1 |
| hsa05161 | Hepatitis B | 0.035 | IFNA21/JAK1 |
| hsa05164 | Influenza A | 0.039 | IFNA21/JAK1 |
| hsa05152 | Tuberculosis | 0.043 | IFNA21/JAK1 |
| hsa04621 | NOD-like receptor signaling pathway | 0.043 | IFNA21/JAK1 |
| hsa05167 | Kaposi sarcoma-associated herpesvirus infection | 0.049 | IFNA21/JAK1 |
Publisher’s Note: MDPI stays neutral with regard to jurisdictional claims in published maps and institutional affiliations. |
© 2021 by the authors. Licensee MDPI, Basel, Switzerland. This article is an open access article distributed under the terms and conditions of the Creative Commons Attribution (CC BY) license (http://creativecommons.org/licenses/by/4.0/).
Share and Cite
Gonzalez-Bosquet, J.; Pedra-Nobre, S.; Devor, E.J.; Thiel, K.W.; Goodheart, M.J.; Bender, D.P.; Leslie, K.K. Bacterial, Archaea, and Viral Transcripts (BAVT) Expression in Gynecological Cancers and Correlation with Regulatory Regions of the Genome. Cancers 2021, 13, 1109. https://0-doi-org.brum.beds.ac.uk/10.3390/cancers13051109
Gonzalez-Bosquet J, Pedra-Nobre S, Devor EJ, Thiel KW, Goodheart MJ, Bender DP, Leslie KK. Bacterial, Archaea, and Viral Transcripts (BAVT) Expression in Gynecological Cancers and Correlation with Regulatory Regions of the Genome. Cancers. 2021; 13(5):1109. https://0-doi-org.brum.beds.ac.uk/10.3390/cancers13051109
Chicago/Turabian StyleGonzalez-Bosquet, Jesus, Silvana Pedra-Nobre, Eric J. Devor, Kristina W. Thiel, Michael J. Goodheart, David P. Bender, and Kimberly K. Leslie. 2021. "Bacterial, Archaea, and Viral Transcripts (BAVT) Expression in Gynecological Cancers and Correlation with Regulatory Regions of the Genome" Cancers 13, no. 5: 1109. https://0-doi-org.brum.beds.ac.uk/10.3390/cancers13051109