
Prediction of Microscopic Metastases in Patients with Metachronous Oligo-Metastases after Curative Treatment of Non-Small Cell Lung Cancer: A Microsimulation Study

 , ,
, ,
Abstract
:Simple Summary
Abstract
1. Introduction
2. Materials and Methods
2.1. Concept of the Microsimulation Model
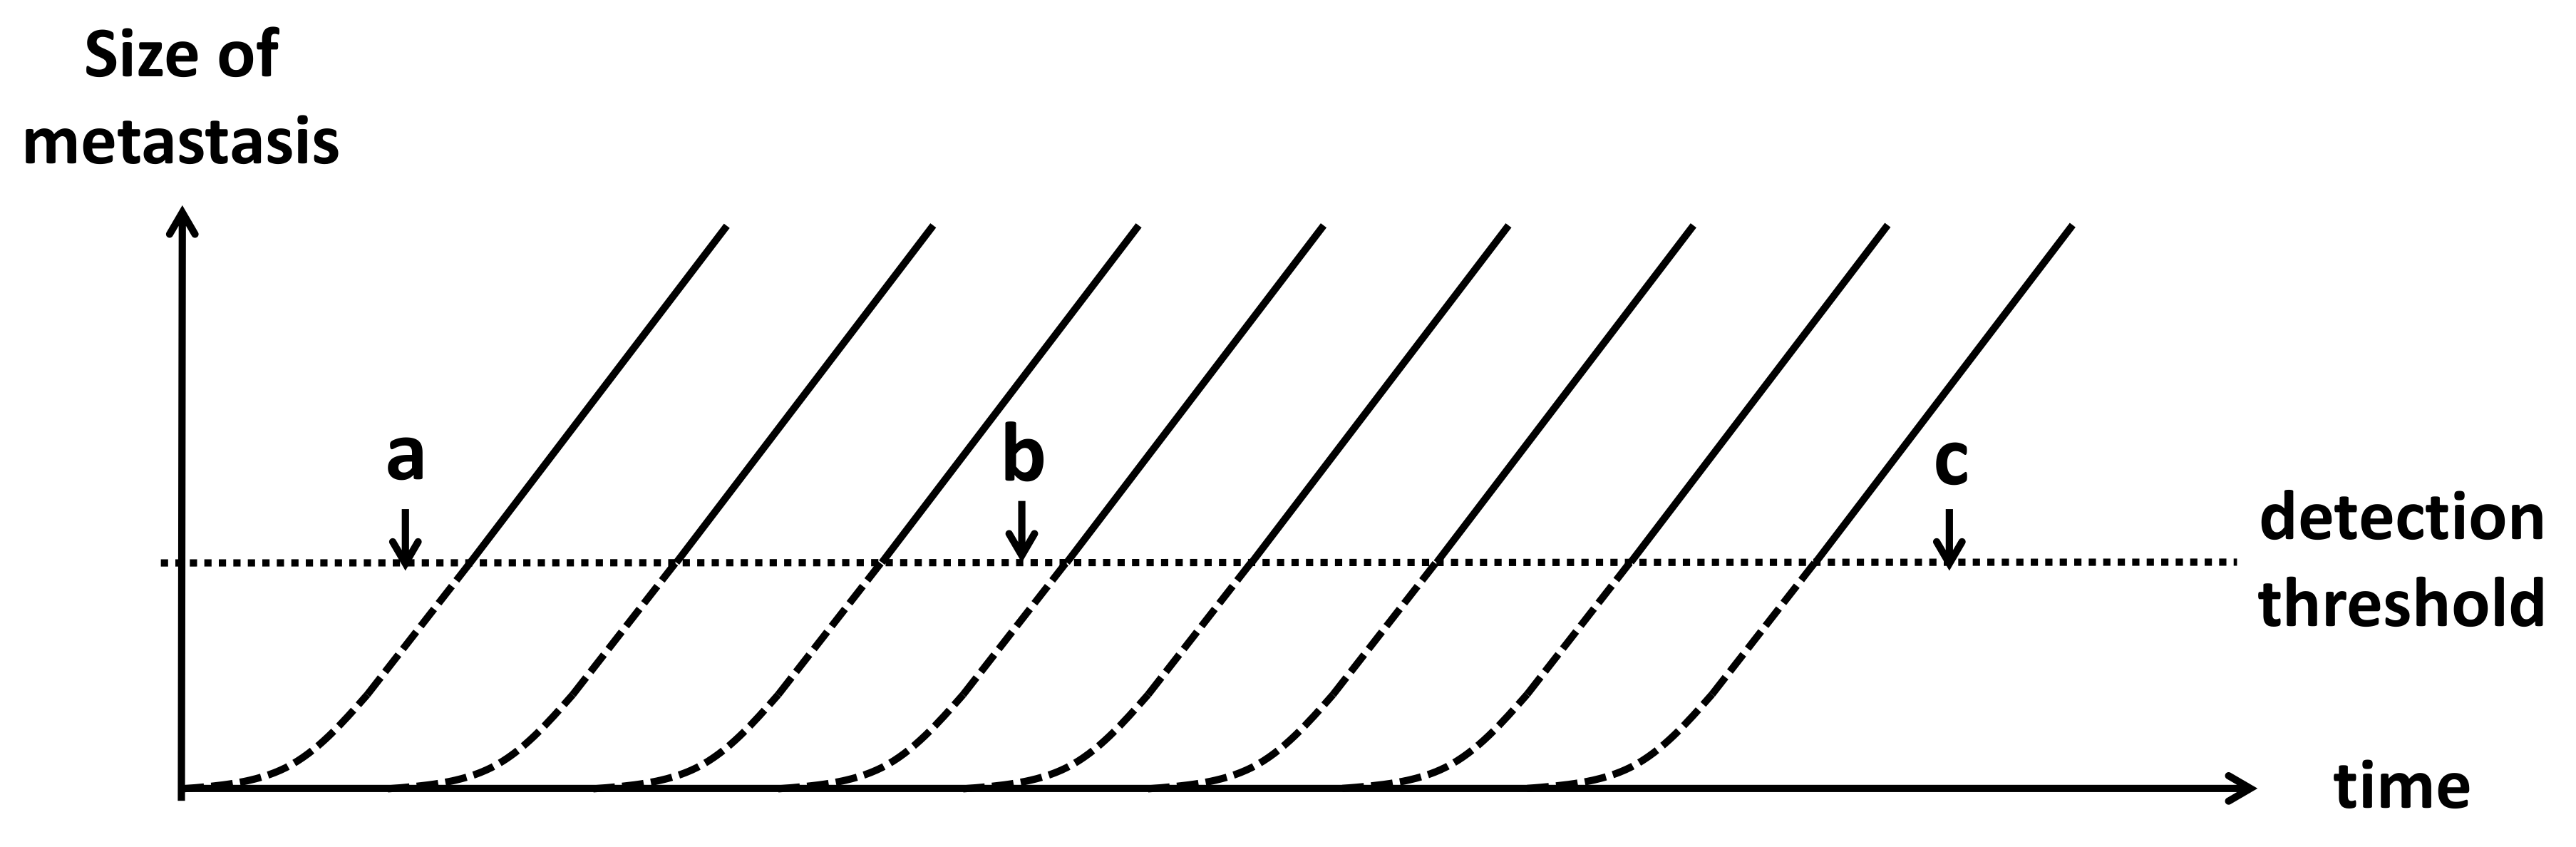
- An exponential tumour growth model using volume doubling time was chosen, because volume doubling time is the most commonly used statistic in the literature. All metastases within one patient are assumed to have the same growth rate, and are formed consecutively with fixed time intervals. This assumption has been tested in Scenario 2 of the sensitivity analyses.
- Each patient is assumed to have a fixed number of metastases after their primary tumour had been curatively treated. The proportion of patients that have zero metastases after curative treatment equals the proportion of patients that are recurrence-free after 5 years. In all other patients, the number of metastases is randomly drawn from a rounded truncated normal distribution.
- We assume that metastases below the minimum detectable size for the Computed Tomography scan will always be missed.
- Metastases of detectable size are either found during surveillance or on an unscheduled scan because of symptoms, whichever happens first. Other scenarios are not considered. Surveillance CT scans are able to detect recurrences to the lung, liver, and adrenal glands. Bone and brain metastases are highly symptomatic. Less than 3% of NSCLC metastases are found in other organs, and these metastases are often also symptomatic [22,23]. Therefore, we assume that the com-bination of symptomatic and surveillance detection sufficiently describes the detection patterns.
- Once one recurrence is detected, a more rigorous examination, that is, Positron Emission Tomography–Computed Tomography, follows, resulting in detection of all metastases above the minimum detectable size.
- The proportion of patients with microscopic metastases within those with detected oligo-recurrent disease is assumed to be equal to the proportion of patients with a 5-year PFS after treatment of oligo-recurrent disease. This may lead to an underestimation of the proportion of oligo-metastases. Therefore, this assumption was further investigated in Scenario 1 of the sensitivity analyses.
2.2. Model Functions
2.3. Parameter Estimation
2.4. Model Calibration
2.5. Model Simulations
2.6. Prognostic Groups
2.7. Sensitivity Analyses
- Recalibration of model parameters to the upper and lower confidence interval of their targets.
- Random variation in VDT of metastases within one patient and in the detection threshold.
- Correlation between the volume doubling time and the total number of metastases per patient.
- Redefinition of the oligo-metastases threshold to 1 or to 5 metastases.
- The ability of the metastases to produce new metastases.
3. Results
3.1. Calibration
3.2. Simulation Results
3.3. Prognostic Groups
3.4. Sensitivity Analyses
4. Discussion
4.1. Key Findings
4.2. Clinical Implications
4.3. Microsimulation Model
4.4. Prognostic Groups
4.5. Future Developments
4.6. Recommendations on Data Collection
Author Contributions
Funding
Institutional Review Board Statement
Informed Consent Statement
Data Availability Statement
Conflicts of Interest
Appendix A
Appendix A.1. Derivation of Function (4)
Appendix A.2. Sensitivity Analyses: Alternative Calibration Targets
Appendix A.3. Sensitivity Analyses: Random Normal Variation around the Model Parameters
Appendix A.4. Sensitivity Analyses: Correlation between Volume Doubling Time and the Total Number of Metastases
Appendix A.5. Sensitivity Analyses: Adaptation of the Definition of Oligo-Metastases
Appendix A.6. Sensitivity Analyses: Metastasizing Metastases


| Asymptomatic | Symptomatic | |||||
|---|---|---|---|---|---|---|
| Metastases detected: | 1 | 2 | 3 | 1 | 2 | 3 |
| Small (<6 mm) | 0.95 | 0.95 | 0.96 | 0.91 | 0.91 | 0.89 |
| Medium (6–8 mm) | 0.12 | 0.76 | 0.87 | 0.16 | 0.76 | 0.86 |
| Large (>8 mm) | 0.00 | 0.02 | 0.25 | 0.00 | 0.06 | 0.27 |
| Asymptomatic | Symptomatic | |||||
|---|---|---|---|---|---|---|
| Metastases detected: | 1 | 2 | 3 | 1 | 2 | 3 |
| Small (<6 mm) | 0.88 | 0.90 | 0.91 | 0.83 | 0.83 | 0.78 |
| Medium (6–8 mm) | 0.06 | 0.58 | 0.77 | 0.07 | 0.58 | 0.73 |
| Large (>8 mm) | 0.00 | 0.02 | 0.17 | 0.00 | 0.00 | 0.11 |
| Asymptomatic | Symptomatic | |||||
|---|---|---|---|---|---|---|
| Metastases detected: | 1 | 2 | 3 | 1 | 2 | 3 |
| Small (<6 mm) | 0.91 | 0.92 | 0.91 | 0.89 | 0.86 | 0.83 |
| Medium (6–8 mm) | 0.08 | 0.64 | 0.83 | 0.10 | 0.55 | 0.77 |
| Large (>8 mm) | 0.00 | 0.02 | 0.17 | 0.00 | 0.06 | 0.19 |
| Asymptomatic | Symptomatic | |||||
|---|---|---|---|---|---|---|
| Metastases detected: | 1 | 2 | 3 | 1 | 2 | 3 |
| Small (<6 mm) | 0.91 | 0.92 | 0.93 | 0.88 | 0.88 | 0.84 |
| Medium (6–8 mm) | 0.10 | 0.63 | 0.81 | 0.14 | 0.69 | 0.82 |
| Large (>8 mm) | 0.00 | 0.04 | 0.18 | 0.00 | 0.00 | 0.03 |
| Asymptomatic | Symptomatic | |||||
|---|---|---|---|---|---|---|
| Metastases detected: | 1 | 2 | 3 | 1 | 2 | 3 |
| Small (<6 mm) | 0.90 | 0.91 | 0.92 | 0.85 | 0.82 | 0.79 |
| Medium (6–8 mm) | 0.01 | 0.40 | 0.69 | 0.00 | 0.41 | 0.69 |
| Large (>8 mm) | 0.00 | 0.00 | 0.03 | 0.00 | 0.00 | 0.05 |
| Asymptomatic | Symptomatic | |||||
|---|---|---|---|---|---|---|
| Metastases detected: | 1 | 2 | 3 | 1 | 2 | 3 |
| Small (<6 mm) | 0.92 | 0.93 | 0.93 | 0.87 | 0.86 | 0.85 |
| Medium (6–8 mm) | 0.18 | 0.71 | 0.84 | 0.04 | 0.68 | 0.81 |
| Large (>8 mm) | 0.00 | 0.05 | 0.28 | 0.00 | 0.07 | 0.22 |
| Asymptomatic | Symptomatic | |||||
|---|---|---|---|---|---|---|
| Metastases detected: | 1 | 2 | 3 | 1 | 2 | 3 |
| Small (<6 mm) | 0.91 | 0.92 | 0.93 | 0.86 | 0.86 | 0.83 |
| Medium (6–8 mm) | 0.05 | 0.61 | 0.79 | 0.17 | 0.68 | 0.81 |
| Large (>8 mm) | 0.00 | 0.01 | 0.17 | 0.00 | 0.00 | 0.11 |
| Asymptomatic | Symptomatic | |||||
|---|---|---|---|---|---|---|
| Metastases detected: | 1 | 2 | 3 | 1 | 2 | 3 |
| Small (<6 mm) | 0.91 | 0.93 | 0.93 | 0.88 | 0.87 | 0.84 |
| Medium (6–8 mm) | 0.07 | 0.65 | 0.82 | 0.13 | 0.68 | 0.81 |
| Large (>8 mm) | 0.00 | 0.01 | 0.20 | 0.00 | 0.03 | 0.18 |
| Asymptomatic | Symptomatic | |||||
|---|---|---|---|---|---|---|
| Metastases detected: | 1 | 2 | 3 | 1 | 2 | 3 |
| Small (<6 mm) | 0.91 | 0.92 | 0.92 | 0.84 | 0.89 | 0.84 |
| Medium (6–8 mm) | 0.10 | 0.66 | 0.80 | 0.07 | 0.71 | 0.80 |
| Large (>8 mm) | 0.00 | 0.02 | 0.22 | 0.00 | 0.03 | 0.25 |
| Asymptomatic | Symptomatic | |||||
|---|---|---|---|---|---|---|
| Metastases detected: | 1 | 2 | 3 | 1 | 2 | 3 |
| Small (<6 mm) | 0.90 | 0.92 | 0.93 | 0.89 | 0.86 | 0.83 |
| Medium (6–8 mm) | 0.11 | 0.64 | 0.80 | 0.00 | 0.68 | 0.83 |
| Large (>8 mm) | 0.00 | 0.02 | 0.19 | 0.00 | 0.05 | 0.18 |
| Asymptomatic | Symptomatic | |||||
|---|---|---|---|---|---|---|
| Metastases detected: | 1 | 2 | 3 | 1 | 2 | 3 |
| Small (<6 mm) | 0.93 | 0.93 | 0.94 | 0.94 | 0.90 | 0.85 |
| Medium (6–8 mm) | 0.10 | 0.65 | 0.80 | 0.15 | 0.57 | 0.81 |
| Large (>8 mm) | 0.00 | 0.02 | 0.14 | 0.00 | 0.00 | 0.11 |
| Asymptomatic | Symptomatic | |||||
|---|---|---|---|---|---|---|
| Metastases detected: | 1 | 2 | 3 | 1 | 2 | 3 |
| Small (<6 mm) | 0.95 | 0.95 | 0.96 | 0.93 | 0.92 | 0.90 |
| Medium (6–8 mm) | 0.11 | 0.69 | 0.83 | 0.15 | 0.64 | 0.86 |
| Large (>8 mm) | 0.00 | 0.01 | 0.09 | 0.00 | 0.00 | 0.09 |
| Asymptomatic | Symptomatic | |
|---|---|---|
| Metastases detected: | 1 | 1 |
| Small (<6 mm) | 0.94 | 0.89 |
| Medium (6–8 mm) | 0.09 | 0.08 |
| Large (>8 mm) | 0.00 | 0.00 |
| Asymptomatic | Symptomatic | |||||||||
|---|---|---|---|---|---|---|---|---|---|---|
| Metastases detected: | 1 | 2 | 3 | 4 | 5 | 1 | 2 | 3 | 4 | 5 |
| Small (<6 mm) | 0.87 | 0.88 | 0.90 | 0.90 | 0.90 | 0.84 | 0.84 | 0.80 | 0.79 | 0.74 |
| Medium (6–8 mm) | 0.08 | 0.58 | 0.78 | 0.81 | 0.85 | 0.08 | 0.70 | 0.80 | 0.73 | 0.69 |
| Large (>8 mm) | 0.00 | 0.02 | 0.18 | 0.39 | 0.52 | 0.00 | 0.00 | 0.22 | 0.51 | 0.60 |
| Asymptomatic | Symptomatic | |||||
|---|---|---|---|---|---|---|
| Metastases detected: | 1 | 2 | 3 | 1 | 2 | 3 |
| Small (<6 mm) | 0.91 | 0.92 | 0.94 | 0.88 | 0.88 | 0.84 |
| Medium (6–8 mm) | 0.12 | 0.64 | 0.83 | 0.14 | 0.73 | 0.85 |
| Large (>8 mm) | 0.21 | 0.34 | 0.48 | 0.16 | 0.32 | 0.46 |
| Asymptomatic | Symptomatic | |||||
|---|---|---|---|---|---|---|
| Metastases detected: | 1 | 2 | 3 | 1 | 2 | 3 |
| Small (<6 mm) | 0.92 | 0.93 | 0.95 | 0.89 | 0.89 | 0.86 |
| Medium (6–8 mm) | 0.21 | 0.70 | 0.87 | 0.26 | 0.77 | 0.88 |
| Large (>8 mm) | 0.46 | 0.64 | 0.73 | 0.45 | 0.60 | 0.73 |
| Asymptomatic | Symptomatic | |||||
|---|---|---|---|---|---|---|
| Metastases detected: | 1 | 2 | 3 | 1 | 2 | 3 |
| Small (<6 mm) | 0.93 | 0.95 | 0.96 | 0.90 | 0.91 | 0.90 |
| Medium (6–8 mm) | 0.40 | 0.81 | 0.93 | 0.45 | 0.86 | 0.93 |
| Large (>8 mm) | 0.74 | 0.89 | 0.93 | 0.77 | 0.85 | 0.93 |
References
- Halsted, W.S.I. The results of operations for the cure of cancer of the breast performed at the Johns Hopkins Hospital from June, 1889, to January, 1894. Ann. Surg. 1894, 20, 497–555. [Google Scholar] [CrossRef]
- Hellman, S. Karnofsky memorial lecture. Natural history of small breast cancers. J. Clin. Oncol. 1994, 12, 2229–2234. [Google Scholar] [CrossRef] [PubMed]
- Weichselbaum, R.R.; Hellman, S. Oligometastases revisited. Nat. Rev. Clin. Oncol. 2011, 8, 378–382. [Google Scholar] [CrossRef] [PubMed]
- Niibe, Y.; Hayakawa, K. Oligometastases and oligo-recurrence: The new era of cancer therapy. Jpn. J. Clin. Oncol. 2010, 40, 107–111. [Google Scholar] [CrossRef] [Green Version]
- Ashworth, A.B.; Senan, S.; Palma, D.A.; Riquet, M.; Ahn, Y.C.; Ricardi, U.; Congedo, M.T.; Gomez, D.R.; Wright, G.M.; Melloni, G.; et al. An individual patient data metaanalysis of outcomes and prognostic factors after treatment of oligometastatic non-small-cell lung cancer. Clin. Lung Cancer 2014, 15, 346–355. [Google Scholar] [CrossRef] [PubMed]
- Congedo, M.T.; Cesario, A.; Lococo, F.; De Waure, C.; Apolone, G.; Meacci, E.; Cavuto, S.; Granone, P. Surgery for oligometastatic non-small cell lung cancer: Long-term results from a single center experience. J. Thorac. Cardiovasc. Surg. 2012, 144, 444–452. [Google Scholar] [CrossRef] [PubMed] [Green Version]
- Hishida, T.; Yoshida, J.; Aokage, K.; Nagai, K.; Tsuboi, M. Postoperative oligo-recurrence of non-small-cell lung cancer: Clinical features and survivaldagger. Eur. J. Cardiothorac. Surg. 2016, 49, 847–853. [Google Scholar] [CrossRef]
- Kwint, M.; Walraven, I.; Burgers, S.; Hartemink, K.; Klomp, H.; Knegjens, J.; Verheij, M.; Belderbos, J. Outcome of radical local treatment of non-small cell lung cancer patients with synchronous oligometastases. Lung Cancer 2017, 112, 134–139. [Google Scholar] [CrossRef]
- Luke, J.J.; Lemons, J.M.; Karrison, T.G.; Pitroda, S.P.; Melotek, J.M.; Zha, Y.; Al-Hallaq, H.A.; Arina, A.; Khodarev, N.N.; Janisch, L.; et al. Safety and clinical activity of pembrolizumab and multisite stereotactic body radiotherapy in patients with advanced solid tumors. J. Clin. Oncol. 2018, 36, 1611–1618. [Google Scholar] [CrossRef]
- Stokes, W.A.; Bronsert, M.R.; Meguid, R.A.; Blum, M.G.; Jones, B.L.; Koshy, M.; Sher, D.J.; Louie, A.V.; Palma, D.A.; Senan, S.; et al. Post-treatment mortality after surgery and stereotactic body radiotherapy for early-stage non-small-cell lung cancer. J. Clin. Oncol. 2018, 36, 642–651. [Google Scholar] [CrossRef] [PubMed]
- Folkert, M.R.; Timmerman, R. Review of treatment options for oligometastatic non-small cell lung cancer. Clin. Adv. Hematol. Oncol. 2015, 13, 186–193. [Google Scholar]
- Ashworth, A.; Rodrigues, G.; Boldt, G.; Palma, D. Is there an oligometastatic state in non-small cell lung cancer? A systematic review of the literature. Lung Cancer 2013, 82, 197–203. [Google Scholar] [CrossRef]
- Patel, A.N.; Simone, C.B., 2nd; Jabbour, S.K. Risk factors and management of oligometastatic non-small cell lung cancer. Ther. Adv. Respir. Dis. 2016, 10, 338–348. [Google Scholar] [CrossRef] [PubMed] [Green Version]
- Guerrero, E.; Ahmed, M. The role of stereotactic ablative radiotherapy (SBRT) in the management of oligometastatic non small cell lung cancer. Lung Cancer 2016, 92, 22–28. [Google Scholar] [CrossRef] [PubMed]
- Laba, J.M.; Senan, S.; Schellenberg, D.; Harrow, S.; Mulroy, L.; Senthi, S.; Swaminath, A.; Kopek, N.; Pantarotto, J.R.; Pan, L.; et al. Identifying barriers to accrual in radiation oncology randomized trials. Curr. Oncol. 2017, 24, e524–e530. [Google Scholar] [CrossRef] [PubMed] [Green Version]
- Utley, M.; Treasure, T. Interpreting data from surgical follow-up studies: The role of modeling. J. Thorac. Oncol. 2010, 5 (Suppl. 2), S200–S202. [Google Scholar] [CrossRef] [PubMed] [Green Version]
- Palma, D.A.; Salama, J.K.; Lo, S.S.; Senan, S.; Treasure, T.; Govindan, R.; Weichselbaum, R. The oligometastatic state—Separating truth from wishful thinking. Nat. Rev. Clin. Oncol. 2014, 11, 549–557. [Google Scholar] [CrossRef] [PubMed]
- Fuentes, R.; Bonfill, X.; Exposito, J. Surgery versus radiosurgery for patients with a solitary brain metastasis from non-small cell lung cancer. Cochrane Database Syst. Rev. 2006, 1, CD004840. [Google Scholar] [CrossRef] [PubMed]
- Novoa, N.M.; Varela, G.; Jimenez, M.F. Surgical management of oligometastatic non-small cell lung cancer. J. Thorac. Dis. 2016, 8 (Suppl. 11), S895–S900. [Google Scholar] [CrossRef] [PubMed] [Green Version]
- Torok, J.A.; Gu, L.; Tandberg, D.J.; Wang, X.; Harpole, D.H., Jr.; Kelsey, C.R.; Salama, J.K. Patterns of distant metastases after surgical management of non-small-cell lung cancer. Clin. Lung Cancer 2017, 18, e57–e70. [Google Scholar] [CrossRef]
- Shimada, Y.; Saji, H.; Kakihana, M.; Kajiwara, N.; Ohira, T.; Ikeda, N. Survival outcomes for oligometastasis in resected non-small cell lung cancer. Asian Cardiovasc. Thorac. Ann. 2015, 23, 937–944. [Google Scholar] [CrossRef] [PubMed]
- Jensen, G.L.; Tang, C.; Hess, K.R.; Liao, Z.; Gomez, D.R. Patterns of metastatic progression after definitive radiation therapy for early-stage and locally advanced non-small cell lung cancer. Clin. Exp. Metastasis 2017, 34, 315–322. [Google Scholar] [CrossRef] [PubMed]
- Senthi, S.; Lagerwaard, F.J.; Haasbeek, C.J.; Slotman, B.J.; Senan, S. Patterns of disease recurrence after stereotactic ablative radiotherapy for early stage non-small-cell lung cancer: A retrospective analysis. Lancet Oncol. 2012, 13, 802–809. [Google Scholar] [CrossRef]
- Verstegen, N.E.; Oosterhuis, J.W.; Palma, D.A.; Rodrigues, G.; Lagerwaard, F.J.; van der Elst, A.; Mollema, R.; van Tets, W.F.; Warner, A.; Joosten, J.J.; et al. Stage I-II non-small-cell lung cancer treated using either stereotactic ablative radiotherapy (SABR) or lobectomy by video-assisted thoracoscopic surgery (VATS): Outcomes of a propensity score-matched analysis. Ann. Oncol. 2013, 24, 1543–1548. [Google Scholar] [CrossRef]
- Kastelijn, E.A.; El Sharouni, S.Y.; Hofman, F.N.; Van Putte, B.P.; Monninkhof, E.M.; Van Vulpen, M.; Schramel, F.M. Clinical outcomes in early-stage NSCLC treated with stereotactic body radiotherapy versus surgical resection. Anticancer Res. 2015, 35, 5607–5614. [Google Scholar] [PubMed]
- Frelinghuysen, M.; Fest, J.; Van der Voort Van Zyp, N.C.; Van der Holt, B.; Hoogeman, M.; Nuyttens, J. Consequences of referral time and volume doubling time in inoperable patients with early stage lung cancer. Clin. Lung Cancer 2017, 18, e403–e409. [Google Scholar] [CrossRef] [PubMed]
- Mackintosh, J.A.; Marshall, H.M.; Yang, I.A.; Bowman, R.V.; Fong, K.M. A retrospective study of volume doubling time in surgically resected non-small cell lung cancer. Respirology 2014, 19, 755–762. [Google Scholar] [CrossRef]
- Murai, T.; Shibamoto, Y.; Baba, F.; Hashizume, C.; Mori, Y.; Ayakawa, S.; Kawai, T.; Takemoto, S.; Sugie, C.; Ogino, H. Progression of non-small-cell lung cancer during the interval before stereotactic body radiotherapy. Int. J. Radiat. Oncol. Biol. Phys. 2012, 82, 463–467. [Google Scholar] [CrossRef] [PubMed]
- Honda, O.; Johkoh, T.; Sekiguchi, J.; Tomiyama, N.; Mihara, N.; Sumikawa, H.; Inoue, A.; Yanagawa, M.; Daimon, T.; Okumura, M.; et al. Doubling time of lung cancer determined using three-dimensional volumetric software: Comparison of squamous cell carcinoma and adenocarcinoma. Lung Cancer 2009, 66, 211–217. [Google Scholar] [CrossRef] [PubMed]
- Walter, J.E.; Heuvelmans, M.A.; de Jong, P.A.; Vliegenthart, R.; van Ooijen, P.M.A.; Peters, R.B.; Ten Haaf, K.; Yousaf-Khan, U.; van der Aalst, C.M.; de Bock, G.H.; et al. Occurrence and lung cancer probability of new solid nodules at incidence screening with low-dose CT: Analysis of data from the randomised, controlled NELSON trial. Lancet Oncol. 2016, 17, 907–916. [Google Scholar] [CrossRef]
- Horeweg, N.; Scholten, E.T.; de Jong, P.A.; van der Aalst, C.M.; Weenink, C.; Lammers, J.W.; Nackaerts, K.; Vliegenthart, R.; ten Haaf, K.; Yousaf-Khan, U.A.; et al. Detection of lung cancer through low-dose CT screening (NELSON): A prespecified analysis of screening test performance and interval cancers. Lancet Oncol. 2014, 15, 1342–1350. [Google Scholar] [CrossRef]
- MacMahon, H.; Naidich, D.P.; Goo, J.M.; Lee, K.S.; Leung, A.N.C.; Mayo, J.R.; Mehta, A.C.; Ohno, Y.; Powell, C.A.; Prokop, M.; et al. Guidelines for management of incidental pulmonary nodules detected on CT images from the Fleischner Society 2017. Radiology 2017, 284, 228–243. [Google Scholar] [CrossRef] [Green Version]
- Lou, F.; Huang, J.; Sima, C.S.; Dycoco, J.; Rusch, V.; Bach, P.B. Patterns of recurrence and second primary lung cancer in early-stage lung cancer survivors followed with routine computed tomography surveillance. J. Thorac. Cardiovasc. Surg. 2013, 145, 75–81. [Google Scholar] [CrossRef] [Green Version]
- Westeel, V.; Choma, D.; Clement, F.; Woronoff-Lemsi, M.C.; Pugin, J.F.; Dubiez, A.; Depierre, A. Relevance of an intensive postoperative follow-up after surgery for non-small cell lung cancer. Ann. Thorac. Surg. 2000, 70, 1185–1190. [Google Scholar] [CrossRef]
- Schwartz, M. A biomathematical approach to clinical tumor growth. Cancer 1961, 14, 1272–1294. [Google Scholar] [CrossRef]
- Withers, H.R.; Lee, S.P. Modeling growth kinetics and statistical distribution of oligometastases. Semin. Radiat. Oncol. 2006, 16, 111–119. [Google Scholar] [CrossRef] [PubMed]
- Team, R.D.C. R: A Language and Environment for Statistical Computing, 3.3.1; R Foundation for Statistical Computing: Vienna, Austria, 2014. [Google Scholar]
- IBM. SPSS Statistics for Windows, Version 22.0; IBM: Armonk, NY, USA, 2013. [Google Scholar]
- Eisenhauer, E.A.; Therasse, P.; Bogaerts, J.; Schwartz, L.H.; Sargent, D.; Ford, R.; Dancey, J.; Arbuck, S.; Gwyther, S.; Mooney, M.; et al. New response evaluation criteria in solid tumours: Revised RECIST guideline (version 1.1). Eur. J. Cancer 2009, 45, 228–247. [Google Scholar] [CrossRef]
- Wagner, J.D.; Schauwecker, D.S.; Davidson, D.; Wenck, S.; Jung, S.H.; Hutchins, G. FDG-PET sensitivity for melanoma lymph node metastases is dependent on tumor volume. J. Surg. Oncol. 2001, 77, 237–242. [Google Scholar] [CrossRef] [PubMed]
- Silvestri, G.A.; Gould, M.K.; Margolis, M.L.; Tanoue, L.T.; McCrory, D.; Toloza, E.; Detterbeck, F.; American College of Chest Pain. Noninvasive staging of non-small cell lung cancer: ACCP evidenced-based clinical practice guidelines (2nd edition). Chest 2007, 132 (Suppl. 3), 178S–201S. [Google Scholar] [CrossRef] [PubMed] [Green Version]
- Rutter, C.M.; Zaslavsky, A.M.; Feuer, E.J. Dynamic microsimulation models for health outcomes: A review. Med. Decis. Mak. 2011, 31, 10–18. [Google Scholar] [CrossRef] [PubMed]
- Stout, N.K.; Knudsen, A.B.; Kong, C.Y.; McMahon, P.M.; Gazelle, G.S. Calibration methods used in cancer simulation models and suggested reporting guidelines. Pharmacoeconomics 2009, 27, 533–545. [Google Scholar] [CrossRef]
- Bahce, D.N.J.M.C.I.; Comans, E.F.I.; Draaisma, W.A.; Van Geffen, W.H.; Hartemink, K.J.; Hendriks, L.E.L.; De Ruysscher, D.; Schaefer-Prokop, C.; Schouwink, J.H.; Schuuring, E.M.D.; et al. Landelijke richtlijn niet kleincellig loncarcinoom. Available online: http://www.oncoline.nl/niet-kleincellig-longcarcinoom (accessed on 7 April 2021).
- Martini, N.; Melamed, M.R. Multiple primary lung cancers. J. Thorac. Cardiovasc. Surg. 1975, 70, 606–612. [Google Scholar] [CrossRef]
- Breslin, S.; O’Driscoll, L. Three-dimensional cell culture: The missing link in drug discovery. Drug Discov. Today 2013, 18, 240–249. [Google Scholar] [CrossRef] [PubMed]
- Benzekry, S.; Lamont, C.; Beheshti, A.; Tracz, A.; Ebos, J.M.; Hlatky, L.; Hahnfeldt, P. Classical mathematical models for description and prediction of experimental tumor growth. PLoS Comput. Biol. 2014, 10, e1003800. [Google Scholar] [CrossRef] [Green Version]
- Oh, Y.; Taylor, S.; Bekele, B.N.; Debnam, J.M.; Allen, P.K.; Suki, D.; Sawaya, R.; Komaki, R.; Stewart, D.J.; Karp, D.D. Number of metastatic sites is a strong predictor of survival in patients with nonsmall cell lung cancer with or without brain metastases. Cancer 2009, 115, 2930–2938. [Google Scholar] [CrossRef]
- Holzel, D.; Eckel, R.; Emeny, R.T.; Engel, J. Distant metastases do not metastasize. Cancer Metastasis Rev. 2010, 29, 737–750. [Google Scholar] [CrossRef] [PubMed]
- Coumans, F.A.; Siesling, S.; Terstappen, L.W. Detection of cancer before distant metastasis. BMC Cancer 2013, 13, 283. [Google Scholar] [CrossRef] [PubMed] [Green Version]
- Tang, C.; Lee, W.C.; Reuben, A.; Chang, L.; Tran, H.; Little, L.; Gumbs, C.; Wargo, J.; Futreal, A.; Liao, Z.; et al. Immune and circulating tumor DNA profiling after radiation treatment for oligometastatic non-small cell lung cancer: Translational correlatives from a mature randomized phase II trial. Int. J. Radiat. Oncol. Biol. Phys. 2020, 106, 349–357. [Google Scholar] [CrossRef] [PubMed] [Green Version]
- Gerber, D.E. Oligometastatic non-small-cell lung cancer: How should we define and manage it? J. Oncol. Pract. 2018, 14, 32–34. [Google Scholar] [CrossRef] [PubMed]
- Iyengar, P.; Wardak, Z.; Gerber, D.E.; Tumati, V.; Ahn, C.; Hughes, R.S.; Dowell, J.E.; Cheedella, N.; Nedzi, L.; Westover, K.D.; et al. Consolidative radiotherapy for limited metastatic non-small-cell lung cancer: A phase 2 randomized clinical trial. JAMA Oncol. 2018, 4, e173501. [Google Scholar] [CrossRef] [PubMed]
- Gomez, D.R.; Blumenschein, G.R., Jr.; Lee, J.J.; Hernandez, M.; Ye, R.; Camidge, D.R.; Doebele, R.C.; Skoulidis, F.; Gaspar, L.E.; Gibbons, D.L.; et al. Local consolidative therapy versus maintenance therapy or observation for patients with oligometastatic non-small-cell lung cancer without progression after first-line systemic therapy: A multicentre, randomised, controlled, phase 2 study. Lancet Oncol. 2016, 17, 1672–1682. [Google Scholar] [CrossRef] [Green Version]


| Parameter | Value | Unit | Notes | Source |
|---|---|---|---|---|
| Simulated patients with metastases | 100,000 | patients | If 100,000 patients are simulated, 4.7% of patients (4708) are expected to have oligo-metastases. | Definition |
| Definition of oligo-recurrence | 1–3 | metastases | Varying definitions for the maximum number of metastases in oligo-recurrence have been used in literature. Most articles used as input for the model used this definition. | Definition |
| Mtotal(µ,σ) | 16, 34 | metastases | Describes number of metastases per patient drawn from a normal distribution. Calibrated to proportion of oligo− (4.7%). (N = 880) | Calibration [6,7,8,20,21] |
| tFU | 91, 182, 365, 548, 730, 1095, 1460, 1825 | days | The surveillance schedule of the simulation model is constructed to match the surveillance of the patients in the Dutch cohorts as much as possible [24,25]. | Definition |
| σFU | 15.5 | days | To determine the time of the surveillance scan, a random normal variation around the planned scan time was used, with a 95% confidence interval of 1 month around the planned scan time. This value is based on expert opinion (L.A., E.A.K., S.Y.S., and F.M.N.H.S.). | Expert opinion |
| tFU min | 61 | days | No surveillance scans are planned before 2 months after curative treatment of the primary tumour. This value is based on expert opinion. | Expert opinion |
| tFU max | 1825 | days | The simulation and analysis stop after 5 years. | Definition |
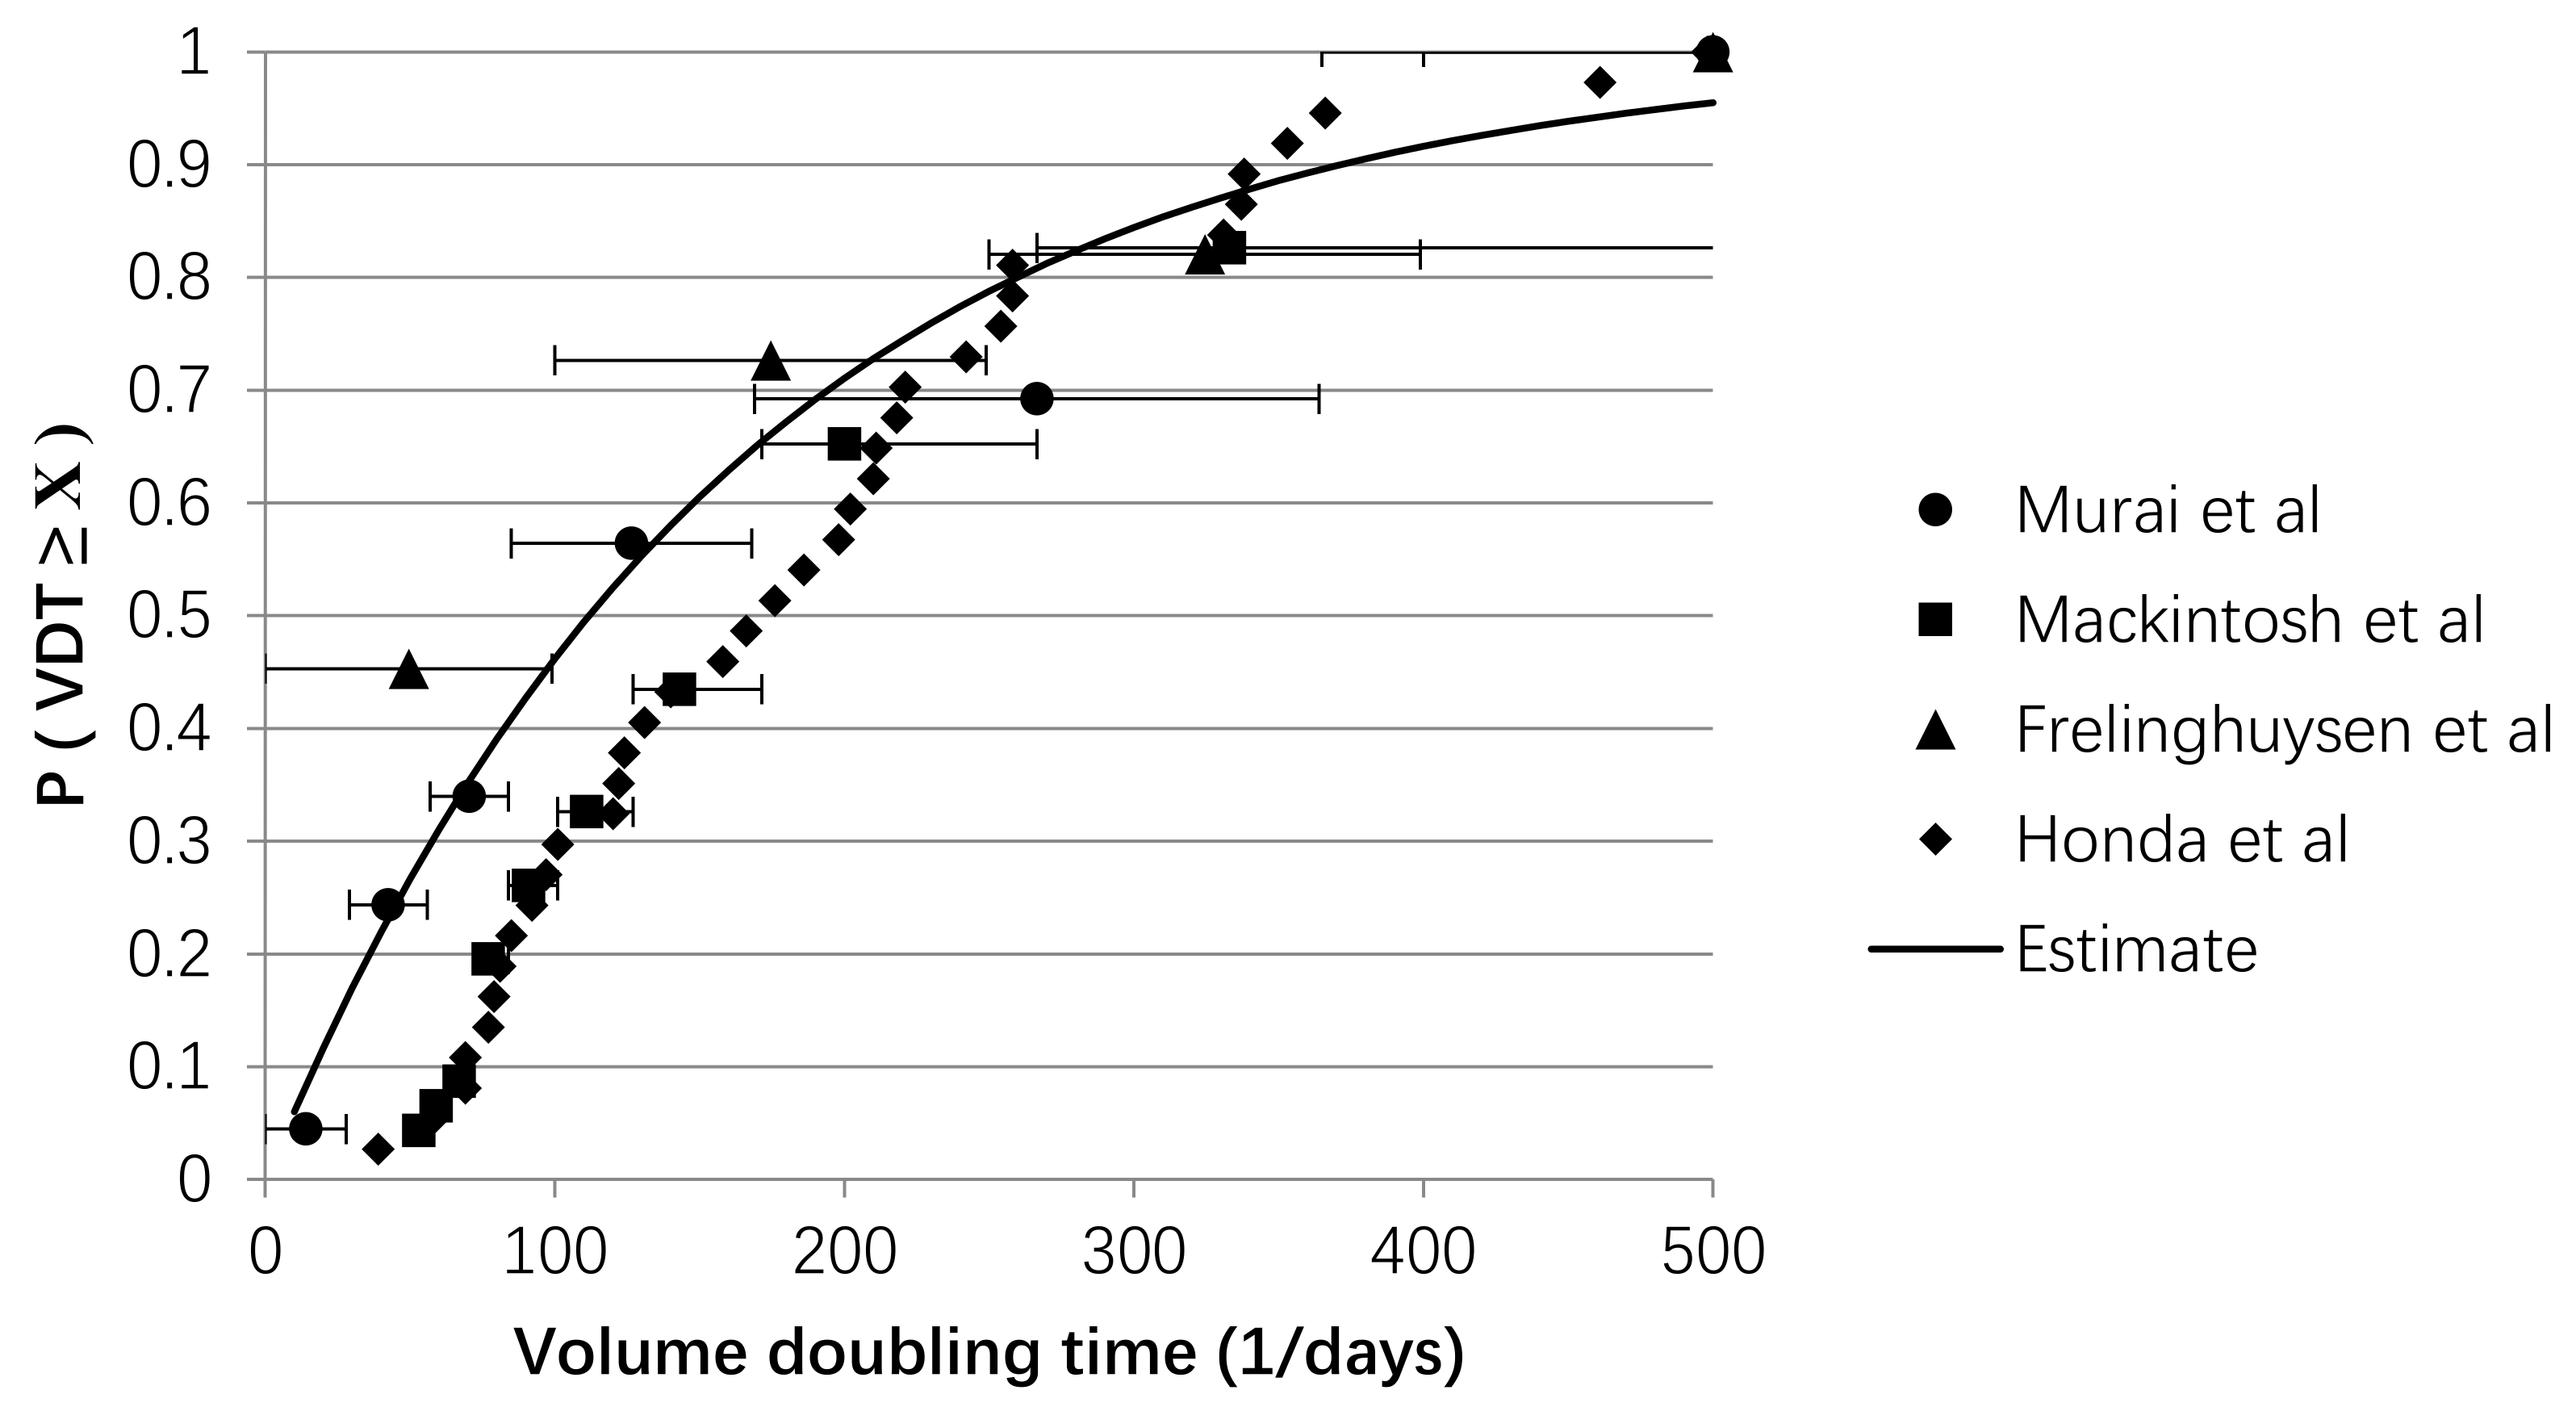
| λVDT | −0.006 | days | Parameter is fitted to data with a negative exponential distribution, representing the distribution of s between patients. (N = 415) | Literature [26,27,28,29] |
| VDTmin | 30 | days−1 | Cells require a minimum time to duplicate. Metastases with negative s cannot pass the detection threshold, and therefore cannot affect the RFS. | Definition [30] |
| VDTmax | 365 | days−1 | A metastasis with a of 365 days needs 36 years to reach the detection threshold and should rarely affect 5-year RFS. Expert opinion (HBW, RV, VMHC). | Expert opinion [30] |
| Vdet | 0.07 | cm3 | Minimum detection diameter is set to 5 mm. Metastases of this size are assumed to be spherical. | Literature [31,32] |
| R(α,β) | 9.1 | - | Describes ratio of volumes of metastases per patient drawn from a beta distribution. Calibrated to the number of oligo-metastases detected derived from pooled average of patients (N = 1399). | Calibration [7,20,21] |
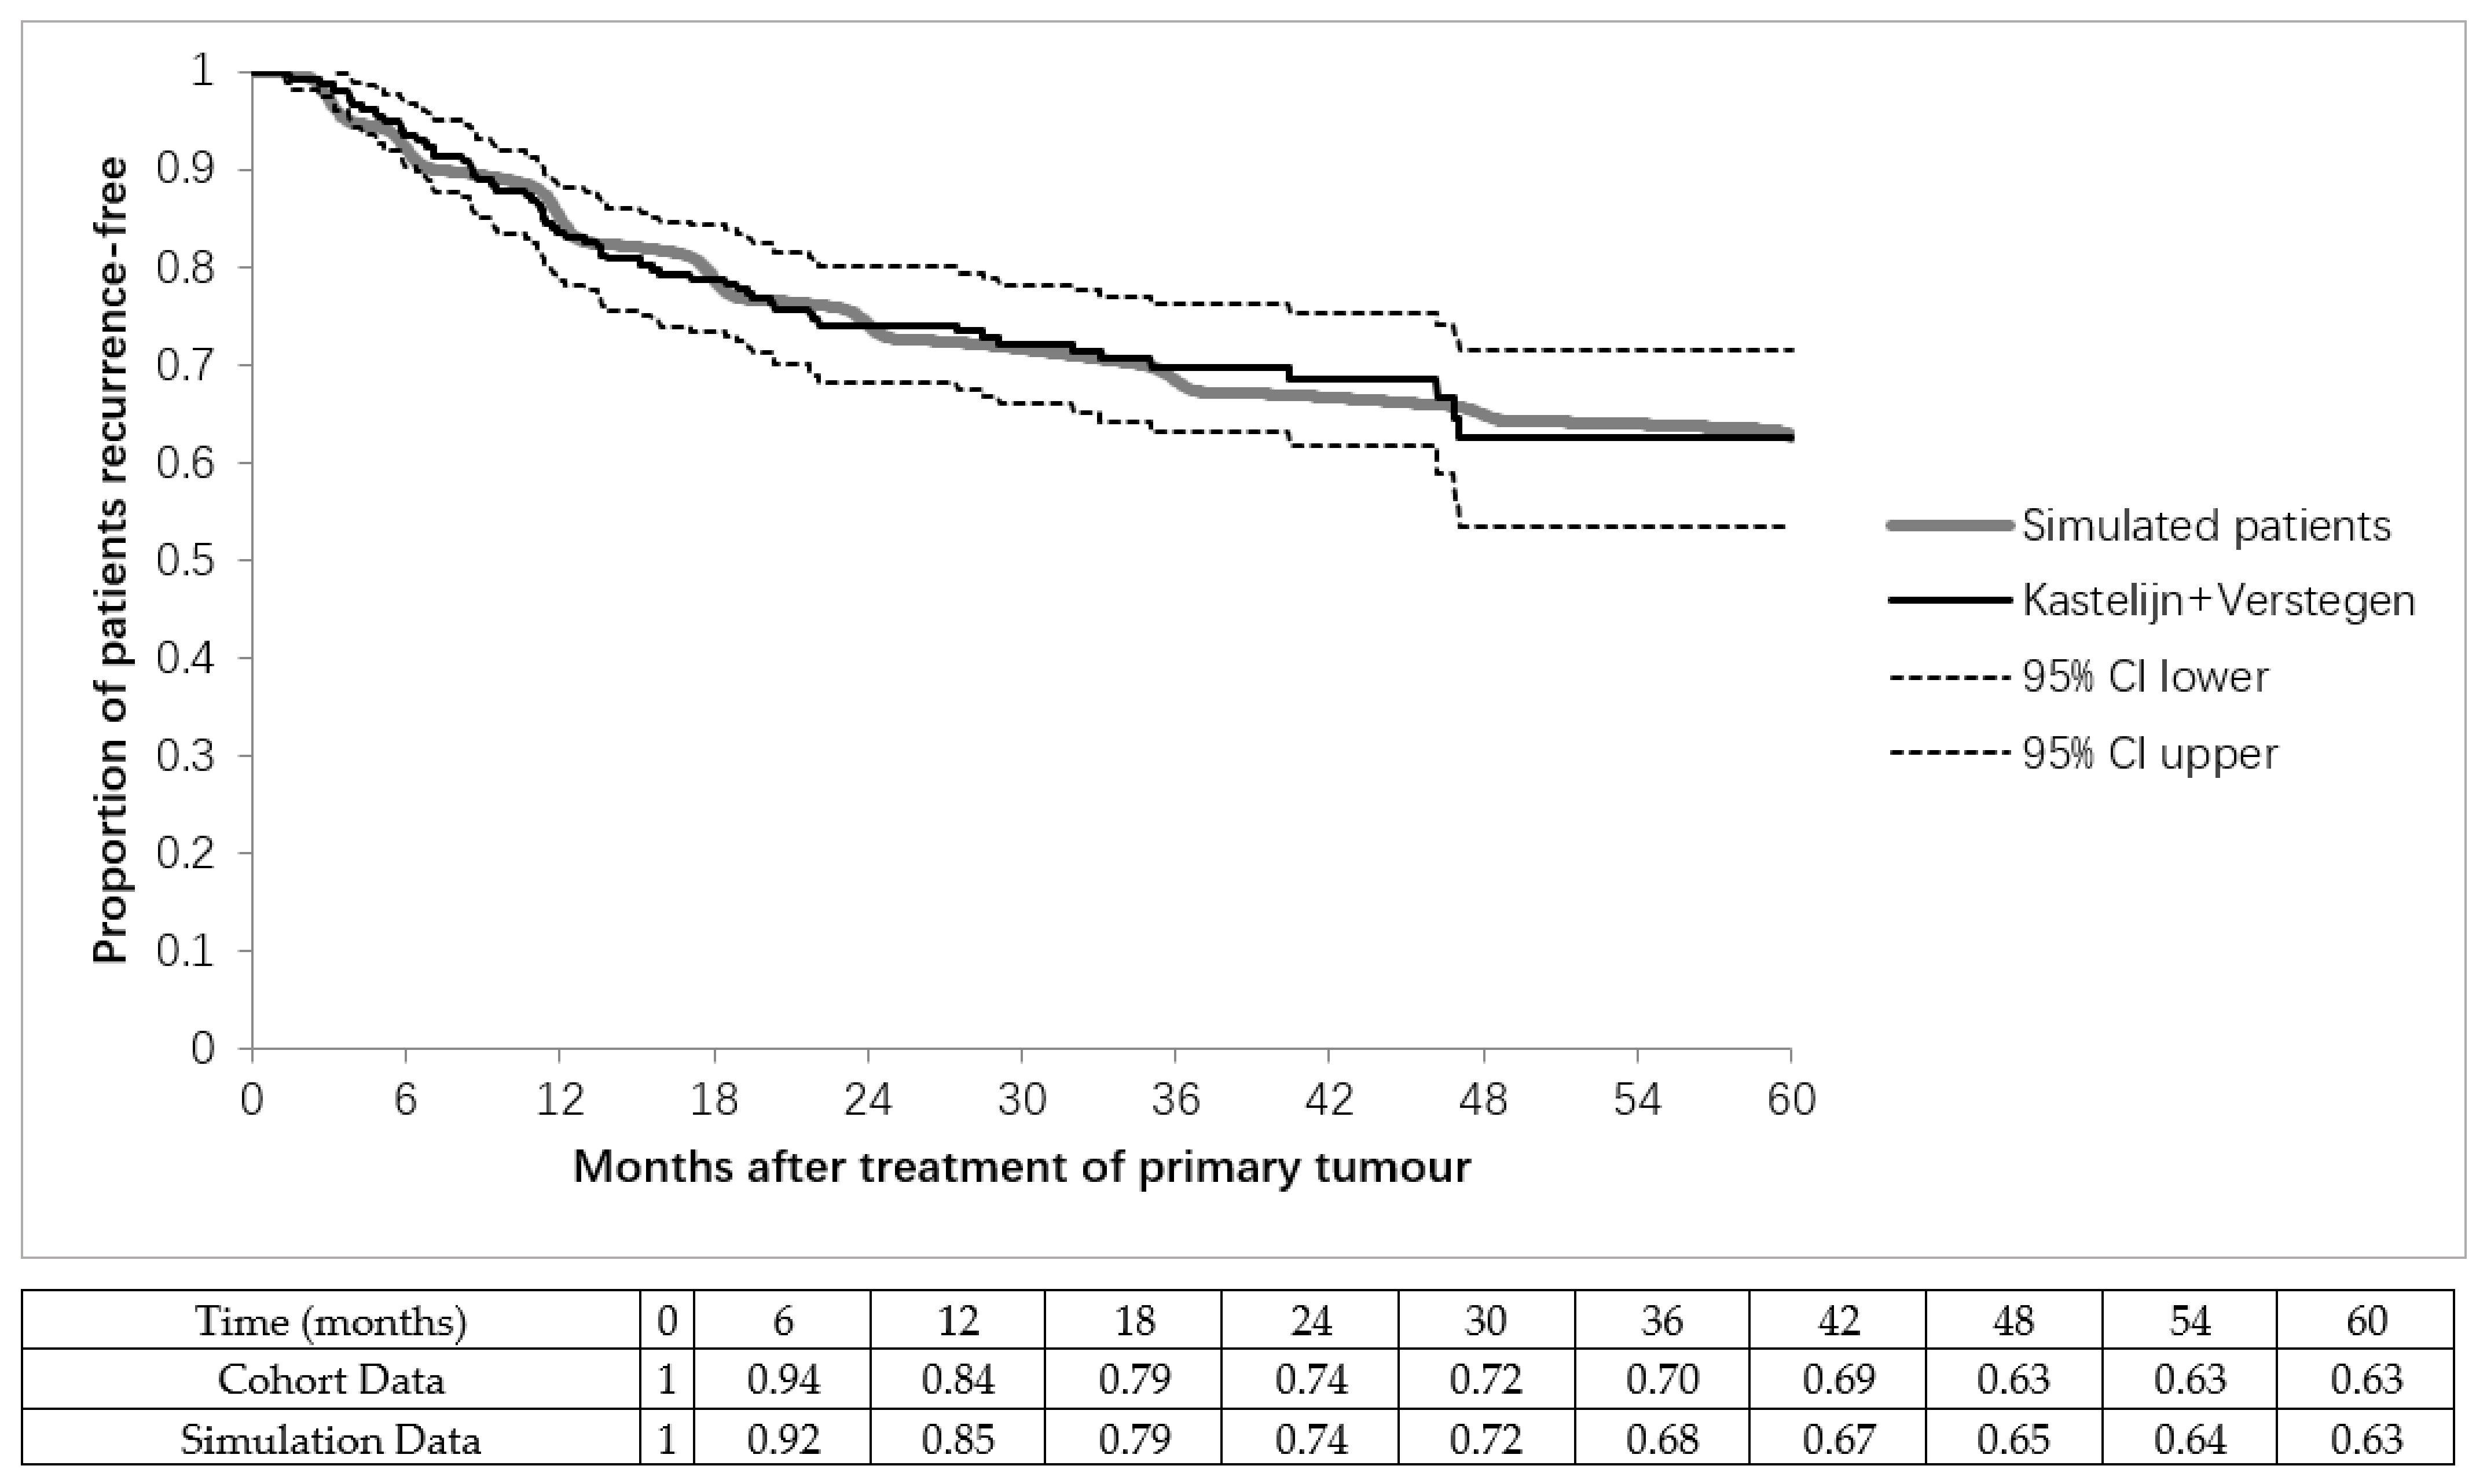
| λdetectable | 0.00161 | days−1 | Calibrated to progression-free survival of curatively treated stage I NSCLC patients (N = 841). | Calibration [24,25] |
| λsymptom | 0.00049 | - | Hazard of a single metastasis becoming symptomatic. Calibrated to symptomatic detection rate of pooled average patients with detected recurrences (N = 393). | Calibration [33,34] |
| pmm | 0.0576, 0.2606, 0.6656 | - | Chance of the metastases becoming metastatic dependent on the total tumour volume. Calibrated to calculate a 20%, 50%, and 80% hazard. Only used in sensitivity analyses. | Calibration |
| R | VDT (days−1) | Diameter of the Largest Recurrence (cm) | Metastases Detected | Total Metastases | RFI (days) | |
|---|---|---|---|---|---|---|
| All patients | 0.93 (0.67–1.00) | 103 (33–318) | 0.58 (0.50–1.13) | 6 (1–32) | 21 (2–49) | 510 (74–1772) |
| Poly metastases | 0.95 (0.75–1.00) | 88 (33–297) | 0.61 (0.51–1.21) | 10 (4–35) | 22 (5–49) | 542 (75–1777) |
| Oligo+ | 0.85 (0.59–0.98) | 146 (38–337) | 0.53 (0.50–0.66) | 2 (1–3) | 22 (5–49) | 362 (71–1579) |
| Oligo− | 0.92 (0.67–1.00) | 104 (34–319) | 0.59 (0.50–1.59) | 2 (1–3) | 2 (1–3) | 530 (77–1817) |
| High-risk group | 0.86 (0.60–0.99) | 143 (38–336) | 0.53 (0.50–0.69) | 2 (1–3) | 20 (1–49) | 363 (72–1629) |
| Low-risk group | 0.91 (0.47–1.00) | 55 (32–138) | 0.99 (0.81–2.95) | 2 (1–3) | 2 (1–25) | 1075 (192–1825) |
| Predictor | Odds Ratio |
|---|---|
| 1 Metastasis detected | reference |
| 2 Metastases detected | 1.76 |
| 3 Metastases detected | 2.44 |
| Asymptomatic detection | reference |
| Symptomatic detection | 1.63 |
| Small size (<6 mm) | reference |
| Medium size (6–8 mm) | 6.90 |
| Large size (>8 mm) | 146.79 |
| Asymptomatic | Symptomatic | |||||
|---|---|---|---|---|---|---|
| Metastases detected: | 1 | 2 | 3 | 1 | 2 | 3 |
| Small (<6 mm) | 0.91 | 0.92 | 0.93 | 0.88 | 0.88 | 0.83 |
| Medium (6–8 mm) | 0.08 | 0.61 | 0.81 | 0.08 | 0.71 | 0.84 |
| Large (>8 mm) | 0.00 | 0.02 | 0.19 | 0.00 | 0.00 | 0.24 |
| Strategy | Low Risk | High Risk | Performance of Chosen Strategy (%) | ||||||
|---|---|---|---|---|---|---|---|---|---|
| Oligo− | Oligo+ | Oligo− | Oligo+ | Sensitivity | Specificity | PPV | NPV | Accuracy | |
| Risk groups | 1252 | 111 | 3427 | 28,716 | 26.8 | 99.6 | 91.9 | 89.3 | 89.4 |
| Treat-all | 4691 | 28,815 | 0 | 0 | 100.0 | 0.0 | 14.0 | 0.0 | 14.0 |
| Treat-none | 0 | 0 | 4691 | 28,815 | 0.0 | 100.0 | 0.0 | 86.0 | 86.0 |
| Sensitivity Analysis Scenario | All Oligo-Metastases at Time of Detection | Low Risk | High Risk | |||
|---|---|---|---|---|---|---|
| N | % Oligo+ | % of All | % Oligo+ | % of All | % Oligo+ | |
| Base Case | 33,506 | 86.0 | 4.1 | 8.1 | 95.9 | 89.3 |
| Mtotal Lower | 32,194 | 91.0 | 2.7 | 11.2 | 97.3 | 93.5 |
| Mtotal Upper | 34,506 | 82.0 | 5.1 | 6.2 | 94.9 | 86.3 |
| RFS Lower | 32,600 | 85.0 | 4.5 | 7.6 | 95.5 | 88.9 |
| RFS Upper | 34,597 | 86.0 | 3.8 | 8.4 | 96.2 | 89.5 |
| R Lower | 28,239 | 83.0 | 4.6 | 1.1 | 95.4 | 87.3 |
| R Upper | 35,992 | 87.0 | 3.9 | 14.5 | 96.1 | 90.2 |
| Symptomatic Detection Lower | 32,917 | 86.0 | 4.2 | 6.3 | 95.8 | 89.2 |
| Symptomatic Detection Upper | 34,390 | 86.0 | 4.0 | 7.4 | 96.0 | 89.7 |
| Random Detection Size Scan | 33,641 | 86.0 | 3.9 | 9.1 | 96.1 | 89.2 |
| Random VDT | 33,721 | 86.0 | 4.2 | 8.9 | 95.8 | 89.0 |
| Correlation ρ = 0.5 | 27,879 | 83.0 | 7.4 | 6.8 | 92.6 | 89.7 |
| Correlation ρ = 1.0 | 23,727 | 80.0 | 13.2 | 4.6 | 86.8 | 91.8 |
| Definition of oligo-recurrence = 1 * | 12,757 | 89.0 | 5.6 | 5.7 | 94.4 | 93.8 |
| Definition of oligo-recurrence = 5 * | 47,802 | 82.0 | 2.9 | 7.9 | 97.1 | 84.5 |
| Metastatic metastases 20% * | 33,506 | 87.2 | 2.1 | 15.1 | 97.9 | 88.8 |
| Metastatic metastases 50% * | 33,506 | 89.2 | 1.4 | 21.1 | 98.6 | 90.2 |
| Metastatic metastases 80% * | 33,506 | 92.4 | 0.0 | - | 100 | 92.4 |
Publisher’s Note: MDPI stays neutral with regard to jurisdictional claims in published maps and institutional affiliations. |
© 2021 by the authors. Licensee MDPI, Basel, Switzerland. This article is an open access article distributed under the terms and conditions of the Creative Commons Attribution (CC BY) license (https://creativecommons.org/licenses/by/4.0/).
Share and Cite
Wolff, H.B.; Alberts, L.; Kastelijn, E.A.; Verstegen, N.E.; El Sharouni, S.Y.; Schramel, F.M.N.H.; Vos, R.; Coupé, V.M.H. Prediction of Microscopic Metastases in Patients with Metachronous Oligo-Metastases after Curative Treatment of Non-Small Cell Lung Cancer: A Microsimulation Study. Cancers 2021, 13, 1884. https://0-doi-org.brum.beds.ac.uk/10.3390/cancers13081884
Wolff HB, Alberts L, Kastelijn EA, Verstegen NE, El Sharouni SY, Schramel FMNH, Vos R, Coupé VMH. Prediction of Microscopic Metastases in Patients with Metachronous Oligo-Metastases after Curative Treatment of Non-Small Cell Lung Cancer: A Microsimulation Study. Cancers. 2021; 13(8):1884. https://0-doi-org.brum.beds.ac.uk/10.3390/cancers13081884
Chicago/Turabian StyleWolff, Henri B., Leonie Alberts, Elisabeth A. Kastelijn, Naomi E. Verstegen, Sherif Y. El Sharouni, Franz M. N. H. Schramel, Rein Vos, and Veerle M. H. Coupé. 2021. "Prediction of Microscopic Metastases in Patients with Metachronous Oligo-Metastases after Curative Treatment of Non-Small Cell Lung Cancer: A Microsimulation Study" Cancers 13, no. 8: 1884. https://0-doi-org.brum.beds.ac.uk/10.3390/cancers13081884