
Prediction of Tumor Cellularity in Resectable PDAC from Preoperative Computed Tomography Imaging

 , , , ,
Abstract
:Simple Summary
Abstract
1. Introduction
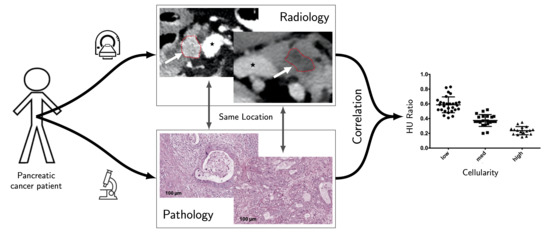
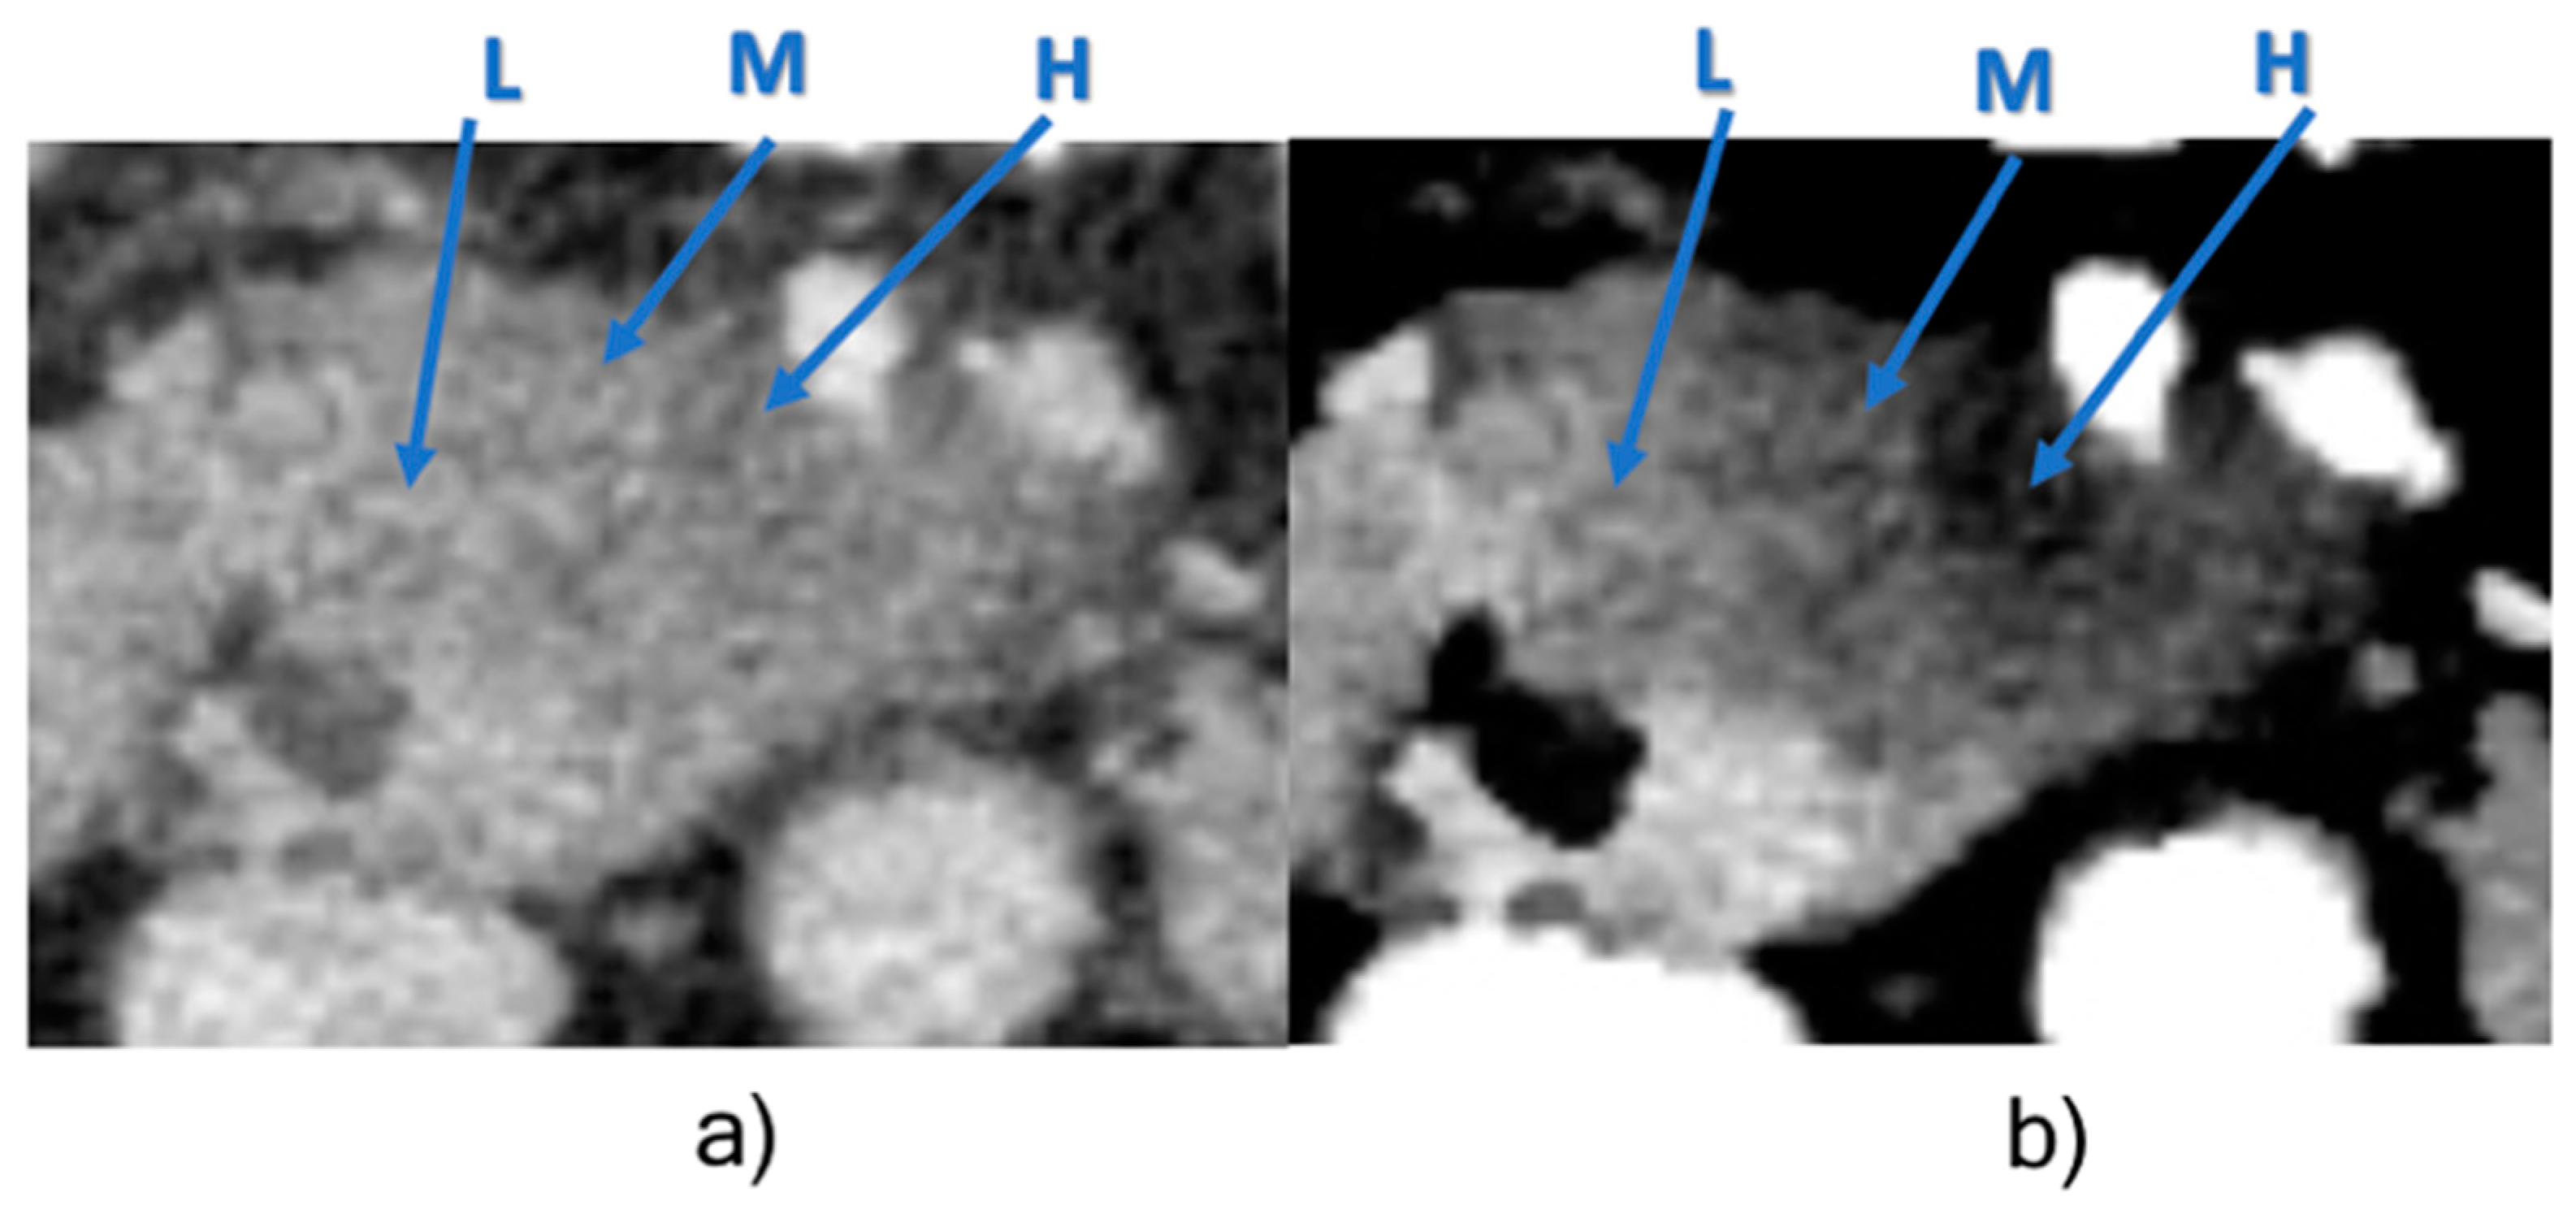
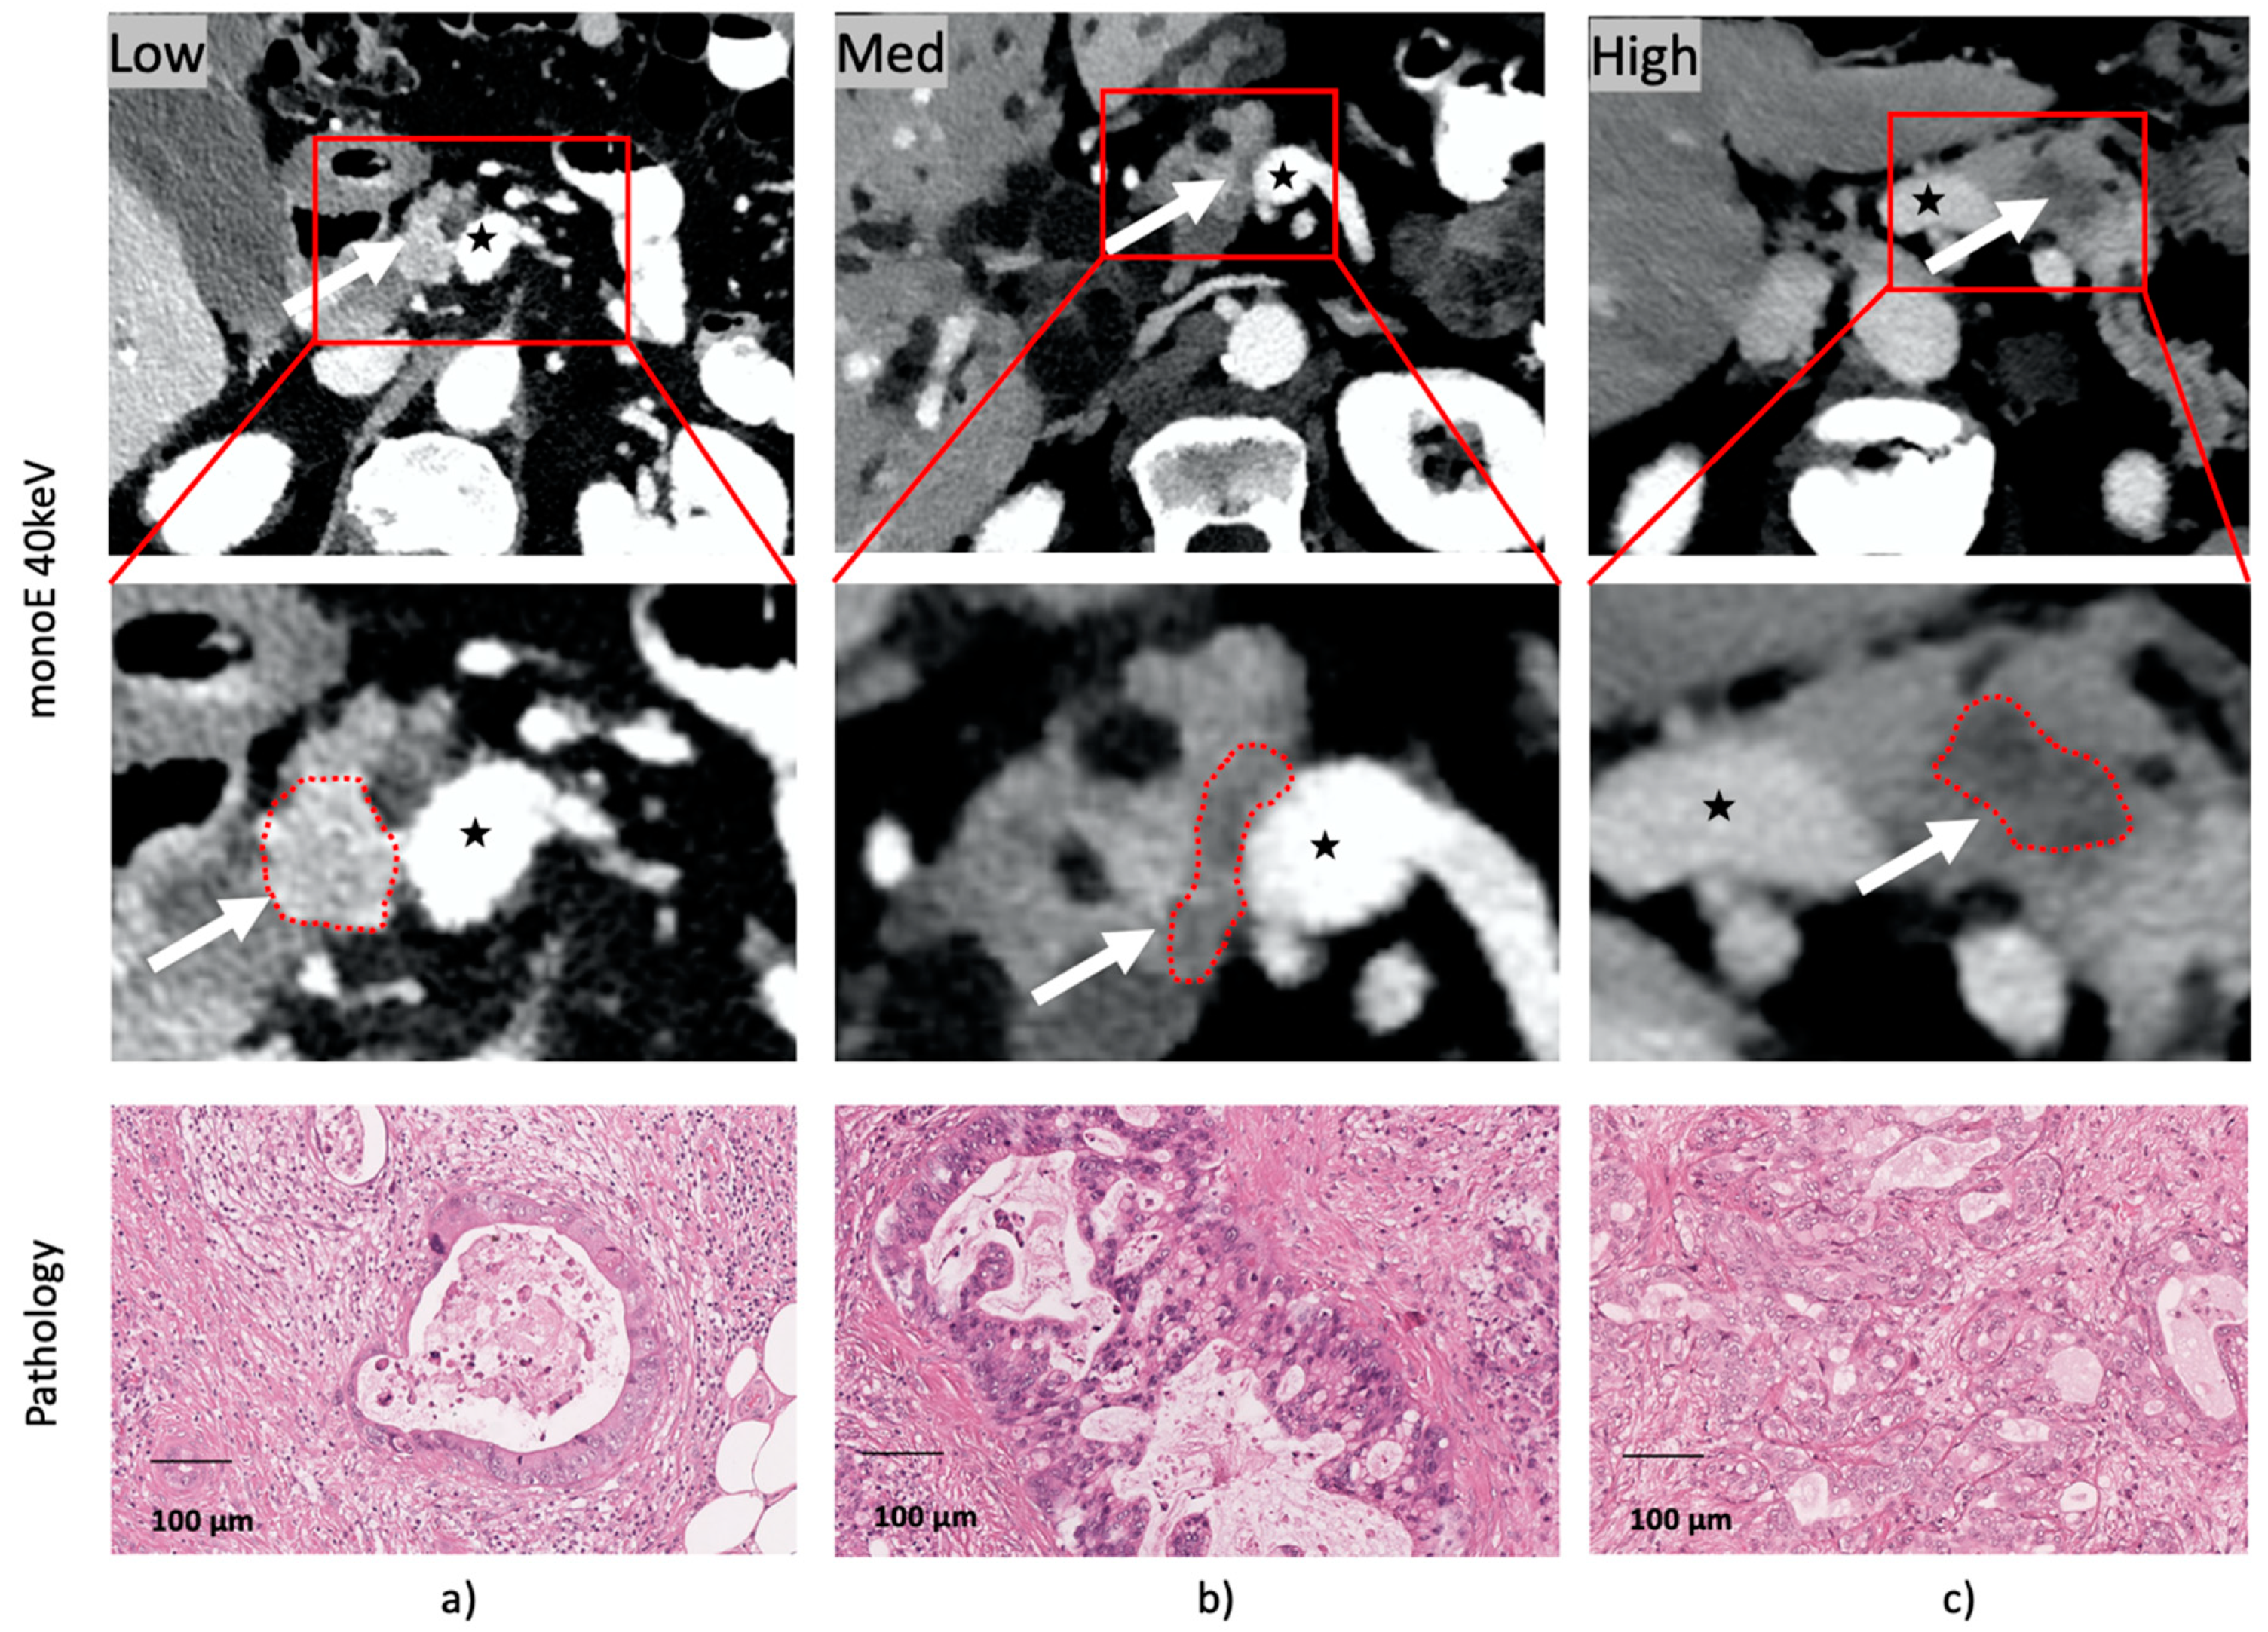
2. Results
3. Discussion
4. Material and Methods
4.1. Patients
4.2. Histopathological Data
4.3. Imaging Data
4.4. Statistics
5. Conclusions
Supplementary Materials
Author Contributions
Funding
Institutional Review Board Statement
Informed Consent Statement
Data Availability Statement
Conflicts of Interest
References
- Howlader, N.; Noone, A.M.; Krapcho, M.; Miller, D.; Bishop, K.; Kosary, C.L.; Yu, M.; Ruhl, J.; Tatalovich, Z.; Mariotto, A.; et al. (Eds.) SEER Cancer Statistics Review (CSR) 1975–2014; Based on November 2016 SEER Data Submission, Posted to the SEER Web Site; National Cancer Institute: Bethesda, MD, USA, 2017; Available online: https://seer.cancer.gov/csr/1975_2014/ (accessed on 27 October 2020).
- Adsay, N.V.; Bagci, P.; Tajiri, T.; Oliva, I.; Ohike, N.; Balci, S.; Gonzalez, R.S.; Basturk, O.; Jang, K.T.; Roa, J.C. Pathologic staging of pancreatic, ampullary, biliary, and gallbladder cancers: Pitfalls and practical limitations of the current AJCC/UICC TNM staging system and opportunities for improvement. Semin. Diagn. Pathol. 2012, 29, 127–141. [Google Scholar] [CrossRef]
- Rahib, L.; Smith, B.D.; Aizenberg, R.; Rosenzweig, A.B.; Fleshman, J.M.; Matrisian, L.M. Projecting cancer incidence and deaths to 2030: The unexpected burden of thyroid, liver, and pancreas cancers in the United States. Cancer Res. 2014, 74, 2913–2921. [Google Scholar] [CrossRef] [PubMed] [Green Version]
- Ahmad, N.A.; Lewis, J.D.; Ginsberg, G.G.; Haller, D.G.; Morris, J.B.; Williams, N.N.; Rosato, E.F.; Kochman, M.L. Long term survival after pancreatic resection for pancreatic adenocarcinoma. Am. J. Gastroenterol. 2001, 96, 2609–2615. [Google Scholar] [CrossRef] [PubMed]
- Collisson, E.A.; Sadanandam, A.; Olson, P.; Gibb, W.J.; Truitt, M.; Gu, S.; Cooc, J.; Weinkle, J.; Kim, G.E.; Jakkula, L.; et al. Subtypes of pancreatic ductal adenocarcinoma and their differing responses to therapy. Nat. Med. 2011, 17, 500–503. [Google Scholar] [CrossRef] [PubMed]
- Kaissis, G.A.; Jungmann, F.; Ziegelmayer, S.; Lohofer, F.K.; Harder, F.N.; Schlitter, A.M.; Muckenhuber, A.; Steiger, K.; Schirren, R.; Friess, H.; et al. Multiparametric Modelling of Survival in Pancreatic Ductal Adenocarcinoma Using Clinical, Histomorphological, Genetic and Image-Derived Parameters. J. Clin. Med. 2020, 9, 1250. [Google Scholar] [CrossRef] [PubMed]
- Muckenhuber, A.; Berger, A.K.; Schlitter, A.M.; Steiger, K.; Konukiewitz, B.; Trumpp, A.; Eils, R.; Werner, J.; Friess, H.; Esposito, I.; et al. Pancreatic Ductal Adenocarcinoma Subtyping Using the Biomarkers Hepatocyte Nuclear Factor-1A and Cytokeratin-81 Correlates with Outcome and Treatment Response. Clin. Cancer Res. 2018, 24, 351–359. [Google Scholar] [CrossRef] [Green Version]
- Carapuca, E.F.; Gemenetzidis, E.; Feig, C.; Bapiro, T.E.; Williams, M.D.; Wilson, A.S.; Delvecchio, F.R.; Arumugam, P.; Grose, R.P.; Lemoine, N.R.; et al. Anti-stromal treatment together with chemotherapy targets multiple signalling pathways in pancreatic adenocarcinoma. J. Pathol. 2016, 239, 286–296. [Google Scholar] [CrossRef] [Green Version]
- Cannon, A.; Thompson, C.; Hall, B.R.; Jain, M.; Kumar, S.; Batra, S.K. Desmoplasia in pancreatic ductal adenocarcinoma: Insight into pathological function and therapeutic potential. Genes Cancer 2018, 9, 78–86. [Google Scholar] [CrossRef] [PubMed] [Green Version]
- Kikuta, K.; Masamune, A.; Watanabe, T.; Ariga, H.; Itoh, H.; Hamada, S.; Satoh, K.; Egawa, S.; Unno, M.; Shimosegawa, T. Pancreatic stellate cells promote epithelial-mesenchymal transition in pancreatic cancer cells. Biochem. Biophys. Res. Commun. 2010, 403, 380–384. [Google Scholar] [CrossRef]
- Bachem, M.G.; Schunemann, M.; Ramadani, M.; Siech, M.; Beger, H.; Buck, A.; Zhou, S.; Schmid-Kotsas, A.; Adler, G. Pancreatic carcinoma cells induce fibrosis by stimulating proliferation and matrix synthesis of stellate cells. Gastroenterology 2005, 128, 907–921. [Google Scholar] [CrossRef]
- Apte, M.V.; Xu, Z.; Pothula, S.; Goldstein, D.; Pirola, R.C.; Wilson, J.S. Pancreatic cancer: The microenvironment needs attention too! Pancreatology 2015, 15, S32–S38. [Google Scholar] [CrossRef]
- Armstrong, T.; Packham, G.; Murphy, L.B.; Bateman, A.C.; Conti, J.A.; Fine, D.R.; Johnson, C.D.; Benyon, R.C.; Iredale, J.P. Type I collagen promotes the malignant phenotype of pancreatic ductal adenocarcinoma. Clin. Cancer Res. 2004, 10, 7427–7437. [Google Scholar] [CrossRef] [Green Version]
- Masamune, A.; Hamada, S.; Kikuta, K.; Takikawa, T.; Miura, S.; Nakano, E.; Shimosegawa, T. The angiotensin II type I receptor blocker olmesartan inhibits the growth of pancreatic cancer by targeting stellate cell activities in mice. Scand. J. Gastroenterol. 2013, 48, 602–609. [Google Scholar] [CrossRef]
- Cho, I.K.; Kim, H.; Lee, J.C.; Lee, J.; Kim, J.; Ahn, S.; Park, H.; Hwang, J.H. Higher Tumor Cellularity in Resected Pancreatic Ductal Adenocarcinoma Is a Negative Prognostic Indicator. Gut Liver 2020, 14, 521–528. [Google Scholar] [CrossRef]
- Rhim, A.D.; Oberstein, P.E.; Thomas, D.H.; Mirek, E.T.; Palermo, C.F.; Sastra, S.A.; Dekleva, E.N.; Saunders, T.; Becerra, C.P.; Tattersall, I.W.; et al. Stromal elements act to restrain, rather than support, pancreatic ductal adenocarcinoma. Cancer Cell 2014, 25, 735–747. [Google Scholar] [CrossRef] [Green Version]
- Heid, I.; Steiger, K.; Trajkovic-Arsic, M.; Settles, M.; Esswein, M.R.; Erkan, M.; Kleeff, J.; Jager, C.; Friess, H.; Haller, B.; et al. Co-clinical Assessment of Tumor Cellularity in Pancreatic Cancer. Clin. Cancer Res. 2017, 23, 1461–1470. [Google Scholar] [CrossRef] [PubMed] [Green Version]
- Kaissis, G.A.; Ziegelmayer, S.; Lohofer, F.K.; Harder, F.N.; Jungmann, F.; Sasse, D.; Muckenhuber, A.; Yen, H.Y.; Steiger, K.; Siveke, J.; et al. Image-Based Molecular Phenotyping of Pancreatic Ductal Adenocarcinoma. J. Clin. Med. 2020, 9, 724. [Google Scholar] [CrossRef] [PubMed] [Green Version]
- Mei, D.; Luo, Y.; Wang, Y.; Gong, J. CT texture analysis of lung adenocarcinoma: Can Radiomic features be surrogate biomarkers for EGFR mutation statuses. Cancer Imaging 2018, 18, 52. [Google Scholar] [CrossRef] [Green Version]
- Lou, B.; Doken, S.; Zhuang, T.; Wingerter, D.; Gidwani, M.; Mistry, N.; Ladic, L.; Kamen, A.; Abazeed, M.E. An image-based deep learning framework for individualising radiotherapy dose: A retrospective analysis of outcome prediction. Lancet Digit. Health 2019, 1, e136–e147. [Google Scholar] [CrossRef] [Green Version]
- Muhammad, H.; Häggström, I.; Klimstra, D.S.; Fuchs, T.J. Survival modeling of pancreatic cancer with radiology using convolutional neural networks. In Simulation, Image Processing, and Ultrasound Systems for Assisted Diagnosis and Navigation; Springer: Berlin/Heidelberg, Germany, 2018; pp. 187–192. [Google Scholar] [CrossRef]
- Huang, Y.; Liu, Z.; He, L.; Chen, X.; Pan, D.; Ma, Z.; Liang, C.; Tian, J.; Liang, C. Radiomics Signature: A Potential Biomarker for the Prediction of Disease-Free Survival in Early-Stage (I or II) Non—Small Cell Lung Cancer. Radiology 2016, 281, 947–957. [Google Scholar] [CrossRef]
- Lohofer, F.K.; Kaissis, G.A.; Koster, F.L.; Ziegelmayer, S.; Einspieler, I.; Gerngross, C.; Rasper, M.; Noel, P.B.; Koerdt, S.; Fichter, A.; et al. Improved detection rates and treatment planning of head and neck cancer using dual-layer spectral CT. Eur. Radiol. 2018, 28, 4925–4931. [Google Scholar] [CrossRef]
- Dai, H.; van’t Veer, L.; Lamb, J.; He, Y.D.; Mao, M.; Fine, B.M.; Bernards, R.; van de Vijver, M.; Deutsch, P.; Sachs, A.; et al. A cell proliferation signature is a marker of extremely poor outcome in a subpopulation of breast cancer patients. Cancer Res. 2005, 65, 4059–4066. [Google Scholar] [CrossRef] [PubMed] [Green Version]
- Rosenwald, A.; Wright, G.; Wiestner, A.; Chan, W.C.; Connors, J.M.; Campo, E.; Gascoyne, R.D.; Grogan, T.M.; Muller-Hermelink, H.K.; Smeland, E.B.; et al. The proliferation gene expression signature is a quantitative integrator of oncogenic events that predicts survival in mantle cell lymphoma. Cancer Cell 2003, 3, 185–197. [Google Scholar] [CrossRef] [Green Version]
- Jacobetz, M.A.; Chan, D.S.; Neesse, A.; Bapiro, T.E.; Cook, N.; Frese, K.K.; Feig, C.; Nakagawa, T.; Caldwell, M.E.; Zecchini, H.I.; et al. Hyaluronan impairs vascular function and drug delivery in a mouse model of pancreatic cancer. Gut 2013, 62, 112–120. [Google Scholar] [CrossRef] [PubMed]
- Lee, J.J.; Perera, R.M.; Wang, H.; Wu, D.C.; Liu, X.S.; Han, S.; Fitamant, J.; Jones, P.D.; Ghanta, K.S.; Kawano, S.; et al. Stromal response to Hedgehog signaling restrains pancreatic cancer progression. Proc. Natl. Acad. Sci. USA 2014, 111, E3091–E3100. [Google Scholar] [CrossRef] [Green Version]
- Jiang, B.; Zhou, L.; Lu, J.; Wang, Y.; Liu, C.; You, L.; Guo, J. Stroma-Targeting Therapy in Pancreatic Cancer: One Coin With Two Sides? Front. Oncol. 2020, 10, 2272. [Google Scholar] [CrossRef] [PubMed]
- Heid, I.; Trajkovic-Arsic, M.; Esposito, I.; Gretzinger, M.; Schwaiger, M.; Rummeny, E.; Siveke, J.; Braren, R. Multimodale Diagnostik der Pankreastumorheterogenität im endogenen Mausmodell. In RöFo-Fortschritte auf dem Gebiet der Röntgenstrahlen und der Bildgebenden Verfahren; Georg Thieme Verlag KG Stuttgart New York: Stuttgart, Germany, 2013; p. VO105_I_108. [Google Scholar]
- Heid, I.; Trajkovic-Arsic, M.; Esposito, I.; Gretzinger, M.R.; Steingoetter, A.; Haller, B.; Schwaiger, M.; Rummeny, E.J.; Siveke, J.T.; Braren, R.F. Abstract A5: Imaging Heterogeneity of Endogenous Mouse Models of Pancreatic Cancer; AACR: Philadelphia, PA, USA, 2012. [Google Scholar]
- Le Bihan, D. What can we see with IVIM MRI? Neuroimage 2019, 187, 56–67. [Google Scholar] [CrossRef] [PubMed]
- Koay, E.J.; Truty, M.J.; Cristini, V.; Thomas, R.M.; Chen, R.; Chatterjee, D.; Kang, Y.; Bhosale, P.R.; Tamm, E.P.; Crane, C.H.; et al. Transport properties of pancreatic cancer describe gemcitabine delivery and response. J. Clin. Investig. 2014, 124, 1525–1536. [Google Scholar] [CrossRef] [Green Version]
- Jiang, H.; Torphy, R.J.; Steiger, K.; Hongo, H.; Ritchie, A.J.; Kriegsmann, M.; Horst, D.; Umetsu, S.E.; Joseph, N.M.; McGregor, K.; et al. Pancreatic ductal adenocarcinoma progression is restrained by stromal matrix. J. Clin. Investig. 2020, 130, 4704–4709. [Google Scholar] [CrossRef]
- Rooch, A. Statistik Für Ingenieure; Springer: Berlin/Heidelberg, Germany, 2014; p. 229. [Google Scholar] [CrossRef]


| Variable | Classes | N (%) |
|---|---|---|
| Sex | Male | 21 (48.8) |
| Female | 22 (51.2) | |
| Tumor size | pT1/2 | 21 (48.8) |
| pT3/4 | 22 (51.2) | |
| Lymph node status | pN0 | 8 (18.6) |
| pN+ | 35 (81.4) | |
| Metastasis | pM0 | 39 (90.7) |
| pM1 | 4 (9.3) | |
| Grading | Low grade (G1/2) | 23 (53.5) |
| High grade (G3) | 16 (37.2) | |
| missing | 4 (9.3) | |
| Resection status | R0 | 27 (62.8) |
| R+ | 16 (37.2) | |
| Highest tumor cellularity level | High | 17 (39.5) |
| Intermediate | 11 (25.6) | |
| Low | 15 (34.9) | |
| Chemotherapy intention | Neoadjuvant | 8 (18.6) |
| Adjuvant | 35 (81.4) | |
| First line chemotherapy | FOLFIRINOX | 9 (20.9) |
| Gemcitabine | 21 (48.8) | |
| None or missing | 13 (30.3) | |
| Censored | Yes | 26 (60.5) |
| No | 17 (39.5) | |
| Overall survival | Mean (months) | 18.1 |
| Variance (years) | 13.1 | |
| Age | Mean (years) | 70.0 |
| Variance (years) | 9.8 |
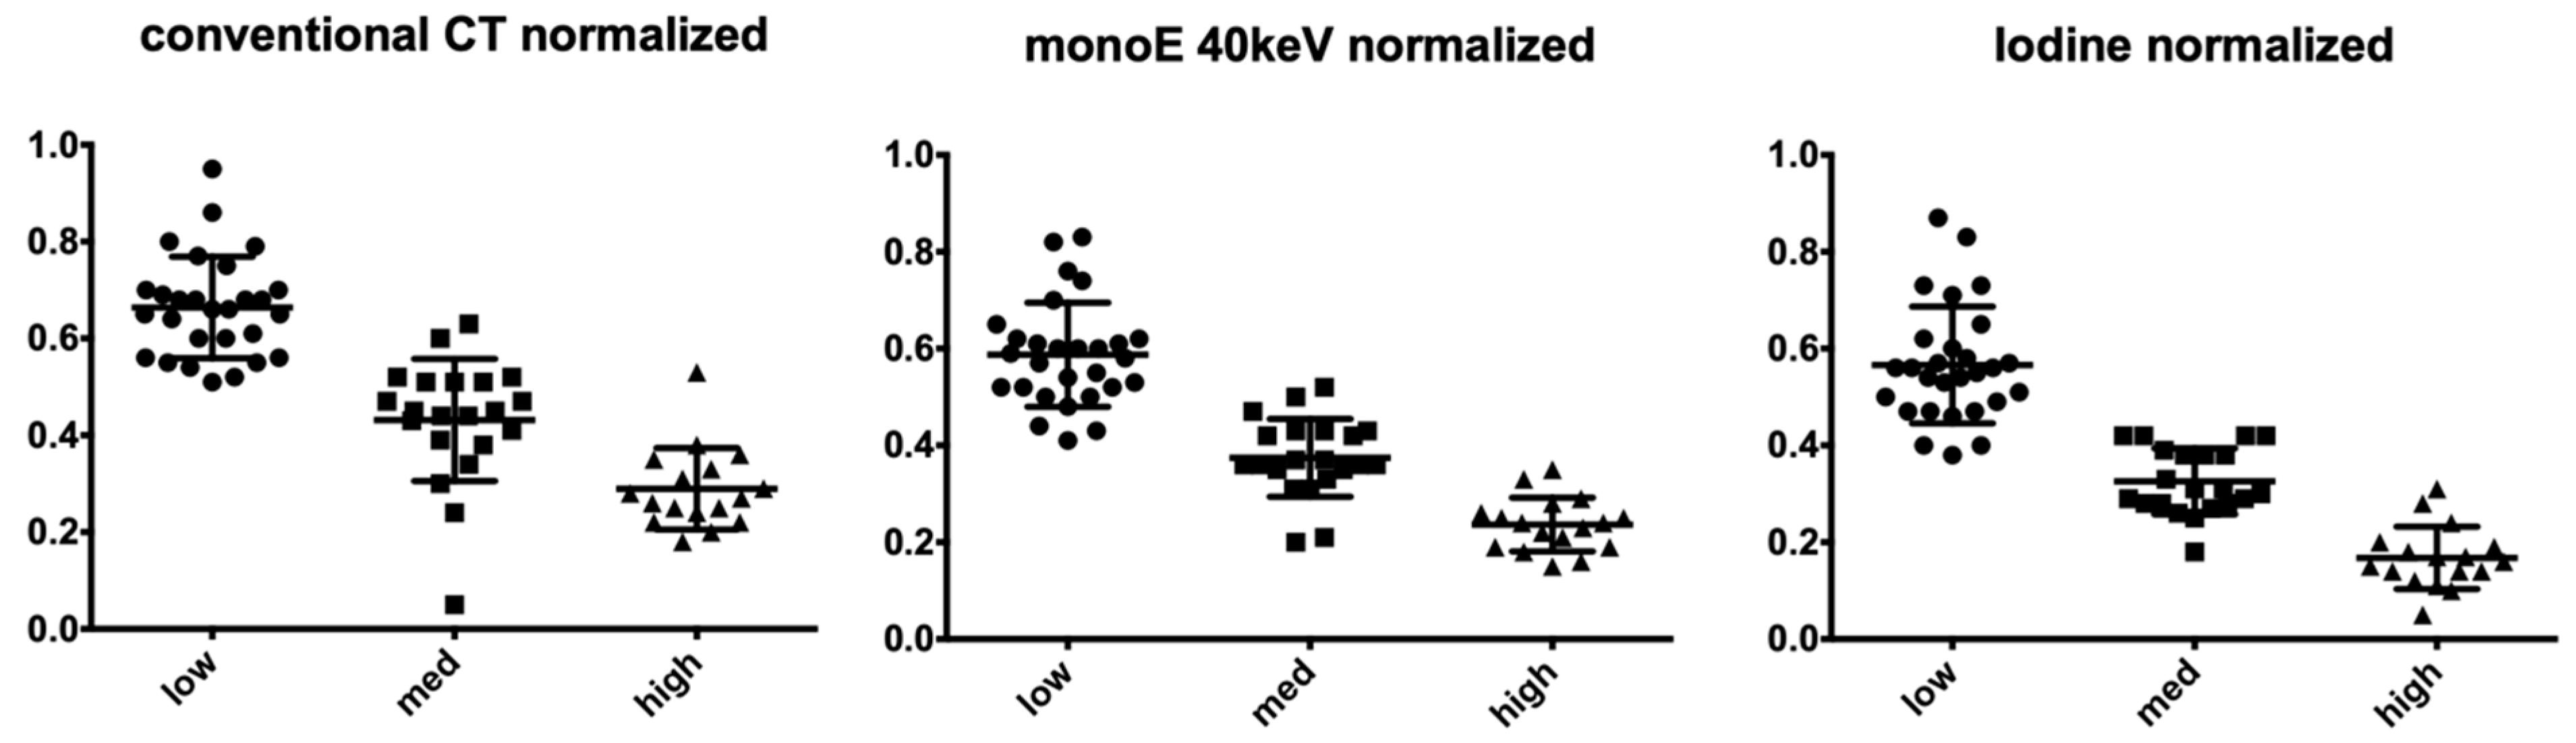
| Cellularity | Conventional CT Mean Normalized HU (95%-CI) | monoE 40keV CT Mean Normalized HU (95%-CI) | Iodine Map Mean Normalized Iodine Concentration (95%-CI) |
|---|---|---|---|
| Low cellularity | 0. 66(0.62–0.70) | 0.59 (0.55–0.63) | 0.57 (0.52–0.61) |
| Intermediate cellularity | 0.43 (0.37–0.49) | 0.37 (0.34–0.41) | 0.33 (0.29–0.36) |
| High cellularity | 0.29 (0.24–0.33) | 0.24 (0.21–0.27) | 0.17 (0.13–0.20) |
| Reconstruction | F-Value | p-Value |
|---|---|---|
| Conventional CT | 73.01 | <0.01 |
| MonoE 40 keV CT | 76.21 | <0.01 |
| Iodine maps | 88.86 | <0.01 |
| Reconstruction | Cellularity Level | T Statistic | p-Value |
|---|---|---|---|
| Conventional CT | Low vs. intermediate | 6.84 | <0.001 |
| Low vs. high | 13.46 | <0.001 | |
| Intermediate vs. high | 4.40 | <0.001 | |
| MonoE 40 keV CT | Low vs. intermediate | 7.03 | <0.001 |
| Low vs. high | 11.76 | <0.001 | |
| Intermediate vs. high | 5.35 | <0.001 | |
| Iodine maps | Low vs. intermediate | 7.66 | <0.001 |
| Low vs. high | 12.3 | <0.001 | |
| Intermediate vs. high | 5.98 | <0.001 |
Publisher’s Note: MDPI stays neutral with regard to jurisdictional claims in published maps and institutional affiliations. |
© 2021 by the authors. Licensee MDPI, Basel, Switzerland. This article is an open access article distributed under the terms and conditions of the Creative Commons Attribution (CC BY) license (https://creativecommons.org/licenses/by/4.0/).
Share and Cite
Jungmann, F.; Kaissis, G.A.; Ziegelmayer, S.; Harder, F.; Schilling, C.; Yen, H.-Y.; Steiger, K.; Weichert, W.; Schirren, R.; Demir, I.E.; et al. Prediction of Tumor Cellularity in Resectable PDAC from Preoperative Computed Tomography Imaging. Cancers 2021, 13, 2069. https://0-doi-org.brum.beds.ac.uk/10.3390/cancers13092069
Jungmann F, Kaissis GA, Ziegelmayer S, Harder F, Schilling C, Yen H-Y, Steiger K, Weichert W, Schirren R, Demir IE, et al. Prediction of Tumor Cellularity in Resectable PDAC from Preoperative Computed Tomography Imaging. Cancers. 2021; 13(9):2069. https://0-doi-org.brum.beds.ac.uk/10.3390/cancers13092069
Chicago/Turabian StyleJungmann, Friederike, Georgios A. Kaissis, Sebastian Ziegelmayer, Felix Harder, Clara Schilling, Hsi-Yu Yen, Katja Steiger, Wilko Weichert, Rebekka Schirren, Ishan Ekin Demir, and et al. 2021. "Prediction of Tumor Cellularity in Resectable PDAC from Preoperative Computed Tomography Imaging" Cancers 13, no. 9: 2069. https://0-doi-org.brum.beds.ac.uk/10.3390/cancers13092069