
Identifying Cancer Drivers Using DRIVE: A Feature-Based Machine Learning Model for a Pan-Cancer Assessment of Somatic Missense Mutations

 ,
,
Abstract
:Simple Summary
Abstract
1. Introduction
2. Methods
2.1. Data Acquisition and Pre-Processing
2.2. Feature Extraction
2.2.1. Gene-Level Features
2.2.2. Mutation-Level Features
2.3. Labels Compilation Using Statistical Modelling
2.4. Feature-Based Learning and Performance Evaluation
2.4.1. Addressing the Class Imbalance Problem
2.4.2. Pre-Processing
2.4.3. Resampling Method
2.4.4. Training
2.4.5. Hyperparameters Optimisation
2.4.6. Performance Evaluation Measures
2.4.7. Feature Importance
2.5. Testing on an Independent Dataset
2.6. Performance Evaluation on the Benchmark Dataset
3. Results
3.1. Performance Evaluation of the Machine Learning Models
3.2. Feature Importance of Random Forest
3.3. Prediction on an Independent Dataset
3.4. Performance Evaluation on the Benchmark Dataset
4. Discussion
5. Conclusions
Supplementary Materials
Author Contributions
Funding
Institutional Review Board Statement
Informed Consent Statement
Data Availability Statement
Acknowledgments
Conflicts of Interest
References
- Pomerantz, M.M.; Freedman, M.L. The Genetics of Cancer Risk. Cancer J. 2011, 17, 416–422. [Google Scholar] [CrossRef] [Green Version]
- Vogelstein, B.; Papadopoulos, N.; Velculescu, V.E.; Zhou, S.; Diaz, L.A.; Kinzler, K.W. Cancer Genome Landscapes. Science 2013, 339, 1546–1558. [Google Scholar] [CrossRef]
- Martincorena, I.; Raine, K.M.; Gerstung, M.; Dawson, K.J.; Haase, K.; Van Loo, P.; Davies, H.; Stratton, M.R.; Campbell, P.J. Universal Patterns of Selection in Cancer and Somatic Tissues. Cell 2017, 171, 1029–1041.e21. [Google Scholar] [CrossRef] [PubMed]
- Chu, D.; Wei, L. Nonsynonymous, synonymous and nonsense mutations in human cancer-related genes undergo stronger purifying selections than expectation. BMC Cancer 2019, 19, 359. [Google Scholar] [CrossRef]
- Tomczak, K.; Czerwińska, P.; Wiznerowicz, M. The Cancer Genome Atlas (TCGA): An immeasurable source of knowledge. Contemp. Oncol. (Pozn) 2015, 19, A68–A77. [Google Scholar] [CrossRef]
- Zhang, J.; Baran, J.; Cros, A.; Guberman, J.M.; Haider, S.; Hsu, J.; Liang, Y.; Rivkin, E.; Wang, J.; Whitty, B.; et al. International Cancer Genome Consortium Data Portal—A one-stop shop for cancer genomics data. Database (Oxford) 2011, 2011, bar026. [Google Scholar] [CrossRef] [Green Version]
- Salvadores, M.; Mas-Ponte, D.; Supek, F. Passenger mutations accurately classify human tumors. PLoS Comput. Biol. 2019, 15, e1006953. [Google Scholar] [CrossRef] [Green Version]
- Stratton, M.R.; Campbell, P.J.; Futreal, P.A. The cancer genome. Nature 2009, 458, 719–724. [Google Scholar] [CrossRef] [PubMed] [Green Version]
- Zapata, L.; Pich, O.; Serrano, L.; Kondrashov, F.A.; Ossowski, S.; Schaefer, M.H. Negative selection in tumor genome evolution acts on essential cellular functions and the immunopeptidome. Genome Biol. 2018, 19, 67. [Google Scholar] [CrossRef]
- Engin, H.B.; Kreisberg, J.F.; Carter, H. Structure-Based Analysis Reveals Cancer Missense Mutations Target Protein Interaction Interfaces. PLoS ONE 2016, 11, e0152929. [Google Scholar] [CrossRef] [PubMed]
- Dees, N.D.; Zhang, Q.; Kandoth, C.; Wendl, M.C.; Schierding, W.; Koboldt, D.C.; Mooney, T.B.; Callaway, M.B.; Dooling, D.; Mardis, E.R.; et al. MuSiC: Identifying mutational significance in cancer genomes. Genome Res. 2012, 22, 1589–1598. [Google Scholar] [CrossRef] [PubMed] [Green Version]
- Ding, L.; Wendl, M.C.; Koboldt, D.C.; Mardis, E.R. Analysis of next-generation genomic data in cancer: Accomplishments and challenges. Hum. Mol. Genet. 2010, 19, R188–R196. [Google Scholar] [CrossRef] [PubMed] [Green Version]
- Tokheim, C.; Karchin, R. CHASMplus Reveals the Scope of Somatic Missense Mutations Driving Human Cancers. Cell Syst. 2019, 9, 9–23.e8. [Google Scholar] [CrossRef] [Green Version]
- AACR Project GENIE: Powering Precision Medicine through an International Consortium. Cancer Discov. 2017, 7, 818–831. [CrossRef] [Green Version]
- Chandran, U.R.; Medvedeva, O.P.; Barmada, M.M.; Blood, P.D.; Chakka, A.; Luthra, S.; Ferreira, A.; Wong, K.F.; Lee, A.V.; Zhang, Z.; et al. TCGA Expedition: A Data Acquisition and Management System for TCGA Data. PLoS ONE 2016, 11, e0165395. [Google Scholar] [CrossRef] [PubMed]
- AACR. GENIE Data Guide; AACR, 2020; Available online: https://www.aacr.org/wp-content/uploads/2020/02/20200127_GENIE_Data_Guide_7.pdf (accessed on 24 April 2021).
- Meyer, M.J.; Beltrán, J.F.; Liang, S.; Fragoza, R.; Rumack, A.; Liang, J.; Wei, X.; Yu, H. Interactome INSIDER: A structural interactome browser for genomic studies. Nat. Methods 2018, 15, 107–114. [Google Scholar] [CrossRef]
- Liberzon, A.; Birger, C.; Thorvaldsdóttir, H.; Ghandi, M.; Mesirov, J.P.; Tamayo, P. The Molecular Signatures Database (MSigDB) hallmark gene set collection. Cell Syst. 2015, 1, 417–425. [Google Scholar] [CrossRef] [PubMed] [Green Version]
- Dolgalev, I. Msigdbr: MSigDB Gene Sets for Multiple Organisms in a Tidy Data Format. 2020. Available online: https://igordot.github.io/msigdbr/ (accessed on 24 April 2021).
- Benjamini, Y.; Hochberg, Y. Controlling The False Discovery Rate—A Practical And Powerful Approach To Multiple Testing. J. R. Statist. Soc. Ser. B 1995, 57, 289–300. [Google Scholar] [CrossRef]
- Reimand, J.; Isser, R.; Voisin, V.; Kucera, M.; Tannus-Lopes, C.; Rostamianfar, A.; Wadi, L.; Meyer, M.; Wong, J.; Xu, C.; et al. Pathway enrichment analysis and visualization of omics data using g:Profiler, GSEA, Cytoscape and EnrichmentMap. Nat. Protoc. 2019, 14, 482–517. [Google Scholar] [CrossRef] [PubMed]
- Leiserson, M.D.M.; Blokh, D.; Sharan, R.; Raphael, B.J. Simultaneous Identification of Multiple Driver Pathways in Cancer. PLoS Comput. Biol. 2013, 9, e1003054. [Google Scholar] [CrossRef]
- Hornbeck, P.V.; Zhang, B.; Murray, B.; Kornhauser, J.M.; Latham, V.; Skrzypek, E. PhosphoSitePlus, 2014: Mutations, PTMs and recalibrations. Nucleic Acids Res. 2015, 43, D512–D520. [Google Scholar] [CrossRef] [Green Version]
- Chen, L.; Miao, Y.; Liu, M.; Zeng, Y.; Gao, Z.; Peng, D.; Hu, B.; Li, X.; Zheng, Y.; Xue, Y.; et al. Pan-Cancer Analysis Reveals the Functional Importance of Protein Lysine Modification in Cancer Development. Front. Genet. 2018, 9, 254. [Google Scholar] [CrossRef] [PubMed]
- Tokheim, C.J.; Papadopoulos, N.; Kinzler, K.W.; Vogelstein, B.; Karchin, R. Evaluating the evaluation of cancer driver genes. Proc. Natl. Acad. Sci. USA 2016, 113, 14330–14335. [Google Scholar] [CrossRef] [PubMed] [Green Version]
- McLaren, W.; Gil, L.; Hunt, S.E.; Riat, H.S.; Ritchie, G.R.S.; Thormann, A.; Flicek, P.; Cunningham, F. The Ensembl Variant Effect Predictor. Genome Biol. 2016, 17, 122. [Google Scholar] [CrossRef] [Green Version]
- Sim, N.L.; Kumar, P.; Hu, J.; Henikoff, S.; Schneider, G.; Ng, P.C. SIFT web server: Predicting effects of amino acid substitutions on proteins. Nucleic. Acids Res. 2012, 40, W452–W457. [Google Scholar] [CrossRef]
- Adzhubei, I.; Jordan, D.M.; Sunyaev, S.R. Predicting Functional Effect of Human Missense Mutations Using PolyPhen-2. Curr. Protoc. Hum. Genet. 2013, 76, 7–20. [Google Scholar] [CrossRef] [Green Version]
- González-Pérez, A.; López-Bigas, N. Improving the Assessment of the Outcome of Nonsynonymous SNVs with a Consensus Deleteriousness Score, Condel. Am. J. Hum. Genet. 2011, 88, 440–449. [Google Scholar] [CrossRef] [Green Version]
- Liu, X.; Jian, X.; Boerwinkle, E. dbNSFP: A Lightweight Database of Human Nonsynonymous SNPs and Their Functional Predictions. Hum. Mutat. 2011, 32, 894–899. [Google Scholar] [CrossRef] [PubMed]
- Chang, M.T.; Asthana, S.; Gao, S.P.; Lee, B.H.; Chapman, J.S.; Kandoth, C.; Gao, J.; Socci, N.D.; Solit, D.B.; Olshen, A.B.; et al. Identifying recurrent mutations in cancer reveals widespread lineage diversity and mutational specificity. Nat. Biotechnol. 2016, 34, 155–163. [Google Scholar] [CrossRef] [PubMed]
- Buda, M.; Maki, A.; Mazurowski, M. A systematic study of the class imbalance problem in convolutional neural networks. Neural Netw. 2018, 106, 249–259. [Google Scholar] [CrossRef] [PubMed] [Green Version]
- Arlot, S.; Celisse, A. A survey of cross-validation procedures for model selection. Statist. Surv. 2010, 4, 40–79. [Google Scholar] [CrossRef]
- Kuhn, M. Caret: Classification and Regression Training. 2020. Available online: https://github.com/topepo/caret/ (accessed on 24 April 2021).
- Hossin, M. A Review on Evaluation Metrics for Data Classification Evaluations. Int. J. Data Min. Knowl. Manag. Process. 2015, 5, 1–11. [Google Scholar] [CrossRef]
- Strobl, C.; Boulesteix, A.L.; Zeileis, A.; Hothorn, T. Bias in random forest variable importance measures: Illustrations, sources and a solution. BMC Bioinf. 2007, 8, 25. [Google Scholar] [CrossRef] [Green Version]
- Lawrence, M.S.; Stojanov, P.; Mermel, C.H.; Garraway, L.A.; Golub, T.R.; Meyerson, M.; Gabriel, S.B.; Lander, E.S.; Getz, G. Discovery and saturation analysis of cancer genes across 21 tumor types. Nature 2014, 505, 495–501. [Google Scholar] [CrossRef] [Green Version]
- Goncearenco, A.; Rager, S.L.; Li, M.; Sang, Q.X.; Rogozin, I.B.; Panchenko, A.R. Exploring background mutational processes to decipher cancer genetic heterogeneity. Nucleic Acids Res. 2017, 45, W514–W522. [Google Scholar] [CrossRef] [PubMed]
- Tate, J.G.; Bamford, S.; Jubb, H.C.; Sondka, Z.; Beare, D.M.; Bindal, N.; Boutselakis, H.; Cole, C.G.; Creatore, C.; Dawson, E.; et al. COSMIC: The Catalogue Of Somatic Mutations In Cancer. Nucleic Acids Res. 2019, 47, D941–D947. [Google Scholar] [CrossRef] [Green Version]
- Pagel, K.A.; Kim, R.; Moad, K.; Busby, B.; Zheng, L.; Hynes-Grace, M.; Tokheim, C.; Ryan, M.; Karchin, R. OpenCRAVAT, an open source collaborative platform for the annotation of human genetic variation. bioRxiv 2019, 794297. [Google Scholar] [CrossRef]
- Subramanian, A.; Tamayo, P.; Mootha, V.K.; Mukherjee, S.; Ebert, B.L.; Gillette, M.A.; Paulovich, A.; Pomeroy, S.L.; Golub, T.R.; Lander, E.S.; et al. Gene set enrichment analysis: A knowledge-based approach for interpreting genome-wide expression profiles. Proc. Natl. Acad. Sci. USA 2005, 102, 15545–15550. [Google Scholar] [CrossRef] [PubMed] [Green Version]
- Richards, S.; Aziz, N.; Bale, S.; Bick, D.; Das, S.; Gastier-Foster, J.; Grody, W.W.; Hegde, M.; Lyon, E.; Spector, E.; et al. Standards and Guidelines for the Interpretation of Sequence Variants: A Joint Consensus Recommendation of the American College of Medical Genetics and Genomics and the Association for Molecular Pathology. Genet. Med. 2015, 17, 405–424. [Google Scholar] [CrossRef]
- Robin, X.; Turck, N.; Hainard, A.; Tiberti, N.; Lisacek, F.; Sanchez, J.C.; Müller, M. pROC: An open-source package for R and S+ to analyze and compare ROC curves. BMC Bioinf. 2011, 12, 77. [Google Scholar] [CrossRef]
- Litchfield, K.; Turajlic, S.; Swanton, C. The GENIE Is Out of the Bottle: Landmark Cancer Genomics Dataset Released. Cancer Discov. 2017, 7, 796–798. [Google Scholar] [CrossRef] [Green Version]
- Zhou, W.; Chen, T.; Chong, Z.; Rohrdanz, M.A.; Melott, J.M.; Wakefield, C.; Zeng, J.; Weinstein, J.N.; Meric-Bernstam, F.; Mills, G.B.; et al. TransVar: A multilevel variant annotator for precision genomics. Nat. Methods 2015, 12, 1002–1003. [Google Scholar] [CrossRef] [Green Version]
- Anagnostopoulos, C.; Hand, D.J.; Adams, N.M. Measuring Classification Performance: The Hmeasure Package. p. 17. Available online: https://cran.r-project.org/web/packages/hmeasure/vignettes/hmeasure.pdf (accessed on 24 April 2021).
- Fisher, R.; Pusztai, L.; Swanton, C. Cancer heterogeneity: Implications for targeted therapeutics. Br. J. Cancer 2013, 108, 479–485. [Google Scholar] [CrossRef] [PubMed] [Green Version]
- Gore, M.E.; Larkin, J.M.G. Challenges and opportunities for converting renal cell carcinoma into a chronic disease with targeted therapies. Br. J. Cancer 2011, 104, 399–406. [Google Scholar] [CrossRef] [PubMed] [Green Version]
- Wei, P.J.; Zhang, D.; Li, H.T.; Xia, J.; Zheng, C.H. Driverfinder: A Gene Length-Based Network Method to Identify Cancer Driver Genes; Hindawi: London, UK, 2017; p. e4826206. [Google Scholar] [CrossRef] [Green Version]
- Yap, T.A.; Gerlinger, M.; Futreal, P.A.; Pusztai, L.; Swanton, C. Intratumor Heterogeneity: Seeing the Wood for the Trees. Sci. Transl. Med. 2012, 4, 127ps10. [Google Scholar] [CrossRef] [PubMed] [Green Version]
- Yang, F.; Petsalaki, E.; Rolland, T.; Hill, D.E.; Vidal, M.; Roth, F.P. Protein Domain-Level Landscape of Cancer-Type-Specific Somatic Mutations. PLoS Comput. Biol. 2015, 11, e1004147. [Google Scholar] [CrossRef] [Green Version]


| Algorithm | Accuracy | Precision | Recall | F1-Score | AUC-ROC |
|---|---|---|---|---|---|
| Random forest | 0.734 | 0.741 | 0.718 | 0.729 | 0.819 |
| KNN | 0.414 | 0.435 | 0.570 | 0.493 | 0.795 |
| EGB | 0.659 | 0.971 | 0.327 | 0.489 | 0.783 |
| SVM | 0.478 | 0.483 | 0.614 | 0.541 | 0.777 |
| Decision tree | 0.702 | 0.724 | 0.650 | 0.685 | 0.757 |
| Logistic regression | 0.697 | 0.739 | 0.607 | 0.667 | 0.735 |
| MLP | 0.647 | 0.713 | 0.492 | 0.582 | 0.689 |
| Algorithm | Accuracy | Precision | Recall | F1-Score | AUC-ROC |
|---|---|---|---|---|---|
| Logistic regression | 0.781 | 0.795 | 0.756 | 0.775 | 0.885 |
| MLP | 0.786 | 0.983 | 0.582 | 0.731 | 0.876 |
| Decision tree | 0.723 | 0.723 | 0.723 | 0.723 | 0.847 |
| KNN | 0.753 | 0.750 | 0.758 | 0.754 | 0.833 |
| EGB | 0.699 | 0.687 | 0.732 | 0.708 | 0.789 |
| Random forest | 0.706 | 0.696 | 0.731 | 0.713 | 0.785 |
| SVM | 0.680 | 0.672 | 0.706 | 0.688 | 0.741 |
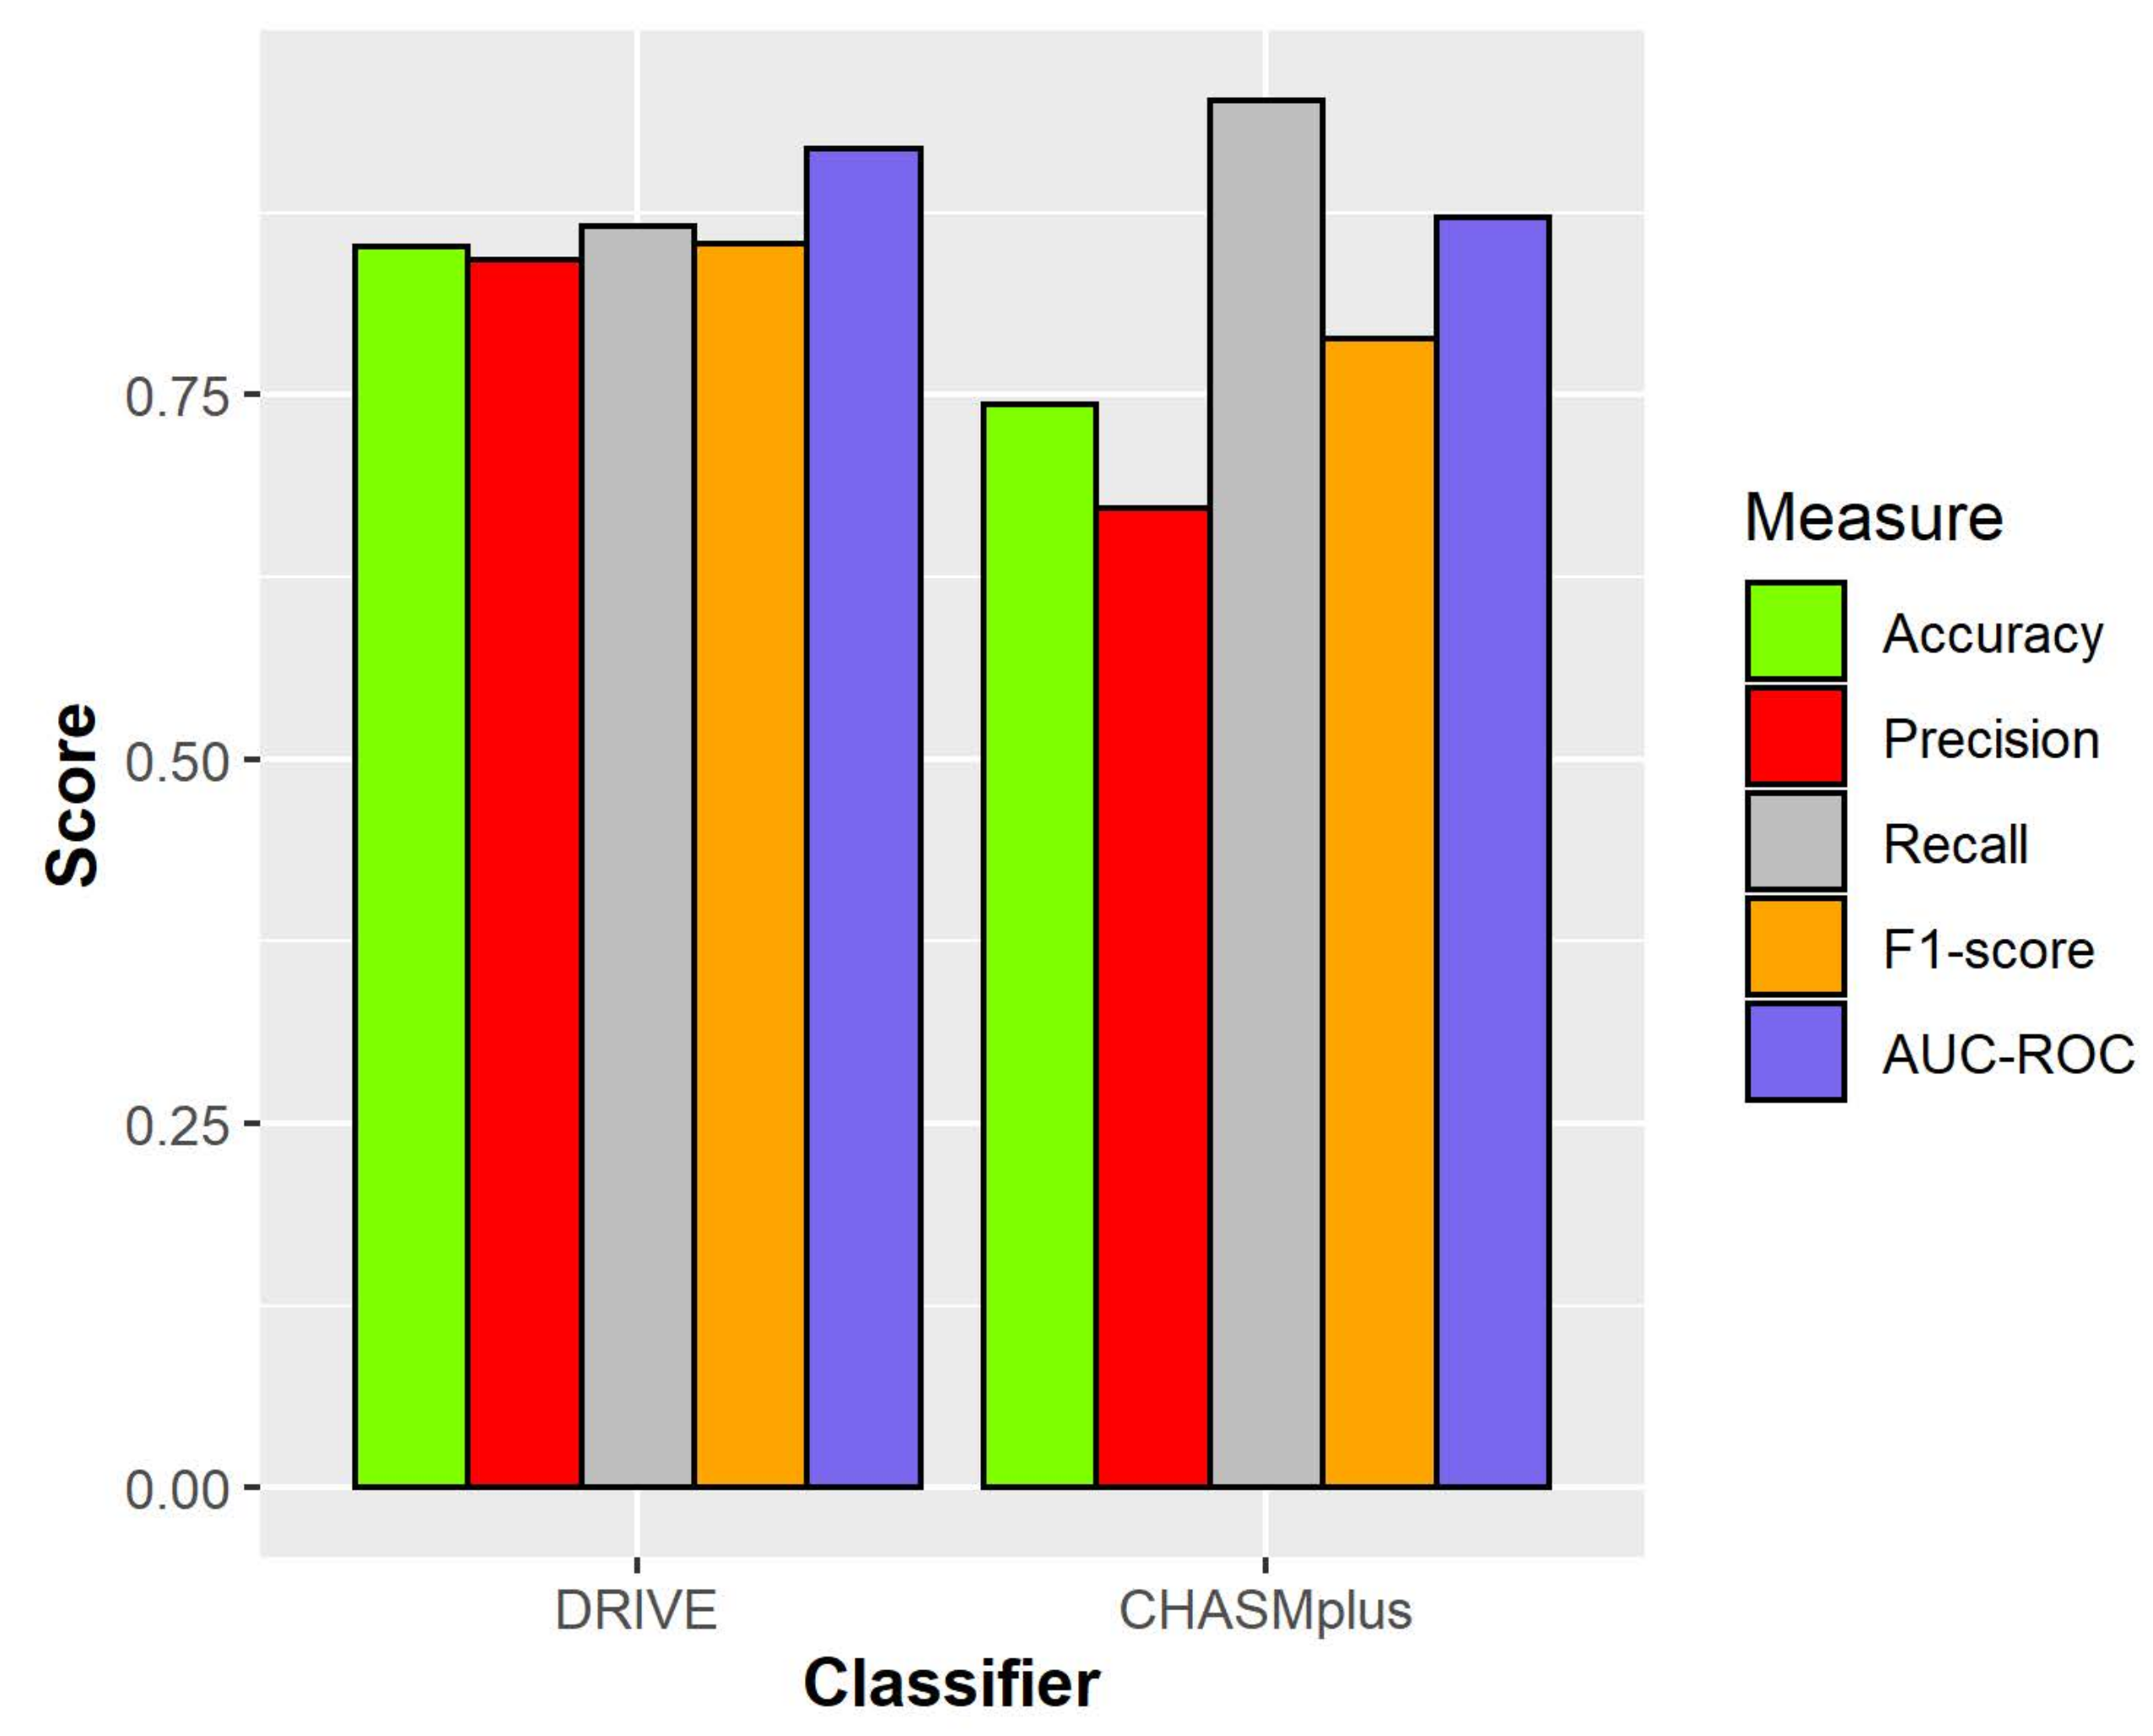
| Model | Accuracy | Precision | Recall | F1-Score | AUC-ROC |
|---|---|---|---|---|---|
| DRIVE | 0.852 | 0.843 | 0.866 | 0.854 | 0.919 |
| CHASMplus | 0.743 | 0.672 | 0.952 | 0.788 | 0.872 |
Publisher’s Note: MDPI stays neutral with regard to jurisdictional claims in published maps and institutional affiliations. |
© 2021 by the authors. Licensee MDPI, Basel, Switzerland. This article is an open access article distributed under the terms and conditions of the Creative Commons Attribution (CC BY) license (https://creativecommons.org/licenses/by/4.0/).
Share and Cite
Dragomir, I.; Akbar, A.; Cassidy, J.W.; Patel, N.; Clifford, H.W.; Contino, G. Identifying Cancer Drivers Using DRIVE: A Feature-Based Machine Learning Model for a Pan-Cancer Assessment of Somatic Missense Mutations. Cancers 2021, 13, 2779. https://0-doi-org.brum.beds.ac.uk/10.3390/cancers13112779
Dragomir I, Akbar A, Cassidy JW, Patel N, Clifford HW, Contino G. Identifying Cancer Drivers Using DRIVE: A Feature-Based Machine Learning Model for a Pan-Cancer Assessment of Somatic Missense Mutations. Cancers. 2021; 13(11):2779. https://0-doi-org.brum.beds.ac.uk/10.3390/cancers13112779
Chicago/Turabian StyleDragomir, Ionut, Adnan Akbar, John W. Cassidy, Nirmesh Patel, Harry W. Clifford, and Gianmarco Contino. 2021. "Identifying Cancer Drivers Using DRIVE: A Feature-Based Machine Learning Model for a Pan-Cancer Assessment of Somatic Missense Mutations" Cancers 13, no. 11: 2779. https://0-doi-org.brum.beds.ac.uk/10.3390/cancers13112779