
Functional Analysis of Non-Genetic Resistance to Platinum in Epithelial Ovarian Cancer Reveals a Role for the MBD3-NuRD Complex in Resistance Development

 , , , , , and
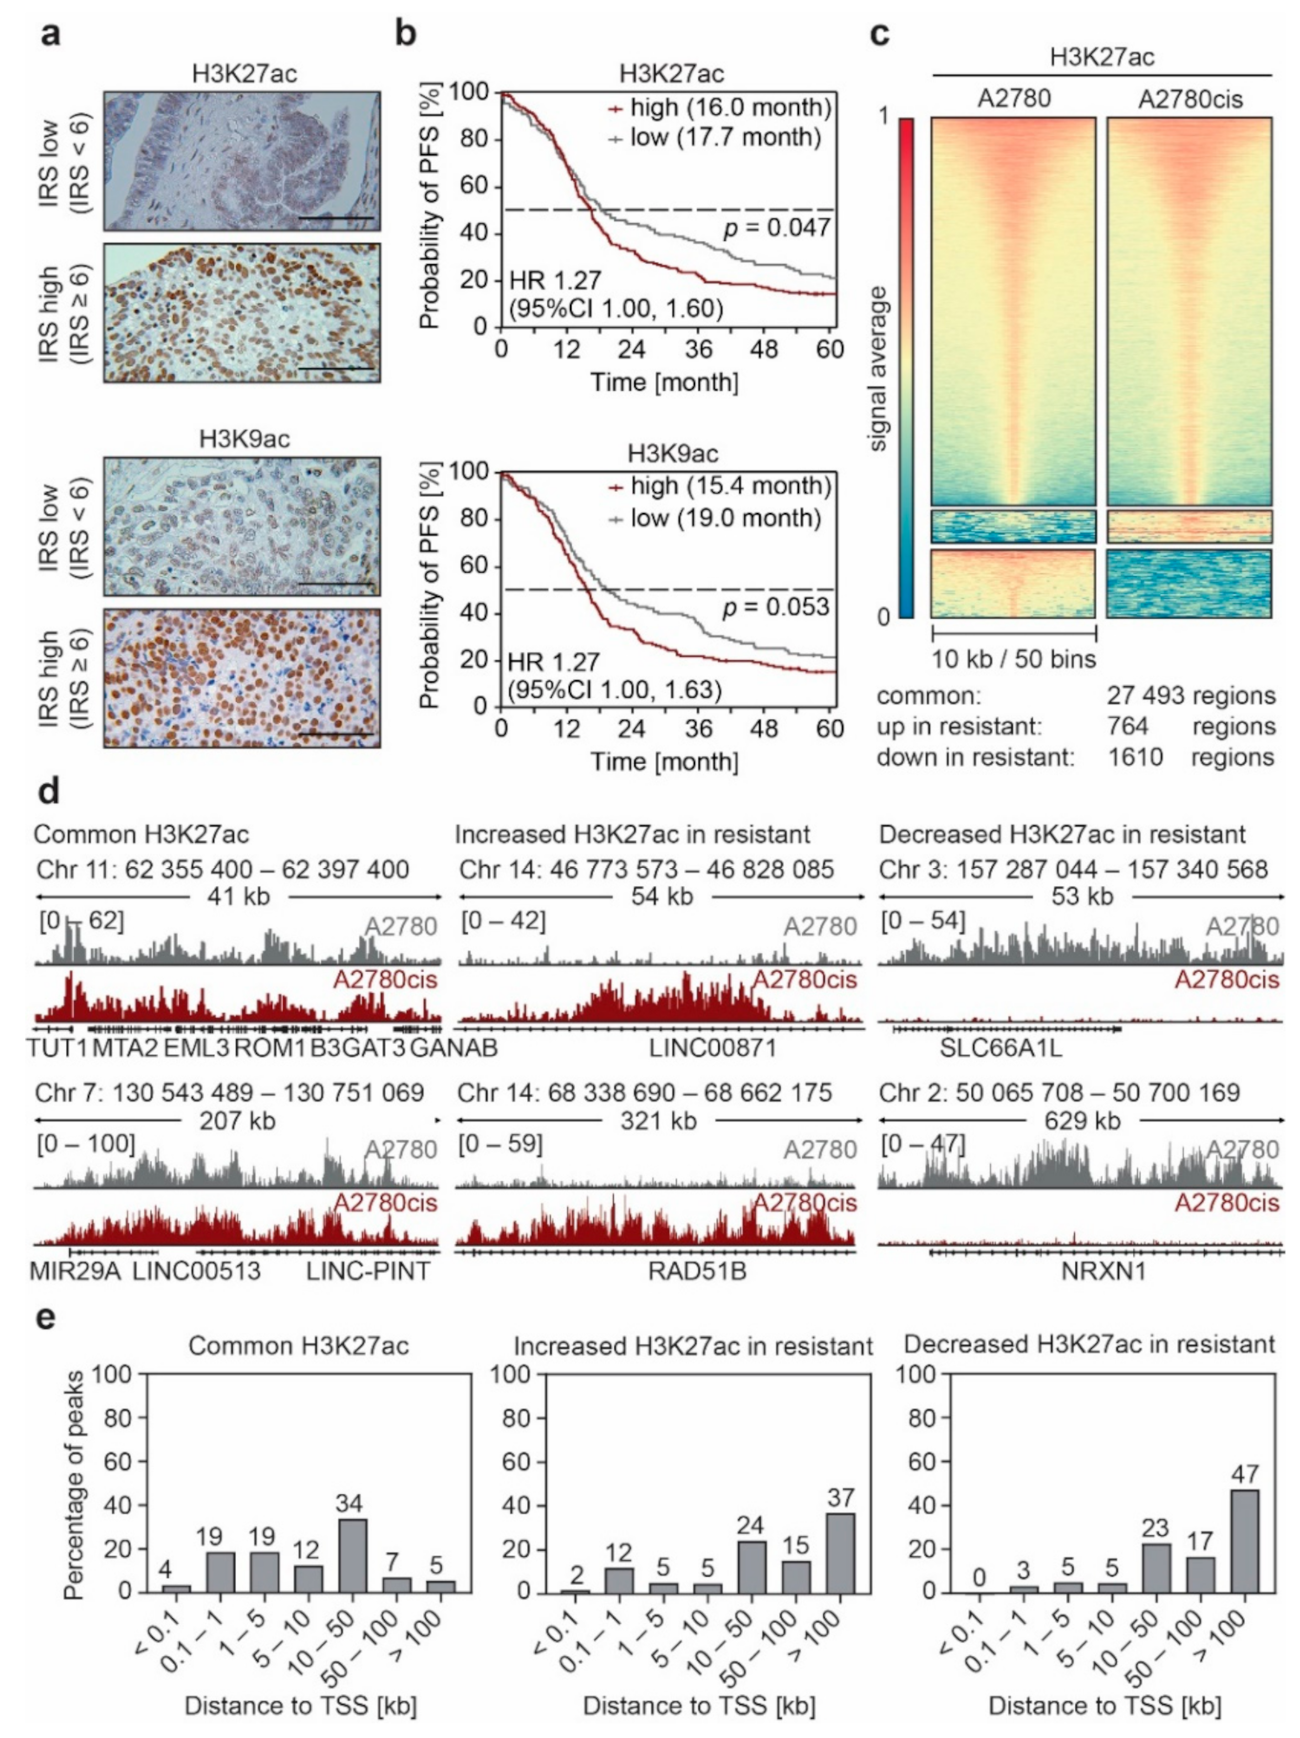
Abstract
:Simple Summary
Abstract
1. Introduction
2. Materials and Methods
2.1. Plasmids
2.2. Antibodies
2.3. Experiments on Human Tissue Samples
2.4. Cell Culture, Generation of Tet-On Competent Cells and Lentiviral Transduction
2.5. Viability Assay for cPt GI50 Determination
2.6. MBD3 Protein Expression Western Blot
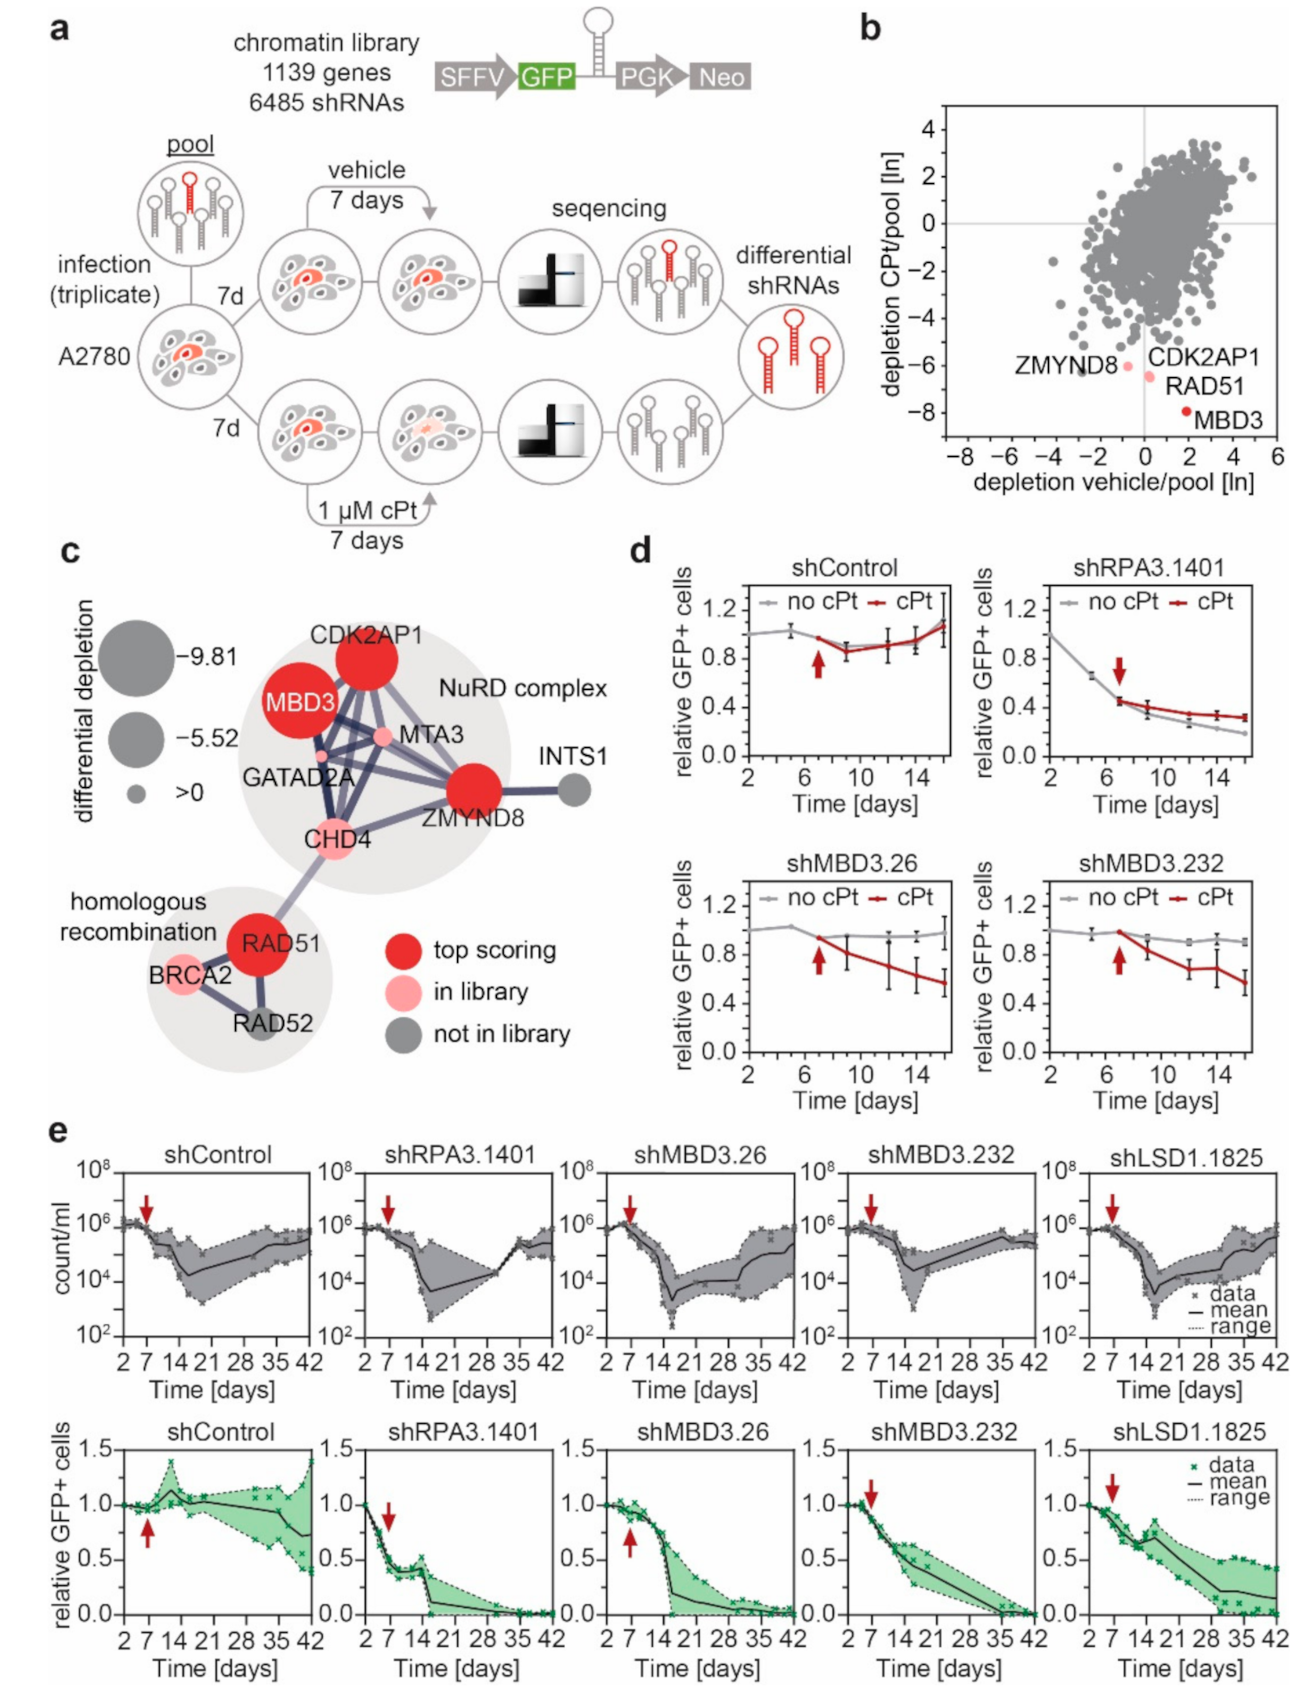
2.7. Multiplexed RNAi Screen
2.8. Immunofluorescence Staining, Image Acquisition and Analysis
2.9. Gene-Expression Analysis
2.10. Chromatin Immunoprecipitation (ChIP-qPCR and ChIP-Seq)
2.11. Analysis of ChIP-Seq Data
2.12. Analysis of RNA-Seq Data of EOC Cell Lines and Patient Samples
2.13. Statistical Analyses
3. Results
3.1. Non-Genetic Resistance in EOC Is Associated with Changes in the Enhancer Landscape
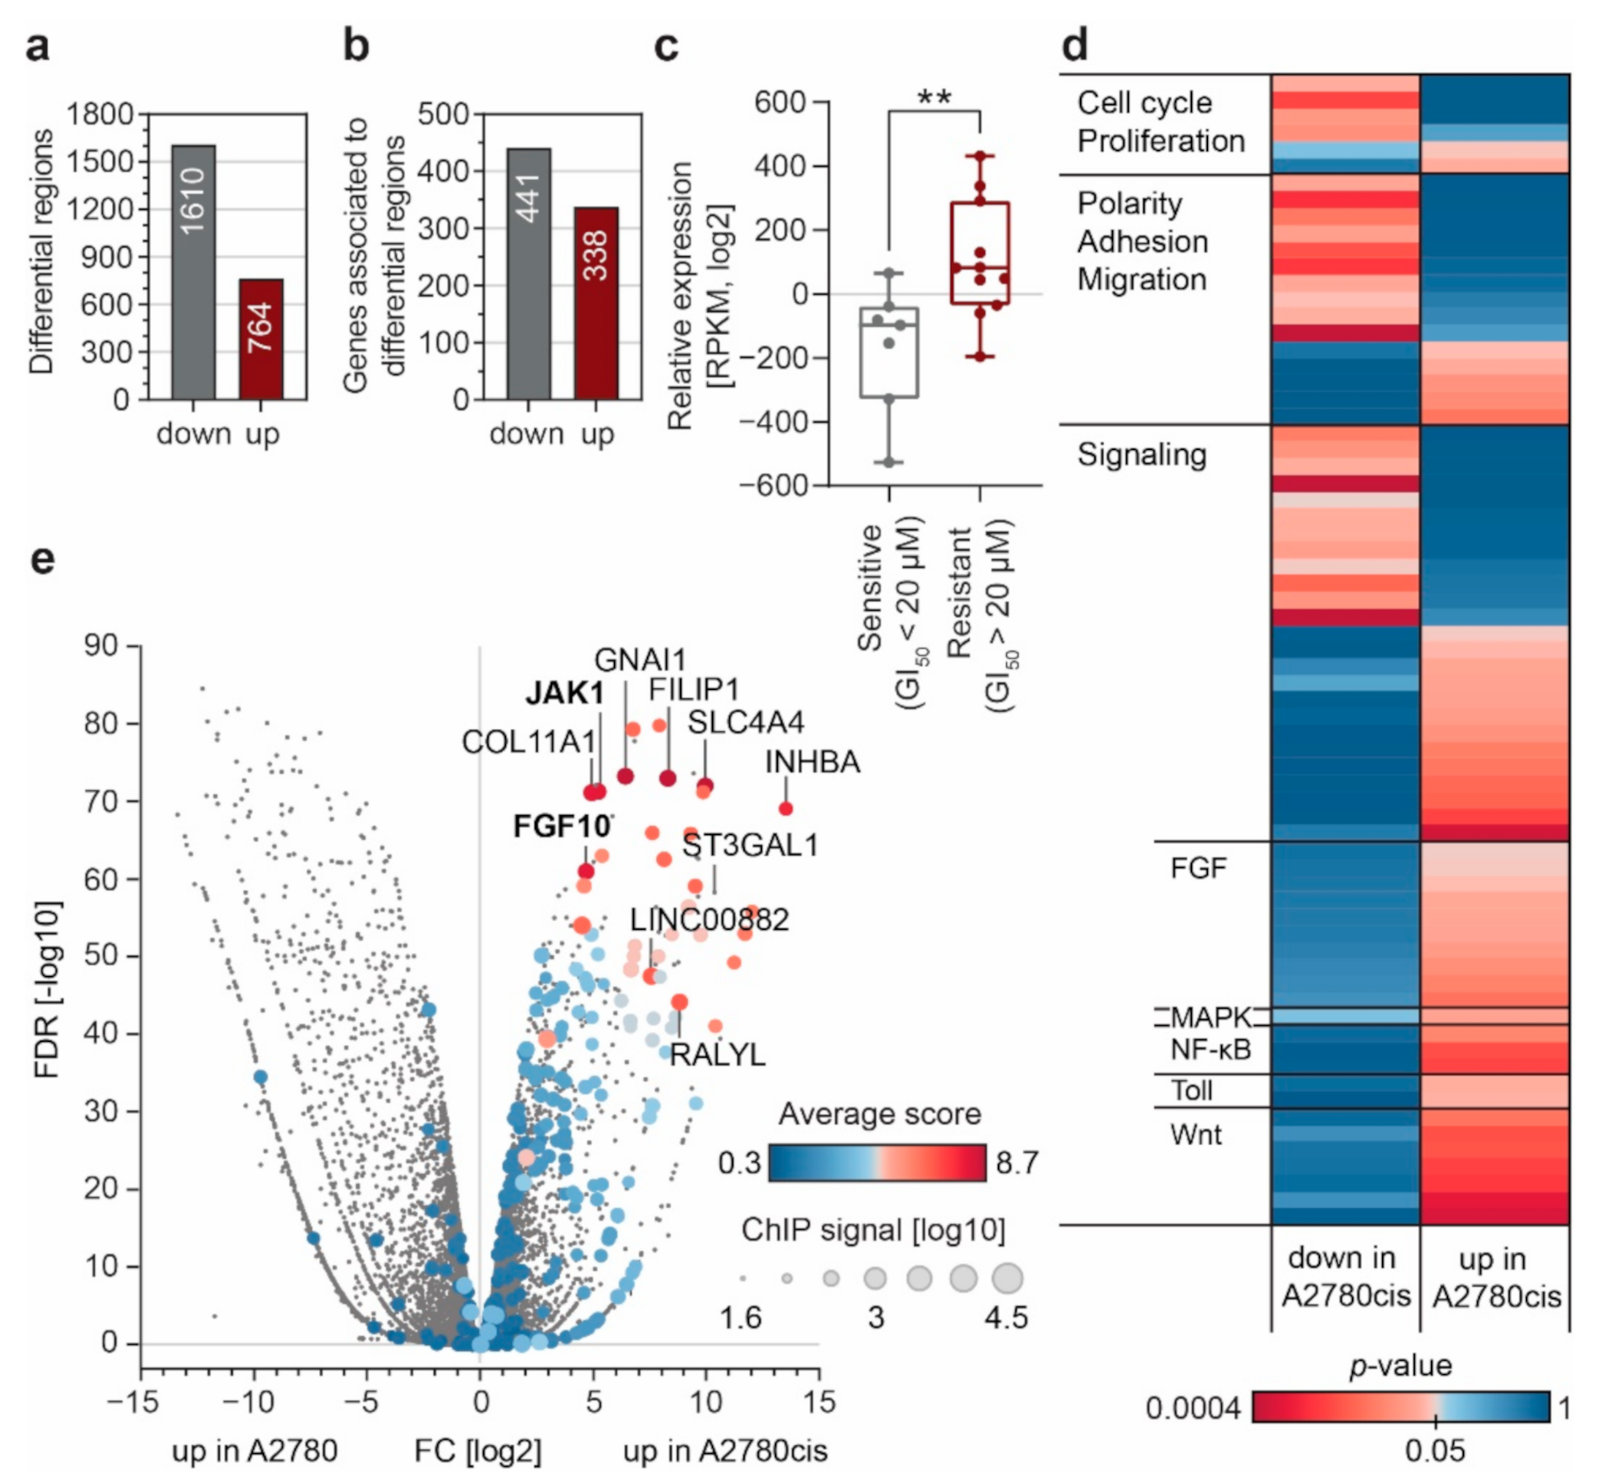
3.2. Enhancer Remodeling Is Associated with Cellular Processes Implicated in Resistance Development
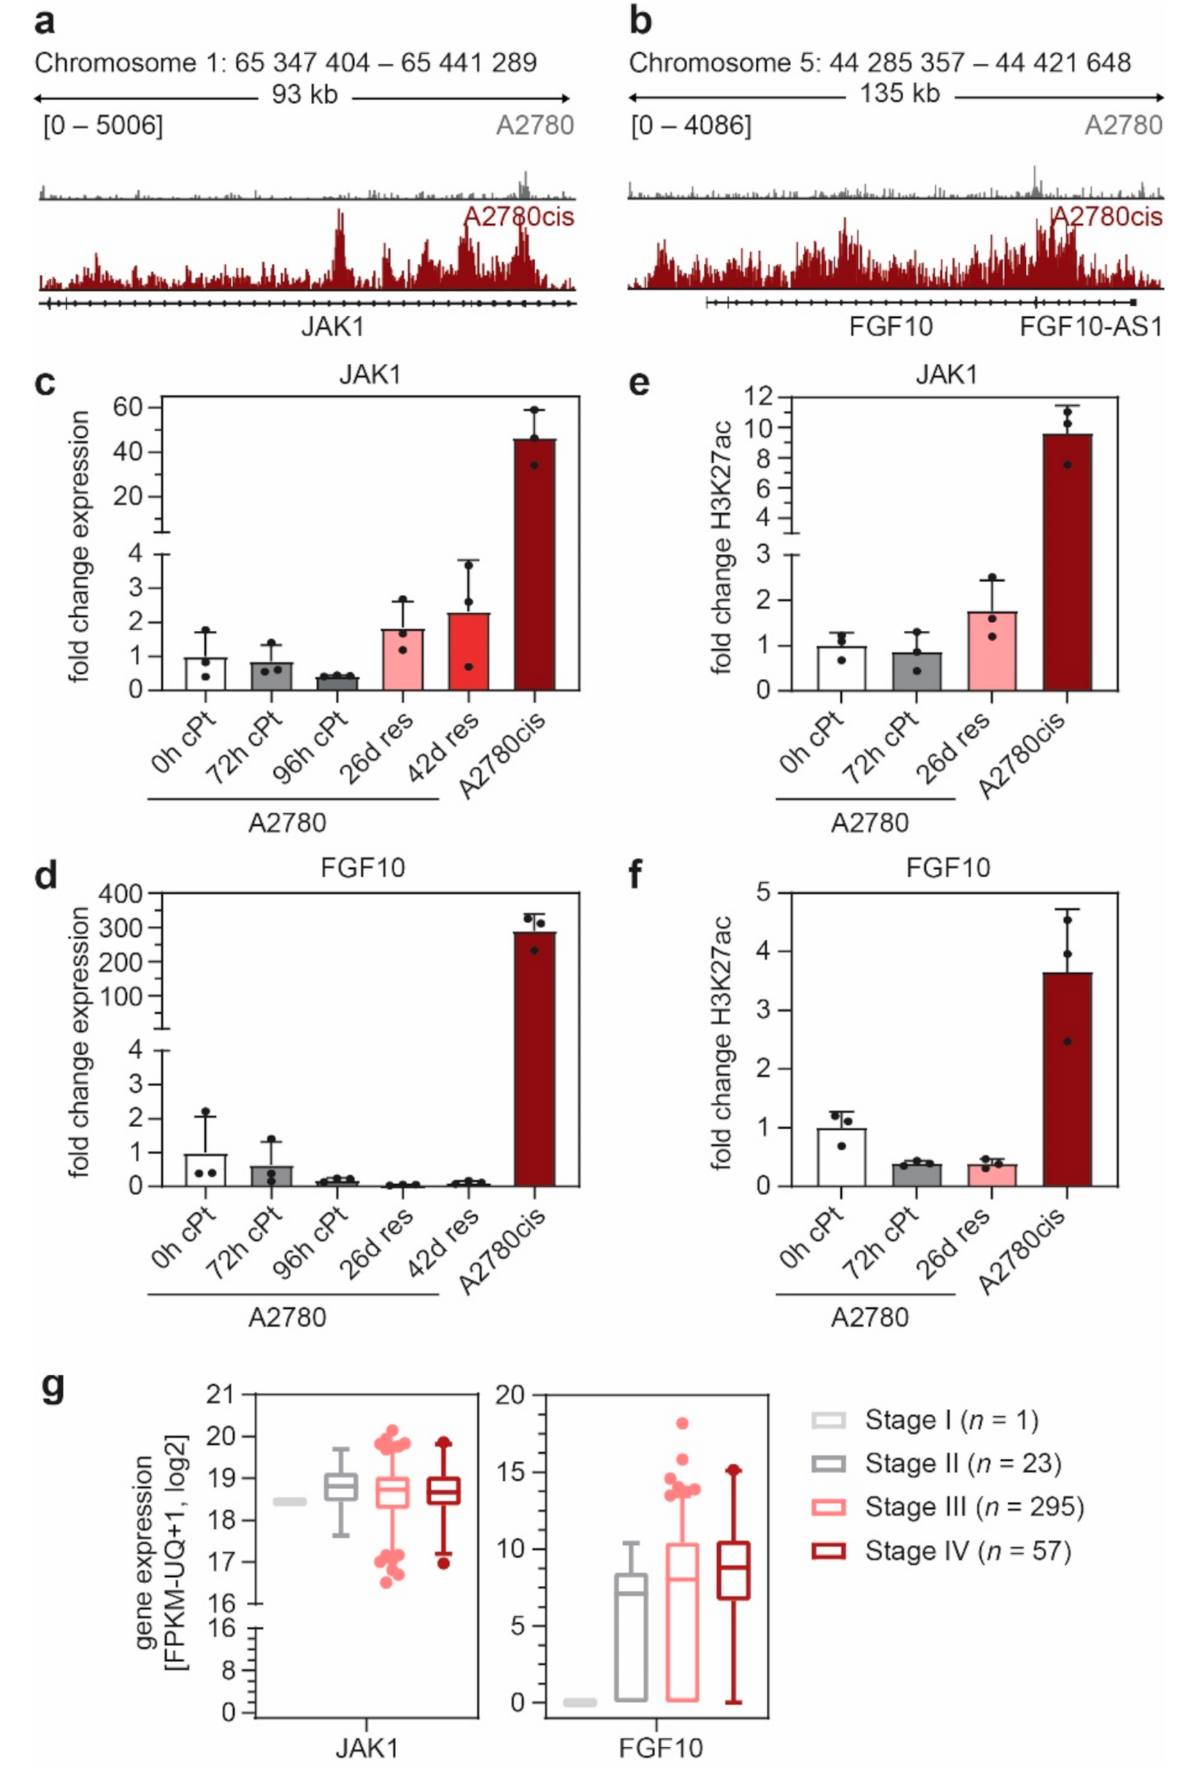
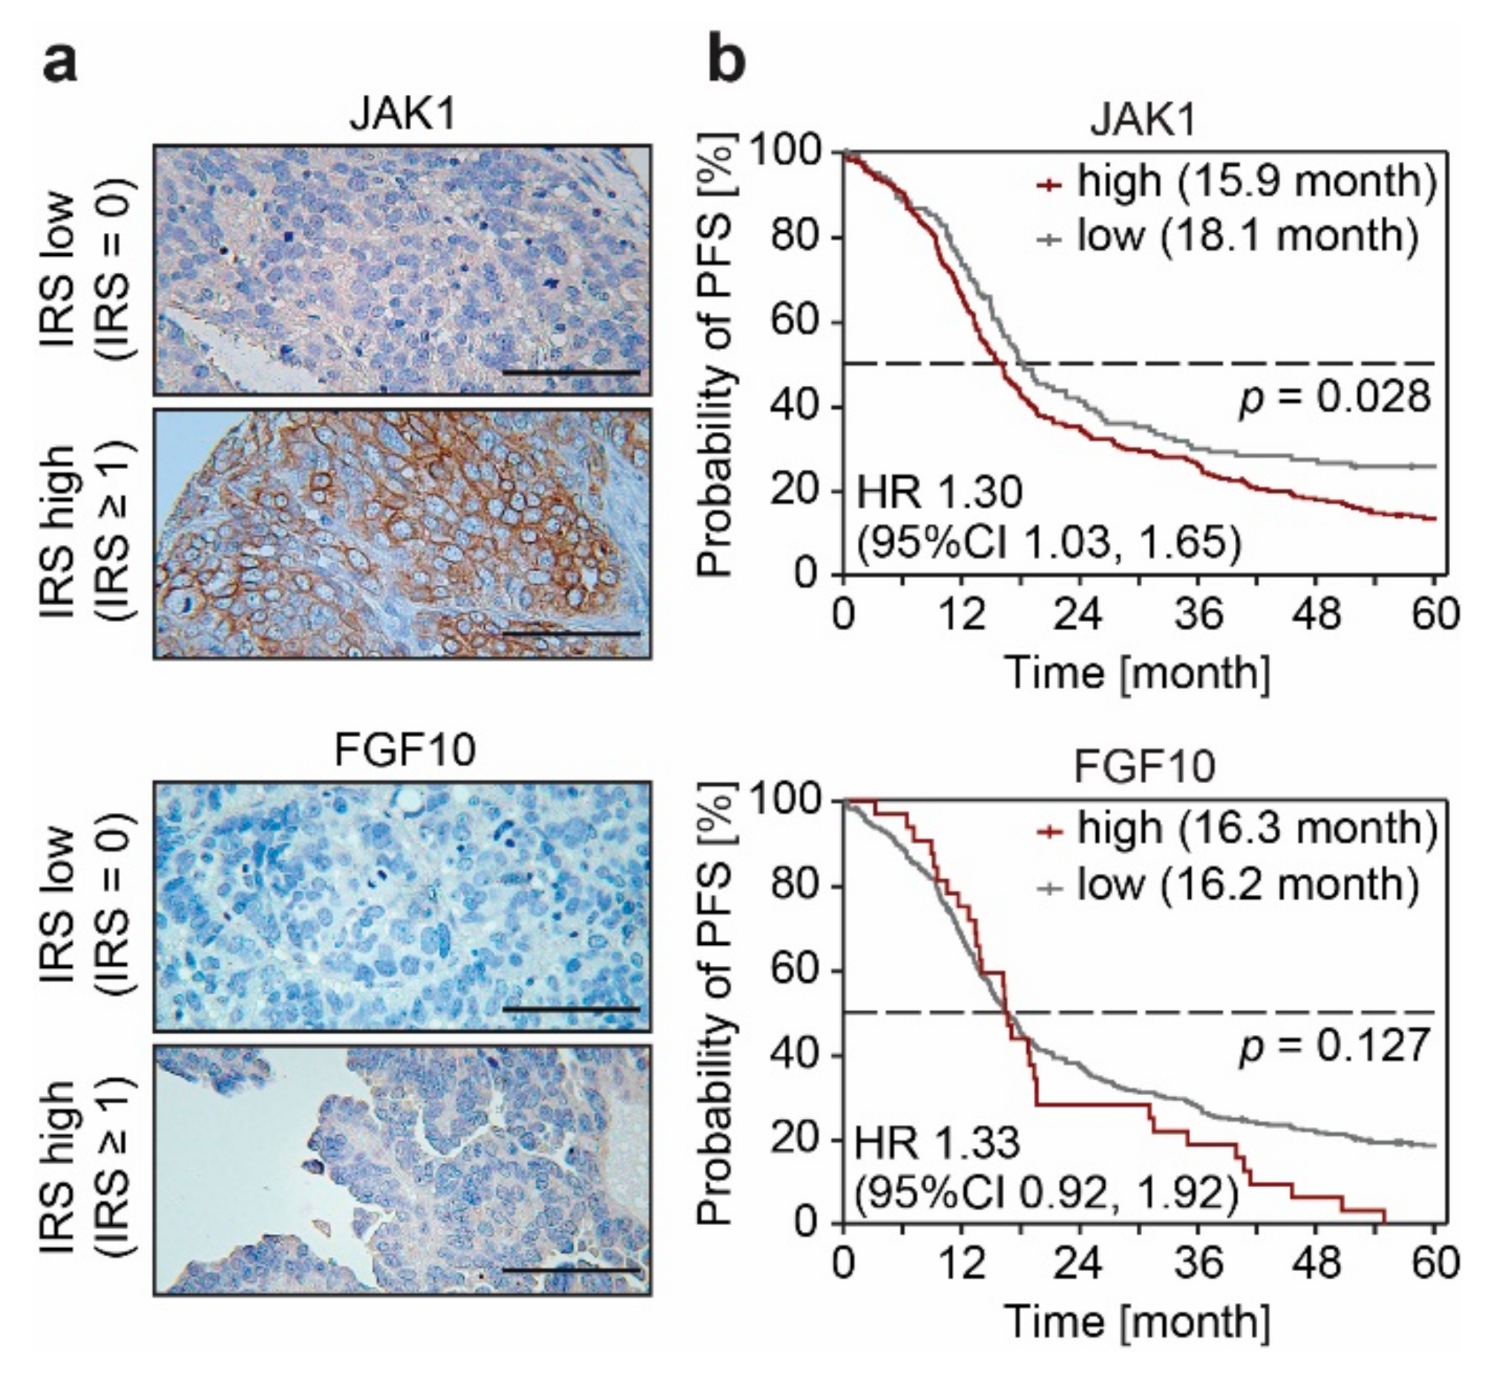
3.3. FGF10 and JAK1 Expression Is Associated with Impaired Prognosis and JAK1 Is an Independent Predictive Biomarker
3.4. MBD3 and Components of the NuRD Complex Sensitize EOC Cells to Platinum Treatment
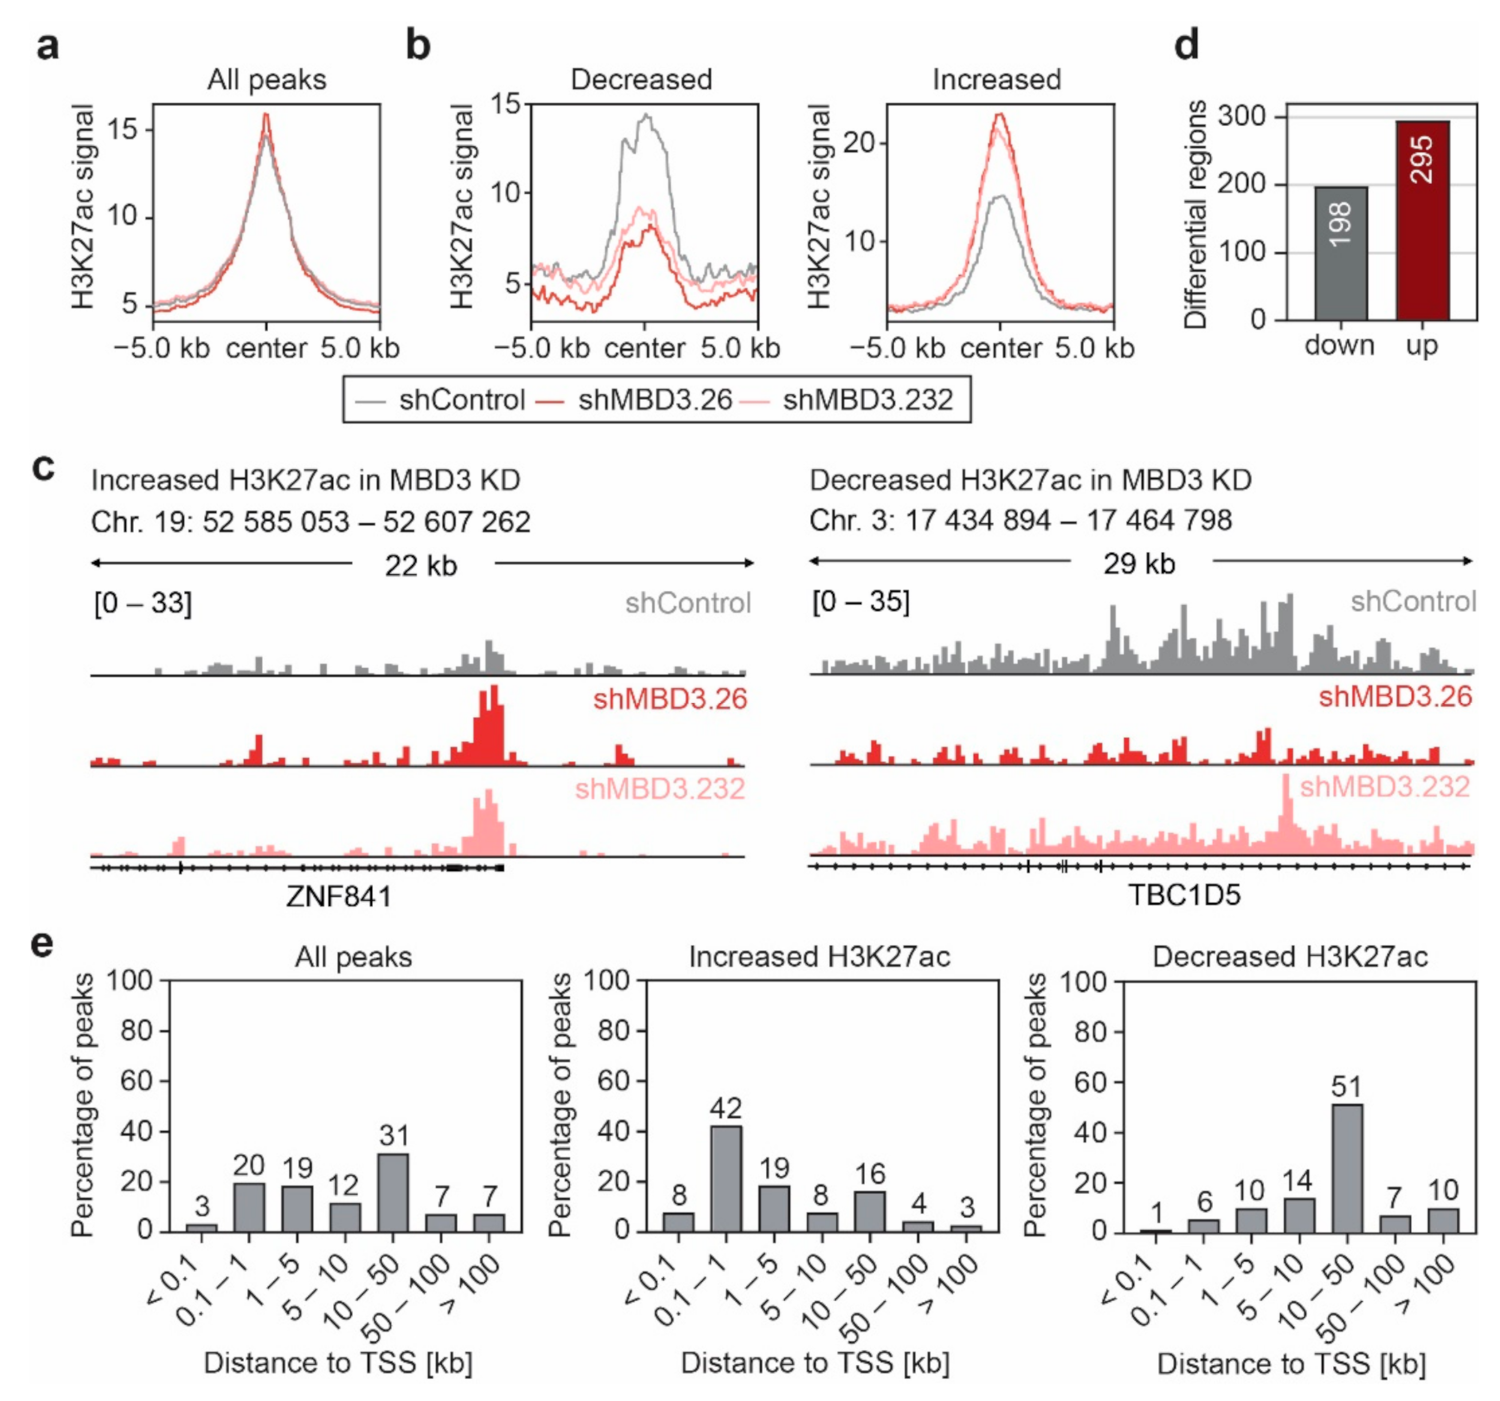
3.5. Suppression of MBD3 Is Associated with Alterations of H3K27ac within Selected Regulatory Regions
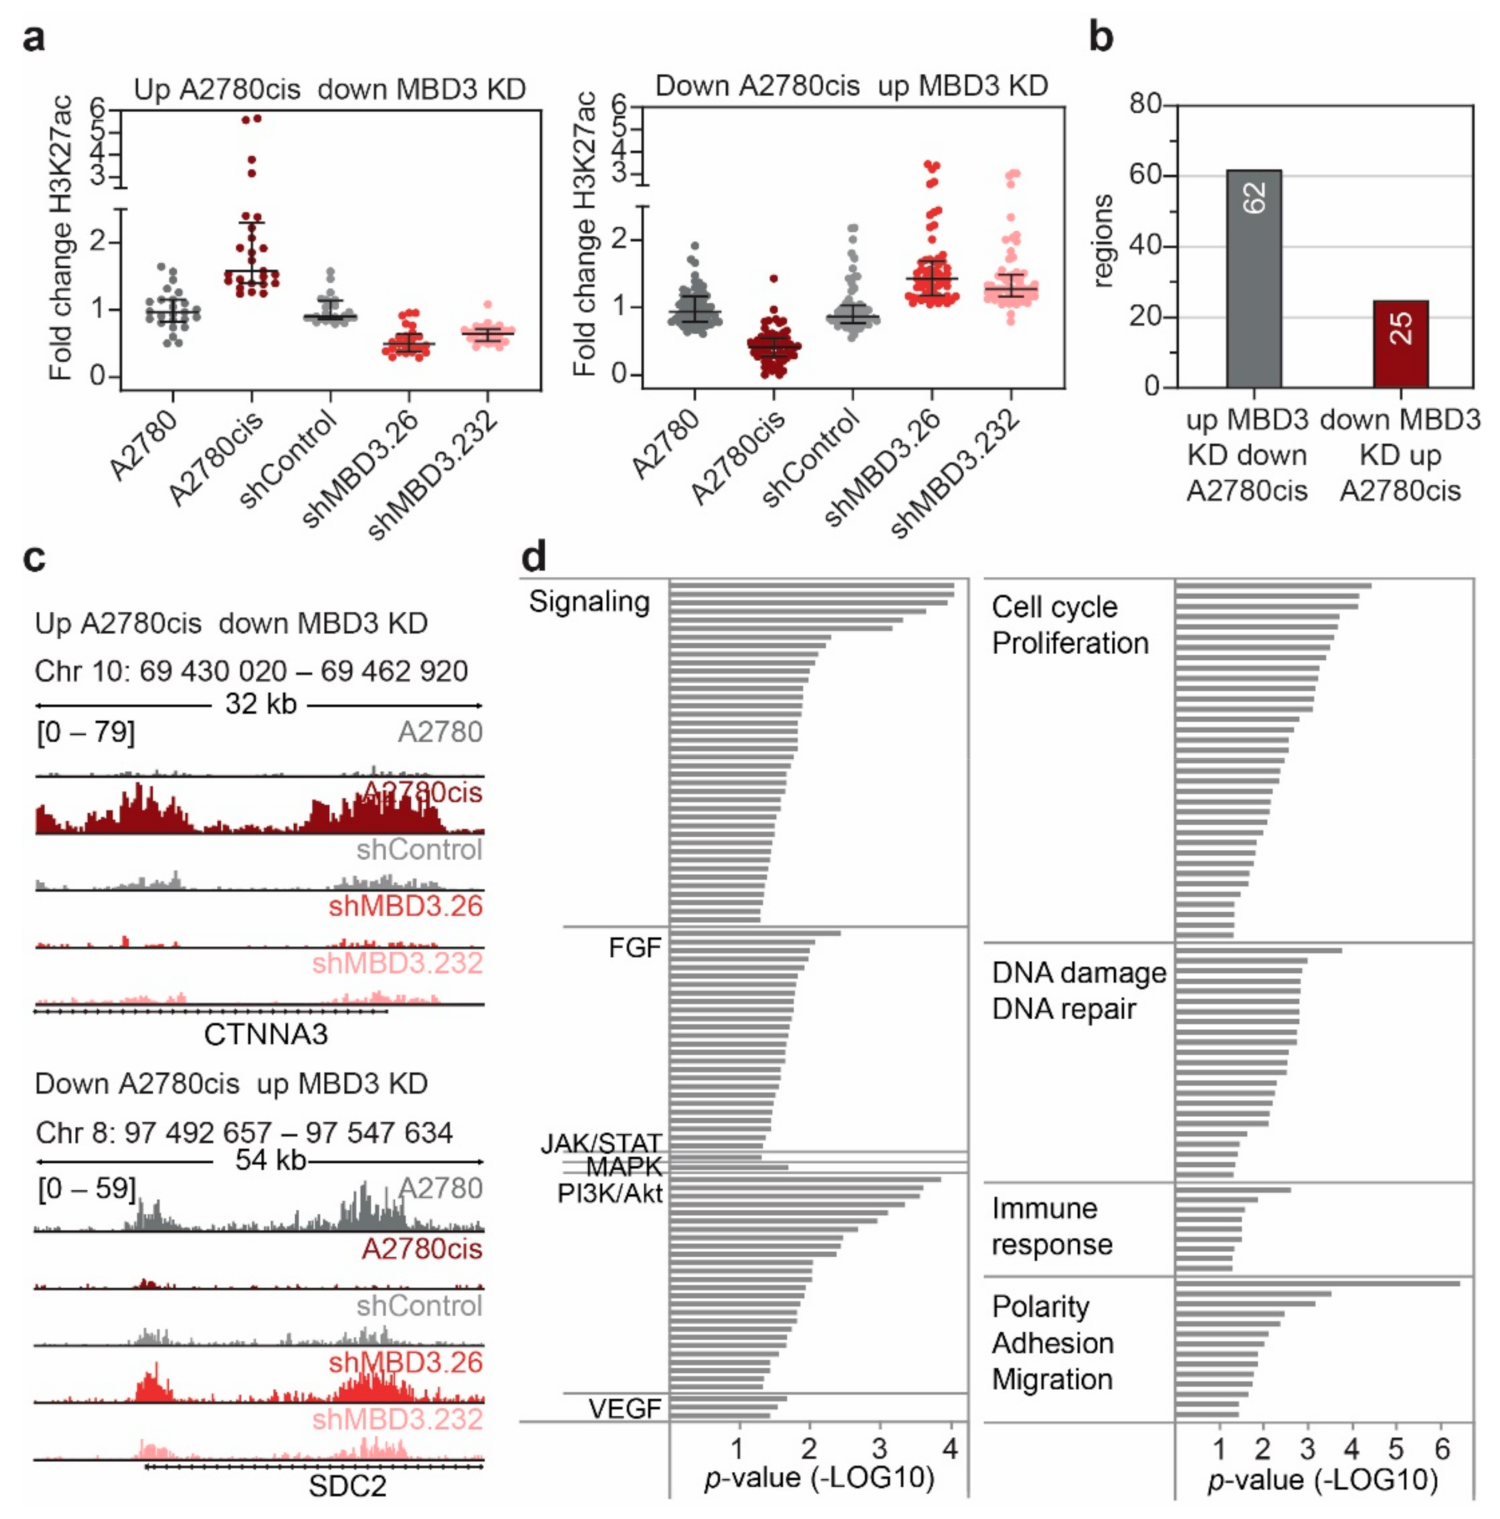
3.6. MBD3 Suppression Leads to Modulation of H3K27ac at Resistance Associated Enhancers
4. Discussion
5. Conclusions
Supplementary Materials
Author Contributions
Funding
Institutional Review Board Statement
Informed Consent Statement
Data Availability Statement
Acknowledgments
Conflicts of Interest
References
- Sung, H.; Ferlay, J.; Siegel, R.L.; Laversanne, M.; Soerjomataram, I.; Jemal, A.; Bray, F. Global Cancer Statistics 2020: GLOBOCAN Estimates of Incidence and Mortality Worldwide for 36 Cancers in 185 Countries. CA Cancer J. Clin. 2021, 71, 209–249. [Google Scholar] [CrossRef] [PubMed]
- Wagner, U.; Harter, P.; Hilpert, F.; Mahner, S.; Reuß, A.; Du Bois, A.; Petru, E.; Meier, W.; Ortner, P.; König, K.; et al. S3-Guideline on Diagnostics, Therapy and Follow-up of Malignant Ovarian Tumours. Geburtshilfe Frauenheilkd. 2013, 73, 874–889. [Google Scholar] [CrossRef] [PubMed] [Green Version]
- Ray-Coquard, I.; Pautier, P.; Pignata, S.; Pérol, D.; Martín, A.G.; Berger, R.; Fujiwara, K.; Vergote, I.; Colombo, N.; Mäenpää, J.; et al. Olaparib plus Bevacizumab as First-Line Maintenance in Ovarian Cancer. N. Engl. J. Med. 2019, 381, 2416–2428. [Google Scholar] [CrossRef] [PubMed]
- Ledermann, J.; Kemp, Z. Update on first-line treatment of advanced ovarian carcinoma. Int. J. Women's Health 2013, 5, 45–51. [Google Scholar] [CrossRef] [Green Version]
- Bast, R.C., Jr.; Hennessy, B.; Mills, G.B. The biology of ovarian cancer: New opportunities for translation. Nat. Rev. Cancer 2009, 9, 415–428. [Google Scholar] [CrossRef]
- Nabavi, S. Identifying candidate drivers of drug response in heterogeneous cancer by mining high throughput genomics data. BMC Genom. 2016, 17, 638. [Google Scholar] [CrossRef] [Green Version]
- Singh, A.; Gupta, S.; Sachan, M. Epigenetic Biomarkers in the Management of Ovarian Cancer: Current Prospectives. Front. Cell Dev. Biol. 2019, 7, 182. [Google Scholar] [CrossRef] [Green Version]
- Balch, C.; Huang, T.H.-M.; Brown, R.; Nephew, K.P. The epigenetics of ovarian cancer drug resistance and resensitization. Am. J. Obstet. Gynecol. 2004, 191, 1552–1572. [Google Scholar] [CrossRef]
- Strauss, J.; Figg, W.D. Using Epigenetic Therapy to Overcome Chemotherapy Resistance. Anticancer. Res. 2016, 36, 1–4. [Google Scholar]
- Chen, J.; Odenike, O.; Rowley, J.D. Leukaemogenesis: More than mutant genes. Nat. Rev. Cancer 2010, 10, 23–36. [Google Scholar] [CrossRef]
- Morgan, M.A.; Shilatifard, A. Chromatin signatures of cancer. Genes Dev. 2015, 29, 238–249. [Google Scholar] [CrossRef] [Green Version]
- Yokoyama, Y.; Zhu, H.; Lee, J.H.; Kossenkov, A.V.; Wu, S.; Wickramasinghe, J.M.; Yin, X.; Palozola, K.C.; Gardini, A.; Showe, L.C.; et al. BET Inhibitors Suppress ALDH Activity by Targeting ALDH1A1 Super-Enhancer in Ovarian Cancer. Cancer Res. 2016, 76, 6320–6330. [Google Scholar] [CrossRef] [Green Version]
- Ma, Q.; Yang, F.; Mackintosh, C.; Jayani, R.S.; Oh, S.; Jin, C.; Nair, S.J.; Merkurjev, D.; Ma, W.; Allen, S.; et al. Super-Enhancer Redistribution as a Mechanism of Broad Gene Dysregulation in Repeatedly Drug-Treated Cancer Cells. Cell Rep. 2020, 31, 107532. [Google Scholar] [CrossRef]
- Shang, S.; Yang, J.; Jazaeri, A.A.; Duval, A.J.; Tufan, T.; Fischer, N.L.; Benamar, M.; Guessous, F.; Lee, I.; Campbell, R.M.; et al. Chemotherapy-Induced Distal Enhancers Drive Transcriptional Programs to Maintain the Chemoresistant State in Ovarian Cancer. Cancer Res. 2019, 79, 4599–4611. [Google Scholar] [CrossRef] [Green Version]
- Cheng, Y.; He, C.; Wang, M.; Ma, X.; Mo, F.; Yang, S.; Han, J.; Wei, X. Targeting epigenetic regulators for cancer therapy: Mechanisms and advances in clinical trials. Signal Transduct. Target. Ther. 2019, 4, 1–39. [Google Scholar] [CrossRef] [Green Version]
- Lai, A.Y.; Wade, P.A. Cancer biology and NuRD: A multifaceted chromatin remodelling complex. Nat. Rev. Cancer 2011, 11, 588–596. [Google Scholar] [CrossRef]
- Bornelöv, S.; Reynolds, N.; Xenophontos, M.; Gharbi, S.; Johnstone, E.; Floyd, R.; Ralser, M.; Signolet, J.; Loos, R.; Dietmann, S.; et al. The Nucleosome Remodeling and Deacetylation Complex Modulates Chromatin Structure at Sites of Active Transcription to Fine-Tune Gene Expression. Mol. Cell 2018, 71, 56–72.e4. [Google Scholar] [CrossRef] [Green Version]
- LE Guezennec, X.; Vermeulen, M.; Brinkman, A.; Hoeijmakers, W.A.M.; Cohen, A.; Lasonder, E.; Stunnenberg, H.G. MBD2/NuRD and MBD3/NuRD, Two Distinct Complexes with Different Biochemical and Functional Properties. Mol. Cell. Biol. 2006, 26, 843–851. [Google Scholar] [CrossRef] [Green Version]
- Fellmann, C.; Hoffmann, T.; Sridhar, V.; Hopfgartner, B.; Muhar, M.; Roth, M.; Lai, D.Y.; Barbosa, I.A.; Kwon, J.S.; Guan, Y.; et al. An Optimized microRNA Backbone for Effective Single-Copy RNAi. Cell Rep. 2013, 5, 1704–1713. [Google Scholar] [CrossRef] [Green Version]
- Kaltofen, T.; Preinfalk, V.; Schwertler, S.; Fraungruber, P.; Heidegger, H.; Vilsmaier, T.; Vattai, A.; Czogalla, B.; Mayr, D.; Mahner, S.; et al. Potential of platinum-resensitization by Wnt signaling modulators as treatment approach for epithelial ovarian cancer. J. Cancer Res. Clin. Oncol. 2020, 146, 2559–2574. [Google Scholar] [CrossRef]
- Rathert, P.; Roth, M.; Neumann, T.; Muerdter, F.; Roe, J.-S.; Muhar, M.; Deswal, S.; Cerny-Reiterer, S.; Peter, B.; Jude, J.; et al. Transcriptional plasticity promotes primary and acquired resistance to BET inhibition. Nat. Cell Biol. 2015, 525, 543–547. [Google Scholar] [CrossRef]
- Pinter, S.; Knodel, F.; Choudalakis, M.; Schnee, P.; Kroll, C.; Fuchs, M.; Broehm, A.; Weirich, S.; Roth, M.; Eisler, A.S.; et al. A functional LSD1 coregulator screen reveals a novel transcriptional regulatory cascade connecting R-loop homeostasis with epigenetic regulation. Nucleic Acids Res. 2021, 49, 4350–4370. [Google Scholar] [CrossRef]
- McQuin, C.; Goodman, A.; Chernyshev, V.; Kamentsky, L.; Cimini, B.A.; Karhohs, K.W.; Doan, M.; Ding, L.; Rafelski, S.M.; Thirstrup, D.; et al. CellProfiler 3.0: Next-generation image processing for biology. PLoS Biol. 2018, 16, e2005970. [Google Scholar] [CrossRef] [Green Version]
- Broche, J.; Kungulovski, G.; Bashtrykov, P.; Rathert, P.; Jeltsch, A. Genome-wide investigation of the dynamic changes of epigenome modifications after global DNA methylation editing. Nucleic Acids Res. 2020, 49, 158–176. [Google Scholar] [CrossRef]
- Afgan, E.; Baker, D.; Batut, B.; Beek, M.V.D.; Bouvier, D.; Čech, M.; Chilton, J.; Clements, D.; Coraor, N.; Grüning, A.B.; et al. The Galaxy platform for accessible, reproducible and collaborative biomedical analyses: 2018 update. Nucleic Acids Res. 2018, 46, W537–W544. [Google Scholar] [CrossRef] [Green Version]
- Langmead, B.; Salzberg, S. Fast gapped-read alignment with Bowtie 2. Nat. Methods 2012, 9, 357–359. [Google Scholar] [CrossRef] [Green Version]
- Feng, J.; Liu, T.; Qin, B.; Zhang, Y.; Liu, X.S. Identifying ChIP-seq enrichment using MACS. Nat. Protoc. 2012, 7, 1728–1740. [Google Scholar] [CrossRef] [Green Version]
- Whyte, W.A.; Orlando, D.A.; Hnisz, D.; Abraham, B.; Lin, C.Y.; Kagey, M.H.; Rahl, P.B.; Lee, T.I.; Young, R.A. Master Transcription Factors and Mediator Establish Super-Enhancers at Key Cell Identity Genes. Cell 2013, 153, 307–319. [Google Scholar] [CrossRef] [PubMed] [Green Version]
- Welch, R.P.; Lee, C.; Imbriano, P.M.; Patil, S.; Weymouth, T.E.; Smith, R.A.; Scott, L.J.; Sartor, M.A. ChIP-Enrich: Gene set enrichment testing for ChIP-seq data. Nucleic Acids Res. 2014, 42, e105. [Google Scholar] [CrossRef]
- Garrison, E.; Marth, G. Haplotype-based variant detection from short-read sequencing. arXiv 2012, arXiv:1207.3907. [Google Scholar]
- Schott, S.; Wimberger, P.; Klink, B.; Grützmann, K.; Puppe, J.; Wauer, U.S.; Klotz, D.M.; Schröck, E.; Kuhlmann, J.D. The conjugated antimetabolite 5-FdU-ECyd and its cellular and molecular effects on platinum-sensitive vs. -resistant ovarian cancer cells in vitro. Oncotarget 2017, 8, 76935–76948. [Google Scholar] [CrossRef] [PubMed]
- Calo, E.; Wysocka, J. Modification of Enhancer Chromatin: What, How, and Why? Mol. Cell 2013, 49, 825–837. [Google Scholar] [CrossRef] [PubMed] [Green Version]
- Barretina, J.; Caponigro, G.; Stransky, N.; Venkatesan, K.; Margolin, A.A.; Kim, S.; Wilson, C.J.; Lehár, J.; Kryukov, G.; Sonkin, D.; et al. The Cancer Cell Line Encyclopedia enables predictive modelling of anticancer drug sensitivity. Nat. Cell Biol. 2012, 483, 603–607. [Google Scholar] [CrossRef] [PubMed]
- Gene Ontology Consortium. The Gene Ontology (GO) database and informatics resource. Nucleic Acids Res. 2004, 32, D258–D261. [Google Scholar] [CrossRef] [Green Version]
- Fabregat, A.; Jupe, S.; Matthews, L.; Sidiropoulos, K.; Gillespie, M.; Garapati, P.; Haw, R.; Jassal, B.; Korninger, F.; May, B.; et al. The Reactome Pathway Knowledgebase. Nucleic Acids Res. 2017, 46, D649–D655. [Google Scholar] [CrossRef]
- Kanehisa, M. KEGG: Kyoto Encyclopedia of Genes and Genomes. Nucleic Acids Res. 2000, 28, 27–30. [Google Scholar] [CrossRef]
- Saldanha, S.N.; Tollefsbol, T.O. Pathway modulations and epigenetic alterations in ovarian tumorbiogenesis. J. Cell. Physiol. 2013, 229, 393–406. [Google Scholar] [CrossRef] [Green Version]
- Zhou, M.; McFarland-Mancini, M.M.; Funk, H.M.; Husseinzadeh, N.; Mounajjed, T.; Drew, A.F. Toll-like receptor expression in normal ovary and ovarian tumors. Cancer Immunol. Immunother. 2009, 58, 1375–1385. [Google Scholar] [CrossRef]
- Cole, C.; Lau, S.; Backen, A.; Clamp, A.; Rushton, G.; Dive, C.; Hodgkinson, C.; McVey, R.; Kitchener, H.; Jayson, G. Inhibition of FGFR2 and FGFR1 increases cisplatin sensitivity in ovarian cancer. Cancer Biol. Ther. 2010, 10, 495–504. [Google Scholar] [CrossRef] [Green Version]
- Fong, C.Y.; Gilan, O.; Ni Lam, E.Y.; Rubin, A.; Ftouni, S.; Tyler, D.; Stanley, K.; Sinha, D.; Yeh, P.; Morison, J.; et al. BET inhibitor resistance emerges from leukaemia stem cells. Nat. Cell Biol. 2015, 525, 538–542. [Google Scholar] [CrossRef]
- Moore, J.; Pratt, H.; Purcaro, M.; Weng, Z. A curated benchmark of enhancer-gene interactions for evaluating enhancer-target gene prediction methods. Genome Biol. 2020, 21, 1–16. [Google Scholar] [CrossRef] [Green Version]
- Hamdan, F.; Johnsen, S.A. Super enhancers—New analyses and perspectives on the low hanging fruit. Transcription 2017, 9, 123–130. [Google Scholar] [CrossRef]
- Hariprakash, J.M.; Ferrari, F. Computational Biology Solutions to Identify Enhancers-target Gene Pairs. Comput. Struct. Biotechnol. J. 2019, 17, 821–831. [Google Scholar] [CrossRef]
- Wen, W.; Liang, W.; Wu, J.; Kowolik, C.M.; Buettner, R.; Scuto, A.; Hsieh, M.-Y.; Hong, H.; Brown, C.; Forman, S.J.; et al. Targeting JAK1/STAT3 Signaling Suppresses Tumor Progression and Metastasis in a Peritoneal Model of Human Ovarian Cancer. Mol. Cancer Ther. 2014, 13, 3037–3048. [Google Scholar] [CrossRef] [Green Version]
- Ornitz, D.M.; Itoh, N. The Fibroblast Growth Factor signaling pathway. Wiley Interdiscip. Rev. Dev. Biol. 2015, 4, 215–266. [Google Scholar] [CrossRef] [Green Version]
- McKenzie, L.D.; LeClair, J.W.; Miller, K.N.; Strong, A.D.; Chan, H.L.; Oates, E.L.; Ligon, K.L.; Brennan, C.W.; Chheda, M.G. CHD4 regulates the DNA damage response and RAD51 expression in glioblastoma. Sci. Rep. 2019, 9, 4444. [Google Scholar] [CrossRef]
- Qi, W.; Chen, H.; Xiao, T.; Wang, R.; Li, T.; Han, L.; Zeng, X. Acetyltransferase p300 collaborates with chromodomain helicase DNA-binding protein 4 (CHD4) to facilitate DNA double-strand break repair. Mutagenesis 2015, 31, 193–203. [Google Scholar] [CrossRef] [Green Version]
- Pan, M.-R.; Hsieh, H.-J.; Dai, H.; Hung, W.-C.; Li, K.; Peng, G.; Lin, S.-Y. Chromodomain Helicase DNA-binding Protein 4 (CHD4) Regulates Homologous Recombination DNA Repair, and Its Deficiency Sensitizes Cells to Poly(ADP-ribose) Polymerase (PARP) Inhibitor Treatment. J. Biol. Chem. 2012, 287, 6764–6772. [Google Scholar] [CrossRef] [Green Version]
- Spruijt, C.; Luijsterburg, M.S.; Menafra, R.; Lindeboom, R.; Jansen, P.W.; Edupuganti, R.R.; Baltissen, M.P.; Wiegant, W.W.; Voelker-Albert, M.C.; Matarese, F.; et al. ZMYND8 Co-localizes with NuRD on Target Genes and Regulates Poly(ADP-Ribose)-Dependent Recruitment of GATAD2A/NuRD to Sites of DNA Damage. Cell Rep. 2016, 17, 783–798. [Google Scholar] [CrossRef] [Green Version]
- Hoffmann, A.; Spengler, D. Chromatin Remodeling Complex NuRD in Neurodevelopment and Neurodevelopmental Disorders. Front. Genet. 2019, 10, 682. [Google Scholar] [CrossRef] [Green Version]
- Shimbo, T.; Du, Y.; Grimm, S.A.; Dhasarathy, A.; Mav, D.; Shah, R.R.; Shi, H.; Wade, P.A. MBD3 Localizes at Promoters, Gene Bodies and Enhancers of Active Genes. PLoS Genet. 2013, 9, e1004028. [Google Scholar] [CrossRef] [PubMed] [Green Version]
- Goodman, J.V.; Yamada, T.; Yang, Y.; Kong, L.; Wu, D.Y.; Zhao, G.; Gabel, H.W.; Bonni, A. The chromatin remodeling enzyme Chd4 regulates genome architecture in the mouse brain. Nat. Commun. 2020, 11, 1–14. [Google Scholar] [CrossRef] [PubMed]
- Grumolato, L.; Aaronson, S.A. Aberrant signaling pathways in cancer. Holland-Frei Cancer Med. [CrossRef]
- Wehde, B.L.; Rädler, P.D.; Shrestha, H.; Johnson, S.J.; Triplett, A.A.; Wagner, K.-U. Janus Kinase 1 Plays a Critical Role in Mammary Cancer Progression. Cell Rep. 2018, 25, 2192–2207.e5. [Google Scholar] [CrossRef] [PubMed] [Green Version]
- Carmeliet, P. VEGF as a Key Mediator of Angiogenesis in Cancer. Oncology 2005, 69, 4–10. [Google Scholar] [CrossRef]
- Voulgari, A.; Pintzas, A. Epithelial–mesenchymal transition in cancer metastasis: Mechanisms, markers and strategies to overcome drug resistance in the clinic. Biochim. Biophys. Acta (BBA) Bioenerg. 2009, 1796, 75–90. [Google Scholar] [CrossRef]
- Gonzalez, H.; Hagerling, C.; Werb, Z. Roles of the immune system in cancer: From tumor initiation to metastatic progression. Genes Dev. 2018, 32, 1267–1284. [Google Scholar] [CrossRef] [Green Version]
- Feitelson, M.A.; Arzumanyan, A.; Kulathinal, R.J.; Blain, S.W.; Holcombe, R.F.; Mahajna, J.; Marino, M.; Chantar, M.L.M.; Nawroth, R.; Sanchez-Garcia, I.; et al. Sustained proliferation in cancer: Mechanisms and novel therapeutic targets. Semin. Cancer Biol. 2015, 35, S25–S54. [Google Scholar] [CrossRef]
- Alhmoud, J.F.; Woolley, J.F.; Al Moustafa, A.-E.; Malki, M.I.; Alhmoud, J.F. DNA Damage/Repair Management in Cancers. Cancers 2020, 12, 1050. [Google Scholar] [CrossRef]
- Marine, J.-C.; Dawson, S.-J.; Dawson, M.A. Non-genetic mechanisms of therapeutic resistance in cancer. Nat. Rev. Cancer 2020, 20, 743–756. [Google Scholar] [CrossRef]
- Gusev, A.; Lee, S.H.; Trynka, G.; Finucane, H.; Vilhjalmsson, B.; Xu, H.; Zang, C.; Ripke, S.; Bulik-Sullivan, B.; Stahl, E.; et al. Partitioning Heritability of Regulatory and Cell-Type-Specific Variants across 11 Common Diseases. Am. J. Hum. Genet. 2014, 95, 535–552. [Google Scholar] [CrossRef] [Green Version]
- Corradin, O.; Scacheri, P.C. Enhancer variants: Evaluating functions in common disease. Genome Med. 2014, 6, 85. [Google Scholar] [CrossRef]
- Klein, I.A.; Boija, A.; Afeyan, L.K.; Hawken, S.W.; Fan, M.; Dall’Agnese, A.; Oksuz, O.; Henninger, J.E.; Shrinivas, K.; Sabari, B.R.; et al. Partitioning of cancer therapeutics in nuclear condensates. Science 2020, 368, 1386–1392. [Google Scholar] [CrossRef]
- Qureshy, Z.; Johnson, D.E.; Grandis, J.R. Targeting the JAK/STAT pathway in solid tumors. J. Cancer Metastasis Treat. 2020, 2020. [Google Scholar] [CrossRef]
- Jin, W. Role of JAK/STAT3 Signaling in the Regulation of Metastasis, the Transition of Cancer Stem Cells, and Chemoresistance of Cancer by Epithelial-Mesenchymal Transition. Cells 2020, 9, 217. [Google Scholar] [CrossRef] [Green Version]
- Herrera, S.; Bach, E.A. JAK/STAT signaling in stem cells and regeneration: From Drosophila to vertebrates. Development 2019, 146, dev167643. [Google Scholar] [CrossRef] [Green Version]
- Velde, R.V.; Yoon, N.; Marusyk, V.; Durmaz, A.; Dhawan, A.; Miroshnychenko, D.; Lozano-Peral, D.; Desai, B.; Balynska, O.; Poleszhuk, J.; et al. Resistance to targeted therapies as a multifactorial, gradual adaptation to inhibitor specific selective pressures. Nat. Commun. 2020, 11, 1–13. [Google Scholar] [CrossRef]
- Iniguez, A.B.; Alexe, G.; Wang, E.J.; Roti, G.; Patel, S.; Chen, L.; Kitara, S.; Conway, A.; Robichaud, A.L.; Stolte, B.; et al. Resistance to Epigenetic-Targeted Therapy Engenders Tumor Cell Vulnerabilities Associated with Enhancer Remodeling. Cancer Cell 2018, 34, 922–938.e7. [Google Scholar] [CrossRef] [Green Version]
- Hinohara, K.; Wu, H.-J.; Vigneau, S.; McDonald, T.O.; Igarashi, K.J.; Yamamoto, K.N.; Madsen, T.; Fassl, A.; Egri, S.B.; Papanastasiou, M.; et al. KDM5 Histone Demethylase Activity Links Cellular Transcriptomic Heterogeneity to Therapeutic Resistance. Cancer Cell 2018, 34, 939–953.e9. [Google Scholar] [CrossRef] [Green Version]
- Liau, B.B.; Sievers, C.; Donohue, L.K.; Gillespie, S.; Flavahan, W.A.; Miller, E.T.; Venteicher, A.; Hebert, C.H.; Carey, C.D.; Rodig, S.J.; et al. Adaptive Chromatin Remodeling Drives Glioblastoma Stem Cell Plasticity and Drug Tolerance. Cell Stem Cell 2017, 20, 233–246.e7. [Google Scholar] [CrossRef] [Green Version]
- Zawistowski, J.S.; Bevill, S.M.; Goulet, D.R.; Stuhlmiller, T.J.; Beltran, A.S.; Olivares-Quintero, J.F.; Singh, D.; Sciaky, N.; Parker, J.S.; Rashid, N.U.; et al. Enhancer Remodeling during Adaptive Bypass to MEK Inhibition Is Attenuated by Pharmacologic Targeting of the P-TEFb Complex. Cancer Discov. 2017, 7, 302–321. [Google Scholar] [CrossRef] [Green Version]
- Bell, C.C.; Fennell, K.A.; Chan, Y.-C.; Rambow, F.; Yeung, M.M.; Vassiliadis, D.; Lara, L.; Yeh, P.; Martelotto, L.G.; Rogiers, A.; et al. Targeting enhancer switching overcomes non-genetic drug resistance in acute myeloid leukaemia. Nat. Commun. 2019, 10, 1–15. [Google Scholar] [CrossRef] [PubMed] [Green Version]
- Lavarone, E.; Barbieri, C.M.; Pasini, D. Dissecting the role of H3K27 acetylation and methylation in PRC2 mediated control of cellular identity. Nat. Commun. 2019, 10, 1–16. [Google Scholar] [CrossRef] [PubMed]
- Yan, J.; Li, B.; Lin, B.; Lee, P.T.; Chung, T.-H.; Tan, J.; Bi, C.; Lee, X.T.; Selvarajan, V.; Ng, S.-B.; et al. EZH2 phosphorylation by JAK3 mediates a switch to noncanonical function in natural killer/T-cell lymphoma. Blood 2016, 128, 948–958. [Google Scholar] [CrossRef] [PubMed] [Green Version]
- Kaji, K.; Caballero, I.M.; MacLeod, R.; Nichols, J.; Wilson, V.A.; Hendrich, B. The NuRD component Mbd3 is required for pluripotency of embryonic stem cells. Nat. Cell Biol. 2006, 8, 285–292. [Google Scholar] [CrossRef] [PubMed]
- Bandolik, J.J.; Hamacher, A.; Schrenk, C.; Weishaupt, R.; Kassack, M.U. Class I-Histone Deacetylase (HDAC) Inhibition is Superior to pan-HDAC Inhibition in Modulating Cisplatin Potency in High Grade Serous Ovarian Cancer Cell Lines. Int. J. Mol. Sci. 2019, 20, 3052. [Google Scholar] [CrossRef] [PubMed] [Green Version]
- Soldi, R.; Halder, T.G.; Weston, A.; Thode, T.; Drenner, K.; Lewis, R.; Kaadige, M.R.; Srivastava, S.; Ampanattu, S.D.; Del Villar, R.R.; et al. The novel reversible LSD1 inhibitor SP-2577 promotes anti-tumor immunity in SWItch/Sucrose-NonFermentable (SWI/SNF) complex mutated ovarian cancer. PLoS ONE 2020, 15, e0235705. [Google Scholar] [CrossRef] [PubMed]
- Janyst, K.; Janyst, M.; Siernicka, M.; Lasek, W. Synergistic antitumor effects of histone deacetylase inhibitor scriptaid and bortezomib against ovarian cancer cells. Oncol. Rep. 2018. [Google Scholar] [CrossRef] [Green Version]
- Shao, G.; Wang, J.; Li, Y.; Liu, X.; Xie, X.; Wan, X.; Yan, M.; Jin, J.; Lin, Q.; Zhu, H.; et al. Lysine-specific demethylase 1 mediates epidermal growth factor signaling to promote cell migration in ovarian cancer cells. Sci. Rep. 2015, 5, 15344. [Google Scholar] [CrossRef] [Green Version]
- Oyama, Y.; Shigeta, S.; Tokunaga, H.; Tsuji, K.; Ishibashi, M.; Shibuya, Y.; Shimada, M.; Yasuda, J.; Yaegashi, N. CHD4 regulates platinum sensitivity through MDR1 expression in ovarian cancer: A potential role of CHD4 inhibition as a combination therapy with platinum agents. PLoS ONE 2021, 16, e0251079. [Google Scholar] [CrossRef]
- Shao, G.; Wan, X.; Lai, W.; Wu, C.; Jin, J.; Liu, X.; Wei, Y.; Lin, Q.; Zhang, L.; Shao, Q. Inhibition of lysine-specific demethylase 1 prevents proliferation and mediates cisplatin sensitivity in ovarian cancer cells. Oncol. Lett. 2018, 15, 9025–9032. [Google Scholar] [CrossRef] [Green Version]
- Bagratuni, T.; Mavrianou, N.; Gavalas, N.G.; Tzannis, K.; Arapinis, C.; Liontos, M.; Christodoulou, M.I.; Thomakos, N.; Haidopoulos, D.; Rodolakis, A.; et al. JQ1 inhibits tumour growth in combination with cisplatin and suppresses JAK/STAT signalling pathway in ovarian cancer. Eur. J. Cancer 2020, 126, 125–135. [Google Scholar] [CrossRef]
- Smeenk, G.; Wiegant, W.W.; Vrolijk, H.; Solari, A.; Pastink, A.; Van Attikum, H. The NuRD chromatin–remodeling complex regulates signaling and repair of DNA damage. J. Cell Biol. 2010, 190, 741–749. [Google Scholar] [CrossRef]
- Polo, S.; Kaidi, A.; Baskcomb, L.; Galanty, Y.; Jackson, S.P. Regulation of DNA-damage responses and cell-cycle progression by the chromatin remodelling factor CHD4. EMBO J. 2010, 29, 3130–3139. [Google Scholar] [CrossRef] [Green Version]
- Luo, J.; Su, F.; Chen, D.; Shiloh, A.; Gu, W. Deacetylation of p53 modulates its effect on cell growth and apoptosis. Nat. Cell Biol. 2000, 408, 377–381. [Google Scholar] [CrossRef]
- Younger, S.T.; Rinn, J.L. p53 regulates enhancer accessibility and activity in response to DNA damage. Nucleic Acids Res. 2017, 45, 9889–9900. [Google Scholar] [CrossRef]
- Uzunbas, G.K.; Ahmed, F.; Sammons, M.A. Control of p53-dependent transcription and enhancer activity by the p53 family member p63. J. Biol. Chem. 2019, 294, 10720–10736. [Google Scholar] [CrossRef]
- Gong, F.; Chiu, L.-Y.; Cox, B.; Aymard, F.; Clouaire, T.; Leung, W.C.; Cammarata, M.; Perez, M.; Agarwal, P.; Brodbelt, J.S.; et al. Screen identifies bromodomain protein ZMYND8 in chromatin recognition of transcription-associated DNA damage that promotes homologous recombination. Genes Dev. 2015, 29, 197–211. [Google Scholar] [CrossRef] [Green Version]
- Hazan, I.; Monin, J.; Bouwman, B.A.; Crosetto, N.; Aqeilan, R.I. Activation of Oncogenic Super-Enhancers Is Coupled with DNA Repair by RAD51. Cell Rep. 2019, 29, 560–572.e4. [Google Scholar] [CrossRef] [Green Version]
- Yao, J.; Chen, J.; Li, L.-Y.; Wu, M. Epigenetic plasticity of enhancers in cancer. Transcription 2020, 11, 26–36. [Google Scholar] [CrossRef]
- Canela, A.; Maman, Y.; Jung, S.; Wong, N.; Callen, E.; Day, A.; Kieffer-Kwon, K.-R.; Pekowska, A.; Zhang, H.; Rao, S.S.; et al. Genome Organization Drives Chromosome Fragility. Cell 2017, 170, 507–521.e18. [Google Scholar] [CrossRef] [Green Version]
- Ju, B.-G.; Lunyak, V.; Perissi, V.; Garcia-Bassets, I.; Rose, D.W.; Glass, C.K.; Rosenfeld, M.G. A Topoisomerase II-Mediated dsDNA Break Required for Regulated Transcription. Science 2006, 312, 1798–1802. [Google Scholar] [CrossRef]
- Madabhushi, R.; Gao, F.; Pfenning, A.R.; Pan, L.; Yamakawa, S.; Seo, J.; Rueda, R.; Phan, T.X.; Yamakawa, H.; Pao, P.-C.; et al. Activity-Induced DNA Breaks Govern the Expression of Neuronal Early-Response Genes. Cell 2015, 161, 1592–1605. [Google Scholar] [CrossRef] [Green Version]
- Wei, P.-C.; Chang, A.N.; Kao, J.; Du, Z.; Meyers, R.M.; Alt, F.W.; Schwer, B. Long Neural Genes Harbor Recurrent DNA Break Clusters in Neural Stem/Progenitor Cells. Cell 2016, 164, 644–655. [Google Scholar] [CrossRef] [Green Version]


Publisher’s Note: MDPI stays neutral with regard to jurisdictional claims in published maps and institutional affiliations. |
© 2021 by the authors. Licensee MDPI, Basel, Switzerland. This article is an open access article distributed under the terms and conditions of the Creative Commons Attribution (CC BY) license (https://creativecommons.org/licenses/by/4.0/).
Share and Cite
Bauer, T.L.; Collmar, K.; Kaltofen, T.; Loeffler, A.-K.; Decker, L.; Mueller, J.; Pinter, S.; Eisler, S.A.; Mahner, S.; Fraungruber, P.; et al. Functional Analysis of Non-Genetic Resistance to Platinum in Epithelial Ovarian Cancer Reveals a Role for the MBD3-NuRD Complex in Resistance Development. Cancers 2021, 13, 3801. https://0-doi-org.brum.beds.ac.uk/10.3390/cancers13153801
Bauer TL, Collmar K, Kaltofen T, Loeffler A-K, Decker L, Mueller J, Pinter S, Eisler SA, Mahner S, Fraungruber P, et al. Functional Analysis of Non-Genetic Resistance to Platinum in Epithelial Ovarian Cancer Reveals a Role for the MBD3-NuRD Complex in Resistance Development. Cancers. 2021; 13(15):3801. https://0-doi-org.brum.beds.ac.uk/10.3390/cancers13153801
Chicago/Turabian StyleBauer, Tabea L., Katrin Collmar, Till Kaltofen, Ann-Katrin Loeffler, Lorena Decker, Jan Mueller, Sabine Pinter, Stephan A. Eisler, Sven Mahner, Patricia Fraungruber, and et al. 2021. "Functional Analysis of Non-Genetic Resistance to Platinum in Epithelial Ovarian Cancer Reveals a Role for the MBD3-NuRD Complex in Resistance Development" Cancers 13, no. 15: 3801. https://0-doi-org.brum.beds.ac.uk/10.3390/cancers13153801