Article

Neuronal Differentiation-Related Epigenetic Regulator ZRF1 Has Independent Prognostic Value in Neuroblastoma but Is Functionally Dispensable In Vitro

1
Group of Translational Research in Child and Adolescent Cancer, Vall d’Hebron Research Institute (VHIR), Universitat Autònoma de Barcelona (UAB), 08035 Barcelona, Spain
2
Molecular Mechanisms and Experimental Therapy in Oncology-Oncobell Program, Bellvitge Biomedical Research Institute (IDIBELL), 08908 L’Hospitalet de Llobregat, Spain
3
Centro de Investigación Biomédica en Red de Cáncer (CIBERONC), Instituto de Salud Carlos III, 28029 Madrid, Spain
4
Pathology Department, Vall d’Hebron University Hospital—UAB, 08035 Barcelona, Spain
5
Surgery Department, Vall d’Hebron University Hospital—UAB, 08035 Barcelona, Spain
6
Pediatric Oncology and Hematology Department, Vall d’Hebron University Hospital—UAB, 08035 Barcelona, Spain
7
Catalan Institute of Oncology (ICO), 08908 L’Hospitalet de Llobregat, Spain
*
Author to whom correspondence should be addressed.
Submission received: 26 August 2021 / Revised: 17 September 2021 / Accepted: 25 September 2021 / Published: 28 September 2021
(This article belongs to the Special Issue Epigenetic Regulation in Human Cancers)

Abstract

:

Simple Summary

Neuroblastoma is the most common pediatric solid tumor occurring outside the brain, and it is thought to arise from cells that acquire errors during the normal process of embryonal development. Today, we know that embryonal development is regulated by epigenetics, a mechanism that determines which genes need to be expressed in each cell type and developmental step. Epigenetic errors, therefore, are considered contributory to the appearance and progression of tumors such as neuroblastoma. Here, we aimed at finding whether ZRF1, a known epigenetic regulator, could play a significant role in the aggressiveness of neuroblastoma. Our results suggest that ZRF1 does not seem to have any relevant function in neuroblastoma cells; however, the levels of this epigenetic regulator are related to the prognostic of neuroblastoma patients and could be used to predict their progression and improve the diagnosis.

Abstract

Neuroblastoma is a pediatric tumor of the peripheral nervous system that accounts for up to ~15% of all cancer-related deaths in children. Recently, it has become evident that epigenetic deregulation is a relevant event in pediatric tumors such as high-risk neuroblastomas, and a determinant for processes, such as cell differentiation blockade and sustained proliferation, which promote tumor progression and resistance to current therapies. Thus, a better understanding of epigenetic factors implicated in the aggressive behavior of neuroblastoma cells is crucial for the development of better treatments. In this study, we characterized the role of ZRF1, an epigenetic activator recruited to genes involved in the maintenance of the identity of neural progenitors. We combined analysis of patient sample expression datasets with loss- and gain-of-function studies on neuroblastoma cell lines. Functional analyses revealed that ZRF1 is functionally dispensable for those cellular functions related to cell differentiation, proliferation, migration, and invasion, and does not affect the cellular response to chemotherapeutic agents. However, we found that high levels of ZRF1 mRNA expression are associated to shorter overall survival of neuroblastoma patients, even when those patients with the most common molecular alterations used as prognostic factors are removed from the analyses, thereby suggesting that ZRF1 expression could be used as an independent prognostic factor in neuroblastoma.

1. Introduction

Neuroblastoma, a pediatric cancer of the peripheral nervous system, is one of the most common embryonal tumors outside the brain [1]. It is thought to arise from tissues of the sympathoadrenergic system at early stages of embryonic development, specifically from neural crest progenitors that fail to differentiate during dorsolateral migration [2]. From a histopathological perspective, neuroblastoma can be classified based on the grade of morphological differentiation into distinct categories, namely neuroblastoma, ganglioneuroblastoma, and ganglioneuroma, from less to more differentiated tumors. The last two categories are considered to be benign forms of neuroblastoma [3]. The pathological category can be further classified according to the degree of cellular differentiation. For example, neuroblastoma can be further classified into undifferentiated, poorly differentiated, and differentiating tumors (reviewed in [4]). The degree of differentiation is part of routine prognostic risk assessment. In fact, high-risk neuroblastomas, which represent up to ~60% of all diagnosed neuroblastomas, are usually undifferentiated or poorly differentiated tumors that present very aggressive behavior and have a five-year overall survival rate below 40% [5]. Pro-differentiation therapies (i.e., with retinoic acid derivatives) are part of the standard of care in neuroblastoma, although they are restricted to the treatment of neuroblastoma minimal residual disease [6]. However, not all patients respond to this treatment. Therefore, a better understanding of the molecular mechanisms that maintain these types of tumors in an undifferentiated state may reveal new opportunities for therapeutic intervention.
Epigenetic regulation (e.g., DNA methylation, histone post-translational modifications, non-coding RNA expression, etc.) is one of the mechanisms that controls the differentiation of neuroblasts (i.e., neuroblastoma precursors). The disruption of the homeostatic epigenetic balance contributes to the developmental arrest of sympathetic progenitors, thereby contributing to neuroblastoma oncogenesis [7]. One of the genes that is determinant in the maintenance of neuronal progenitor identity is zuotin-related factor 1 (ZRF1; also known as MPP11), which is encoded by the DNAJC2 gene [8,9]. ZRF1 belongs to the M-phase phosphoprotein (MPP) family and was first discovered as a chaperone in the cytosol [10,11,12]. However, later evidence has shown that it also acts as a chromatin regulator in the nucleus, where it is recruited to ubiquitinated histone H2A at ‘Lys-119’ (H2AK119ub), displacing the polycomb repressor complex 1 (PRC1) from chromatin and facilitating the transcription of neural progenitor-associated genes [13].
In addition to its physiological role in the maintenance of the pluripotency of neural progenitor cells, ZRF1 has already been functionally implicated in cancer. ZRF1 was shown to be oncogenic in solid tumors such as breast [14] and gastric [15] cancers. Furthermore, ZRF1 was shown to be overexpressed in acute myeloid leukemia (AML) acting as a negative regulator of differentiation. In the same study, Demajo and collaborators showed that ZRF1 depletion cooperated with differentiating agents (i.e., retinoic acid) to suppress leukemia in vivo [16].
Thus, owing to the role of ZRF1 of maintaining the undifferentiated state of neural progenitor cells and its functional relevance in the differentiation of some tumors, we sought to determine whether ZRF1 plays a major role in neuroblastoma. Here, we found that the expression of ZRF1 mRNA is increased in advanced disease stages and in tumors, with the most common genetic alterations associated with poor prognosis in neuroblastoma, such as MYCN amplification, gain of chromosome 17q, and loss of 1p36. Moreover, the ZRF1 mRNA level was clearly associated with poor neuroblastoma survival in the absence of other poor-prognosis molecular alterations. However, our gain- and loss-of-function experiments suggest that ZRF1 is neither sufficient nor necessary to sustain the oncogenic properties of neuroblastoma cells, such as cell differentiation, proliferation, or migration. Our results validate ZRF1 as a potential prognostic marker, but discard it as a target for differentiation therapy.

2. Materials and Methods

2.1. Analysis of Neuroblastoma Gene Expression Datasets

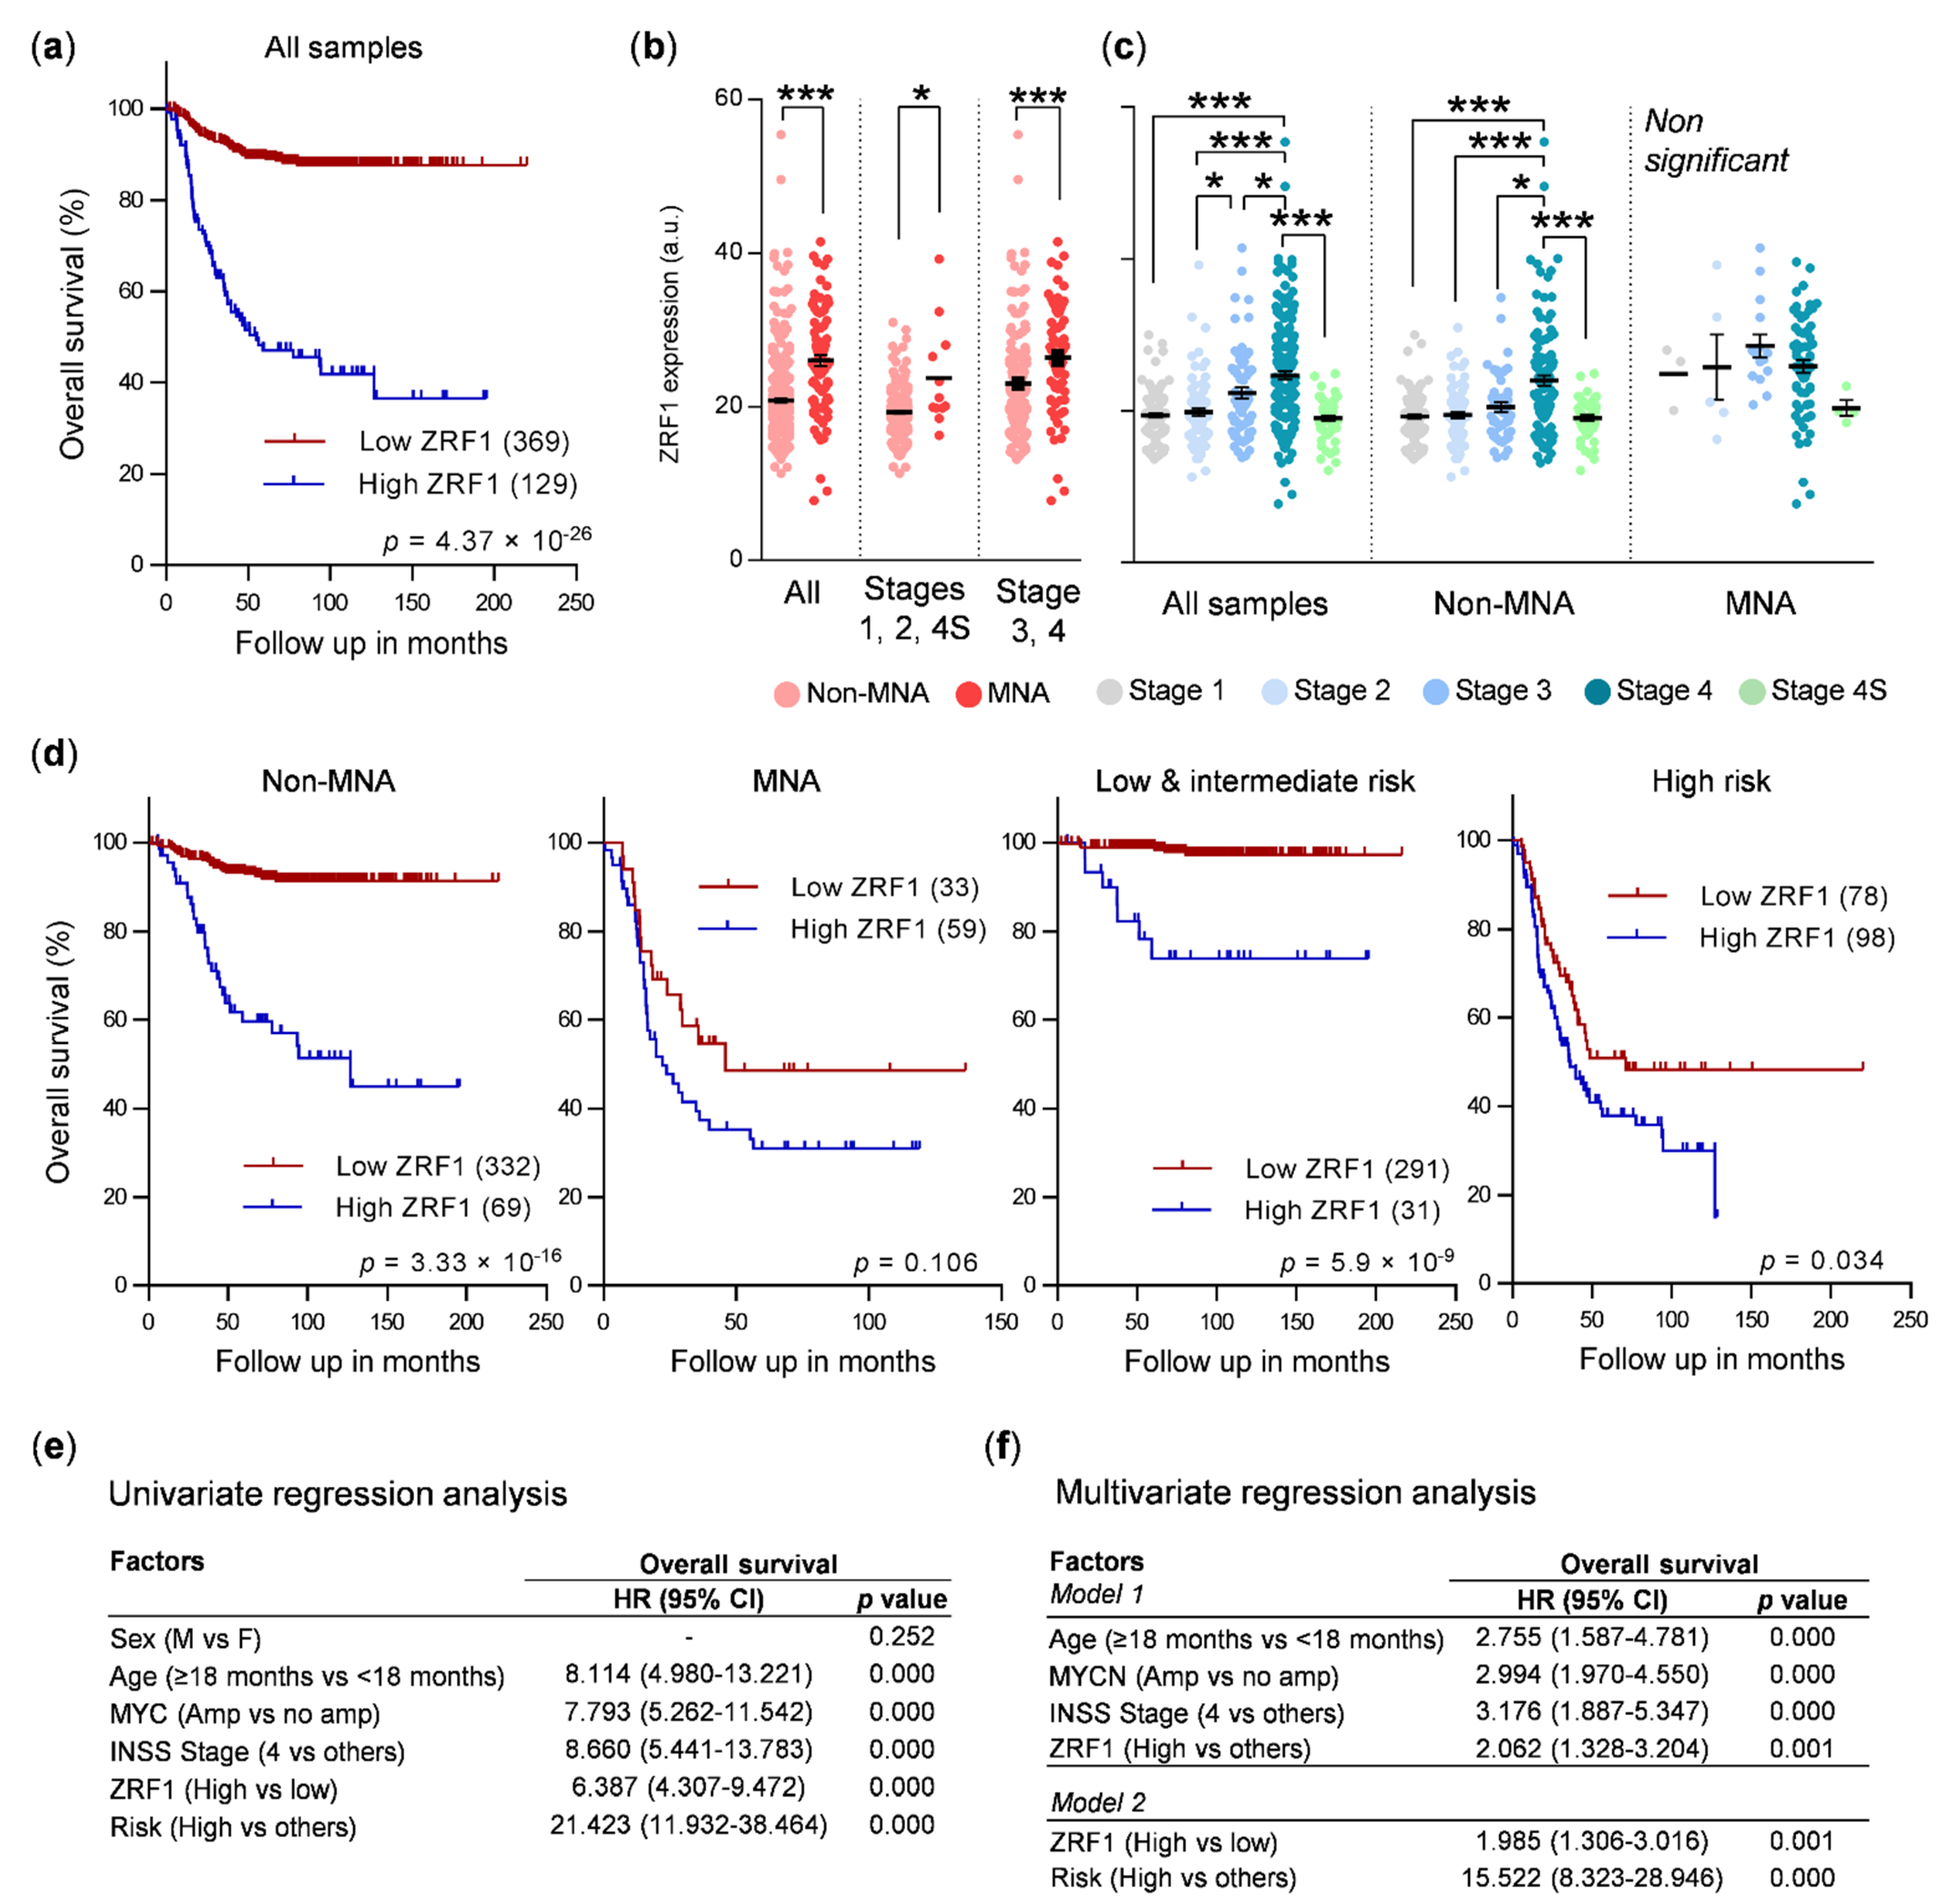
ZRF1 mRNA expression levels were analyzed from neuroblastoma patient data from the GSE62564, GSE45547 and GSE3960 publicly available datasets. The GSE62564 dataset was used to construct receiver operating characteristic (ROC) curves to determine the prognostic value of ZRF1 expression. The optimal cutoff value was defined according to the Youden index. Overall survival (OS) and the cumulative survival rate were estimated using the Kaplan–Meier method, and the log-rank test was performed to assess differences between groups. Univariate and multivariate Cox proportional hazard regression analyses were used to assess the prognostic significance of ZRF1 on OS. These statistical analyses were performed using the IBM SPSS 21 software. For GSE45547 and GSE3960 datasets, gene expression data was extracted and Kaplan–Meier survival plots were generated using the R2 Genomics Analysis and Visualization Platform (http://r2.amc.nl; accessed date: 21 January 2021). ZRF1 mRNA expression levels between different patient groups were analyzed using GraphPad Prism Software (La Jolla, CA, USA), and statistical significance was assessed by Kruskal–Wallis test as a non-parametric ANOVA, and Dunn’s test for multiple comparisons.

2.2. Cell Lines

Neuroblastoma cell lines (SK-N-AS, SH-SY5Y, and IMR-32) and embryonic kidney cells (HEK293T) were purchased from American Type Culture Collection (ATCC, Manassas, VA, USA), the CHLA-90 cell line was purchased from the Children’s Oncology Group Cell Culture and Xenograft Repository (Lubbock, TX, USA), and SK-N-BE(2), and LA1-5s were procured from the Public Health England Culture Collection (Salisbury, UK). Neuroblastoma cells were cultured and maintained in Iscove’s modified Dulbecco’s medium (Life Technologies, Waltham, MA, USA), supplemented with 20% heat-inactivated fetal bovine serum (South America Premium, Biowest, Nuaillé, France) and 1% insulin-transferrin-selenium supplement (Life Technologies). HEK293T cells were grown in Dulbecco’s modified Eagle’s medium (Life Technologies), supplemented with 10% heat-inactivated fetal bovine serum. Media were supplemented with 100 U/mL penicillin, 100 μg/mL streptomycin (Life Technologies), and 5 μg/mL plasmocin (InvivoGen, San Diego, CA, USA). Cultures were maintained at 37 °C in a 5% CO2 saturated atmosphere, and periodically tested for mycoplasma contamination.

2.3. Western Blot Analysis

Cells were lysed in RIPA buffer (Thermo Fisher Scientific, Waltham, MA, USA), supplemented with EDTA-free protease inhibitor cocktail (Roche, Basel, Switzerland). Cell lysates were quantified using a DC protein assay (Bio-Rad, Hercules, CA, USA) and 30 μg of protein was resolved on a 4–12% Tris-glycine sodium dodecyl sulfate polyacrylamide electrophoresis gel (Invitrogen, Carlsbad, CA, USA), then transferred onto polyvinylidene difluoride (PVDF) membranes. Membranes were blocked for 1 h with 5% non-fat milk or 5% bovine serum albumin (BSA) in Tris-buffered saline with 0.1% Tween and probed with primary antibodies overnight at 4 °C. Membranes were incubated with secondary antibodies for 1 h before developing with a chemiluminescent horseradish peroxidase substrate EZ-ECL Chemoluminiscence Detection Kit (Biological Industries, Kibbutz Beit-Haemek, Israel). Protein levels were quantified by densitometry using ImageJ software (National Institutes of Health, Bethesda, MD, USA). Antibodies used for Western blot are listed in Table S1. Original western blot images can be found in Figure S7.

2.4. Proliferation and Colony Formation Assays

For the proliferation experiments, transduced or transfected cells were plated at a density of 2–8 × 10⁴ cells /well in 6-well plates and allowed to grow for 7 days with a medium change on day 4. Cells were fixed with 1% glutaraldehyde and stained with 0.5% crystal violet. Stained cells were treated in 15% acetic acid, and the absorbance was read at 590 nm. For the colony formation experiments, cells were plated at a very low density (5–10 × 102 cells/well in 6-well plates) and the medium was changed every 3–4 days. The plates were fixed in glutaraldehyde and stained with crystal violet at day 10 or when colonies were visible to the naked eye. Colonies were photographed and counted using ImageJ software.

2.5. Migration and Invasion Assays

For the wound-healing assays, neuroblastoma cells were plated at a density of 3 × 10⁶ cells/well in a 6-well plate. The next day, an artificial wound was created in the confluent cell monolayer. Six predefined fields per condition were photographed under contrast phase microscopy at the indicated time points, and the wound area was measured using Image J software. The migration rate was calculated by normalizing the wound area to time 0. For the transwell invasion assays, 2 × 10⁵ cells were seeded in serum-free media in the upper chamber of 8.0 µm pore size transwells (Corning Life Sciences, Corning, NY, USA) previously coated with a barrier of rat tail collagen I (Corning). The lower chamber was filled with media supplemented with fetal bovine serum. After 16 h, remaining cells were removed from the upper chamber and the cells that migrated to the lower surface of the membrane were fixed with 4% paraformaldehyde, and stained with crystal violet. Invading cells were imaged by bright field microscopy, quantified by diluting crystals in acetic acid, and read at 590 nm.

2.6. Differentiation Assays

Neuroblastoma cells were plated at low density (1–1.2 × 10⁵ cells) in collagen-coated 60 mm plates. One day later, cells were treated with 10 µM 13-cis-retinoic acid (Selleckchem, Munich, Germany). Cells were collected at day 5 post-treatment for Western blot analysis. For RARβ gene expression analysis, RNA was extracted from cell lysates using a miRNeasy Mini Kit (Qiagen, Germantown, MA, USA) and retrotranscribed with a high-capacity cDNA reverse transcription kit (Thermo Fisher Scientific). Real-time PCR was performed with PerfeCTa SYBR Green Fastmix (Quantabio, Beverly, MA, USA) using L27 as the internal standard. Primers are listed in Table S2. Relative quantification of gene expression was calculated using the 2−DDCt method [17]. For neurite length analyses, 1× 10⁴ cells per well were seeded in collagen-coated glass covers in 24-well plates and treated with retinoic acid for 5 days before fixation with 4% paraformaldehyde. Cells were stained with phalloidin-iFluor 594 (Abcam, Cambridge, UK), following manufacturer’s instructions, and DAPI 10 µ/mL (Invitrogen). Slides were visualized with a FV1000 confocal microscope (Olympus, Shinjuku, Tokyo, Japan). Ten fields were acquired for each biological replicate and processed using ImageJ software. Actin prolongations longer than twice the length of the nucleus (~30 µm) were considered as neurites.

2.7. Vectors and Lentiviral Infection

pEV-ZRF1, pCAG-ZRF1, and pLKO with different shZRF1 vectors were kindly provided by Luciano DiCroce. Lentiviruses were generated in HEK293T cells using previously described methods [18,19]. Silent mutations were introduced into the ZRF1 overexpression vector using three sequential site-directed mutagenesis reactions in pCAG-ZRF1, using the QuikChange II XL Site-Directed Mutagenesis Kit (Agilent, Santa Clara, CA, USA) and checked by Sanger sequencing. Primers used for site-directed mutagenesis and sequencing are listed in Table S2, and the shRNA target sequences are listed in Table S3. After mutagenesis, the ZRF1 sequence was excised from the pCAG by XhoI digestion and ligated into the FG12 lentiviral overexpression vector.

2.8. ZRF1 Overexpression Experiments

Neuroblastoma cells plated at a density of 5 × 10⁵ cells in 60 mm plates were transduced with viral supernatant. pEV-transduced cells were selected by separating green fluorescence protein (GFP)-positive cells by fluorescence-assisted cell sorting (FACSAria, BD Biosciences, San Jose, CA, USA) at the Flow Cytometry facility of VHIR.

2.9. ZRF1 Knockdown Experiments

For shRNA transduction, 2–8 × 10⁵ cells were plated in 60 mm plates with viral supernatant containing either pLKO-non-silencing control (NSC) or shZRF #1, #2, or #3. After 16 h, the supernatant was replaced with fresh medium, and 24 h later, transduced cells were selected by puromycin resistance (1 µg/mL). Three days after transduction, the cells were detached and used for proliferation experiments. For siRNA knockdown, a set of four pre-designed ON-TARGETplus siRNAs against ZRF1 were purchased from Dharmacon (Lafayette, CO, USA). The siRNA target sequences are listed in Table S3. Neuroblastoma cell lines at a concentration of 1.67 × 10⁵ cells/mL were transfected with siRNA at 25 nM using Lipofectamine 2000 (Life Technologies) following the manufacturer’s instructions. After incubation for 16 h, the medium was replaced.

3. Results

3.1. ZRF1 Is an Independent Prognostic Factor in Neuroblastoma

To determine whether ZRF1 is involved in the biology of neuroblastoma, we analyzed publicly available mRNA expression datasets to search for correlations between ZRF1 mRNA levels and different clinicopathological parameters of neuroblastoma patients. A receiver operating characteristic (ROC) curve analysis of a cohort of 498 patients was performed in order to assess a ZRF1 cut-off value (Youden index) that maximized the capacity for overall survival prediction (Table S4). Using this cut-off, patients with higher ZRF1 levels showed a reduction in overall survival when compared to patients with low ZRF1 levels (Figure 1a). ZRF1 was found to be upregulated in MYCN-amplified (MNA) patients, even when patients were split into early (1, 2, 4S) or advanced (3, 4) stages (Figure 1b). ZRF1 levels were also found to be increased in advanced stages of the disease, and this upregulation was maintained even when MNA tumors were excluded (Figure 1c).
To verify whether the expression of ZRF1 has prognostic value independent of MYCN amplification or disease stage (both factors intrinsically associated with poor survival), correlation analyses were performed excluding the MNA samples and in the different stages. The results showed that the association between ZRF1 mRNA expression and poor survival remained in non-MNA and low stage tumors (Figure 1d). These findings were validated by contingency analyses (Table S5) and confirmed with two different and independent supplementary neuroblastoma mRNA expression datasets (Figure S1). Finally, univariate and multivariate regression analyses confirmed ZRF1 to be independent prognostic factor of overall survival in neuroblastoma (Figure 1e,f).
Next, we analyzed the expression of ZRF1 mRNA in patients with the most common segmental copy alterations associated with neuroblastoma prognosis, including 1p36 loss of heterozygosity (LOH), unbalanced 11q LOH, and unbalanced 17q gain [20,21]. ZRF1 expression levels were found to be higher in patients with 1p36 loss and 17q gain (Figure 2a). A similar trend was also observed in patients with loss of 11q, although the difference was not statistically significant. Of note, the association between ZRF1 expression and poor prognosis was maintained in tumors without these alterations (Figure 2b), further supporting the expression of ZRF1 as an independent prognostic factor.
Analysis of ZRF1 protein expression by Western blot on 24 tumor frozen samples from a cohort of 22 neuroblastoma patients was performed to confirm the mRNA results (Figure S2). Two pairs of samples corresponded to the same patients at different stages of the disease: early tumor resection or biopsy, and resection of metastatic lesions, respectively (Table S6). In most of the samples, the intensity of the ZRF1 band was low or barely detectable, using SK-N-BE(2) cell line lysates as positive control. However, it is interesting to point out that the cases with higher expression of ZRF1 were those corresponding to relapsed or metastatic neuroblastoma, thus supporting the fact that high ZRF1 levels are present in the most aggressive neuroblastomas. Nevertheless, these results are preliminary and should be validated in a larger cohort of matched neuroblastoma samples.
Since most tumors contain heterogeneous cell populations, including malignant cells, immune cells, fibroblasts, and vascular cells, we proceed to confirm by immunohistochemistry that the ZRF1 signal was from tumor cells. Figure S3 shows a representative image of a neuroblastoma tumor where the stromal component of the tumor shows a weak ZRF1 immunoreactivity while tumor cells are highly positive.
In summary, ZRF1 mRNA levels are associated with poor prognosis in neuroblastoma and may be used as an independent prognostic marker in the absence of MYCN amplification and other poor prognosis-related chromosomal aberrations.

3.2. ZRF1 Is Not Sufficient to Enhance Neuroblastoma Aggressiveness

Given the role of ZRF1 in the regulation of neuronal differentiation and the observed correlations in neuroblastoma samples, we studied the functional consequences of ZRF1 overexpression in neuroblastoma cell lines. Protein expression analysis showed homogeneous levels of ZRF1 among a panel of different neuroblastoma cell lines, regardless of MYCN amplification status (Figure 3a). To explore whether increasing the levels of ZRF1 enhanced neuroblastoma aggressiveness, we transduced the SK-N-BE(2) and SK-N-AS neuroblastoma cell lines with a ZRF1 lentiviral overexpression vector (Figure 3b), and then analyzed the effects of ZRF1 on different oncogenic properties. Overexpression of ZRF1 did not enhance proliferation (Figure 3c) or ability to form colonies when cells were plated at a low density (Figure 3d). Drug sensitivity assays were performed against cisplatin, an alkylating agent, and topotecan, an inhibitor of topoisomerase-I, which are two of the neuroblastoma standard-of-care chemotherapies. However, overexpression of ZRF1 did not produce an increased resistance of neuroblastoma cells after 72 h of treatment (Figure 3e).
Owing to the lineage-conferring migratory capability of neuroblastoma cells, we next explored whether higher levels of ZRF1 alters the migration or the invasion of cells in wound-healing and transwell assays, respectively. ZRF1-transduced cells closed the wound at the same pace as empty vector-infected cells (Figure 3f). Moreover, invasion through a collagen barrier was not affected by ZRF1 overexpression in transwell assays (Figure 3g,h), thereby suggesting that ZRF1 does not modulate the ability of neuroblastoma cells to migrate or invade.
13-cis-retinoic acid (hereafter referred to as RA) is a naturally occurring differentiating and therapeutic agent for the treatment of neuroblastoma minimal residual disease [6,22]. Because ZRF1 has been previously demonstrated to be involved in maintaining neural progenitor stemness [8] and in altering retinoic acid induced differentiation [16], we analyzed the effect of modulating ZRF1 in RA-differentiated neuroblastoma cells. After 5 days of RA treatment, ZRF1 levels were found to be decreased 3–4 times in the RA-treated SH-SY5Y and SK-N-BE(2) neuroblastoma cell lines, as compared with vehicle-treated cells (Figure 4a). To evaluate the function of ZRF1 in the process of RA-mediated differentiation, neuroblastoma cell lines overexpressing ZRF1 were treated with the differentiating agent and the differentiation outcomes were analyzed. First, ZRF1 overexpression did not rescue or attenuate the decrease in proliferation induced by RA-induced differentiation (Figure 4b); secondly, ZRF1 overexpression did not alter the RA-induced upregulation of the RA receptor RAR-β(Figure 4c); finally, neither the percentage of cells with neurites (Figure 4d,e) nor the neurite length (Figure 4f) were modulated by overexpressing ZRF1.
These results indicate that sustained high levels of ZRF1 are not enough to enhance oncogenic properties in neuroblastoma cells or impair RA-mediated neuroblastoma differentiation.

3.3. ZRF1 Knockdown Does Not Impair Neuroblastoma Proliferation and Reveals Inconsistencies between Different Gene Silencing Methodologies

As ZRF1 expression was noted in all the neuroblastoma cell lines tested, loss of function experiments represented a good strategy to fully dissect any relevant function of ZRF1 in neuroblastoma cells. Thus, we knocked down ZRF1 using lentiviral vectors. Two different shRNAs targeting the ZRF1 coding region were transduced in six different neuroblastoma cell lines and showed a marked reduction in ZRF1 levels compared to non-silencing control (NSC)-transduced cells (Figure 5a and Figure S4A). In all tested cell lines, shRNA-mediated depletion of ZRF1 significantly reduced the proliferative capacity of neuroblastoma cells (Figure 5b and Figure S4B).
Transcriptomic analyses of shRNA-mediated ZRF1 depleted cells showed the involvement of several genes related to the cell cycle (Figure S4C,D). When we validated the expression of some of those genes (i.e., AURKB), discrepancies among the molecular effects of the three different shRNAs were observed. For example, while one of the shRNAs (shRNA #1) completely abolished the expression of AURKB, the other two (shRNA #2 and #3) did not (Figure 5c). Cell cycle analyses in ZRF1-depleted cells also showed different profiles. The shRNAs #1 and #2 against ZRF1 showed an increase in the percentage of cells in the G1 phase, whereas shRNA #3 showed a trend towards G2/M arrest (Figure 5d). To discard potential shRNA off-target effects, we performed rescue experiments by overexpressing a ZRF1 variant with silent mutations in the shRNA target sites (Figure S5). This new mutant ZRF1 was completely insensitive to shRNAs #1 and #3, and partially sensitive to shRNA #2 (Figure 5e). When the phenotypic effects were analyzed, the ectopic expression of ZRF1 did not rescue the reduction in proliferation caused by the transduction of the three different shRNAs (Figure 5f). Thus, we concluded that the phenotypic consequences induced by the different shRNAs were not attributable to ZRF1 depletion.
To exclude the possibility that some of the ZRF1 knockdown effects were masked by the shRNA off-targets, we repeated the experiments with small interfering RNA (siRNA). Up to four different siRNA sequences were transfected into neuroblastoma cells. All the sequences reduced the ZRF1 level by more than 85% (Figure 6a). When the phenotypic consequences of siRNA-mediated ZRF1 depletion were analyzed, no differences were found in cell proliferation (Figure 6b), wound healing (Figure 6c), invasion through collagen (Figure 6d), or resistance to neuroblastoma therapies such as chemotherapeutics or RA (Figure 6e).
In summary, our results indicate that ZRF1 has a prognostic value, but is not functionally relevant in neuroblastoma cells.

4. Discussion

Neuroblastoma is thought to originate from cells of the neural crest that are transformed during differentiation and migration toward tissues of the sympathoadrenergic lineage. The occurrence of a transformative event during tissue differentiation dictates the aggressiveness of the tumor. In general, patients with poor prognosis have histologically undifferentiated tumors, whereas those with better prognosis have tumors with histological evidence of cellular differentiation [23]. This differentiation program is tightly regulated by a complex set of signals, including external signaling, activation of specific transcriptional programs, and/or epigenetic events (reviewed in [24]). Experimental results in transgenic mouse models have identified activating ALK mutations and MYCN overexpression as the main oncogenic drivers of neuroblastoma [25,26]. These molecular alterations often converge on mechanisms that block differentiation and confer sustained proliferation capabilities. In particular, genes associated with the maintenance of embryonic and adult stem cells, such as the components of PRC1 or PRC2, have been linked to the initiation and progression of neuroblastoma [27]. For example, BMI1, a core component of the PRC1 complex, has been shown to cooperate in MYCN-driven neuroblastomas by inhibiting cell death and differentiation [28,29,30]. Focusing on the role of PRC1 in neuronal differentiation, Aloia et al. identified ZRF1 as a transcriptional regulator of neural fates in embryonic stem cells [9]. Furthermore, ZRF1 expression has been associated with poor outcomes in other tumors, such as breast [14,31] or gastric cancer [15], thus suggesting an oncogenic role in cancer. Thus, we sought to determine whether 
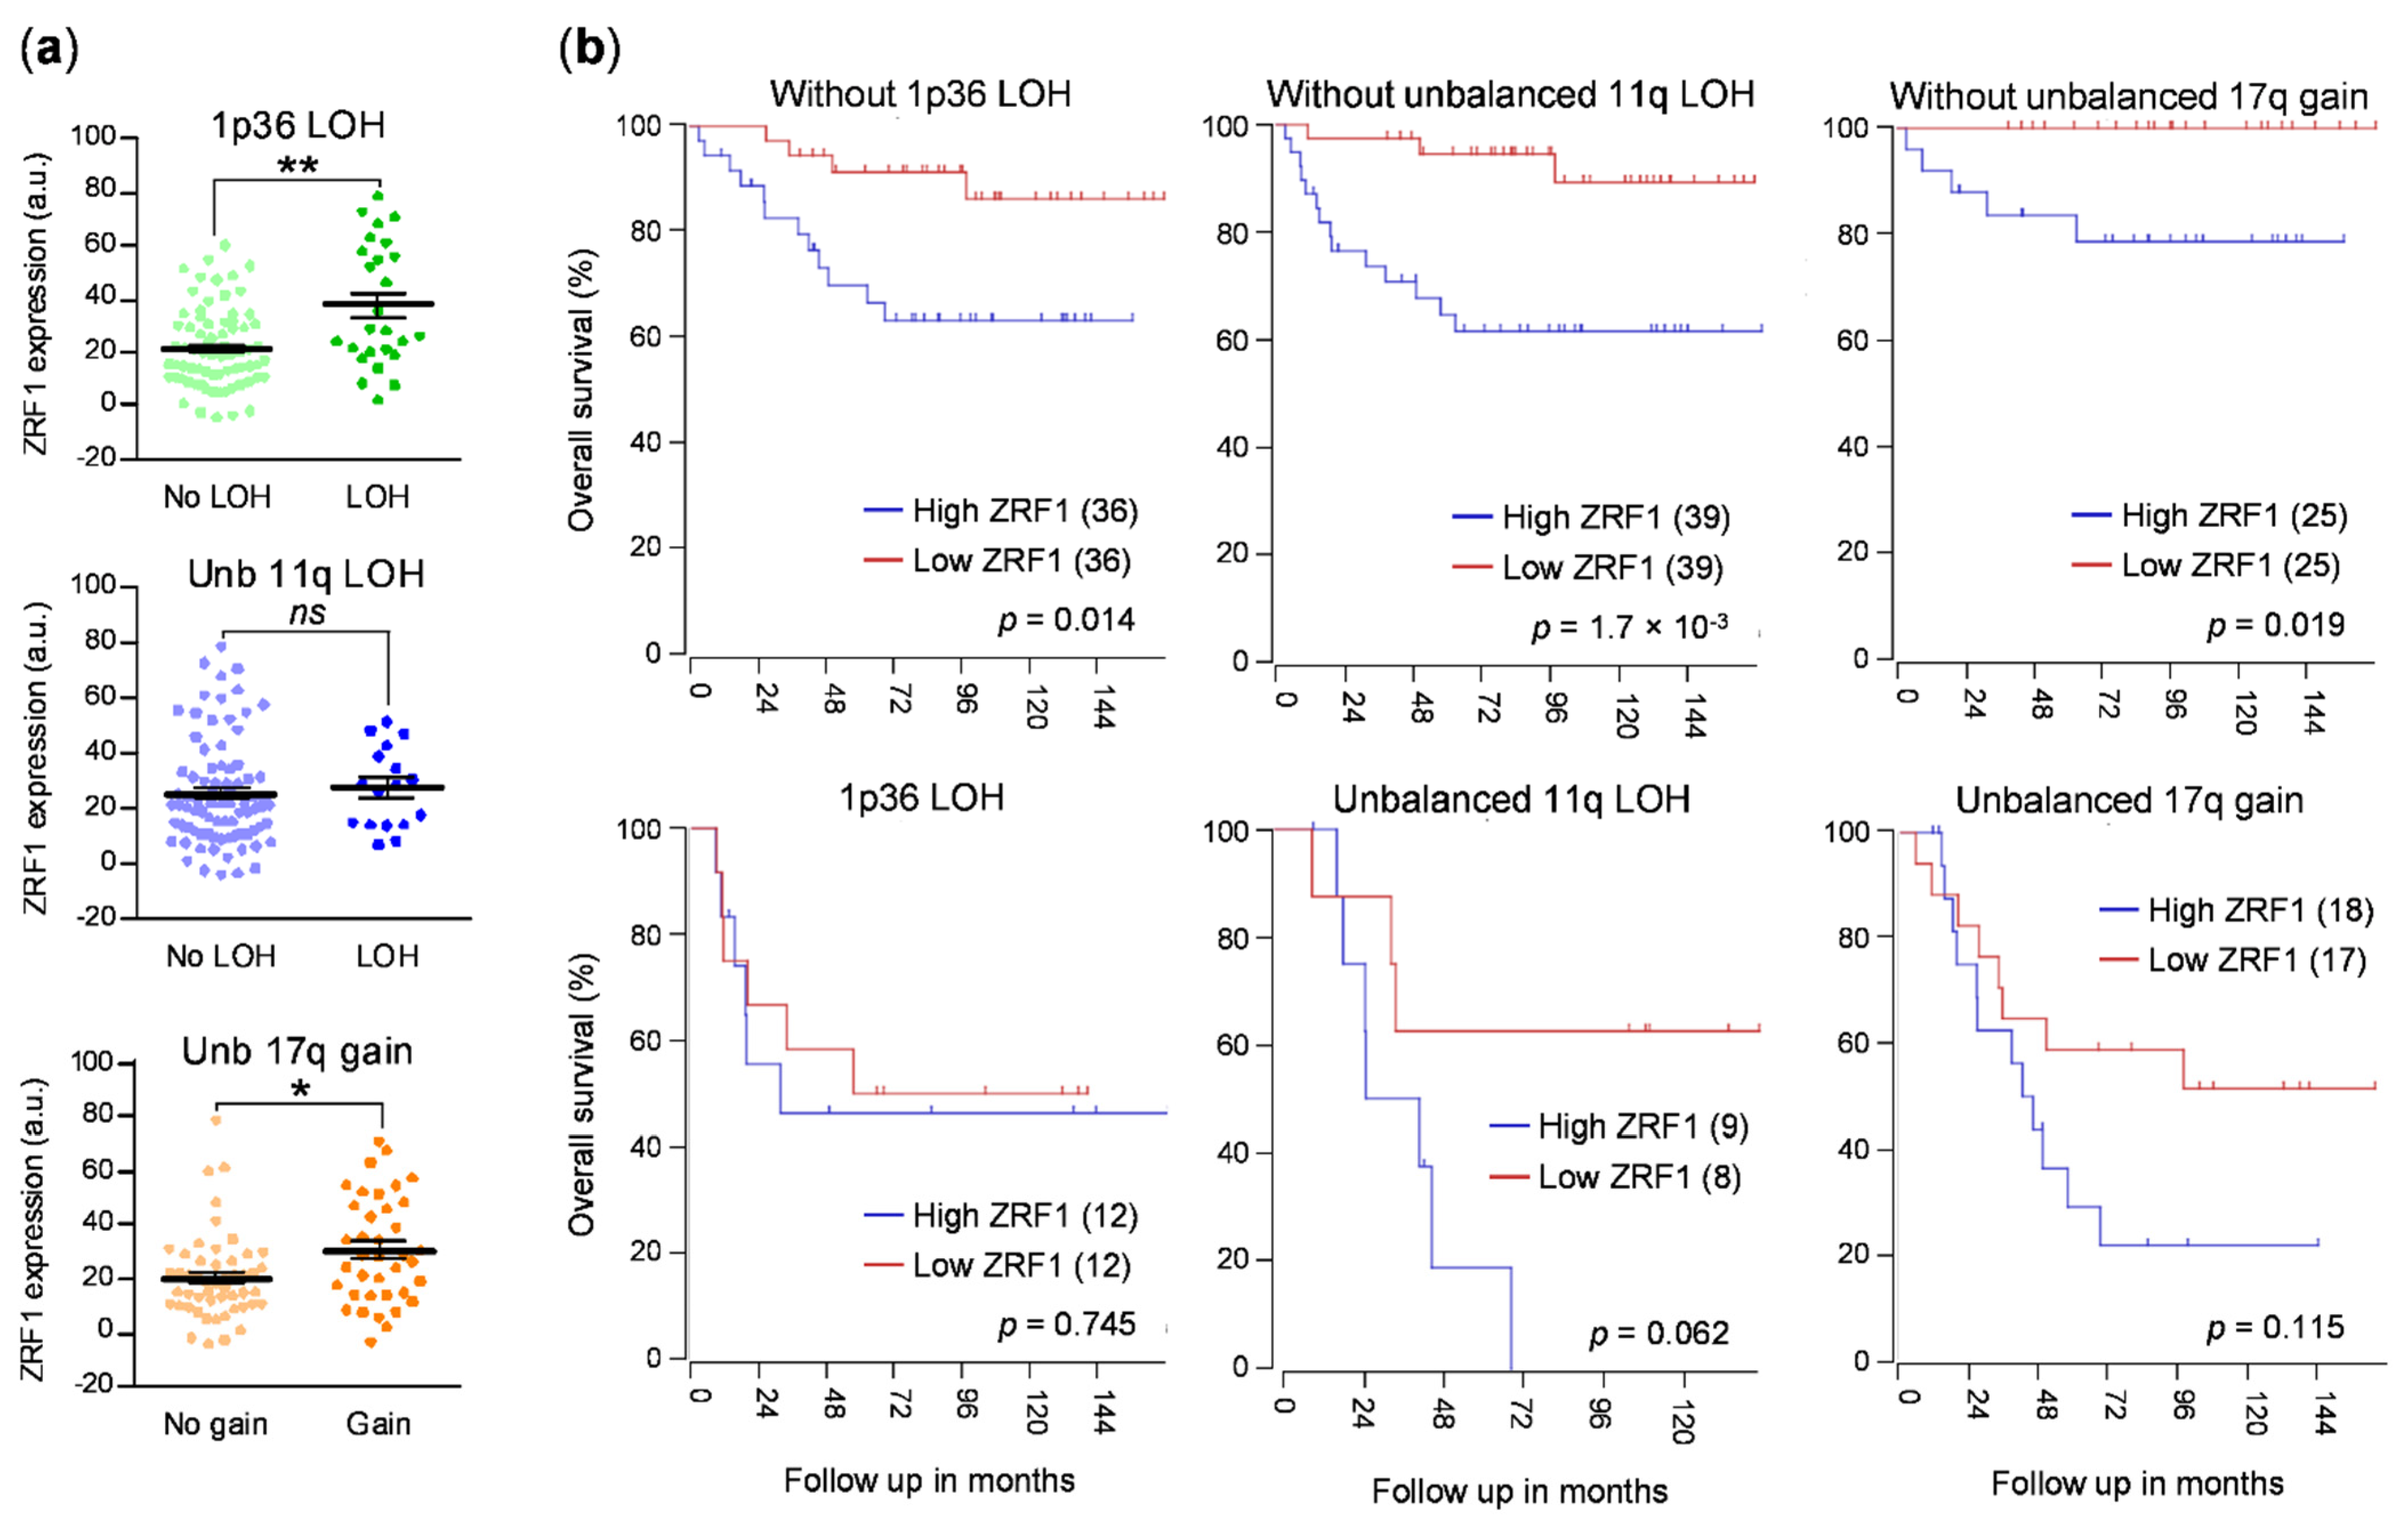
ZRF1 plays a functional role in aggressive neuroblastomas. Data mining of multiple neuroblastoma gene expression datasets confirmed that ZRF1 mRNA expression was elevated in subsets of patients with the most common genetic alterations associated with poor outcomes, thereby supporting our initial hypothesis, although this correlation could not be confirmed at the protein level in neuroblastoma patient samples.
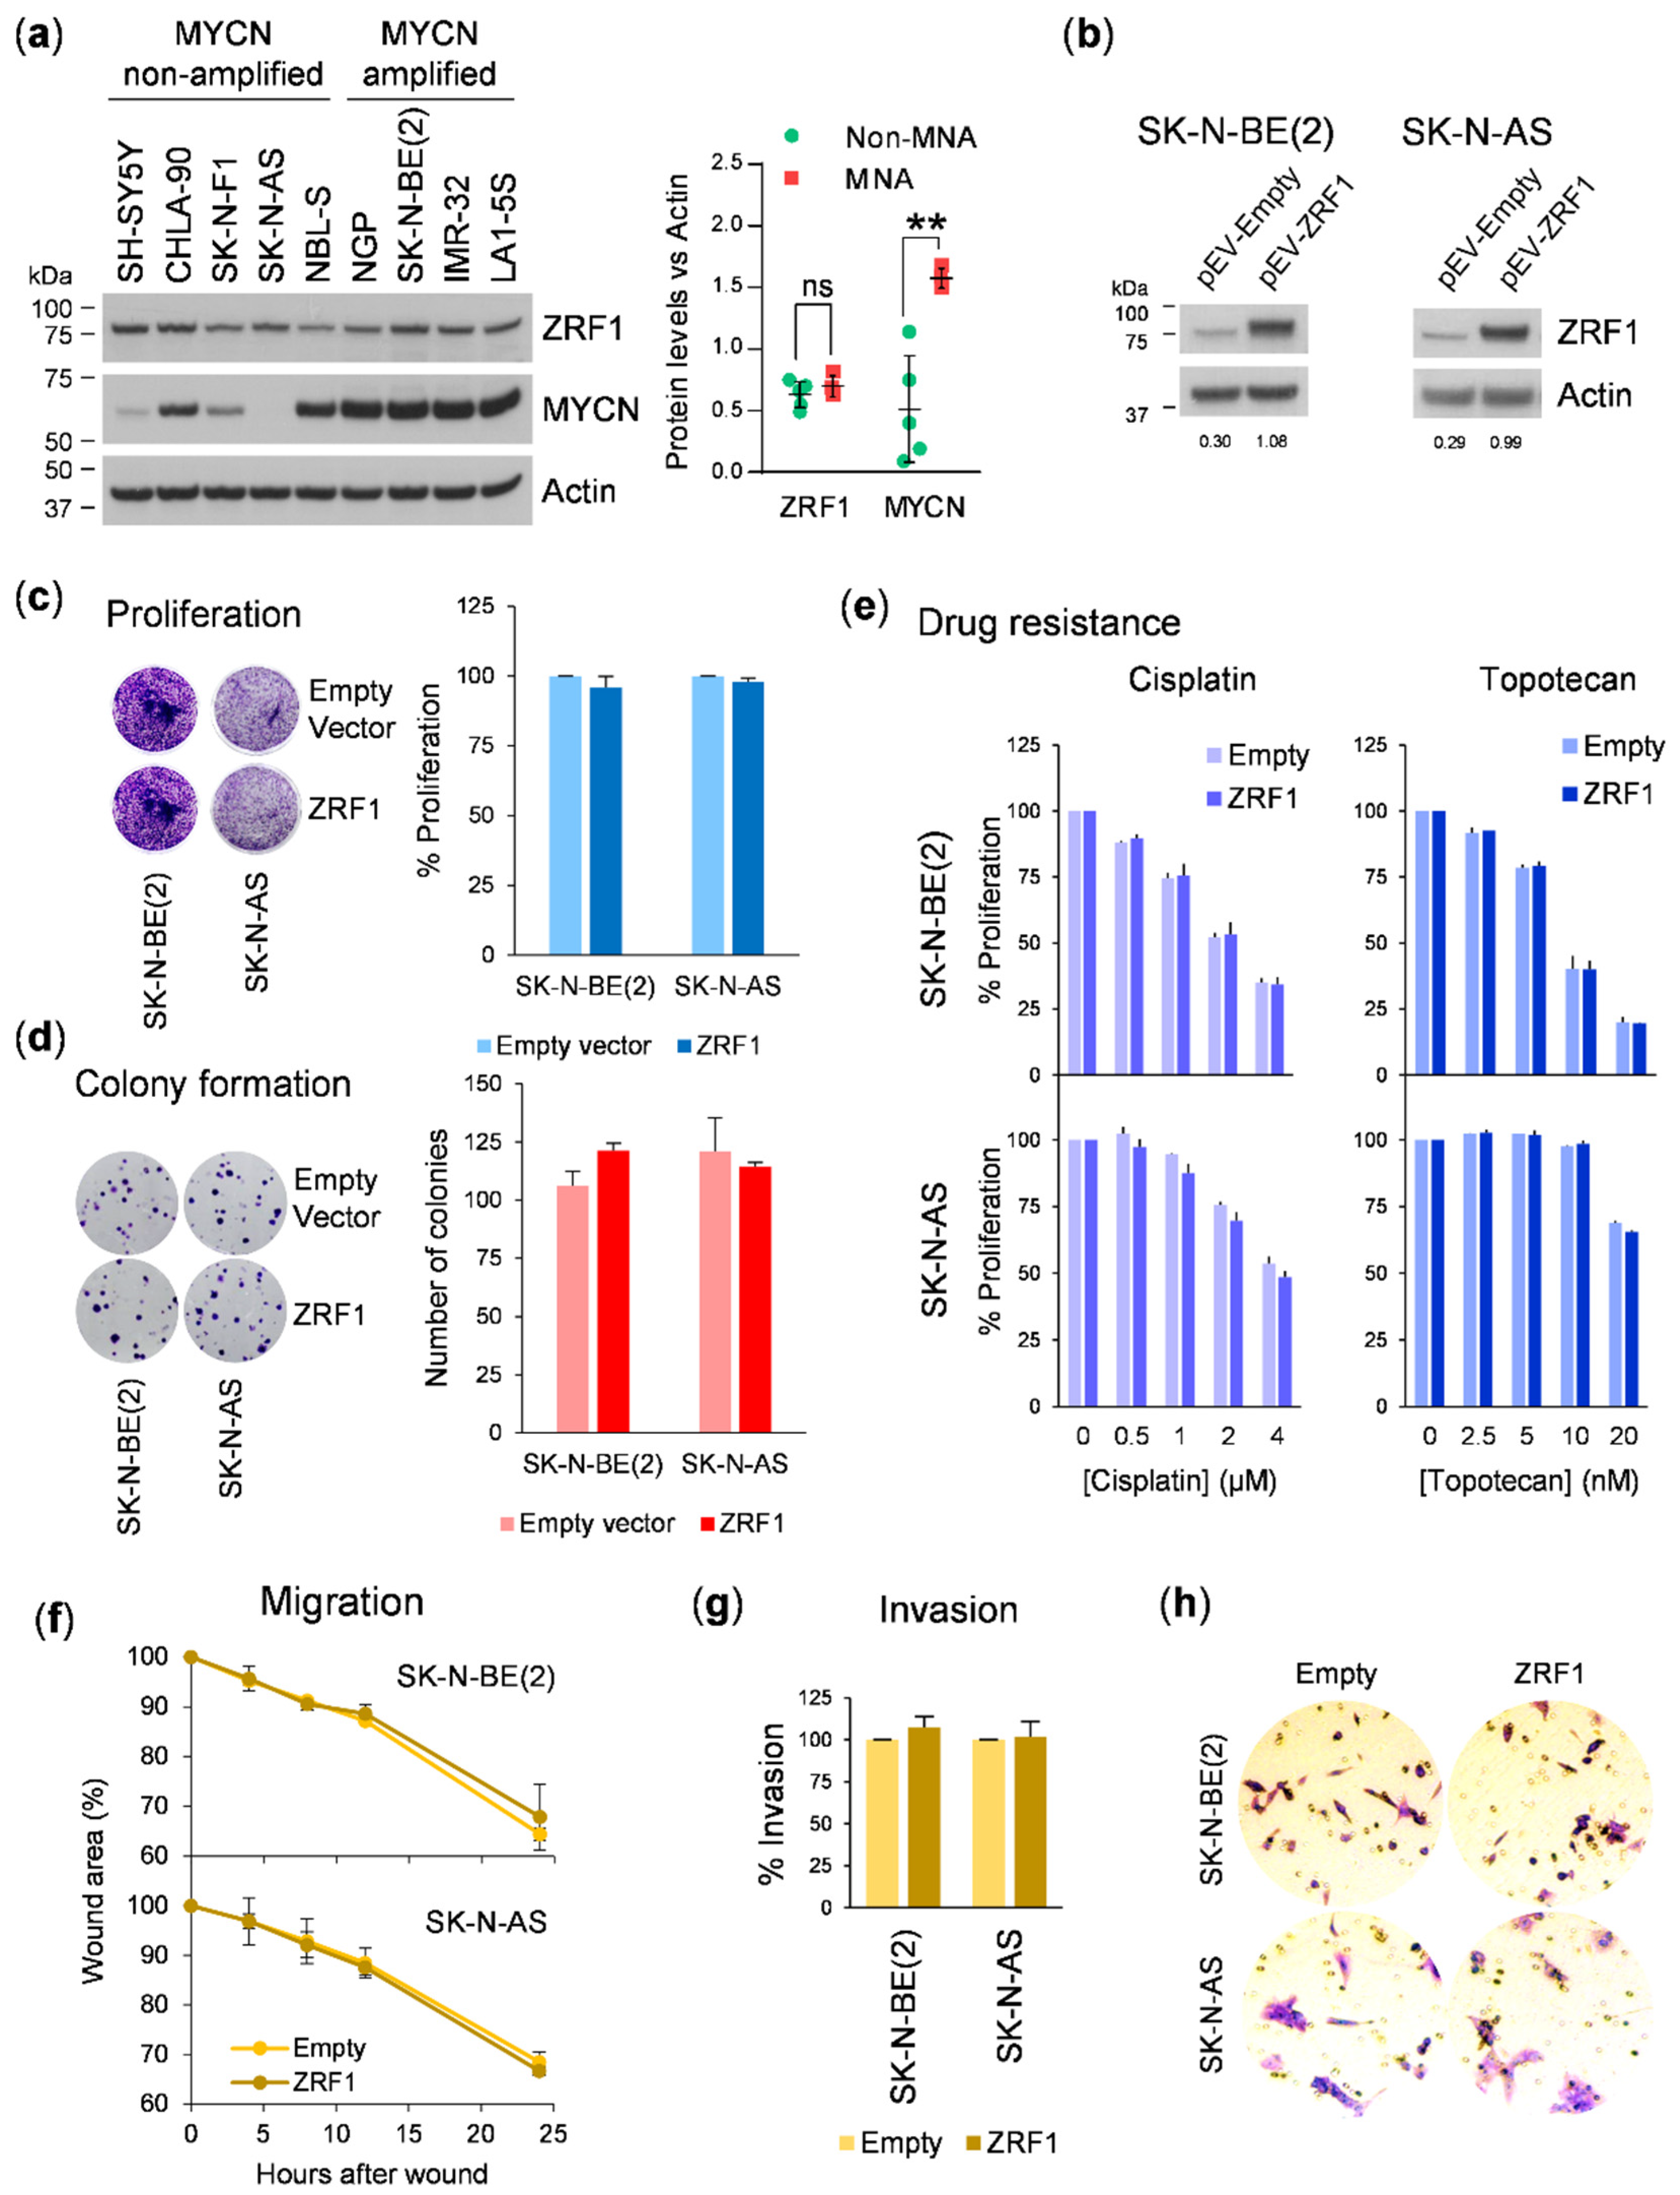
Nevertheless, our functional data do not support a relevant contribution of ZRF1 in the oncogenesis of neuroblastoma. Ectopic expression of 
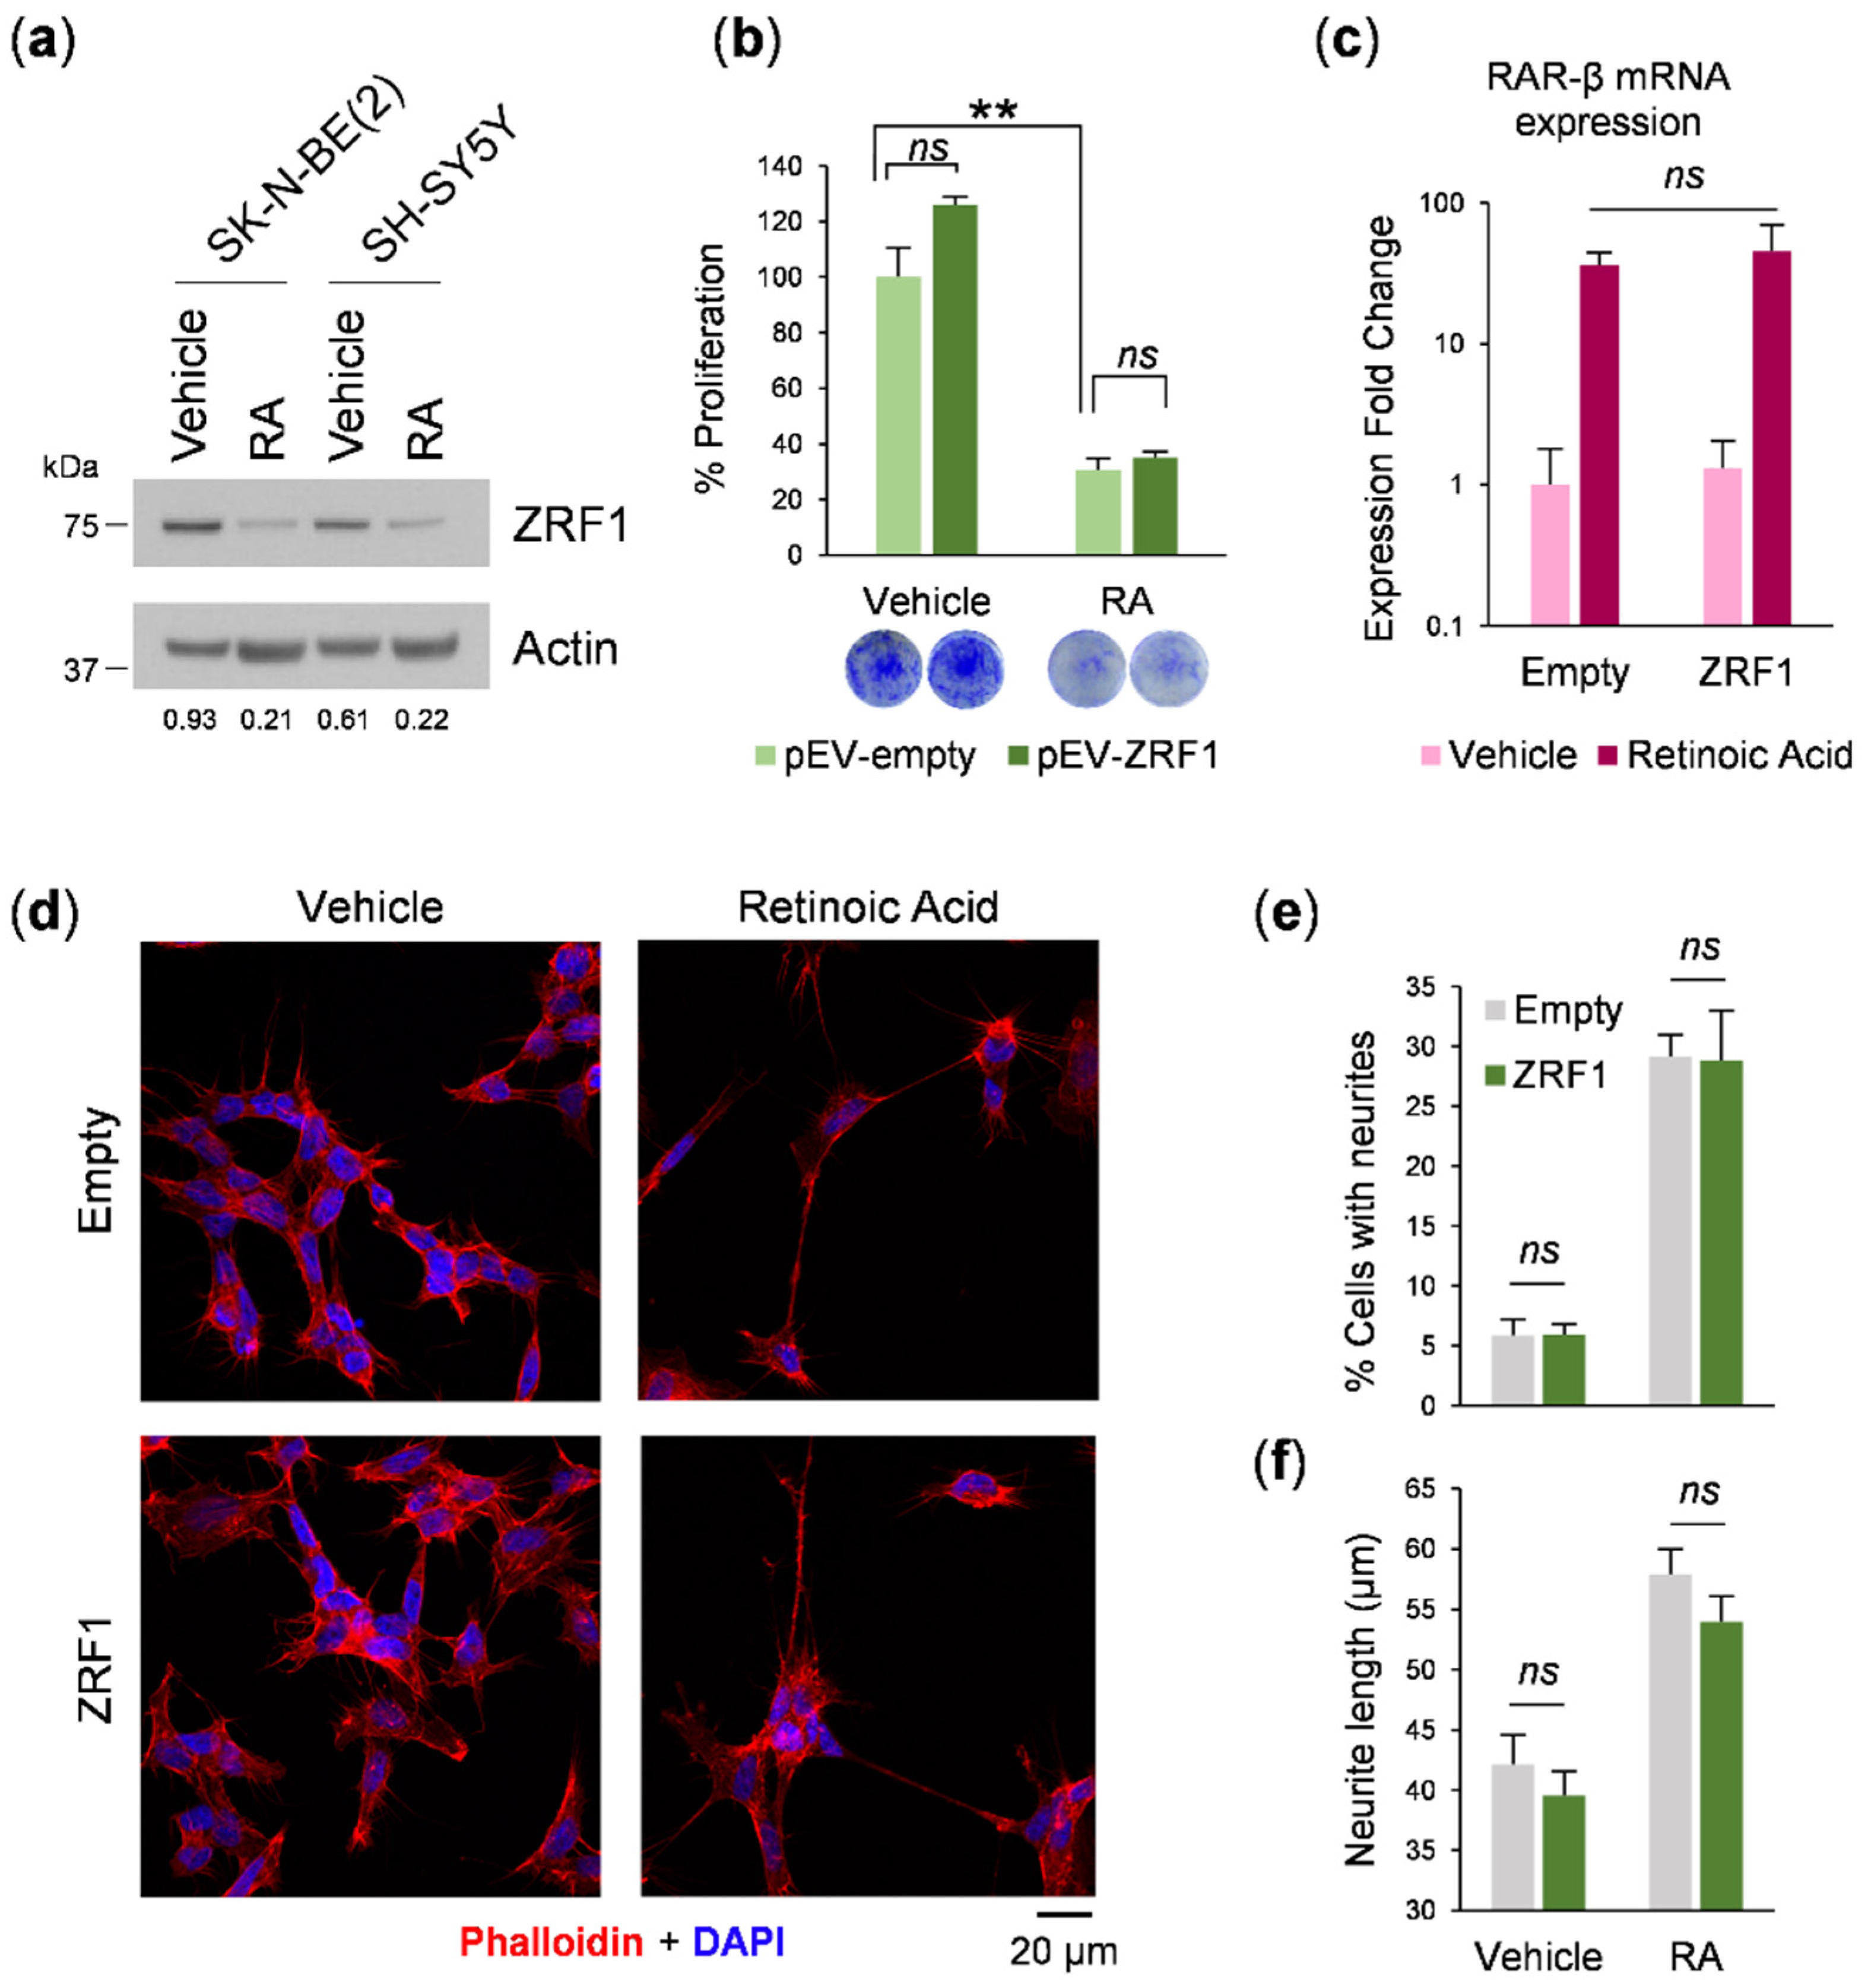
ZRF1 did not offer proliferation, colony formation, or migratory or invasive advantages to neuroblastoma cells. In acute myeloid leukemia, ZRF1 is a regulator of RA-induced differentiation [16], and because of the relevance of retinoids in neuroblastoma therapy [22], we investigated whether ZRF1 interferes with the response of neuroblastoma cells to RA. When neuroblastoma cells were exposed to 13-cis-RA, a clear reduction in the ZRF1 level was observed, concomitant with an expected reduction in cell proliferation and morphological changes such as neurite outgrowth. However, maintaining high ZRF1 expression ectopically was not sufficient to reverse the RA effect. These results suggest that the downregulation of ZRF1 is a consequence of the RA-induced differentiation process.
Although 
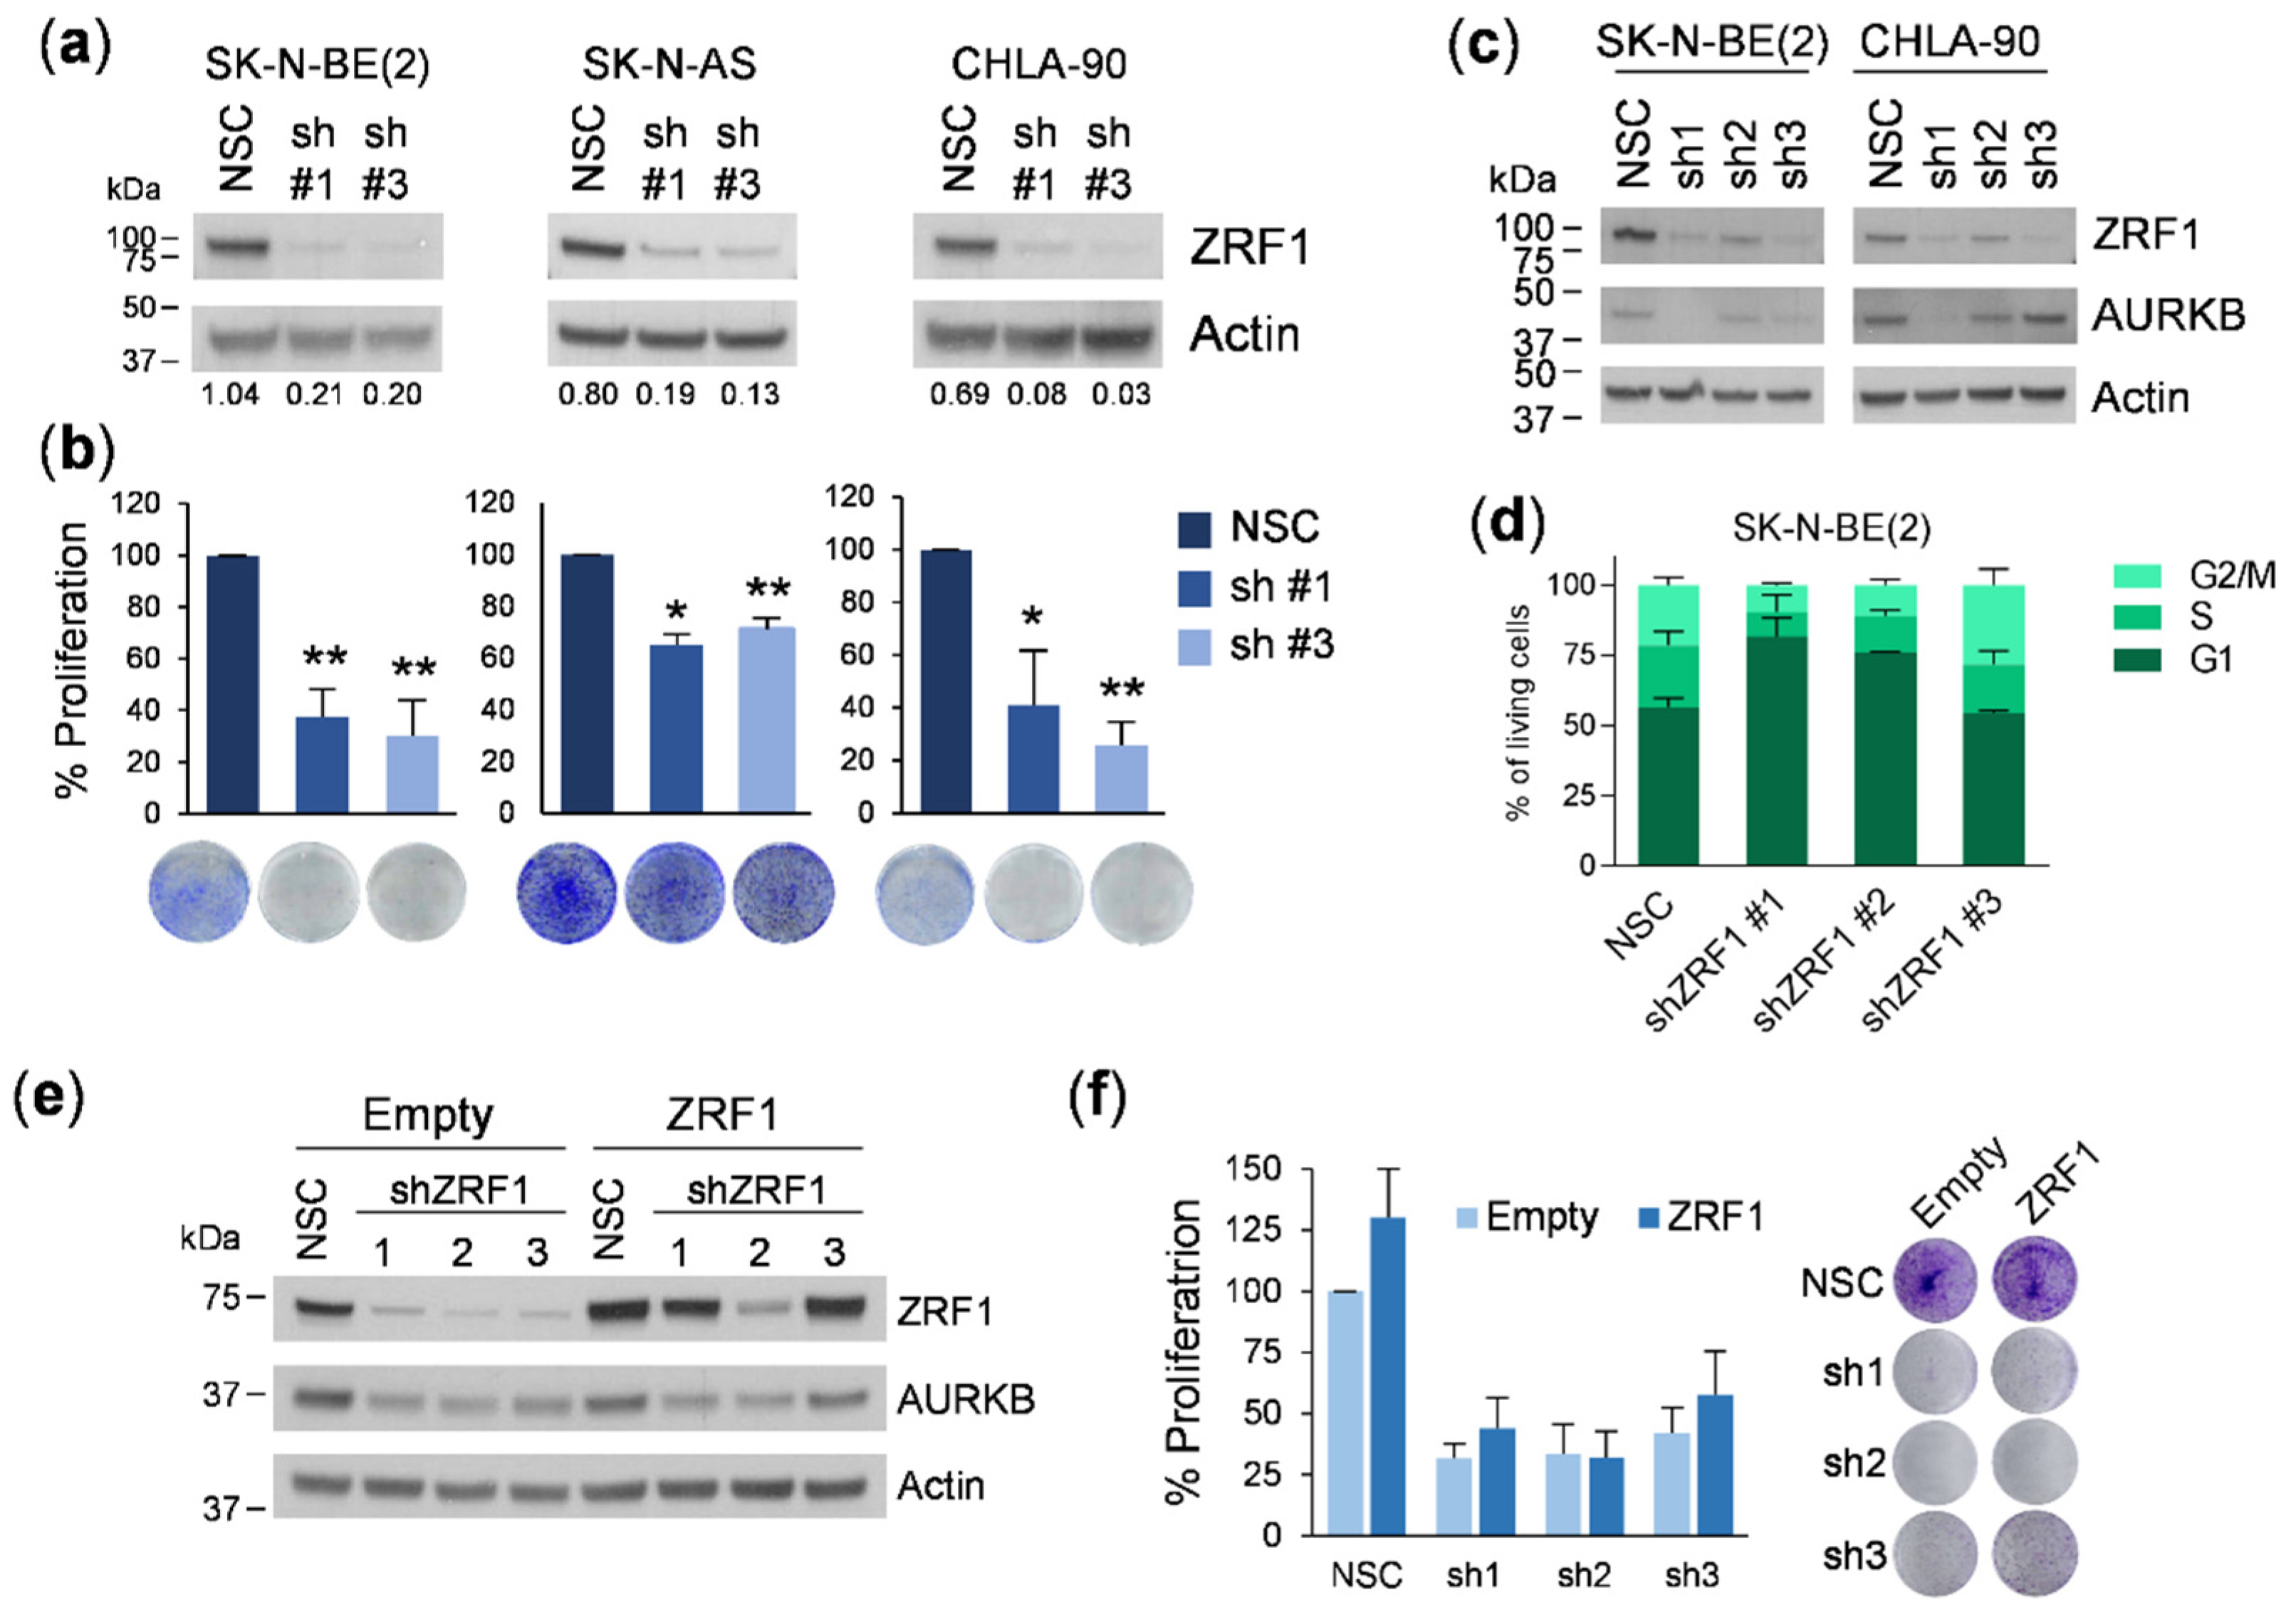
ZRF1 is not sufficient to provide oncogenic advantages, it could still be necessary to maintain the undifferentiated and highly proliferative state of neuroblastoma cells. Previous reports demonstrated that depletion of ZRF1 resulted in a reduction of cell proliferation and the induction of apoptosis in gastric [15] or breast cancer models [14]. Conversely, Kaymak et al. also showed that the reduction in cell proliferation mediated by ZRF1 depletion was accompanied by an increase in the migration and invasion properties of breast cancer cells [31]. Our first set of experiments silencing ZRF1 using two different shRNAs resulted in a marked reduction in cell proliferation in six neuroblastoma cell lines. However, these effects were not rescued by overexpressing the shRNA-insensitive form of ZRF1, thereby indicating that the depletion of 
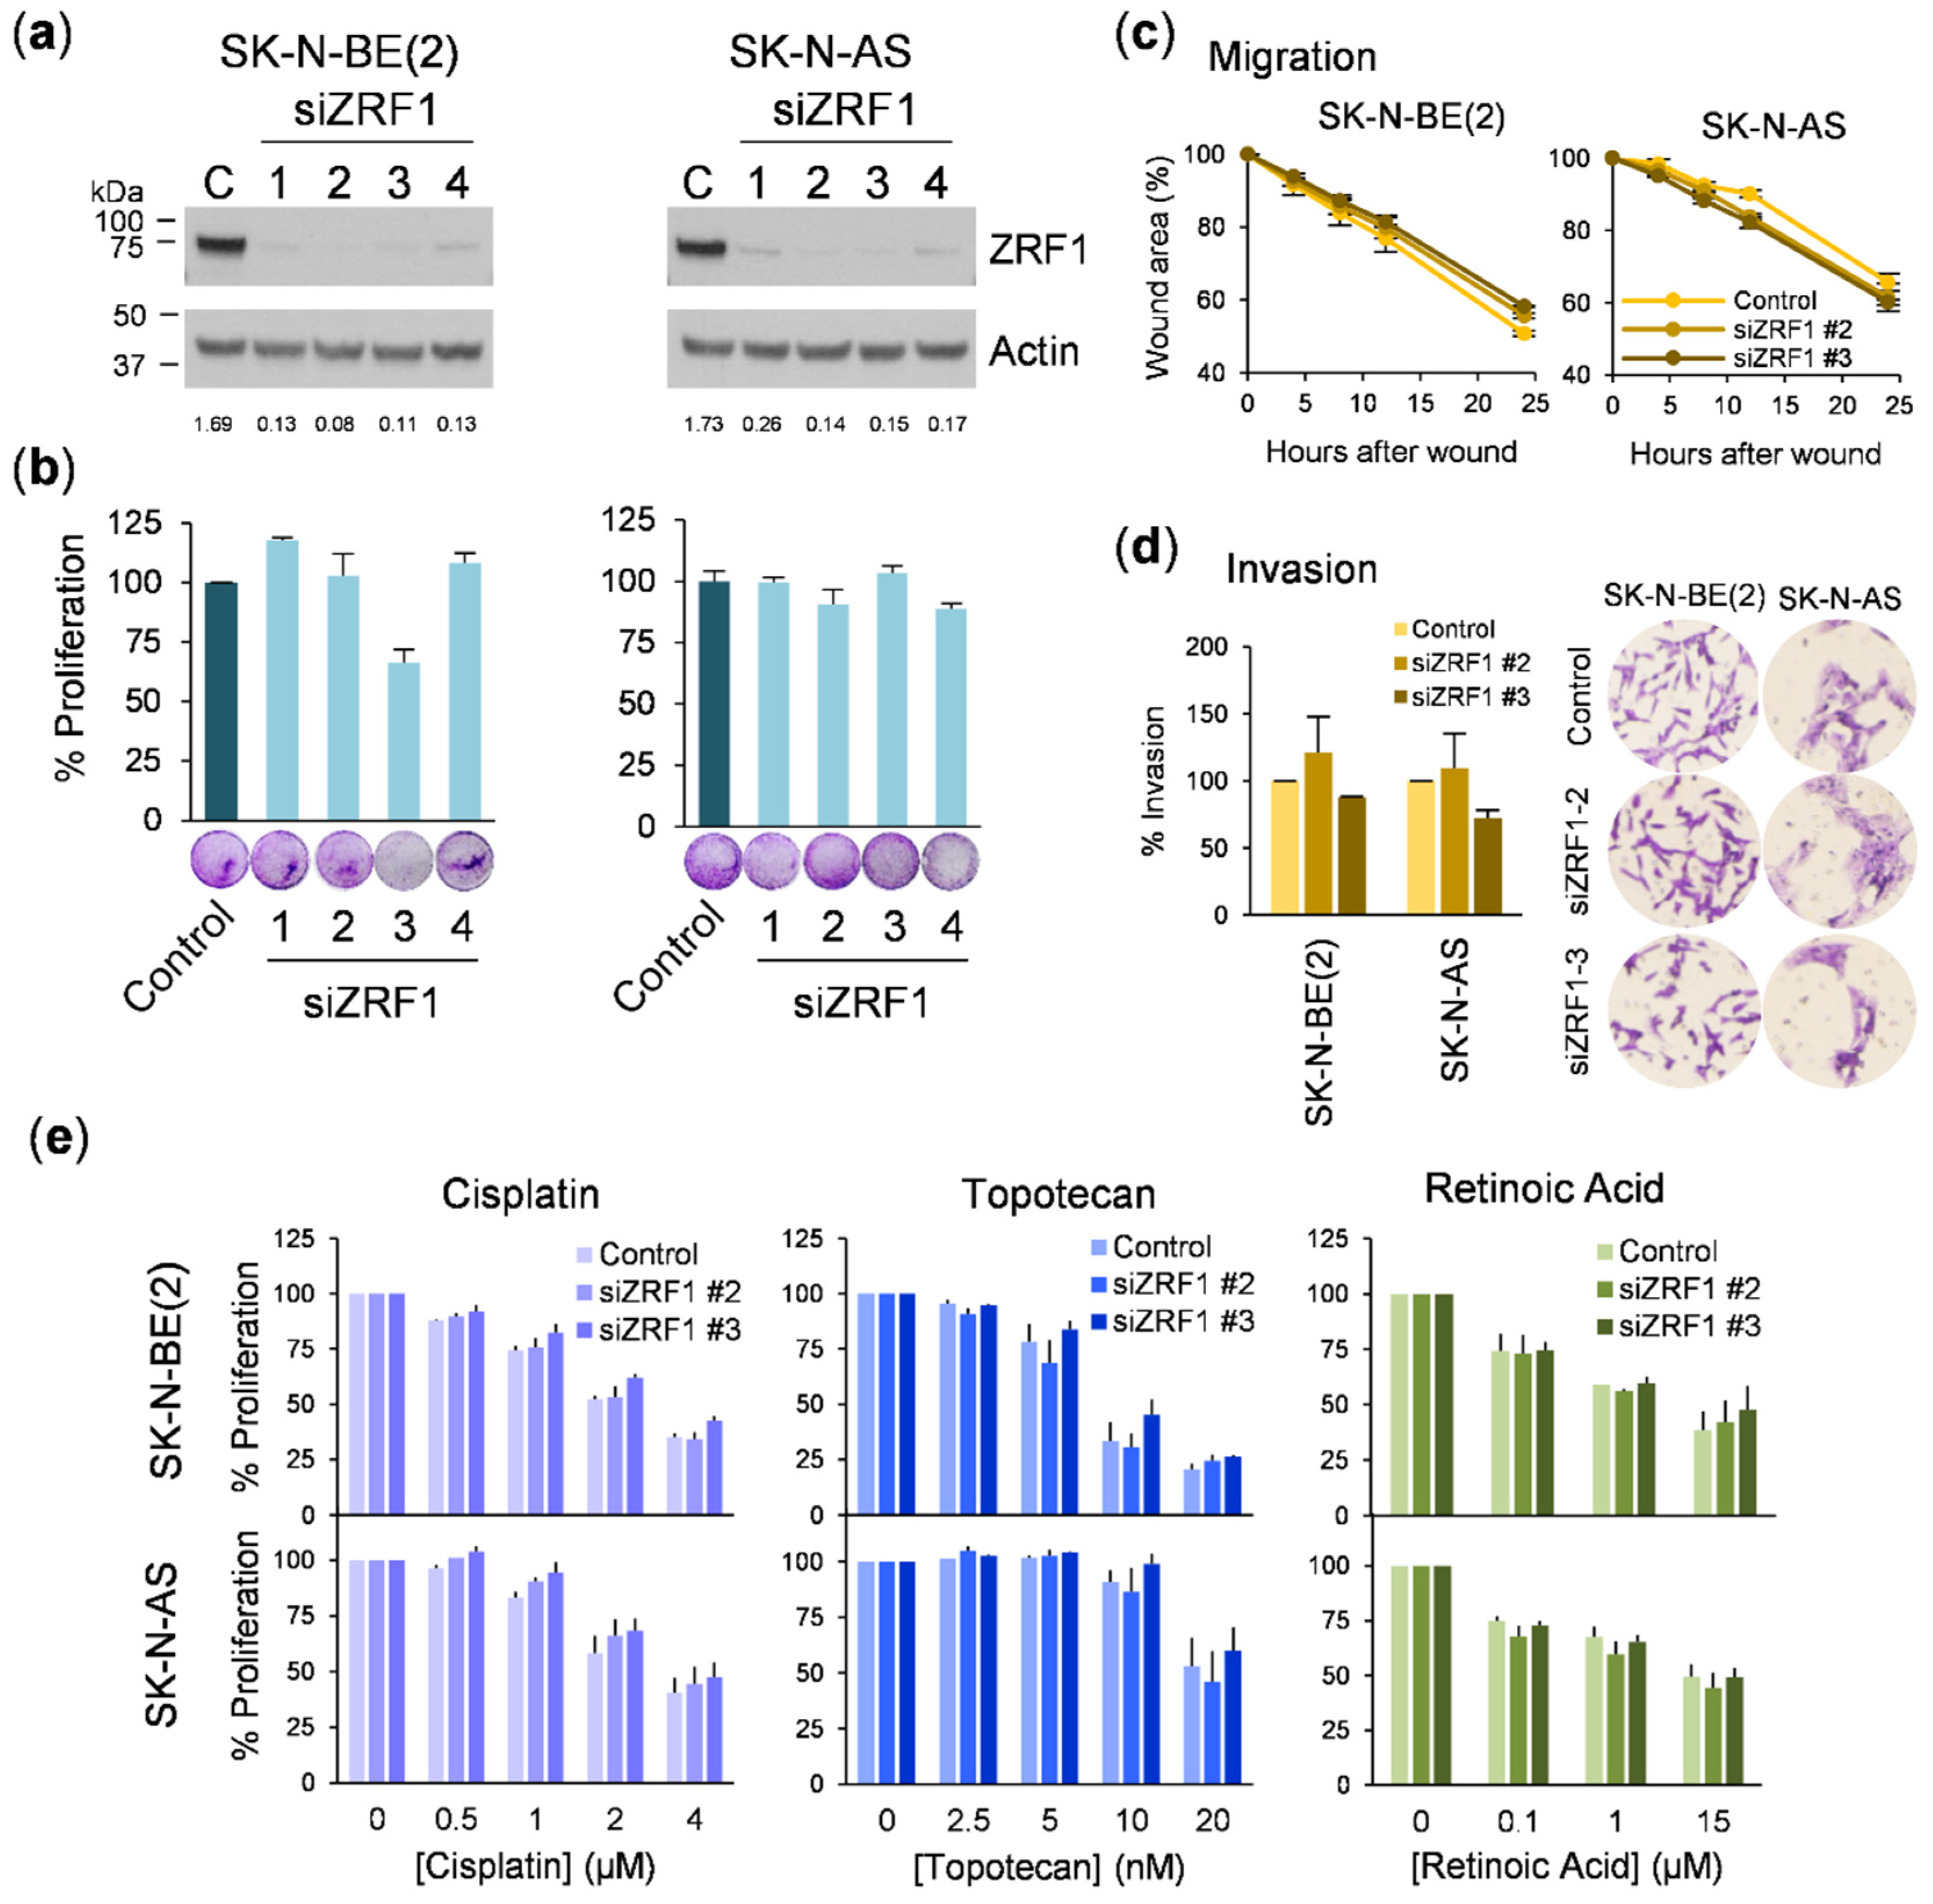
ZRF1 was not the causal factor for the reduction in cell proliferation. Consistent with this previous finding, siRNA-mediated depletion of ZRF1 did not alter the proliferative, migratory, or invasive capacities or the sensitivity to RA in neuroblastoma cells, thus confirming that ZRF1 is dispensable for the progression of this type of tumor. It is important to highlight that inconsistencies between different gene silencing methods could have misled the conclusion of this study. However, our use of independent silencing tools and rescue experiments with target protein ectopic expression leaves no room for doubt.
Imamura et al. demonstrated that while the effects of ZRF1 on cell proliferation were p53-dependent, those related to migration and invasion were p53-independent [15]. In our work, we covered this aspect by using cell lines with non-functional (CHLA-90, SK-N-BE(2), and SK-N-AS) and functional p53 (SH-SY5Y and IMR-32), and we did not find any differential response in the gain-of-function or loss-of-function experiments.
The paradoxical discrepancy between the strong correlation between ZRF1 expression and poor patient outcome, and its dispensable function in tumor cells could be due to one or more of the following reasons: (i) one key characteristic of cancer is uncontrolled transcription. Thus, many genes are likely to be differentially expressed incidentally, rather than reflecting a gene that is driving a biologically significant outcome [32]; (ii) the ZRF1-PRC1 axis may regulate different sets of genes in a lineage-dependent manner; (iii) molecular alterations present in neuroblastoma (i.e., mutation burden, chromosomal copy number variations, etc.) deactivate the physiological regulation of ZRF1-PRC1 on cell proliferation/differentiation programs and become ZRF1 independent; and (iv) the ambivalent molecular function of ZRF1 in neuroblastoma cells may be inclined to a non-essential chaperone role. This hypothesis is supported by our subcellular fractionation analysis in different neuroblastoma cell lines, where ZRF1 was found to be predominantly enriched in the cytosolic fraction (Figure S6).
In summary, our data suggest the potential use of ZRF1 expression as an independent prognostic factor, particularly in cases without any other associated molecular prognostic factors. However, ZRF1 does not seem to be a promising target candidate for differentiation therapy for neuroblastoma.

5. Conclusions

ZRF1 was found to be an independent prognostic factor of survival in neuroblastoma. However, this correlation cannot be explained by the molecular role of ZRF1 by itself, and it could be the reflection of an underlying molecular mechanism promoting neuroblastoma aggressiveness. Nevertheless, our functional studies highlight the need of proper verification of shRNA-mediated knockdown experiments through consistent validation with different gene silencing technologies and rescue experiments.

Supplementary Materials

The following are available online at https://0-www-mdpi-com.brum.beds.ac.uk/article/10.3390/cancers13194845/s1, Figure S1: ZRF1 is associated to poor prognosis in neuroblastoma. Figure S2: ZRF1 protein levels Western blot analysis in patient tumor samples. Figure S3: ZRF1 protein is detected by immunohistochemistry (IHC) in the tumor cells of a neuroblastoma formalin-fixed paraffin-embedded human sample. Figure S4: Functional and molecular consequences of shRNA-mediated depletion of ZRF1 in neuroblastoma cells. Figure S5: Design of a triple shRNA insensitive ZRF1 overexpression construct. Figure S6: Subcellular localization analysis of ZRF1 by Western blot in a panel of neuroblastoma cell lines. Figure S7. Original Western Blot image of Figure 3a,b, Figure 4a, Figure 5a,c,e, Figure 6a, Figure S2a and Figure S4. Table S1: Antibodies used for Western blot analyses. Table S2: Oligonucleotides used for silent ZRF1 mutagenesis and RARB RT-qPCR. Table S3: ZRF1 targeting sequences. Table S4: Cut-off value for ZRF1 levels analysis, based on the ability for overall survival prediction (using GSE62564, n = 498). Table S5: ZRF1 mRNA expression correlations with clinical variables in neuroblastoma using Fisher’s test (GSE62564, n = 498). Table S6: Neuroblastoma tumor sample clinical data.

Author Contributions

Conceptualization, C.J. and M.F.S.; methodology, C.J., R.A., M.M., L.D.-J., J.C., A.M., G.G., L.J. and M.F.S.; bioinformatic analyses, C.J., A.S., L.D.-J., D.L.-N. and M.F.S.; validation, C.J. and M.F.S.; formal analysis, C.J., A.S., R.A. and M.F.S.; investigation C.J. and M.F.S.; data curation, C.J., A.S., L.D.-J., G.G., R.H. and M.F.S.; writing—original draft preparation, C.J. and M.F.S.; writing—review and editing, J.R., D.L.-N., J.S.d.T., L.M. and S.G.; supervision, M.F.S.; funding acquisition J.S.d.T., S.G. and M.F.S. All authors have read and agreed to the published version of the manuscript.

Funding

This work was funded by Instituto de Salud Carlos III (Grant no. CP16/00006, PI17/00564 and PI20/00530 to M.F Segura and MS17/00063 to D. Llobet-Navas); Asociación Española Contra el Cáncer (LABAE18009SEGU, LABAE19004LLOB); Generalitat de Catalunya AGAUR/European Social Fund (Grant no. 2017FI_B_00095 to C Jiménez); Asociación NEN; Joan Petit foundation; Asociación Pulseras Candela foundation; the #delhospitalalacatedral initiative led by Xavi Vallés; and the Rotary Clubs of Barcelona Eixample, Barcelona Diagonal, Santa Coloma de Gramanet, München-Blutenburg, Deutschland Gemeindienst, and others from Barcelona and its province.

Institutional Review Board Statement

Not applicable.

Informed Consent Statement

Tumor samples from Vall d’Hebron Hospital neuroblastoma patients are under the registered collection Ref. C.0002311 from Instituto de Salud Carlos III. All patients gave written informed consent.

Data Availability Statement

Publicly available datasets were analyzed in this study. These data can be found at http://r2.amc.nl under the accession numbers GSE45547, GSE3960, GSE62564.

Acknowledgments

We thank members of the Translational Research in Child and Adolescent Cancer laboratory for their support. We thank Professor Luciano Di Croce for sharing the ZRF1 shRNA vectors, overexpression vectors and the anti-ZRF1 antibody.

Conflicts of Interest

The authors declare no conflict of interest.

References

  1. Maris, J.M. Recent Advances in Neuroblastoma. N. Engl. J. Med. 2010, 362, 2202–2211. [Google Scholar] [CrossRef] [PubMed] [Green Version]
  2. Cheung, N.-L.V.; Dyer, M.A. Neuroblastoma: Developmental biology, cancer genomics and immunotherapy. Nat. Rev. Cancer 2013, 13, 397–411. [Google Scholar] [CrossRef] [PubMed] [Green Version]
  3. Matthay, K.K.; Maris, J.M.; Schleiermacher, G.; Nakagawara, A.; Mackall, C.L.; Diller, L.; Weiss, W.A. Neuroblastoma. Nat. Rev. Dis. Prim. 2016, 2, 16078. [Google Scholar] [CrossRef] [PubMed]
  4. Pudela, C.; Balyasny, S.; Applebaum, M.A. Nervous system: Embryonal tumors: Neuroblastoma. Atlas Genet. Cytogenet. Oncol. Haematol. 2020, 24, 284–290. [Google Scholar] [CrossRef] [PubMed]
  5. Maris, J.M.; Hogarty, M.D.; Bagatell, R.; Cohn, S.L. Neuroblastoma. Lancet 2007, 369, 2106–2120. [Google Scholar] [CrossRef]
  6. Reynolds, C.P. Detection and treatment of minimal residual disease in high-risk neuroblastoma. Pediatr. Transplant. 2004, 8, 56–66. [Google Scholar] [CrossRef]
  7. Durinck, K.; Speleman, F. Epigenetic regulation of neuroblastoma development. Cell Tissue Res. 2018, 372, 309–324. [Google Scholar] [CrossRef] [PubMed]
  8. Aloia, L.; Di Stefano, B.; Sessa, A.; Morey, L.; Santanach, A.; Gutierrez, A.; Cozzuto, L.; Benitah, S.A.; Graf, T.; Broccoli, V.; et al. ZRF1 is required to establish and maintain neural progenitor identity. Genes Dev. 2014, 28, 182–197. [Google Scholar] [CrossRef] [Green Version]
  9. Aloia, L.; Gutierrez, A.; Caballero, J.M.; Di Croce, L. Direct interaction between Id1 and ZRF1 controls neural differentiation of embryonic stem cells. EMBO Rep. 2015, 16, 63–70. [Google Scholar] [CrossRef] [PubMed] [Green Version]
  10. Matsumoto-Taniura, N.; Pirollet, F.; Monroe, R.; Gerace, L.; Westendorf, J.M. Identification of novel M phase phosphoproteins by expression cloning. Mol. Biol. Cell 1996, 7, 1455–1469. [Google Scholar] [CrossRef] [Green Version]
  11. Hundley, H.A.; Walter, W.; Bairstow, S.; Craig, E.A. Human Mpp11 J protein: Ribosome-tethered molecular chaperons are ubiquitous. Science 2005, 308, 1032–1034. [Google Scholar] [CrossRef] [PubMed] [Green Version]
  12. Otto, H.; Conz, C.; Maier, P.; Wölfle, T.; Suzuki, C.K.; Jenö, P.; Rücknagel, P.; Stahl, J.; Rospert, S. The chaperones MPP11 and Hsp70L1 form the mammalian ribosome-associated complex. Proc. Natl. Acad. Sci. USA 2005, 102, 10064–10069. [Google Scholar] [CrossRef] [Green Version]
  13. Richly, H.; Rocha-Viegas, L.; Ribeiro, J.D.; Demajo, S.; Gundem, G.; Lopez-Bigas, N.; Nakagawa, T.; Rospert, S.; Ito, T.; Di Croce, L. Transcriptional activation of polycomb-repressed genes by ZRF1. Nature 2010, 468, 1124–1130. [Google Scholar] [CrossRef] [PubMed]
  14. Rath, S.K.; Deb, M.; Sengupta, D.; Kari, V.; Kar, S.; Parbin, S.; Pradhan, N.; Patra, S.K. Silencing of ZRF1 impedes survival of estrogen receptor positive MCF-7 cells and potentiates the effect of curcumin. Tumor Biol. 2016, 37, 12535–12546. [Google Scholar] [CrossRef] [PubMed]
  15. Imamura, T.; Komatsu, S.; Ichikawa, D.; Miyamae, M.; Okajima, W.; Ohashi, T.; Kiuchi, J.; Nishibeppu, K.; Kosuga, T.; Konishi, H.; et al. Overexpression of ZRF1 is related to tumor malignant potential and a poor outcome of gastric carcinoma. Carcinogenesis 2018, 39, 263–271. [Google Scholar] [CrossRef] [PubMed]
  16. Demajo, S.; Uribesalgo, I.; Gutiérrez, A.; Ballaré, C.; Capdevila, S.; Roth, M.; Zuber, J.; Martín-Caballero, J.; Di Croce, L. ZRF1 controls the retinoic acid pathway and regulates leukemogenic potential in acute myeloid leukemia. Oncogene 2014, 33, 5501–5510. [Google Scholar] [CrossRef] [PubMed]
  17. Livak, K.J.; Schmittgen, T.D. Analysis of relative gene expression data using real-time quantitative PCR and the 2-ΔΔCT method. Methods 2001, 25, 402–408. [Google Scholar] [CrossRef]
  18. Naldini, L.; Blömer, U.; Gallay, P.; Ory, D.; Mulligan, R.; Gage, F.H.; Verma, I.M.; Trono, D.; Naldini, L.; Blomer, U.; et al. In Vivo Gene Delivery and Stable Transduction of Nondividing Cells by a Lentiviral Vector. Science 1996, 272, 263–267. [Google Scholar] [CrossRef] [Green Version]
  19. Zufferey, R.; Dull, T.; Mandel, R.J.; Bukovsky, A.; Quiroz, D.; Naldini, L.; Trono, D. Self-Inactivating Lentivirus Vector for Safe and Efficient In Vivo Gene Delivery. J. Virol. 1998, 72, 9873–9880. [Google Scholar] [CrossRef] [Green Version]
  20. Caron, H. Allelic loss of chromosome 1 and additional chromosome 17 material are both unfavourable prognostic markers in neuroblastoma. Med. Pediatr. Oncol. 1995, 24, 215–221. [Google Scholar] [CrossRef]
  21. Attiyeh, E.F.; London, W.B.; Mossé, Y.P.; Wang, Q.; Winter, C.; Khazi, D.; McGrady, P.W.; Seeger, R.C.; Look, A.T.; Shimada, H.; et al. Chromosome 1p and 11q Deletions and Outcome in Neuroblastoma. N. Engl. J. Med. 2005, 353, 2243–2253. [Google Scholar] [CrossRef]
  22. Reynolds, C.P.; Lemons, R.S. Retinoid therapy of childhood cancer. Hematol. Oncol. Clin. N. Am. 2001, 15, 867–910. [Google Scholar] [CrossRef]
  23. He, S.; Liu, Z.; Oh, D.Y.; Thiele, C.J. MYCN and the epigenome. Front. Oncol. 2013, 3, 1–10. [Google Scholar] [CrossRef] [PubMed] [Green Version]
  24. Johnsen, J.I.; Dyberg, C.; Wickström, M. Neuroblastoma—A neural crest derived embryonal malignancy. Front. Mol. Neurosci. 2019, 12, 9. [Google Scholar] [CrossRef] [PubMed]
  25. Weiss, W.A.; Aldape, K.; Mohapatra, G.; Feuerstein, B.G.; Bishop, J.M. Targeted expression of MYCN causes neuroblastoma in transgenic mice. EMBO J. 1997, 16, 2985–2995. [Google Scholar] [CrossRef] [PubMed]
  26. Heukamp, L.C.; Thor, T.; Schramm, A.; De Preter, K.; Kumps, C.; De Wilde, B.; Odersky, A.; Peifer, M.; Lindner, S.; Spruessel, A.; et al. Targeted expression of mutated ALK induces neuroblastoma in transgenic mice. Sci. Transl. Med. 2012, 4, 141ra91. [Google Scholar] [CrossRef]
  27. Kamijo, T. Role of stemness-related molecules in neuroblastoma. Pediatr. Res. 2012, 71, 511–515. [Google Scholar] [CrossRef] [Green Version]
  28. Nowak, K.; Kerl, K.; Fehr, D.; Kramps, C.; Gessner, C.; Killmer, K.; Samans, B.; Berwanger, B.; Christiansen, H.; Lutz, W. BMI1 is a target gene of E2F-1 and is strongly expressed in primary neuroblastomas. Nucleic Acids Res. 2006, 34, 1745–1754. [Google Scholar] [CrossRef] [Green Version]
  29. Cui, H.; Hu, B.; Li, T.; Ma, J.; Alam, G.; Gunning, W.T.; Ding, H.F. Bmi-1 is essential for the tumorigenicity of neuroblastoma cells. Am. J. Pathol. 2007, 170, 1370–1378. [Google Scholar] [CrossRef] [Green Version]
  30. Ochiai, H.; Takenobu, H.; Nakagawa, A.; Yamaguchi, Y.; Kimura, M.; Ohira, M.; Okimoto, Y.; Fujimura, Y.; Koseki, H.; Kohno, Y.; et al. Bmi1 is a MYCN target gene that regulates tumorigenesis through repression of KIF1BΒ and TSLC1 in neuroblastoma. Oncogene 2010, 29, 2681–2690. [Google Scholar] [CrossRef] [Green Version]
  31. Kaymak, A.; Sayols, S.; Papadopoulou, T.; Richly, H. Role for the transcriptional activator ZRF1 in early metastatic events in breast cancer progression and endocrine resistance. Oncotarget 2018, 9, 28666–28690. [Google Scholar] [CrossRef] [PubMed] [Green Version]
  32. Rodriguez-Esteban, R.; Jiang, X. Differential gene expression in disease: A comparison between high-throughput studies and the literature. BMC Med. Genom. 2017, 10, 59. [Google Scholar] [CrossRef] [PubMed] [Green Version]
Figure 1. ZRF1 is an independent prognostic factor in neuroblastoma. (a) Kaplan–Meier survival plot of a cohort of 498 patients (GSE62564) split into high and low ZRF1 mRNA expression, based on the Youden index. (b) ZRF1 mRNA levels in MYCN-amplified tumors (MNA, dark red) vs non-MYCN amplified tumors (non-MNA, light red), according to the indicated disease stages. (c) ZRF1 mRNA levels according to disease stage in the whole cohort (left) or considering patients with non-MNA (middle) or with MNA tumors (right). (d) Kaplan–Meier survival plots comparing samples with high and low ZRF1 levels in the indicated groups of patients. (e) Cox univariate regression analysis of overall survival with different clinic-pathological features. (f) Cox multivariate regression analysis of overall survival results confirm ZRF1 mRNA levels as an independent prognostic marker in neuroblastoma. * means p < 0.05; *** means p < 0.001. HR: hazard ratio.
Cancers 13 04845 g001
Figure 2. ZRF1 levels correlate with low survival in the absence of genomic alterations associated with poor prognosis. (a) ZRF1 mRNA levels in the presence or absence of the indicated segmental copy alterations (GSE3960, n = 101). (b) Kaplan–Meier survival plots comparing high and low ZRF1 samples from the GSE3960 dataset, in the absence or presence of the different segmental copy alterations. ns means non-significant; * means p < 0.05; ** means p < 0.01.
Cancers 13 04845 g002
Figure 3. ZRF1 overexpression does not enhance neuroblastoma cell line aggressiveness. (a) Left, protein expression analysis of ZRF1 and MYCN by Western blot of a 9-neuroblastoma cell line panel. Right, densitometry quantification. (b) Western blot validation of ZRF1 overexpression in SK-N-BE(2) and SK-N-AS cell lines at 96 h post-transduction. (c) Proliferation assay of neuroblastoma cell lines overexpressing ZRF1 compared to empty-vector (pEV-empty)-transduced cells. (d) Colony formation assay of neuroblastoma cells overexpressing ZRF1. Graph represents the average of three independent experiments, n = 3 per condition. (e) Cisplatin and topotecan resistance assay of ZRF1-overexpressing cell lines. Cells were treated for 72 h at the indicated doses, and proliferation was assessed by crystal violet staining. (f) Wound-healing assay in neuroblastoma cells overexpressing ZRF1. Graphs represent percentage of the wound area at the indicated times, normalized to time = 0. (g) Invasion assay of ZRF1 overexpressing cells through a collagen barrier for 16 h. Invasive cells were detected and quantified by crystal violet staining. (h) Representative microscopic pictures of crystal violet-stained invasive cells. ns means non-significant; ** means p < 0.01.
Cancers 13 04845 g003
Figure 4. ZRF1 overexpression does not attenuate retinoic acid-induced differentiation. (a) ZRF1 levels after RA-induced differentiation measured by western blot. Actin-normalized densitometry quantification of ZRF1 levels is shown beneath their respective Western blot panels (b) Cell proliferation assay of SK-N-BE(2) cells overexpressing ZRF1 treated with RA and normalized versus empty vector-transduced cell treated with vehicle. (c) mRNA levels of the RA-induced differentiation reporter RAR-β, assessed by RT-qPCR in SK-N-BE(2) cells. (d) Confocal microscopy representative images of ZRF-overexpressing SK-N-BE(2) cells stained with phalloidin and DAPI. (e) Quantification of the number of cells with neurites (>30 µm prolongations) per field. (f) Average neurite length for each group. ns means non-significant; ** means p < 0.01.
Cancers 13 04845 g004
Figure 5. ZRF1 shRNA silencing results in inconsistent and unspecific effects in neuroblastoma cells. (a) ZRF1 expression levels in neuroblastoma cells transduced with two different shRNAs against ZRF1, and a non-silencing control (NSC) as negative control. (b) Cell proliferation in shZRF1-transduced neuroblastoma cell lines compared with those transduced with NSC, measured by crystal violet. (c) ZRF1 and AURKB levels of shZRF1 transduced neuroblastoma cell lines. (d) Cell cycle analysis of SK-N-BE(2) 72 h post-infection by FACS. (e) Western blot analysis of ZRF1 and AURKB levels in SK-N- BE(2) cells overexpressing ZRF1 insensitive to shZRF1, at 96h post-transduction. (f) Cell proliferation assay of SK-N-BE(2) cells overexpressing insensitive ZRF1 transduced with 3 shRNAs against ZRF1. * means p < 0.05; ** means p < 0.01.
Cancers 13 04845 g005
Figure 6. ZRF1 is dispensable for neuroblastoma growth, migration, and drug resistance. (a) ZRF1 levels in neuroblastoma cells transfected with siRNA control and 4 different siZRF1. Actin-normalized densitometry quantification of ZRF1 levels is shown beneath their respective ZRF1 knockdown validation Western blot panels (b) Cell viability assay in neuroblastoma cells transfected comparing siControl vs siZRF1 at 96h post-transfection. (c) Wound-healing assay in siZRF1 transfected neuroblastoma cells at 72 h post-transfection. (d) Invasion assay through a collagen barrier of siZRF1 transfected cells at 72 h post-transfection. Left, crystal violet quantification of invaded cells. Right, representative images of the invasion assay. (e) Cisplatin (left), topotecan (middle), and retinoic acid (right) resistance assay of siZRF1-transfected cell lines. Cells were treated after 72 h of transfection at the indicated doses for 72 h more and proliferation was assessed by crystal violet staining.
Cancers 13 04845 g006
Publisher’s Note: MDPI stays neutral with regard to jurisdictional claims in published maps and institutional affiliations.

