
Gene Expression Signature Associated with Clinical Outcome in ALK-Positive Anaplastic Large Cell Lymphoma

 , , and
Abstract
:Simple Summary
Abstract
1. Introduction
2. Materials and Methods
2.1. Patient Characteristics and Tumor Samples
2.2. Microarrays
2.3. RNA-Sequencing Data
2.4. Validation of Microarray Signature Using High-Throughput Quantitative PCR Method
2.5. Clinical Outcome Based on High-Throughput RT-qPCR Data
2.6. Transcripts Quantification and Differential Expression Analysis
3. Results
3.1. Clinical and Pathological Characteristics of Patients
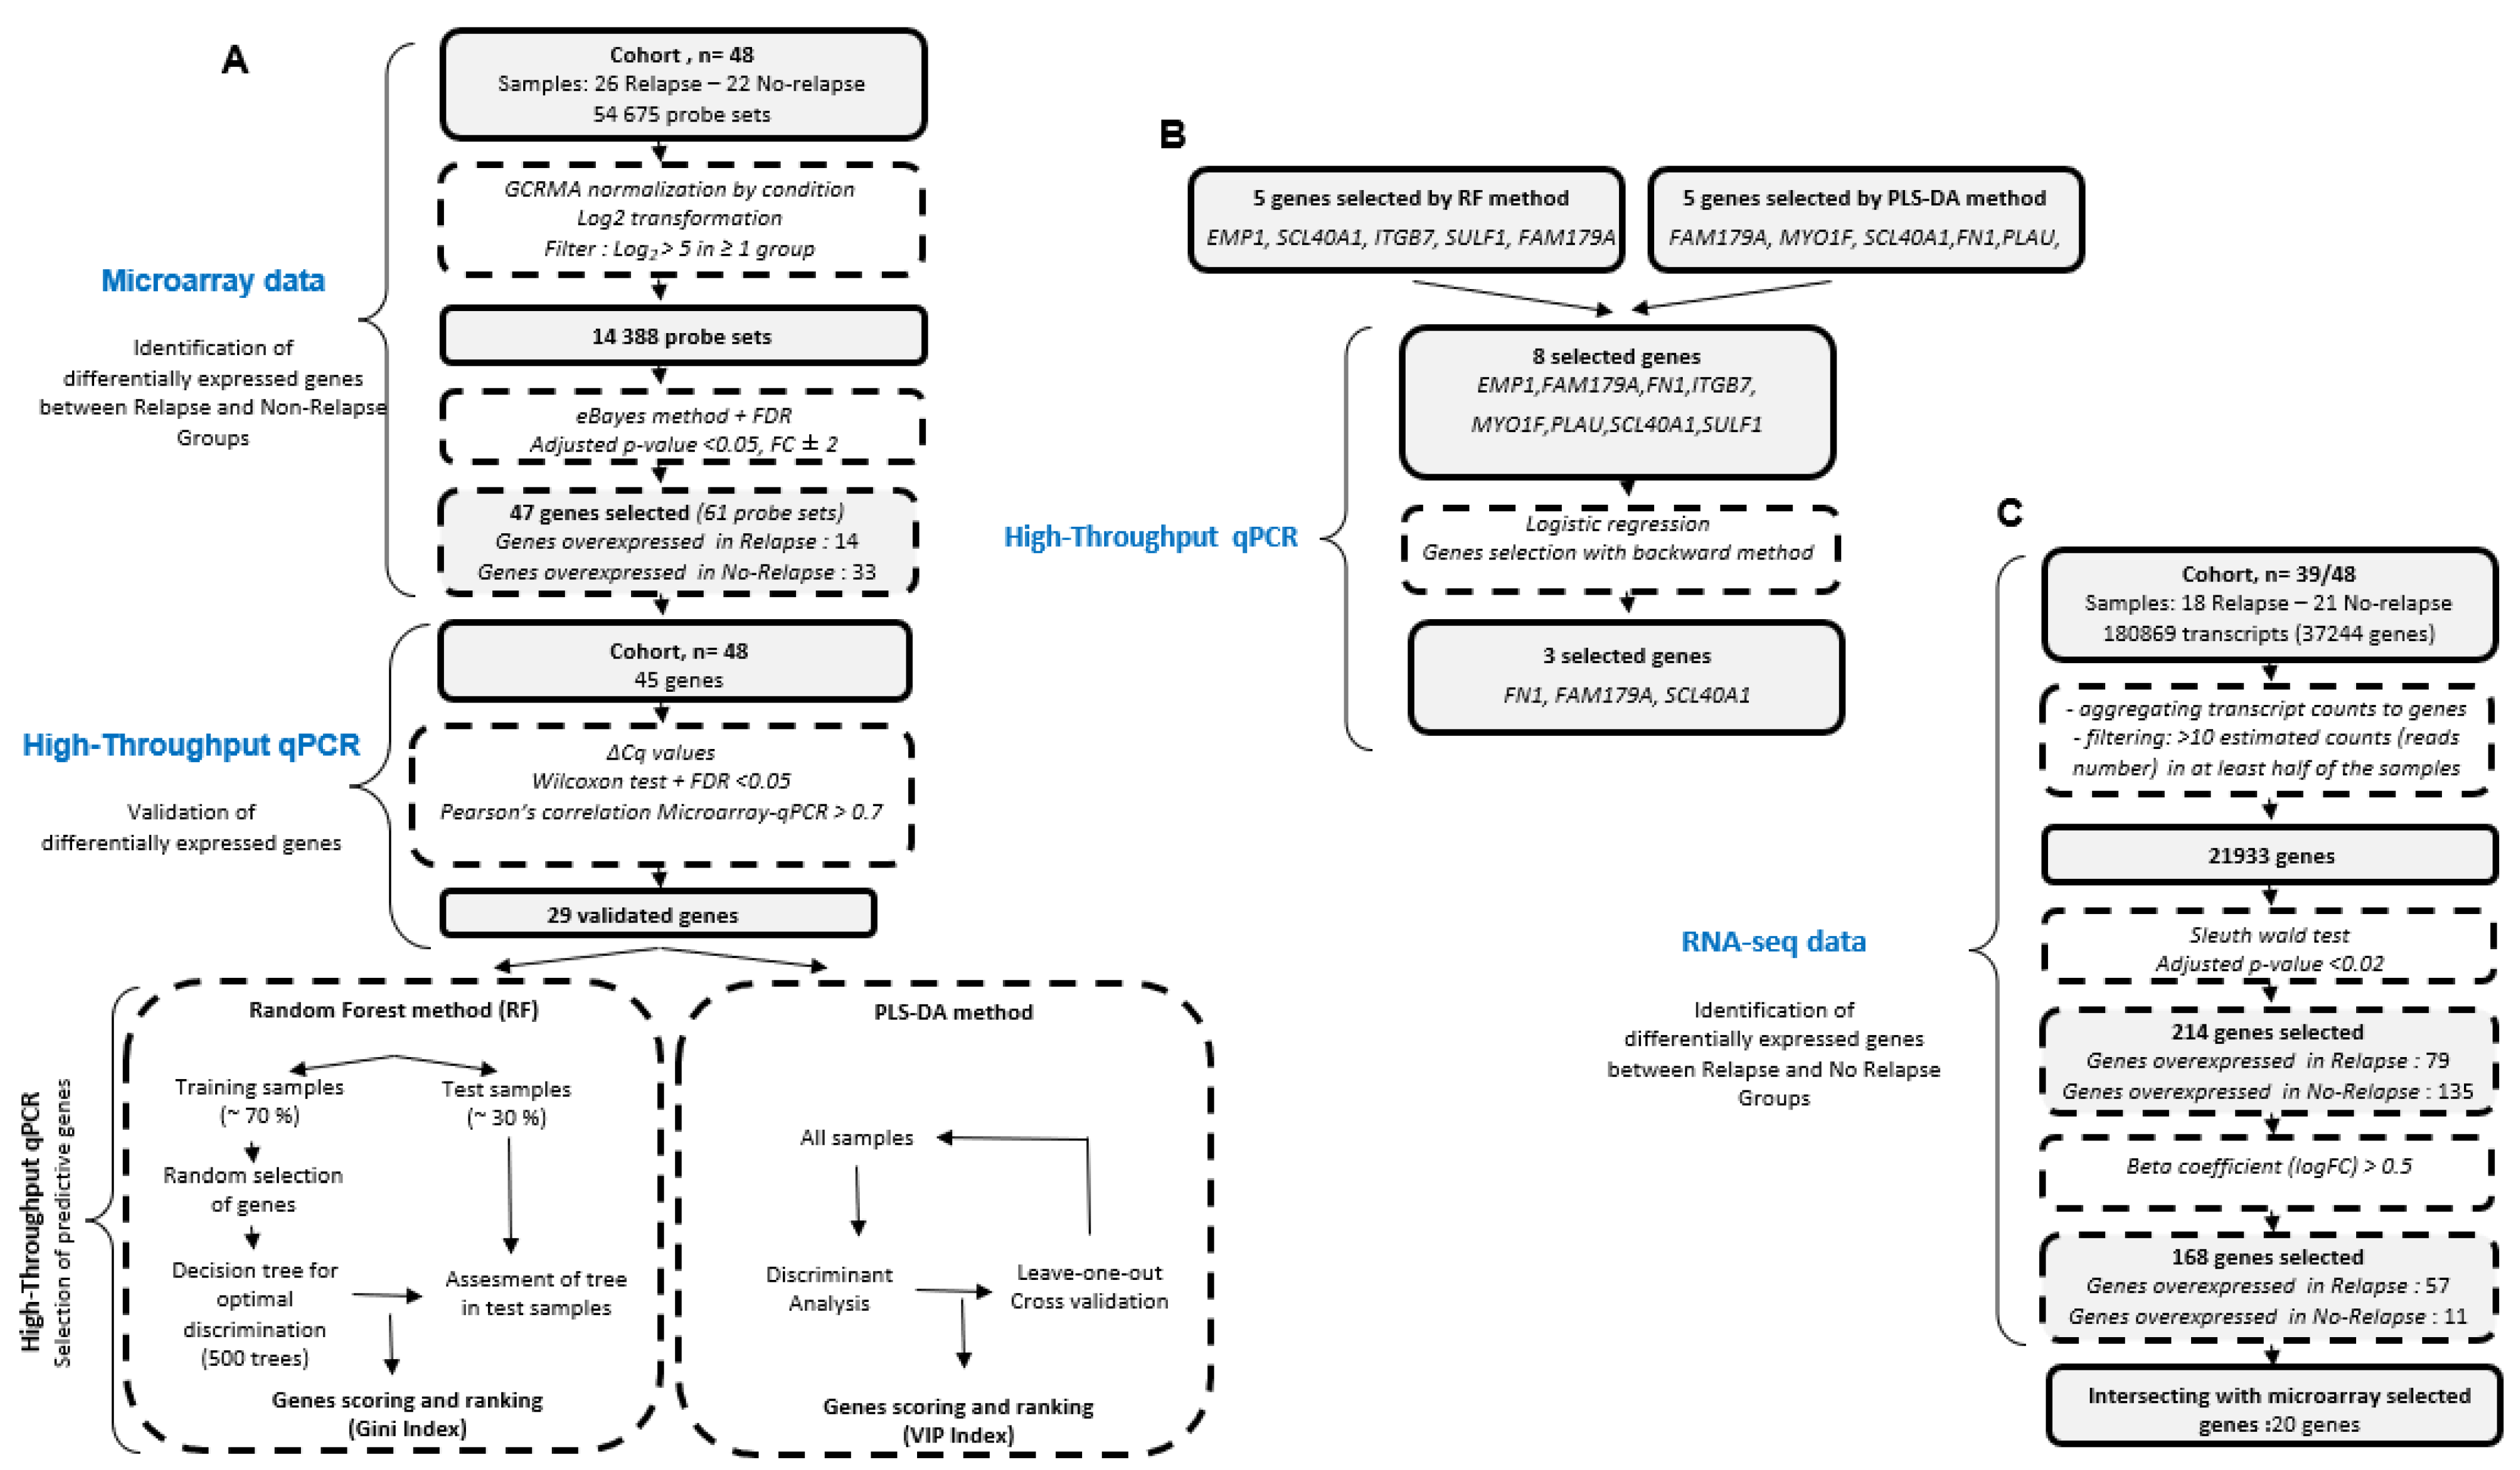
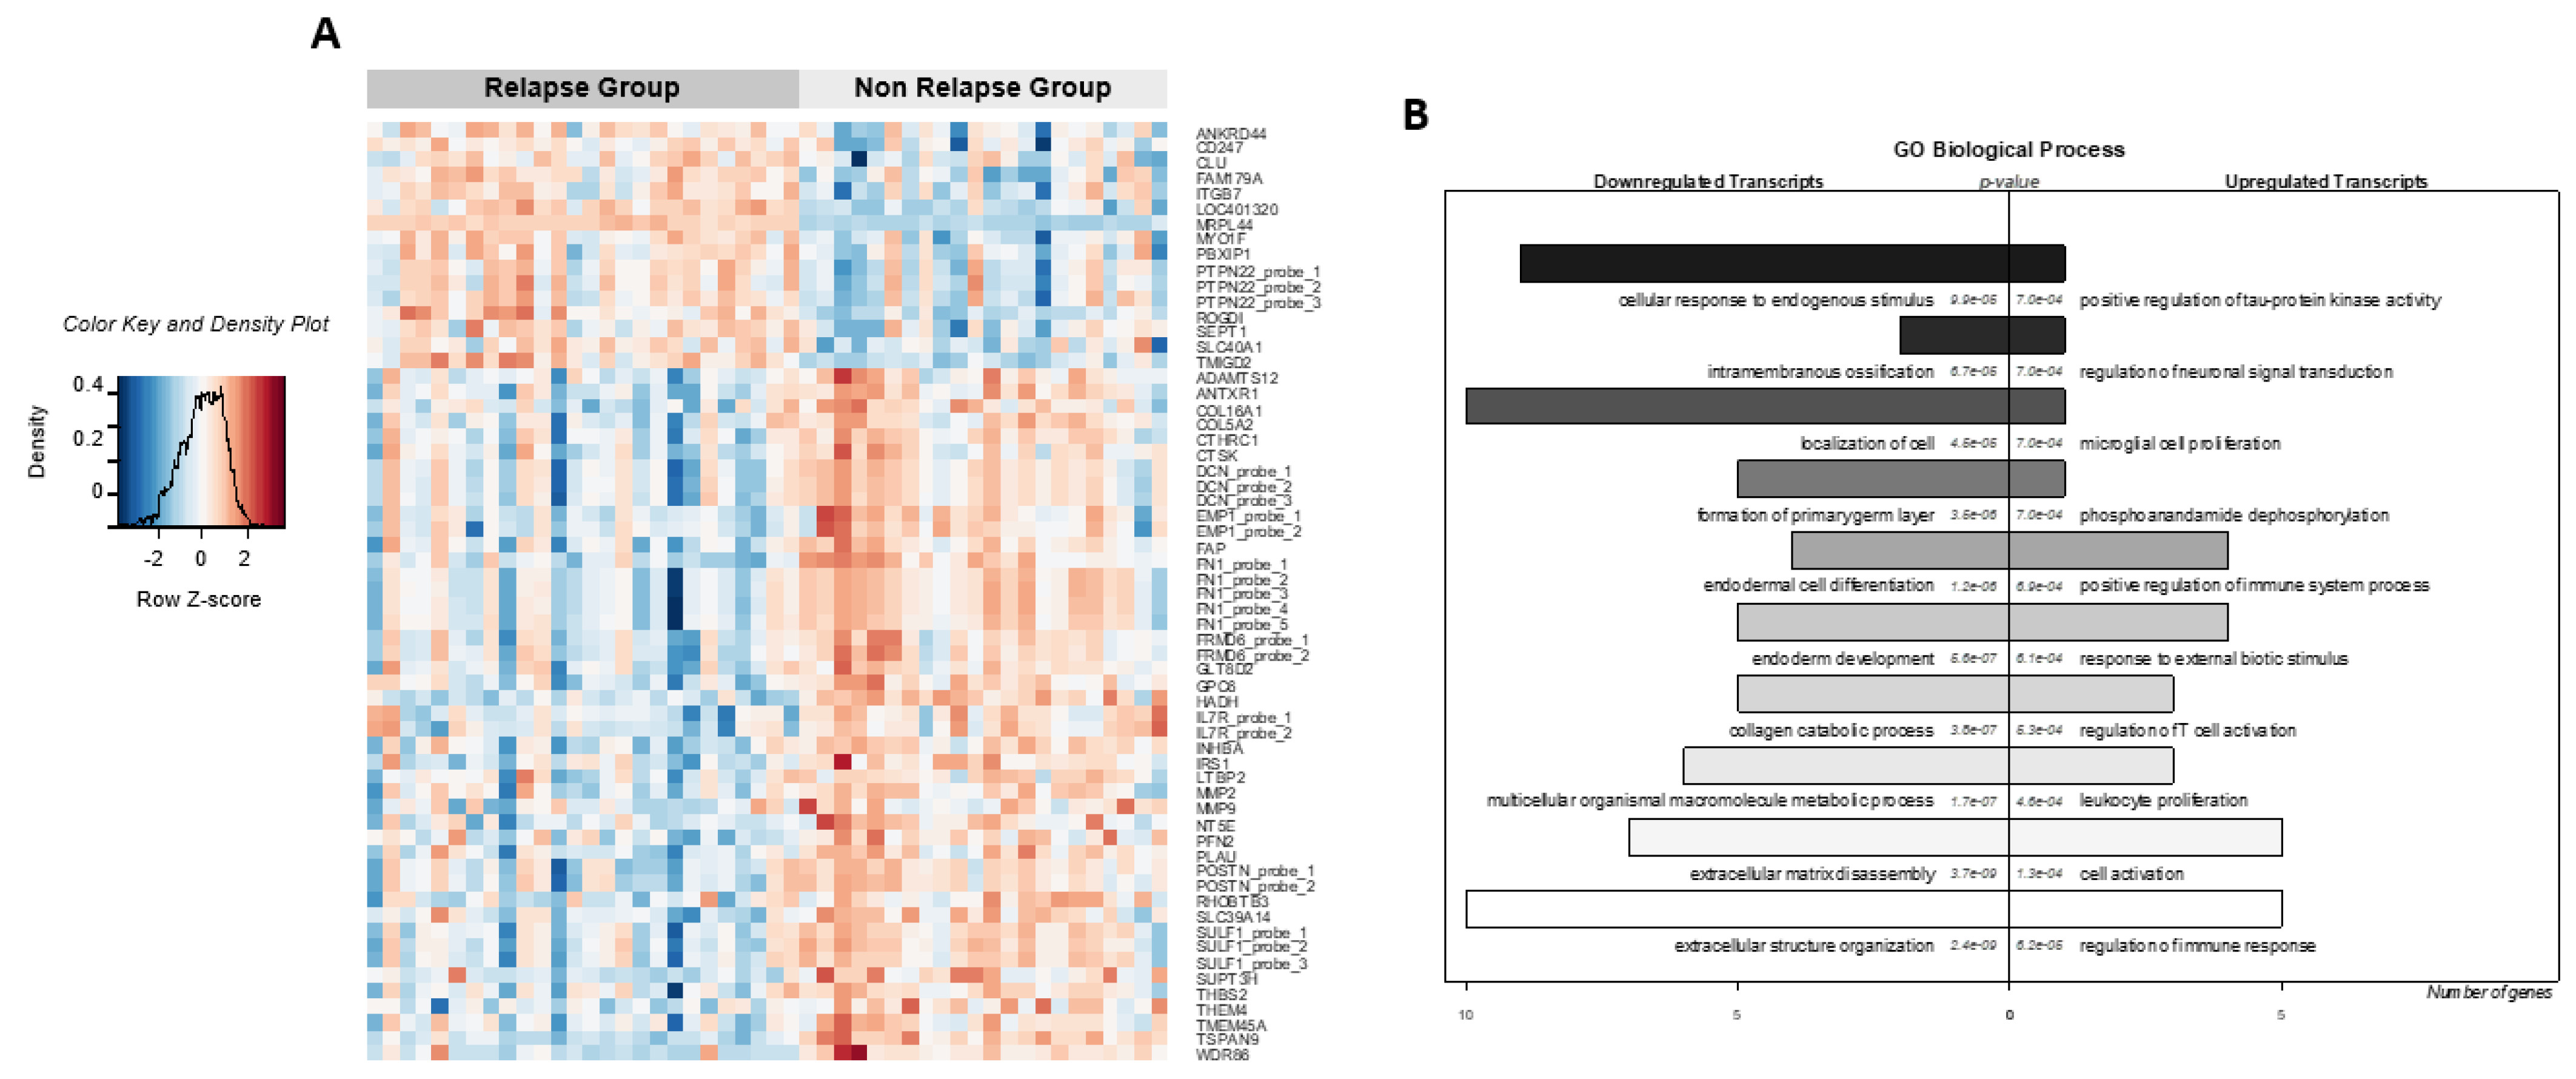
3.2. Molecular Signatures from Microarray Data Associated with Clinical Outcome
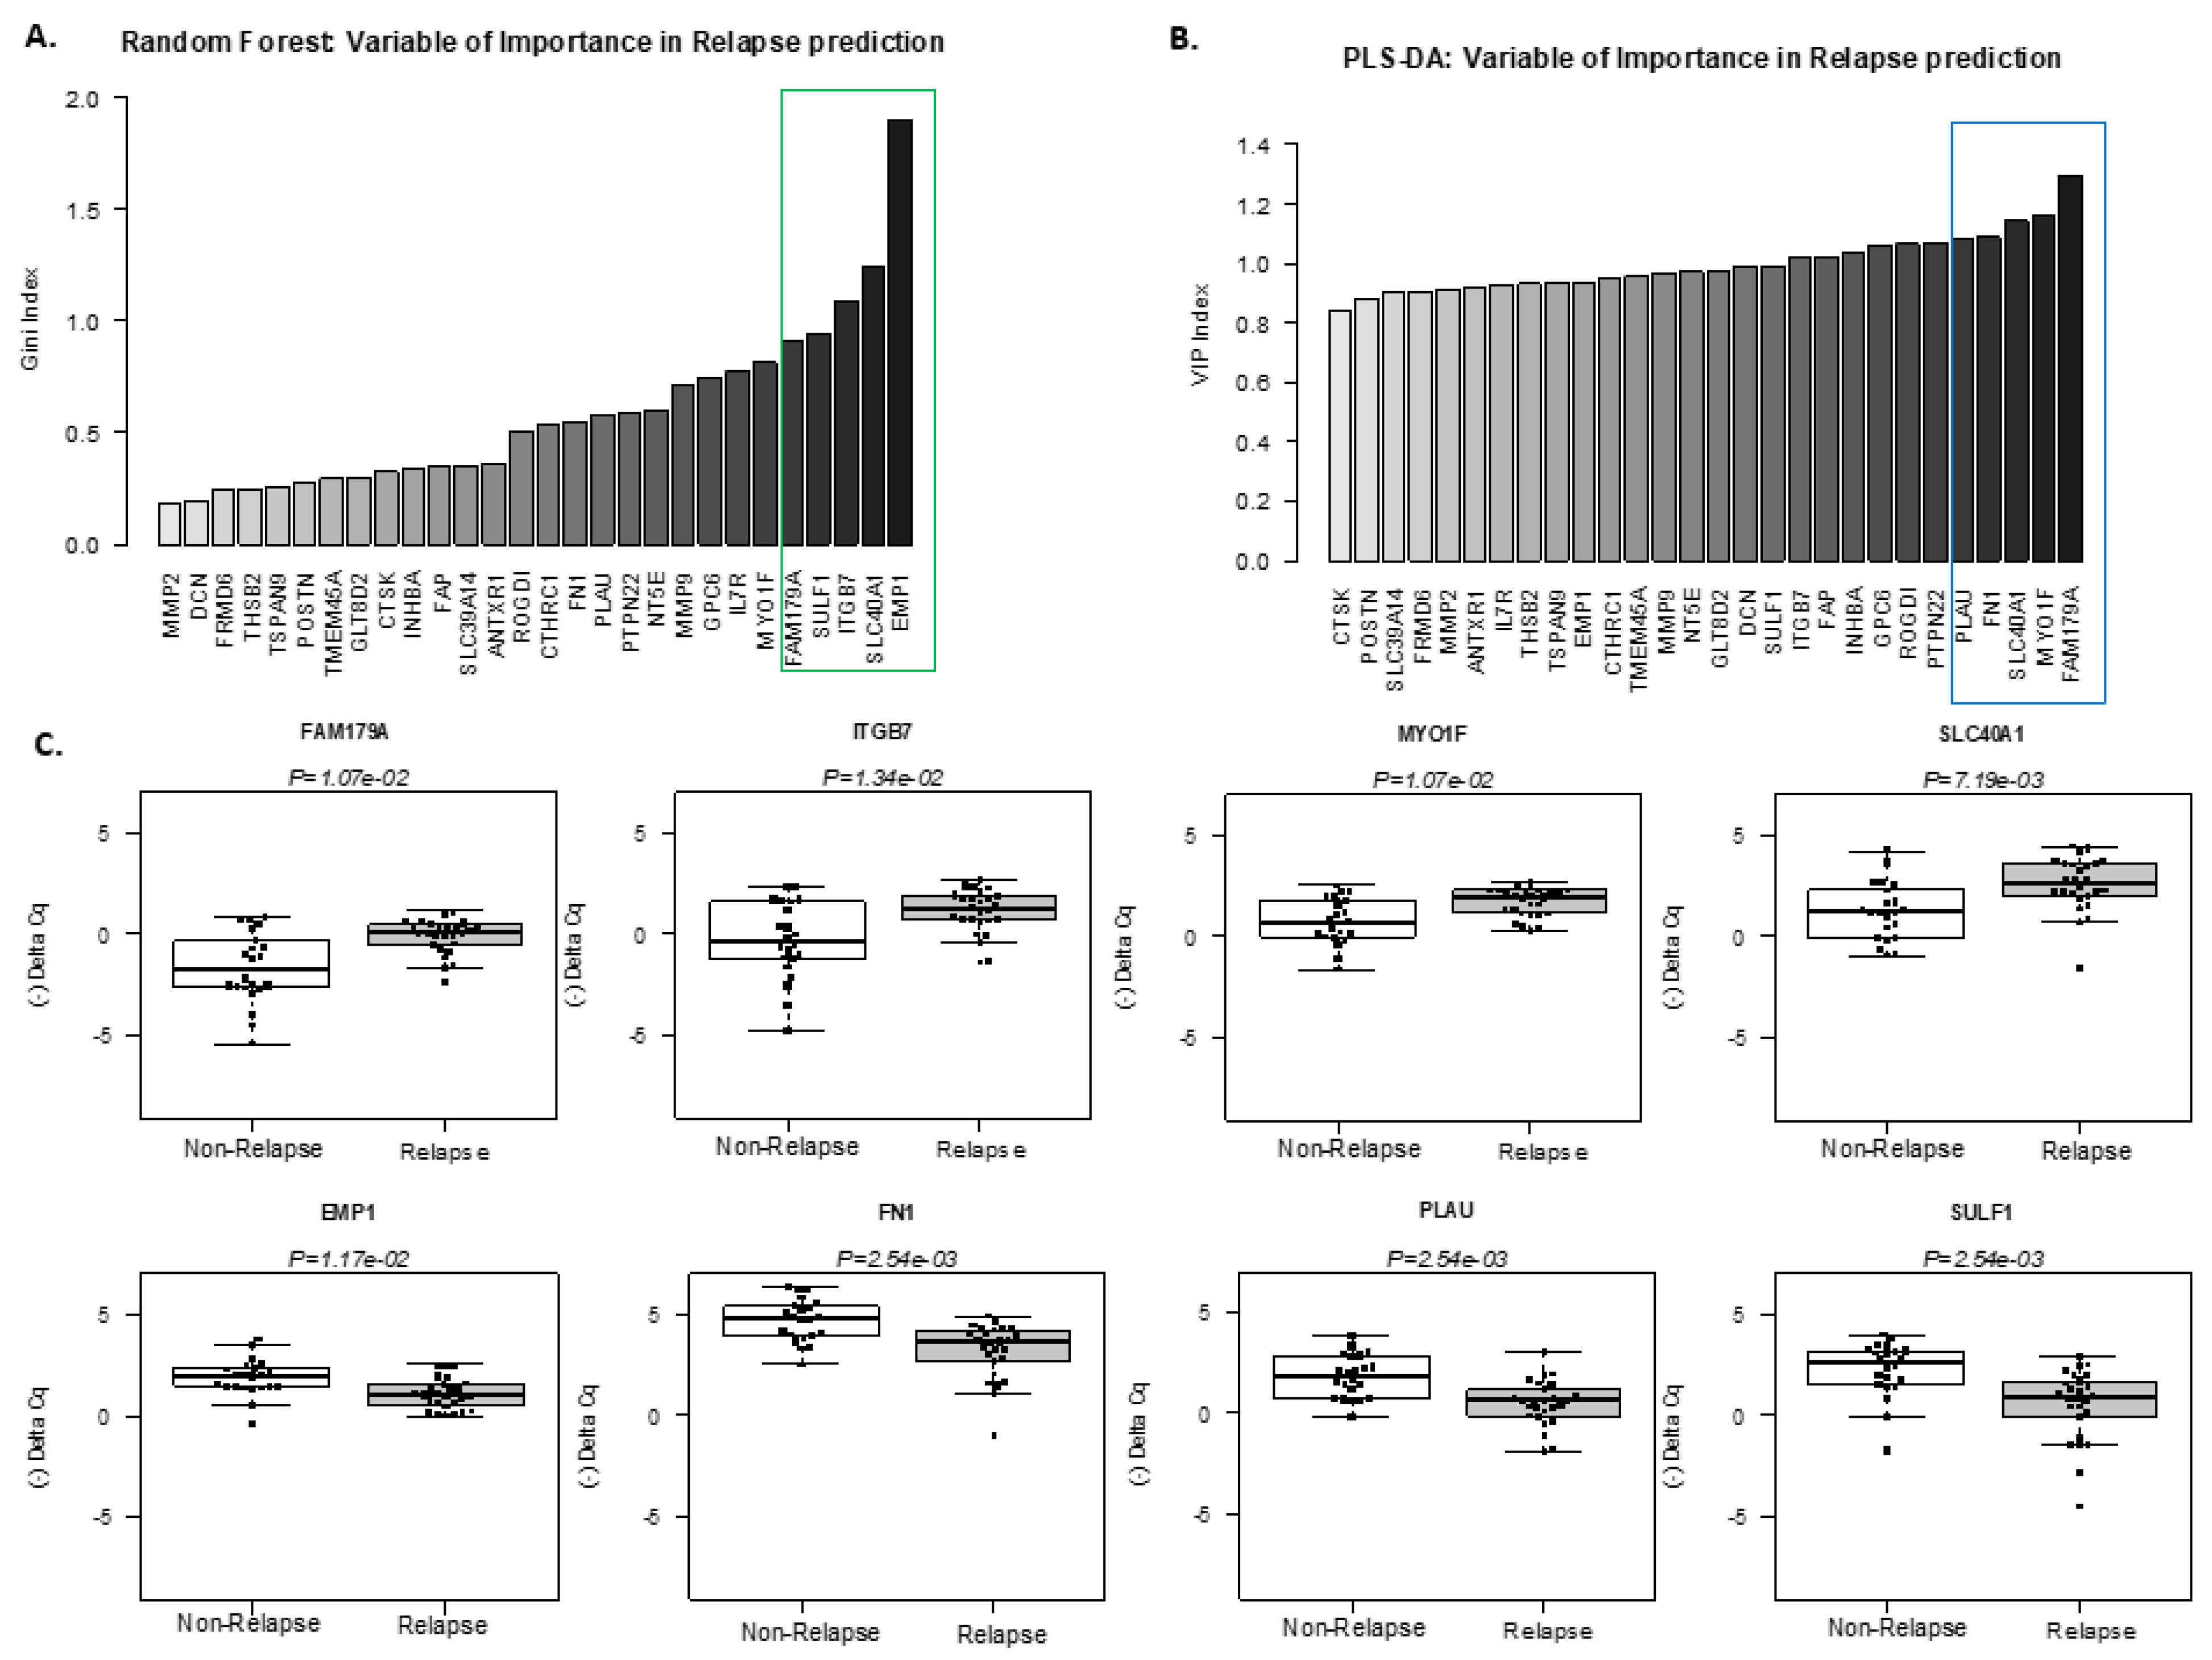
3.3. Identification of a Minimum Set of Genes Associated with Clinical Outcome
3.4. Transcripts Quantification with Pseudo-Alignment and Differential Expression Analysis by Total RNA-Sequencing
4. Discussion
5. Conclusions
Supplementary Materials
Author Contributions
Funding
Institutional Review Board Statement
Informed Consent Statement
Data Availability Statement
Acknowledgments
Conflicts of Interest
References
- Falini, B.; Lamant, L.; Campo, E.; Jaffe, E.S.; Gascoyne, R.D.; Stein, H.; Müller-Hermelink, H.K.; Kinney, M.C. Anaplastic large cell lymphoma, alk positive. In Who Classification of Tumors of Hematopoietic and Lymphoid Tissues; Swerdlow, S.H., Campo, E., Harris, N.L., Jaffe, E.S., Pileri, S.A., Stein, H., Eds.; IARC: Lyon, France, 2017; pp. 413–418. [Google Scholar]
- Bonzheim, I.; Steinhilber, J.; Fend, F.; Lamant, L.; Quintanilla-Martinez, L. Alk-positive anaplastic large cell lymphoma: An evolving story. Front. Biosci. 2015, 7, 248–259. [Google Scholar]
- Brugieres, L.; Deley, M.C.; Pacquement, H.; Meguerian-Bedoyan, Z.; Terrier-Lacombe, M.J.; Robert, A.; Pondarre, C.; Leverger, G.; Devalck, C.; Rodary, C.; et al. Cd30(+) anaplastic large-cell lymphoma in children: Analysis of 82 patients enrolled in two consecutive studies of the french society of pediatric oncology. Blood 1998, 92, 3591–3598. [Google Scholar]
- Laver, J.H.; Kraveka, J.M.; Hutchison, R.E.; Chang, M.; Kepner, J.; Schwenn, M.; Tarbell, N.; Desai, S.; Weitzman, S.; Weinstein, H.J.; et al. Advanced-stage large-cell lymphoma in children and adolescents: Results of a randomized trial incorporating intermediate-dose methotrexate and high-dose cytarabine in the maintenance phase of the apo regimen: A pediatric oncology group phase iii trial. J. Clin. Oncol. 2005, 23, 541–547. [Google Scholar] [CrossRef]
- Mori, T.; Kiyokawa, N.; Shimada, H.; Miyauchi, J.; Fujimoto, J. Anaplastic large cell lymphoma in japanese children: Retrospective analysis of 34 patients diagnosed at the national research institute for child health and development. Br. J. Haematol. 2003, 121, 94–96. [Google Scholar] [CrossRef]
- Reiter, A.; Schrappe, M.; Tiemann, M.; Parwaresch, R.; Zimmermann, M.; Yakisan, E.; Dopfer, R.; Bucsky, P.; Mann, G.; Gadner, H.; et al. Successful treatment strategy for ki-1 anaplastic large-cell lymphoma of childhood: A prospective analysis of 62 patients enrolled in three consecutive berlin-frankfurt-munster group studies. J. Clin. Oncol. 1994, 12, 899–908. [Google Scholar] [CrossRef]
- Rosolen, A.; Pillon, M.; Garaventa, A.; Burnelli, R.; d’Amore, E.S.; Giuliano, M.; Comis, M.; Cesaro, S.; Tettoni, K.; Moleti, M.L.; et al. Anaplastic large cell lymphoma treated with a leukemia-like therapy: Report of the italian association of pediatric hematology and oncology (aieop) lnh-92 protocol. Cancer 2005, 104, 2133–2140. [Google Scholar] [CrossRef] [PubMed]
- Seidemann, K.; Tiemann, M.; Schrappe, M.; Yakisan, E.; Simonitsch, I.; Janka-Schaub, G.; Dorffel, W.; Zimmermann, M.; Mann, G.; Gadner, H.; et al. Short-pulse b-non-hodgkin lymphoma-type chemotherapy is efficacious treatment for pediatric anaplastic large cell lymphoma: A report of the berlin-frankfurt-munster group trial nhl-bfm 90. Blood 2001, 97, 3699–3706. [Google Scholar] [CrossRef]
- Sibon, D.; Fournier, M.; Briere, J.; Lamant, L.; Haioun, C.; Coiffier, B.; Bologna, S.; Morel, P.; Gabarre, J.; Hermine, O.; et al. Long-term outcome of adults with systemic anaplastic large-cell lymphoma treated within the groupe d’etude des lymphomes de l’adulte trials. J. Clin. Oncol. 2012, 30, 3939–3946. [Google Scholar] [CrossRef] [PubMed]
- Williams, D.M.; Hobson, R.; Imeson, J.; Gerrard, M.; McCarthy, K.; Pinkerton, C.R.; United Kingdom Children’s Cancer Study Group. Anaplastic large cell lymphoma in childhood: Analysis of 72 patients treated on the united kingdom children’s cancer study group chemotherapy regimens. Br. J. Haematol. 2002, 117, 812–820. [Google Scholar] [CrossRef] [PubMed]
- Mussolin, L.; Le Deley, M.C.; Carraro, E.; Damm-Welk, C.; Attarbaschi, A.; Williams, D.; Burke, A.; Horibe, K.; Nakazawa, A.; Wrobel, G.; et al. Prognostic factors in childhood anaplastic large cell lymphoma: Long term results of the international alcl99 trial. Cancers 2020, 12, 2747. [Google Scholar] [CrossRef]
- Rigaud, C.; Abbas, R.; Grand, D.; Minard-Colin, V.; Aladjidi, N.; Buchbinder, N.; Garnier, N.; Plat, G.; Couec, M.L.; Duplan, M.; et al. Should treatment of alk-positive anaplastic large cell lymphoma be stratified according to minimal residual disease? Pediatr. Blood Cancer 2021, 68, e28982. [Google Scholar] [CrossRef]
- Ait-Tahar, K.; Damm-Welk, C.; Burkhardt, B.; Zimmermann, M.; Klapper, W.; Reiter, A.; Pulford, K.; Woessmann, W. Correlation of the autoantibody response to the alk oncoantigen in pediatric anaplastic lymphoma kinase-positive anaplastic large cell lymphoma with tumor dissemination and relapse risk. Blood 2010, 115, 3314–3319. [Google Scholar] [CrossRef] [PubMed]
- Damm-Welk, C.; Busch, K.; Burkhardt, B.; Schieferstein, J.; Viehmann, S.; Oschlies, I.; Klapper, W.; Zimmermann, M.; Harbott, J.; Reiter, A.; et al. Prognostic significance of circulating tumor cells in bone marrow or peripheral blood as detected by qualitative and quantitative pcr in pediatric npm-alk-positive anaplastic large-cell lymphoma. Blood 2007, 110, 670–677. [Google Scholar] [CrossRef]
- Damm-Welk, C.; Mussolin, L.; Zimmermann, M.; Pillon, M.; Klapper, W.; Oschlies, I.; d’Amore, E.S.; Reiter, A.; Woessmann, W.; Rosolen, A. Early assessment of minimal residual disease identifies patients at very high relapse risk in npm-alk-positive anaplastic large-cell lymphoma. Blood 2014, 123, 334–337. [Google Scholar] [CrossRef]
- Mussolin, L.; Damm-Welk, C.; Pillon, M.; Zimmermann, M.; Franceschetto, G.; Pulford, K.; Reiter, A.; Rosolen, A.; Woessmann, W. Use of minimal disseminated disease and immunity to npm-alk antigen to stratify alk-positive alcl patients with different prognosis. Leukemia 2013, 27, 416–422. [Google Scholar] [CrossRef] [PubMed]
- Lamant, L.; McCarthy, K.; d’Amore, E.; Klapper, W.; Nakagawa, A.; Fraga, M.; Maldyk, J.; Simonitsch-Klupp, I.; Oschlies, I.; Delsol, G.; et al. Prognostic impact of morphologic and phenotypic features of childhood alk-positive anaplastic large-cell lymphoma: Results of the alcl99 study. J. Clin. Oncol. 2011, 29, 4669–4676. [Google Scholar] [CrossRef] [PubMed]
- Le Deley, M.C.; Rosolen, A.; Williams, D.M.; Horibe, K.; Wrobel, G.; Attarbaschi, A.; Zsiros, J.; Uyttebroeck, A.; Marky, I.M.; Lamant, L.; et al. Vinblastine in children and adolescents with high-risk anaplastic large-cell lymphoma: Results of the randomized alcl99-vinblastine trial. J. Clin. Oncol. 2010, 28, 3987–3993. [Google Scholar] [CrossRef]
- Le Deley, M.C.; Reiter, A.; Williams, D.; Delsol, G.; Oschlies, I.; McCarthy, K.; Zimmermann, M.; Brugieres, L.; European Intergroup for Childhood Non-Hodgkin Lymphoma. Prognostic factors in childhood anaplastic large cell lymphoma: Results of a large european intergroup study. Blood 2008, 111, 1560–1566. [Google Scholar] [CrossRef]
- Lamant, L.; de Reynies, A.; Duplantier, M.M.; Rickman, D.S.; Sabourdy, F.; Giuriato, S.; Brugieres, L.; Gaulard, P.; Espinos, E.; Delsol, G. Gene-expression profiling of systemic anaplastic large-cell lymphoma reveals differences based on alk status and two distinct morphologic alk+ subtypes. Blood 2007, 109, 2156–2164. [Google Scholar] [CrossRef]
- Cope, L.M.; Irizarry, R.A.; Jaffee, H.A.; Wu, Z.; Speed, T.P. A benchmark for affymetrix genechip expression measures. Bioinformatics 2004, 20, 323–331. [Google Scholar] [CrossRef] [PubMed]
- Wu, Z.; Irizarry, R.A. Preprocessing of oligonucleotide array data. Nat. Biotechnol. 2004, 22, 656–658, author reply 658. [Google Scholar] [CrossRef] [PubMed]
- Abruzzo, L.V.; Lee, K.Y.; Fuller, A.; Silverman, A.; Keating, M.J.; Medeiros, L.J.; Coombes, K.R. Validation of oligonucleotide microarray data using microfluidic low-density arrays: A new statistical method to normalize real-time rt-pcr data. Biotechniques 2005, 38, 785–792. [Google Scholar] [CrossRef]
- Smyth, G.K. Linear models and empirical bayes methods for assessing differential expression in microarray experiments. Stat. Appl. Genet. Mol. Biol. 2004, 3, 3. [Google Scholar] [CrossRef]
- Benjamini, Y.; Drai, D.; Elmer, G.; Kafkafi, N.; Golani, I. Controlling the false discovery rate in behavior genetics research. Behav. Brain Res. 2001, 125, 279–284. [Google Scholar] [CrossRef]
- Falcon, S.; Gentleman, R. Using gostats to test gene lists for go term association. Bioinformatics 2007, 23, 257–258. [Google Scholar] [CrossRef]
- Laurell, H.; Iacovoni, J.S.; Abot, A.; Svec, D.; Maoret, J.J.; Arnal, J.F.; Kubista, M. Correction of rt-qpcr data for genomic DNA-derived signals with validprime. Nucleic Acids Res. 2012, 40, e51. [Google Scholar] [CrossRef]
- Korenkova, V.; Scott, J.; Novosadova, V.; Jindrichova, M.; Langerova, L.; Svec, D.; Sidova, M.; Sjoback, R. Pre-amplification in the context of high-throughput qpcr gene expression experiment. BMC Mol. Biol. 2015, 16, 5. [Google Scholar] [CrossRef]
- Bryan, K.; Brennan, L.; Cunningham, P. Metafind: A feature analysis tool for metabolomics data. BMC Bioinform. 2008, 9, 470. [Google Scholar] [CrossRef] [PubMed]
- Breiman, L. Machine Learning. Mach. Learn. 2001, 45, 5–32. [Google Scholar] [CrossRef]
- Bray, N.L.; Pimentel, H.; Melsted, P.; Pachter, L. Near-optimal probabilistic rna-seq quantification. Nat. Biotechnol. 2016, 34, 525–527. [Google Scholar] [CrossRef]
- Pimentel, H.; Bray, N.L.; Puente, S.; Melsted, P.; Pachter, L. Differential analysis of rna-seq incorporating quantification uncertainty. Nat. Methods 2017, 14, 687–690. [Google Scholar] [CrossRef]
- Malcolm, T.I.; Villarese, P.; Fairbairn, C.J.; Lamant, L.; Trinquand, A.; Hook, C.E.; Burke, G.A.; Brugieres, L.; Hughes, K.; Payet, D.; et al. Anaplastic large cell lymphoma arises in thymocytes and requires transient tcr expression for thymic egress. Nat. Commun. 2016, 7, 10087. [Google Scholar] [CrossRef]
- Riquier, S.; Mathieu, M.; Bessiere, C.; Boureux, A.; Ruffle, F.; Lemaitre, J.M.; Djouad, F.; Gilbert, N.; Commes, T. Long non-coding rna exploration for mesenchymal stem cell characterisation. BMC Genom. 2021, 22, 412. [Google Scholar] [CrossRef] [PubMed]
- Brugieres, L.; Quartier, P.; Le Deley, M.C.; Pacquement, H.; Perel, Y.; Bergeron, C.; Schmitt, C.; Landmann, J.; Patte, C.; Terrier-Lacombe, M.J.; et al. Relapses of childhood anaplastic large-cell lymphoma: Treatment results in a series of 41 children--a report from the french society of pediatric oncology. Ann. Oncol. 2000, 11, 53–58. [Google Scholar] [CrossRef] [PubMed]
- Bonnans, C.; Chou, J.; Werb, Z. Remodelling the extracellular matrix in development and disease. Nat. Rev. Mol. Cell Biol. 2014, 15, 786–801. [Google Scholar] [CrossRef] [PubMed]
- Hazlehurst, L.A.; Dalton, W.S. Mechanisms associated with cell adhesion mediated drug resistance (cam-dr) in hematopoietic malignancies. Cancer Metastasis Rev. 2001, 20, 43–50. [Google Scholar] [CrossRef] [PubMed]
- Lopez-Otin, C.; Matrisian, L.M. Emerging roles of proteases in tumour suppression. Nat. Rev. Cancer 2007, 7, 800–808. [Google Scholar] [CrossRef]
- Lenz, G.; Wright, G.; Dave, S.S.; Xiao, W.; Powell, J.; Zhao, H.; Xu, W.; Tan, B.; Goldschmidt, N.; Iqbal, J.; et al. Stromal gene signatures in large-b-cell lymphomas. N. Engl. J. Med. 2008, 359, 2313–2323. [Google Scholar] [CrossRef]


| Non_Relapsing Group n = 22 | Relapsing Group n = 26 | |||||||
|---|---|---|---|---|---|---|---|---|
| Cox Univariate Analysis | ||||||||
| Characteristics | n | % | n | % | RR | 95% CI | p-Value Likehood Ratio | |
| Gender | 0.76 | 0.34–1.69 | 0.51 | |||||
| Male | 15 | 68.2 | 16 | 61.5 | ||||
| Female | 7 | 31.8 | 10 | 38.5 | ||||
| Age (years) † | 0.5134 | 0.23–1.32 | 0.09302 | |||||
| Median | 15 | 10 | ||||||
| Range | 6–44 | 2–50 | ||||||
| St_Jude Stage †† | 1.405 | 0.51–3.84 | 0.49 | |||||
| I–II | 4 | 18.2 | 5 | 19.2 | ||||
| III–IV | 9 | 40.9 | 16 | 61.5 | ||||
| Ann Arbor Stage †† | 1.92 | 0.80–4.61 | 0.1266 | |||||
| I–II | 11 | 50.0 | 7 | 26.9 | ||||
| III–IV | 11 | 50.0 | 18 | 69.2 | ||||
| IPI score †† | 2.676 | 1.002–7.15 | 0.04183 | |||||
| 0–1 | 11 | 50.0 | 6 | 23.1 | ||||
| 2–3 | 5 | 22.7 | 12 | 46.2 | ||||
| LDH †† | 4.46 | 1.76–11.2 | 0.00422 | |||||
| <2 × ULN | 20 | 90.9 | 15 | 57.7 | ||||
| ≥2 × ULN | 1 | 4.5 | 7 | 26.9 | ||||
| Morphological subtype | 1.93 | 0.86–4.35 | 0.1018 | |||||
| Common Type | 13 | 59.1 | 9 | 34.6 | ||||
| SC/LH | 9 | 40.9 | 17 | 65.4 | ||||
| Fusion partner | 1.32 | 0.13–3.2 | 0.6934 | |||||
| NPM | 20 | 90.9 | 24 | 92.3 | ||||
| Others | 2 | 9.1 | 2 | 7.7 | ||||
| Peripheral lymph nodes †† | ||||||||
| No | 1 | 4.5 | 19 | 73.1 | ||||
| Yes | 11 | 50.0 | 0 | 0.0 | ||||
| Mediastinal involvement †† | 1.03 | 0.42–2.55 | 0.9411 | |||||
| No | 5 | 22.7 | 9 | 34.6 | ||||
| Yes | 7 | 31.8 | 10 | 38.5 | ||||
| Visceral involvement (spleen. liver or lung involvement) | 2.139 | 0.98–4.67 | 0.05414 | |||||
| No | 15 | 68.2 | 11 | 42.3 | ||||
| Yes | 7 | 31.8 | 15 | 57.7 | ||||
| Spleen involvement †† | ||||||||
| No | 18 | 81.8 | 20 | 76.9 | ||||
| Yes | 4 | 18.2 | 5 | 19.2 | ||||
| Liver involvement †† | ||||||||
| No | 20 | 90.9 | 19 | 73.1 | ||||
| Yes | 2 | 9.1 | 6 | 23.1 | ||||
| Lung involvement †† | ||||||||
| No | 18 | 81.8 | 14 | 53.8 | ||||
| Yes | 4 | 18.2 | 11 | 42.3 | ||||
| Other Visceral involvement †† | ||||||||
| No | 17 | 77.3 | 13 | 50.0 | ||||
| Yes | 5 | 22.7 | 13 | 50.0 | ||||
| Skin lesion †† | 1.11 | 0.46–2.69 | 0.8131 | |||||
| No | 18 | 81.8 | 17 | 65.4 | ||||
| Yes | 4 | 18.2 | 7 | 26.9 | ||||
| Clinical high risk group †† (spleen or/and liver or/and lung or/and mediastinal involvement or/and skin lesions) | 1.13 | 0.45–2.83 | 0.7843 | |||||
| No | 4 | 18.2 | 6 | 23.1 | ||||
| Yes | 12 | 54.5 | 20 | 76.9 | ||||
| Bone lesions †† | 0.96 | 0.33–2.79 | 0.9344 | |||||
| No | 19 | 86.4 | 21 | 80.8 | ||||
| Yes | 3 | 13.6 | 4 | 15.4 | ||||
| Bone marrow involvement †† | 1.062 | 0.41–2.83 | 0.9049 | |||||
| No | 17 | 77.3 | 21 | 80.8 | ||||
| Yes | 3 | 13.6 | 4 | 15.4 | ||||
| CNS involvement †† | 1.172 | 0.16–8.68 | 0.8793 | |||||
| No | 21 | 95.5 | 24 | 92.3 | ||||
| Yes | 1 | 4.5 | 1 | 3.8 | ||||
| Soft tissue mass †† | 2.53 | 0.594–10.78 | 0.2676 | |||||
| No | 21 | 95.5 | 23 | 88.5 | ||||
| Yes | 1 | 4.5 | 2 | 7.7 | ||||
| CD3 positivity †† | 0.73 | 0.27–1.97 | 0.53 | |||||
| Negative | 14 | 63.6 | 19 | 73.1 | ||||
| Positive | 6 | 27.3 | 5 | 19.2 | ||||
| MDD †† | 10.23 | 1.34–78.02 | 0.001735 | |||||
| Negative | 6 | 27.3 | 1 | 3.8 | ||||
| Positive | 3 | 13.6 | 17 | 65.4 | ||||
| Microarray HG-U133-Plus2.0 | Fluidigm Data | RNAseq Kallisto/Sleuth DE | ||||||||||||||||||||
|---|---|---|---|---|---|---|---|---|---|---|---|---|---|---|---|---|---|---|---|---|---|---|
| Mean Log 2 Intensity | Mean (-Delta)Cq | Wilcoxon | Correlation Microarray-Fluidigm | Sleuth Wald Test | Mean Expression (tpm) | |||||||||||||||||
| ProbeSet | GeneSymbol | NR | R | FC R vs. NR | logFC R vs. NR | p Value | Adjusted p Value (BH) | Mean No_Relapse | Mean Relapse | FC R vs. NR | logFC R vs. NR | p Value | Adjusted p Value (BH) | Pearson Correlation r | r² | p Value | Corresp. ENSG | p Value | Adjusted p Value (BH) | b (Effect Size ~ logFC Estimator) R vs. NR | Mean No_Relapse | Mean Relapse |
| 228471_at | ANKRD44 | 7.71 | 8.76 | 2.07 | 1.05 | 1.08 × 10⁻³ | 3.11 × 10⁻² | 0.4 | 1.09 | 1.61 | 0.69 | 8.97 × 10⁻² | 1.01 × 10⁻¹ | 0.86 | 0.74 | 1.98 × 10⁻¹⁵ | ENSG00000065413.20 | 1.08 × 10⁻² | 1.55 × 10⁻¹ | 0.55 | ||
| 210031_at | CD247 | 7.93 | 9.07 | 2.21 | 1.14 | 2.10 × 10⁻³ | 4.53 × 10⁻² | ENSG00000198821.11 | 3.76 × 10⁻⁴ | 2.59 × 10⁻² | 0.9 | 30.21 | 54.51 | |||||||||
| 222043_at | CLU | 9.4 | 10.47 | 2.09 | 1.07 | 1.59 × 10⁻³ | 3.87 × 10⁻² | 5.21 | 5.9 | 1.61 | 0.69 | 6.67 × 10⁻² | 8.12 × 10⁻² | 0.88 | 0.77 | 1.04 × 10⁻¹⁶ | ENSG00000120885.22 | 2.05 × 10⁻² | 2.17 × 10⁻¹ | 0.56 | ||
| 236717_at | FAM179A | 6.31 | 8.07 | 3.38 | 1.76 | 3.62 × 10⁻⁵ | 3.52 × 10⁻³ | −1.70 | −0.16 | 2.9 | 1.54 | 2.61 × 10⁻³ | 1.07 × 10⁻² | 0.97 | 0.93 | 9.46 × 10⁻²⁹ | ENSG00000189350.13 | 6.80 × 10⁻⁵ | 3.64 × 10⁻³ | 1.23 | 24.44 | 58.53 |
| 205718_at | ITGB7 | 7.13 | 8.6 | 2.77 | 1.47 | 1.78 × 10⁻³ | 4.14 × 10⁻² | −0.36 | 1.07 | 2.7 | 1.43 | 5.35 × 10⁻³ | 1.34 × 10⁻² | 0.97 | 0.95 | 7.59 × 10⁻³¹ | ENSG00000139626.16 | 1.55 × 10⁻⁴ | 1.88 × 10⁻² | 1 | 22.92 | 47.71 |
| 1558459_s_at | LOC401320 | 5.47 | 6.49 | 2.03 | 1.02 | 1.64 × 10⁻⁹ | 1.13 × 10⁻⁵ | −1.51 | −1.02 | 1.4 | 0.49 | 6.26 × 10⁻² | 7.82 × 10⁻² | 0.62 | 0.38 | 1.71 × 10⁻⁵ | ||||||
| 218202_x_at | MRPL44 | 3.45 | 5.69 | 4.73 | 2.24 | 1.08 × 10−36 | 1.55 × 10⁻³² | 1.29 | 1.39 | 1.07 | 0.1 | 1.23 × 10⁻¹ | 1.32 × 10⁻¹ | 0.21 | 0.05 | 7.81 × 10⁻² | ENSG00000135900.4 | NA | NA | NA | ||
| 213733_at | MYO1F | 8.71 | 9.75 | 2.06 | 1.04 | 2.51 × 10⁻⁵ | 2.75 × 10⁻³ | 0.68 | 1.65 | 1.95 | 0.96 | 2.43 × 10⁻³ | 1.07 × 10⁻² | 0.91 | 0.83 | 1.15 × 10⁻¹⁸ | ENSG00000142347.19 | 6.03 × 10⁻⁵ | 1.14 × 10⁻² | 0.51 | 146.59 | 229.13 |
| 212259_s_at | PBXIP1 | 6.74 | 7.74 | 2 | 1 | 2.49 × 10⁻³ | 4.99 × 10⁻² | 0.88 | 1.72 | 1.79 | 0.84 | 3.67 × 10⁻² | 5.51 × 10⁻² | 0.95 | 0.9 | 2.43 × 10⁻²⁵ | ENSG00000163346.17 | 1.90 × 10⁻⁴ | 1.99 × 10⁻² | 0.59 | 15.53 | 26.77 |
| 206060_s_at | PTPN22 | 7.49 | 8.84 | 2.53 | 1.34 | 6.31 × 10⁻⁴ | 2.29 × 10⁻² | 1.39 | 2.52 | 2.18 | 1.13 | 4.35 × 10⁻³ | 1.22 × 10⁻² | 0.93 | 0.87 | 3.21 × 10⁻²² | ENSG00000134242.16 | 2.70 × 10⁻⁵ | 1.79 × 10⁻³ | 0.9 | 43.82 | 93.55 |
| 208010_s_at | PTPN22 | 5.99 | 7.35 | 2.55 | 1.35 | 1.18 × 10⁻³ | 3.26 × 10⁻² | 1.39 | 2.52 | 2.18 | 1.13 | 4.35 × 10⁻³ | 1.22 × 10⁻² | 0.87 | 0.75 | 8.39 × 10⁻¹⁶ | ||||||
| 236539_at | PTPN22 | 7.34 | 8.45 | 2.16 | 1.11 | 1.49 × 10⁻³ | 3.74 × 10⁻² | 1.39 | 2.52 | 2.18 | 1.13 | 4.35 × 10⁻³ | 1.22 × 10⁻² | 0.94 | 0.89 | 9.00 × 10⁻²⁴ | ||||||
| 218394_at | ROGDI | 5.22 | 6.32 | 2.13 | 1.09 | 3.09 × 10⁻⁹ | 1.78 × 10⁻⁵ | −3.38 | −2.75 | 1.55 | 0.63 | 6.50 × 10⁻³ | 1.54 × 10⁻² | 0.76 | 0.58 | 2.13 × 10⁻¹⁰ | ENSG00000067836.13 | 7.75 × 10⁻⁴ | 3.77 × 10⁻² | 0.42 | 6.88 | 10.24 |
| 227552_at | SEPT1 | 6.36 | 7.52 | 2.23 | 1.15 | 2.32 × 10⁻³ | 4.82 × 10⁻² | −0.50 | 0.68 | 2.26 | 1.18 | 5.05 × 10⁻² | 6.89 × 10⁻² | 0.93 | 0.87 | 3.74 × 10⁻²² | ENSG00000180096.12 | 1.51 × 10⁻³ | 5.48 × 10⁻² | 0.64 | ||
| 223044_at | SLC40A1 | 10.78 | 12.03 | 2.38 | 1.25 | 2.57 × 10⁻⁴ | 1.38 × 10⁻² | 1.19 | 2.54 | 2.55 | 1.35 | 1.39 × 10⁻³ | 7.20 × 10⁻³ | 0.94 | 0.89 | 5.92 × 10⁻²⁴ | ENSG00000138449.11 | 1.21 × 10⁻¹ | 4.94 × 10⁻¹ | −0.46 | ||
| 244716_x_at | TMIGD2 | 6.92 | 8.89 | 3.93 | 1.97 | 1.42 × 10⁻¹⁰ | 1.28 × 10⁻⁷ | −2.28 | −0.76 | 2.86 | 1.52 | 3.30 × 10⁻² | 5.13 × 10⁻² | 0.74 | 0.55 | 1.04 × 10⁻⁹ | ENSG00000167664.8 | 4.47 × 10⁻⁴ | 2.80 × 10⁻² | 1.31 | 19.25 | 37.27 |
| 226997_at | ADAMTS12 | 6.88 | 5.79 | 0.47 | −1.08 | 3.61 × 10⁻⁴ | 1.68 × 10⁻² | −0.78 | −1.46 | 0.63 | −0.68 | 4.15 × 10⁻² | 5.84 × 10⁻² | 0.91 | 0.82 | 5.00 × 10⁻¹⁹ | ENSG00000151388.11 | 4.53 × 10⁻⁴ | 2.80 × 10⁻² | −0.56 | 5.49 | 3.14 |
| ADAMTS12 | ENSG00000281690.2 | 2.84 × 10⁻² | 2.54 × 10⁻¹ | −0.45 | 7.05 | 4.54 | ||||||||||||||||
| 224694_at | ANTXR1 | 8.75 | 6.95 | 0.29 | −1.80 | 7.56 × 10⁻⁵ | 6.01 × 10⁻³ | 1.14 | −0.17 | 0.41 | −1.30 | 7.37 × 10⁻³ | 1.66 × 10⁻² | 0.96 | 0.91 | 2.24 × 10⁻²⁶ | ENSG00000169604.20 | 1.15 × 10⁻⁵ | 1.14 × 10⁻³ | −1.18 | 14.29 | 4.45 |
| 204345_at | COL16A1 | 8.15 | 6.98 | 0.45 | −1.17 | 1.16 × 10⁻³ | 3.24 × 10⁻² | 0.78 | 0.05 | 0.6 | −0.73 | 5.30 × 10⁻² | 7.00 × 10⁻² | 0.94 | 0.88 | 6.02 × 10⁻²³ | ENSG00000084636.18 | 5.14 × 10⁻³ | 1.08 × 10⁻¹ | −0.75 | ||
| 221730_at | COL5A2 | 10.87 | 9.71 | 0.45 | −1.16 | 6.60 × 10⁻⁴ | 2.33 × 10⁻² | 2.75 | 1.95 | 0.57 | −0.80 | 3.85 × 10⁻² | 5.59 × 10⁻² | 0.92 | 0.85 | 1.32 × 10⁻²⁰ | ENSG00000204262.14 | 5.87 × 10⁻³ | 1.13 × 10⁻¹ | −0.54 | ||
| 225681_at | CTHRC1 | 11.62 | 10.05 | 0.34 | −1.57 | 4.40 × 10⁻⁴ | 1.89 × 10⁻² | 1.39 | 0.07 | 0.4 | −1.32 | 3.89 × 10⁻³ | 1.17 × 10⁻² | 0.97 | 0.94 | 1.69 × 10⁻³⁰ | ENSG00000164932.13 | 8.87 × 10⁻⁸ | 3.25 × 10⁻⁴ | −0.78 | 29.99 | 13.22 |
| 202450_s_at | CTSK | 10.12 | 8.8 | 0.4 | −1.32 | 1.37 × 10⁻³ | 3.59 × 10⁻² | 2.25 | 1.28 | 0.51 | −0.97 | 1.34 × 10⁻² | 2.32 × 10⁻² | 0.96 | 0.92 | 1.14 × 10⁻²⁶ | ENSG00000143387.14 | NA | NA | NA | ||
| 201893_x_at | DCN | 12.14 | 10.87 | 0.42 | −1.27 | 1.37 × 10⁻³ | 3.59 × 10⁻² | 3.98 | 2.75 | 0.43 | −1.22 | 3.78 × 10⁻³ | 1.17 × 10⁻² | 0.95 | 0.9 | 2.71 × 10⁻²⁵ | ENSG00000011465.18 | 8.81 × 10⁻⁵ | 1.37 × 10⁻² | −1.01 | 319.12 | 132.97 |
| 211896_s_at | DCN | 12.13 | 10.72 | 0.37 | −1.42 | 1.08 × 10⁻³ | 3.11 × 10⁻² | 3.98 | 2.75 | 0.43 | −1.22 | 3.78 × 10⁻³ | 1.17 × 10⁻² | 0.94 | 0.88 | 3.10 × 10⁻²³ | ||||||
| 211813_x_at | DCN | 11.66 | 10.12 | 0.34 | −1.55 | 4.38 × 10⁻⁴ | 1.89 × 10⁻² | 3.98 | 2.75 | 0.43 | −1.22 | 3.78 × 10⁻³ | 1.17 × 10⁻² | 0.93 | 0.86 | 1.51 × 10⁻²¹ | ||||||
| 201325_s_at | EMP1 | 8.84 | 7.83 | 0.5 | −1.01 | 8.35 × 10⁻⁴ | 2.70 × 10⁻² | 1.88 | 1.04 | 0.56 | −0.84 | 3.78 × 10⁻³ | 1.17 × 10⁻² | 0.91 | 0.83 | 9.38 × 10⁻²⁰ | ENSG00000134531.10 | 3.03 × 10⁻⁴ | 2.36 × 10⁻² | −0.58 | 78.54 | 40.11 |
| 201324_at | EMP1 | 10.77 | 9.74 | 0.49 | −1.03 | 8.68 × 10⁻⁵ | 6.61 × 10⁻³ | 1.88 | 1.04 | 0.56 | −0.84 | 3.78 × 10⁻³ | 1.17 × 10⁻² | 0.92 | 0.85 | 1.76 × 10⁻²⁰ | ||||||
| 209955_s_at | FAP | 8.28 | 6.44 | 0.28 | −1.84 | 5.71 × 10⁻⁴ | 2.21 × 10⁻² | 0.86 | −0.81 | 0.31 | −1.67 | 8.08 × 10⁻⁴ | 5.35 × 10⁻³ | 0.98 | 0.95 | 1.23 × 10⁻³² | ENSG00000078098.14 | 9.08 × 10⁻⁵ | 4.08 × 10⁻³ | −1.25 | 46.2 | 14.03 |
| 211719_x_at | FN1 | 12.69 | 11.33 | 0.39 | −1.36 | 2.04 × 10⁻⁴ | 1.18 × 10⁻² | 4.68 | 3.17 | 0.35 | −1.51 | 2.12 × 10⁻⁴ | 2.54 × 10⁻³ | 0.98 | 0.96 | 5.68 × 10⁻³⁴ | ENSG00000115414.21 | 1.45 × 10⁻⁵ | 1.27 × 10⁻³ | −1.18 | 680.6 | 193.53 |
| 214701_s_at | FN1 | 6.29 | 4.67 | 0.33 | −1.62 | 5.11 × 10⁻⁷ | 1.50 × 10⁻⁴ | 4.68 | 3.17 | 0.35 | −1.51 | 2.12 × 10⁻⁴ | 2.54 × 10⁻³ | 0.73 | 0.53 | 3.20 × 10⁻⁹ | ||||||
| 210495_x_at | FN1 | 12.29 | 10.62 | 0.31 | −1.67 | 7.05 × 10⁻⁵ | 1.07 × 10⁻³ | 4.68 | 3.17 | 0.35 | −1.51 | 2.12 × 10⁻⁴ | 2.54 × 10⁻³ | 0.98 | 0.96 | 3.57 × 10⁻³⁴ | ||||||
| 216442_x_at | FN1 | 12.33 | 10.65 | 0.31 | −1.69 | 9.99 × 10⁻⁵ | 1.35 × 10⁻³ | 4.68 | 3.17 | 0.35 | −1.51 | 2.12 × 10⁻⁴ | 2.54 × 10⁻³ | 0.98 | 0.97 | 1.58 × 10⁻³⁵ | ||||||
| 212464_s_at | FN1 | 12.32 | 10.62 | 0.31 | −1.69 | 1.09 × 10⁻⁵ | 1.41 × 10⁻³ | 4.68 | 3.17 | 0.35 | −1.51 | 2.12 × 10⁻⁴ | 2.54 × 10⁻³ | 0.98 | 0.96 | 1.53 × 10⁻³⁴ | ||||||
| 225481_at | FRMD6 | 8.43 | 7.29 | 0.45 | −1.14 | 4.17 × 10⁻⁴ | 1.84 × 10⁻² | 0.31 | −0.58 | 0.54 | −0.89 | 1.19 × 10⁻² | 2.23 × 10⁻² | 0.94 | 0.88 | 7.77 × 10⁻²² | ENSG00000139926.16 | 8.55 × 10⁻⁵ | 4.08 × 10⁻³ | −0.80 | 26.78 | 47.71 |
| 225464_at | FRMD6 | 8.41 | 7.27 | 0.45 | −1.14 | 3.71 × 10⁻⁴ | 1.69 × 10⁻² | 0.31 | −0.58 | 0.54 | −0.89 | 1.19 × 10⁻² | 2.23 × 10⁻² | 0.93 | 0.87 | 1.20 × 10⁻²⁰ | ||||||
| 227070_at | GLT8D2 | 8.2 | 6.95 | 0.42 | −1.25 | 2.01 × 10⁻³ | 4.44 × 10⁻² | −0.78 | −1.69 | 0.53 | −0.91 | 2.54 × 10⁻² | 4.09 × 10⁻² | 0.94 | 0.89 | 7.62 × 10⁻²² | ENSG00000120820.12 | 5.54 × 10⁻⁵ | 3.20 × 10⁻³ | −0.71 | 15.03 | 7.28 |
| 227059_at | GPC6 | 8.15 | 6.18 | 0.25 | −1.97 | 2.46 × 10⁻⁵ | 2.75 × 10⁻³ | −0.81 | −2.77 | 0.26 | −1.96 | 1.09 × 10⁻⁴ | 2.54 × 10⁻³ | 0.97 | 0.94 | 9.60 × 10⁻³⁰ | ENSG00000183098.11 | NA | NA | NA | ||
| 201035_s_at | HADH | 7 | 5.97 | 0.49 | −1.02 | 4.44 × 10⁻¹¹ | 4.56 × 10⁻⁸ | −0.70 | −0.86 | 0.89 | −0.16 | 2.42 × 10⁻¹ | 2.48 × 10⁻¹ | 0.55 | 0.3 | 2.93 × 10⁻⁵ | ENSG00000138796.17 | 2.17 × 10⁻² | 2.24 × 10⁻¹ | −0.21 | ||
| 226218_at | IL7R | 9.7 | 8.17 | 0.34 | −1.54 | 3.19 × 10⁻⁴ | 1.58 × 10⁻² | 1.58 | 0.49 | 0.47 | −1.09 | 2.98 × 10⁻³ | 1.12 × 10⁻² | 0.95 | 0.91 | 1.27 × 10⁻²⁵ | ENSG00000168685.15 | 4.03 × 10⁻⁴ | 2.69 × 10⁻² | −0.59 | 73.03 | 39.19 |
| 205798_at | IL7R | 8.99 | 7.41 | 0.33 | −1.59 | 6.31 × 10⁻⁴ | 2.29 × 10⁻² | 1.58 | 0.49 | 0.47 | −1.09 | 2.98 × 10⁻³ | 1.12 × 10⁻² | 0.91 | 0.83 | 1.33 × 10⁻¹⁹ | ||||||
| 227140_at | INHBA | 9.26 | 6.5 | 0.15 | −2.76 | 1.09 × 10⁻⁵ | 1.41 × 10⁻³ | 0.08 | −1.94 | 0.25 | −2.01 | 2.82 × 10⁻⁴ | 2.54 × 10⁻³ | 0.96 | 0.91 | 2.79 × 10⁻²⁶ | ENSG00000122641.11 | 3.05 × 10⁻⁵ | 8.21 × 10⁻³ | −1.64 | 9.2 | 2.09 |
| 204686_at | IRS1 | 6.61 | 5.45 | 0.45 | −1.16 | 9.09 × 10⁻⁵ | 1.27 × 10⁻³ | −1.31 | −1.77 | 0.72 | −0.47 | 7.18 × 10⁻² | 8.50 × 10⁻² | 0.77 | 0.59 | 1.12 × 10⁻¹⁰ | ENSG00000169047.5 | 1.37 × 10⁻⁴ | 1.76 × 10⁻² | −0.50 | 10.16 | 5.97 |
| 204682_at | LTBP2 | 7.22 | 6.04 | 0.44 | −1.18 | 2.44 × 10⁻³ | 4.92 × 10⁻² | −0.08 | −0.98 | 0.53 | −0.91 | 5.45 × 10⁻² | 7.00 × 10⁻² | 0.45 | 0.2 | 1.03 × 10⁻³ | ENSG00000119681.12 | 5.46 × 10⁻⁵ | 1.09 × 10⁻² | −1.02 | 13.28 | 5.61 |
| 201069_at | MMP2 | 9.55 | 7.61 | 0.26 | −1.94 | 2.12 × 10⁻³ | 4.57 × 10⁻² | 2.23 | 0.66 | 0.34 | −1.57 | 1.34 × 10⁻² | 2.32 × 10⁻² | 0.98 | 0.96 | 7.23 × 10⁻³³ | ENSG00000087245.13 | 3.56 × 10⁻³ | 8.81 × 10⁻² | −1.22 | ||
| 203936_s_at | MMP9 | 7.78 | 6.22 | 0.34 | −1.56 | 2.24 × 10⁻³ | 4.72 × 10⁻² | 0.94 | −0.58 | 0.35 | −1.52 | 5.01 × 10⁻³ | 1.33 × 10⁻² | 0.96 | 0.91 | 7.85 × 10⁻²⁶ | ENSG00000100985.7 | 6.81 × 10⁻³ | 1.22 × 10⁻¹ | −1.03 | ||
| 203939_at | NT5E | 7.42 | 5.96 | 0.36 | −1.46 | 6.32 × 10⁻⁵ | 5.20 × 10⁻³ | 0.05 | −0.96 | 0.5 | −1.01 | 1.44 × 10⁻³ | 7.20 × 10⁻³ | 0.95 | 0.9 | 1.05 × 10⁻²⁴ | ENSG00000135318.12 | 6.37 × 10⁻⁵ | 1.15 × 10⁻² | −0.62 | 6.52 | 3.31 |
| 204992_s_at | PFN2 | 8.19 | 6.8 | 0.38 | −1.39 | 1.30 × 10⁻⁴ | 8.64 × 10⁻³ | ENSG00000070087.14 | 9.83 × 10⁻³ | 1.47 × 10⁻¹ | −0.46 | |||||||||||
| 205479_s_at | PLAU | 8.91 | 7.07 | 0.28 | −1.84 | 3.01 × 10⁻⁵ | 3.13 × 10⁻³ | 1.82 | 0.5 | 0.4 | −1.32 | 2.50 × 10⁻⁴ | 2.54 × 10⁻³ | 0.98 | 0.95 | 6.36 × 10⁻³² | ENSG00000122861.16 | 1.91 × 10⁻⁴ | 1.99 × 10⁻² | −0.95 | 5.89 | 2.46 |
| 210809_s_at | POSTN | 12.88 | 10.81 | 0.24 | −2.07 | 1.19 × 10⁻⁴ | 8.13 × 10⁻³ | 1.42 | −0.38 | 0.29 | −1.80 | 3.89 × 10⁻³ | 1.17 × 10⁻² | 0.94 | 0.88 | 2.33 × 10⁻²³ | ENSG00000133110.15 | 2.52 × 10⁻⁴ | 2.17 × 10⁻² | −1.37 | 292.37 | 75.76 |
| 1555778_a_at | POSTN | 11.22 | 8.86 | 0.19 | −2.36 | 2.37 × 10⁻⁴ | 1.29 × 10⁻² | 1.42 | −0.38 | 0.29 | −1.80 | 3.89 × 10⁻³ | 1.17 × 10⁻² | 0.91 | 0.82 | 3.07 × 10⁻¹⁹ | ||||||
| 202975_s_at | RHOBTB3 | 8.07 | 7.06 | 0.5 | −1.01 | 9.35 × 10⁻⁴ | 2.88 × 10⁻² | 1.33 | 0.97 | 0.78 | −0.36 | 3.26 × 10⁻¹ | 3.26 × 10⁻¹ | 0.67 | 0.44 | 1.49 × 10⁻⁷ | ENSG00000164292.13 | 3.70 × 10⁻² | 2.88 × 10⁻¹ | −0.33 | ||
| 212110_at | SLC39A14 | 9.15 | 7.88 | 0.41 | −1.28 | 1.43 × 10⁻⁴ | 9.34 × 10⁻³ | 1.48 | 0.78 | 0.61 | −0.70 | 1.17 × 10⁻² | 2.23 × 10⁻² | 0.94 | 0.89 | 1.03 × 10⁻²³ | ENSG00000104635.15 | 7.67 × 10⁻⁵ | 1.28 × 10⁻² | −0.74 | 24.89 | 11.29 |
| 212354_at | SULF1 | 10.36 | 8.44 | 0.26 | −1.92 | 1.82 × 10⁻⁴ | 1.10 × 10⁻² | 2.23 | 0.5 | 0.3 | −1.73 | 2.30 × 10⁻⁴ | 2.54 × 10⁻³ | 0.98 | 0.95 | 1.47 × 10⁻³² | ENSG00000137573.14 | 6.56 × 10⁻⁸ | 3.25 × 10⁻⁴ | −1.34 | 131.96 | 37.09 |
| 212344_at | SULF1 | 9.24 | 7.15 | 0.24 | −2.09 | 1.06 × 10⁻⁴ | 7.35 × 10⁻³ | 2.23 | 0.5 | 0.3 | −1.73 | 2.30 × 10⁻⁴ | 2.54 × 10⁻³ | 0.95 | 0.9 | 4.63 × 10⁻²⁵ | ||||||
| 212353_at | SULF1 | 10.33 | 8.19 | 0.23 | −2.14 | 6.30 × 10⁻⁵ | 5.20 × 10⁻³ | 2.23 | 0.5 | 0.3 | −1.73 | 2.30 × 10⁻⁴ | 2.54 × 10⁻³ | 0.98 | 0.97 | 2.01 × 10−36 | ||||||
| 206506_s_at | SUPT3H | 6.28 | 5.26 | 0.49 | −1.02 | 2.36 × 10⁻⁵ | 5.22 × 10⁻⁴ | −1.11 | −1.26 | 0.9 | −0.15 | 1.39 × 10⁻¹ | 1.45 × 10⁻¹ | 0.43 | 0.18 | 1.36 × 10⁻³ | ENSG00000196284.17 | 2.45 × 10⁻² | 2.37 × 10⁻¹ | −0.20 | ||
| 203083_at | THEM4 | 7.5 | 6.46 | 0.39 | −1.35 | 1.86 × 10⁻⁵ | 2.19 × 10⁻³ | −10.85 | −18.80 | 4.04 × 10⁻³ | −7.95 | 1.14 × 10⁻¹ | 1.25 × 10⁻¹ | 0.68 | 0.46 | 8.14 × 10⁻⁸ | ENSG00000159445.13 | 3.52 × 10⁻³ | 8.78 × 10⁻² | −0.32 | ||
| 1553118_at | THBS2 | 9.82 | 8.47 | 0.49 | −1.04 | 1.93 × 10⁻³ | 4.33 × 10⁻² | 2.3 | 1.35 | 0.52 | −0.95 | 1.83 × 10⁻² | 3.05 × 10⁻² | 0.98 | 0.95 | 3.75 × 10⁻³² | ENSG00000186340.16 | 3.38 × 10⁻⁵ | 8.78 × 10⁻³ | −1.00 | 70.74 | 28.41 |
| 219410_at | TMEM45A | 8.55 | 7.1 | 0.37 | −1.45 | 7.23 × 10⁻⁴ | 2.49 × 10⁻² | −0.67 | −1.71 | 0.49 | −1.04 | 7.99 × 10⁻³ | 1.71 × 10⁻² | 0.97 | 0.93 | 9.69 × 10⁻²⁹ | ENSG00000181458.10 | 2.32 × 10⁻² | 2.30 × 10⁻¹ | −0.19 | ||
| 220968_s_at | TSPAN9 | 5.94 | 4.73 | 0.43 | −1.21 | 5.79 × 10⁻¹⁴ | 9.26 × 10⁻¹¹ | −0.13 | −0.68 | 0.68 | −0.55 | 9.13 × 10⁻³ | 1.87 × 10⁻² | 0.71 | 0.5 | 1.11 × 10⁻⁸ | ENSG00000011105.14 | 5.59 × 10⁻⁴ | 3.15 × 10⁻² | −0.45 | 11.05 | 6.43 |
| 243526_at | WDR86 | 6.21 | 4.96 | 0.42 | −1.25 | 4.04 × 10⁻⁷ | 1.24 × 10⁻⁴ | −3.20 | −3.93 | 0.61 | −0.72 | 7.69 × 10⁻² | 8.87 × 10⁻² | 0.64 | 0.41 | 5.71 × 10⁻⁷ | ENSG00000187260.16 | 1.87 × 10⁻² | 2.07 × 10⁻¹ | −0.41 | ||
Publisher’s Note: MDPI stays neutral with regard to jurisdictional claims in published maps and institutional affiliations. |
© 2021 by the authors. Licensee MDPI, Basel, Switzerland. This article is an open access article distributed under the terms and conditions of the Creative Commons Attribution (CC BY) license (https://creativecommons.org/licenses/by/4.0/).
Share and Cite
Daugrois, C.; Bessiere, C.; Dejean, S.; Anton-Leberre, V.; Commes, T.; Pyronnet, S.; Brousset, P.; Espinos, E.; Brugiere, L.; Meggetto, F.; et al. Gene Expression Signature Associated with Clinical Outcome in ALK-Positive Anaplastic Large Cell Lymphoma. Cancers 2021, 13, 5523. https://0-doi-org.brum.beds.ac.uk/10.3390/cancers13215523
Daugrois C, Bessiere C, Dejean S, Anton-Leberre V, Commes T, Pyronnet S, Brousset P, Espinos E, Brugiere L, Meggetto F, et al. Gene Expression Signature Associated with Clinical Outcome in ALK-Positive Anaplastic Large Cell Lymphoma. Cancers. 2021; 13(21):5523. https://0-doi-org.brum.beds.ac.uk/10.3390/cancers13215523
Chicago/Turabian StyleDaugrois, Camille, Chloé Bessiere, Sébastien Dejean, Véronique Anton-Leberre, Thérèse Commes, Stephane Pyronnet, Pierre Brousset, Estelle Espinos, Laurence Brugiere, Fabienne Meggetto, and et al. 2021. "Gene Expression Signature Associated with Clinical Outcome in ALK-Positive Anaplastic Large Cell Lymphoma" Cancers 13, no. 21: 5523. https://0-doi-org.brum.beds.ac.uk/10.3390/cancers13215523