
Linearity of Age at Cancer Onset Worldwide: 25-Year Population-Based Cancer Registry Study

Abstract
:Simple Summary
Abstract
1. Introduction
2. Materials and Methods
2.1. Data Sources
2.2. Statistical Analyses
3. Results
4. Discussion
5. Conclusions
Supplementary Materials
Author Contributions
Funding
Institutional Review Board Statement
Informed Consent Statement
Data Availability Statement
Acknowledgments
Conflicts of Interest
References
- Newby, J.A.; Busby, C.C.; Howard, C.V.; Platt, M.J. The cancer incidence temporality index: An index to show temporal changes in the age of onset of overall and specific cancer (England and Wales, 1971–1999). Biomed. Pharmacother. 2007, 61, 623–630. [Google Scholar] [CrossRef] [PubMed]
- Siegel, R.L.; Medhanie, G.A.; Fedewa, S.A.; Jemal, A. State Variation in Early-Onset Colorectal Cancer in the United States, 1995–2015. J. Natl. Cancer Inst. 2019, 111, 1104–1106. [Google Scholar] [CrossRef] [PubMed] [Green Version]
- Chouchane, L.; Boussen, H.; Sastry, K.S. Breast cancer in Arab populations: Molecular characteristics and disease management implications. Lancet Oncol. 2013, 14, e417–e424. [Google Scholar] [CrossRef]
- Nordling, C.O. A new theory on cancer-inducing mechanism. Br. J. Cancer 1953, 7, 68–72. [Google Scholar] [CrossRef] [PubMed] [Green Version]
- Armitage, P.; Doll, R. The age distribution of cancer and a multi-stage theory of carcinogenesis. Br. J. Cancer 1954, 8, 1983–1989. [Google Scholar] [CrossRef] [PubMed] [Green Version]
- Franco-Marina, F.; Lopez-Carrillo, L.; Keating, N.L.; Arreola-Ornelas, H.; Knaul, F.M. Breast cancer age at diagnosis patterns in four Latin American Populations: A comparison with North American countries. Cancer Epidemiol. 2015, 39, 831–837. [Google Scholar] [CrossRef] [PubMed]
- Bidoli, E.; Virdone, S.; Hamdi-Cherif, M.; Toffolutti, F.; Taborelli, M.; Panato, C.; Serraino, D. Worldwide Age at Onset of Female Breast Cancer: A 25-Year Population-Based Cancer Registry Study. Sci. Rep. 2019, 9, 14111. [Google Scholar] [CrossRef] [PubMed] [Green Version]
- Weeks, J.R. Population: An Introduction to Concepts and Issues, 8th ed.; Wadsworth/Thomson Learning: Belmont, CA, USA, 2002. [Google Scholar]
- Gavrilov, L.A.; Heuveline, P. The ageing of population. In The Encyclopedia of Popultaion; Demeny, P.G.M., Ed.; Macmillan Reference: New York, NY, USA, 2003. [Google Scholar]
- IARC. Cancer Incidence in Five Continents; IARC CancerBase No. 9; International Agency for Research on Cancer: Lyon, France, 2010. [Google Scholar]
- Bray, F.; Colombet, M.; Mery, L.; Piñeros, M.; Znaor, A.; Zanetti, R.; Ferlay, J. Cancer Incidence in Five Continents; International Agency for Research on Cancer: Lyon, France, 2017; Volume XI. [Google Scholar]
- World Health Organization. World Health Statistics. 2010. Available online: http://www.who.int/whosis/whostat/EN_WHS10_Full.pdf (accessed on 28 October 2021).
- Newbold, P.; Carlson, W.; Thorne, B. Statistics for Business and Economics, 7th ed.; Pearson Education: New York, NY, USA, 2010. [Google Scholar]
- Guilford, J.P. Fundamental Statistics in Psychology and Education; McGraw-Hill Book Company: New York, NY, USA, 1956. [Google Scholar]
- Regione Friuli Venezia Giulia/Centro di Riferimento Oncologico (CRO) Aviano. Registro Tumori del Friuli Venezia Giulia. Available online: https://www.cro.sanita.fvg.it/it/ricercatori/registro_tumori.html (accessed on 28 October 2021).
- DeLong, E.R.; DeLong, D.M.; Clarke-Pearson, D.L. Comparing the areas under two or more correlated receiver operating characteristic curves: A nonparametric approach. Biometrics 1988, 44, 837–845. [Google Scholar] [CrossRef] [PubMed]
- Feller, A.; Matthes, K.L.; Bordoni, A.; Bouchardy, C.; Bulliard, J.L.; Herrmann, C.; Konzelmann, I.; Maspoli, M.; Mousavi, M.; Rohrmann, S.; et al. The relative risk of second primary cancers in Switzerland: A population-based retrospective cohort study. BMC Cancer 2020, 20, 51. [Google Scholar] [CrossRef]
- Percy, C.; Fritz, A.; Jack, A.; Shanmugarathan, S.; Sobin, L.; Parkin, D.M.; Whelan, S. International Classification of Diseases for Oncology, 3rd ed.; World Health Organization: Geneva, Switzerland, 2000. [Google Scholar]
- Hiyama, T.; Sato, T.; Yoshino, K.; Tsukuma, H.; Hanai, A.; Fujimoto, I. Second primary cancer following laryngeal cancer with special reference to smoking habits. Jpn. J. Cancer Res. 1992, 83, 334–339. [Google Scholar] [CrossRef] [PubMed]
- Weir, H.K.; Johnson, C.J.; Ward, K.C.; Coleman, M.P. The effect of multiple primary rules on cancer incidence rates and trends. Cancer Causes Control 2016, 27, 377–390. [Google Scholar] [CrossRef] [PubMed] [Green Version]
- Curtius, K.; Wright, N.A.; Graham, T.A. An evolutionary perspective on field cancerization. Nat. Rev. Cancer 2018, 18, 19–32. [Google Scholar] [CrossRef] [PubMed]
- Hawkins, M.; Bhatia, S.; Henderson, T.O.; Nathan, P.C.; Yan, A.; Teepen, J.C.; Morton, L.M. Subsequent Primary Neoplasms: Risks, Risk Factors, Surveillance, and Future Research. Pediatr. Clin. N. Am. 2020, 67, 1135–1154. [Google Scholar] [CrossRef] [PubMed]
- Jegu, J.; Colonna, M.; Daubisse-Marliac, L.; Tretarre, B.; Ganry, O.; Guizard, A.V.; Bara, S.; Troussard, X.; Bouvier, V.; Woronoff, A.S.; et al. The effect of patient characteristics on second primary cancer risk in France. BMC Cancer 2014, 14, 94. [Google Scholar] [CrossRef] [PubMed]
- Mroueh, R.; Nevala, A.; Haapaniemi, A.; Pitkaniemi, J.; Salo, T.; Makitie, A.A. Risk of second primary cancer in oral squamous cell carcinoma. Head Neck 2020, 42, 1848–1858. [Google Scholar] [CrossRef] [PubMed]
- Johnson, C.H.; Peace, S.; Adamo, P.; Fritz, A.; Percy-Laurry, A.; Edwards, B.K. The 2007 Multiple Primary and Histology Coding Rules; National Cancer Institute: Bethesda, MD, USA, 2007. [Google Scholar]
- IARC. International Rules for Multiple Primary Cancers ICD-O, 3rd ed.; International Agency for Research on Cancer: Lyon, France, 2004. [Google Scholar]
- Davis, E.J.; Beebe-Dimmer, J.L.; Yee, C.L.; Cooney, K.A. Risk of second primary tumors in men diagnosed with prostate cancer: A population-based cohort study. Cancer 2014, 120, 2735–2741. [Google Scholar] [CrossRef] [PubMed] [Green Version]
- Armstrong, B.K.; Barry, M.J.; Frydenberg, M.; Gardiner, R.A.; Haines, I.; Carter, S.M. PSA testing for men at average risk of prostate cancer. Public Health Res. Pract. 2017, 27, e2731721. [Google Scholar] [CrossRef] [PubMed] [Green Version]
- Palsdottir, T.; Nordstrom, T.; Karlsson, A.; Gronberg, H.; Clements, M.; Eklund, M. The impact of different prostate-specific antigen (PSA) testing intervals on Gleason score at diagnosis and the risk of experiencing false-positive biopsy recommendations: A population-based cohort study. BMJ Open 2019, 9, e027958. [Google Scholar] [CrossRef] [PubMed] [Green Version]
- Harford, J.B. Breast-cancer early detection in low-income and middle-income countries: Do what you can versus one size fits all. Lancet Oncol. 2011, 12, 306–312. [Google Scholar] [CrossRef]
- Ginsburg, O.; Bray, F.; Coleman, M.P.; Vanderpuye, V.; Eniu, A.; Kotha, S.R.; Sarker, M.; Huong, T.T.; Allemani, C.; Dvaladze, A.; et al. The global burden of women’s cancers: A grand challenge in global health. Lancet 2017, 389, 847–860. [Google Scholar] [CrossRef]
- IARC. IARC Handbooks of Cancer Prevention, Breast Cancer Screening; International Agency for Research on Cancer: Lyon, France, 2016; Volume 15. [Google Scholar]


| 1983–1987 (Volume VI, N = 160 CRs) | 2008–2012 (Volume XI, N = 393 CRs) | ||||||||
|---|---|---|---|---|---|---|---|---|---|
| Cancer Site or Groups | ICD-10 | r2 | α | Slope | (95%CI) | r2 | α | Slope | (95%CI) |
| Males | |||||||||
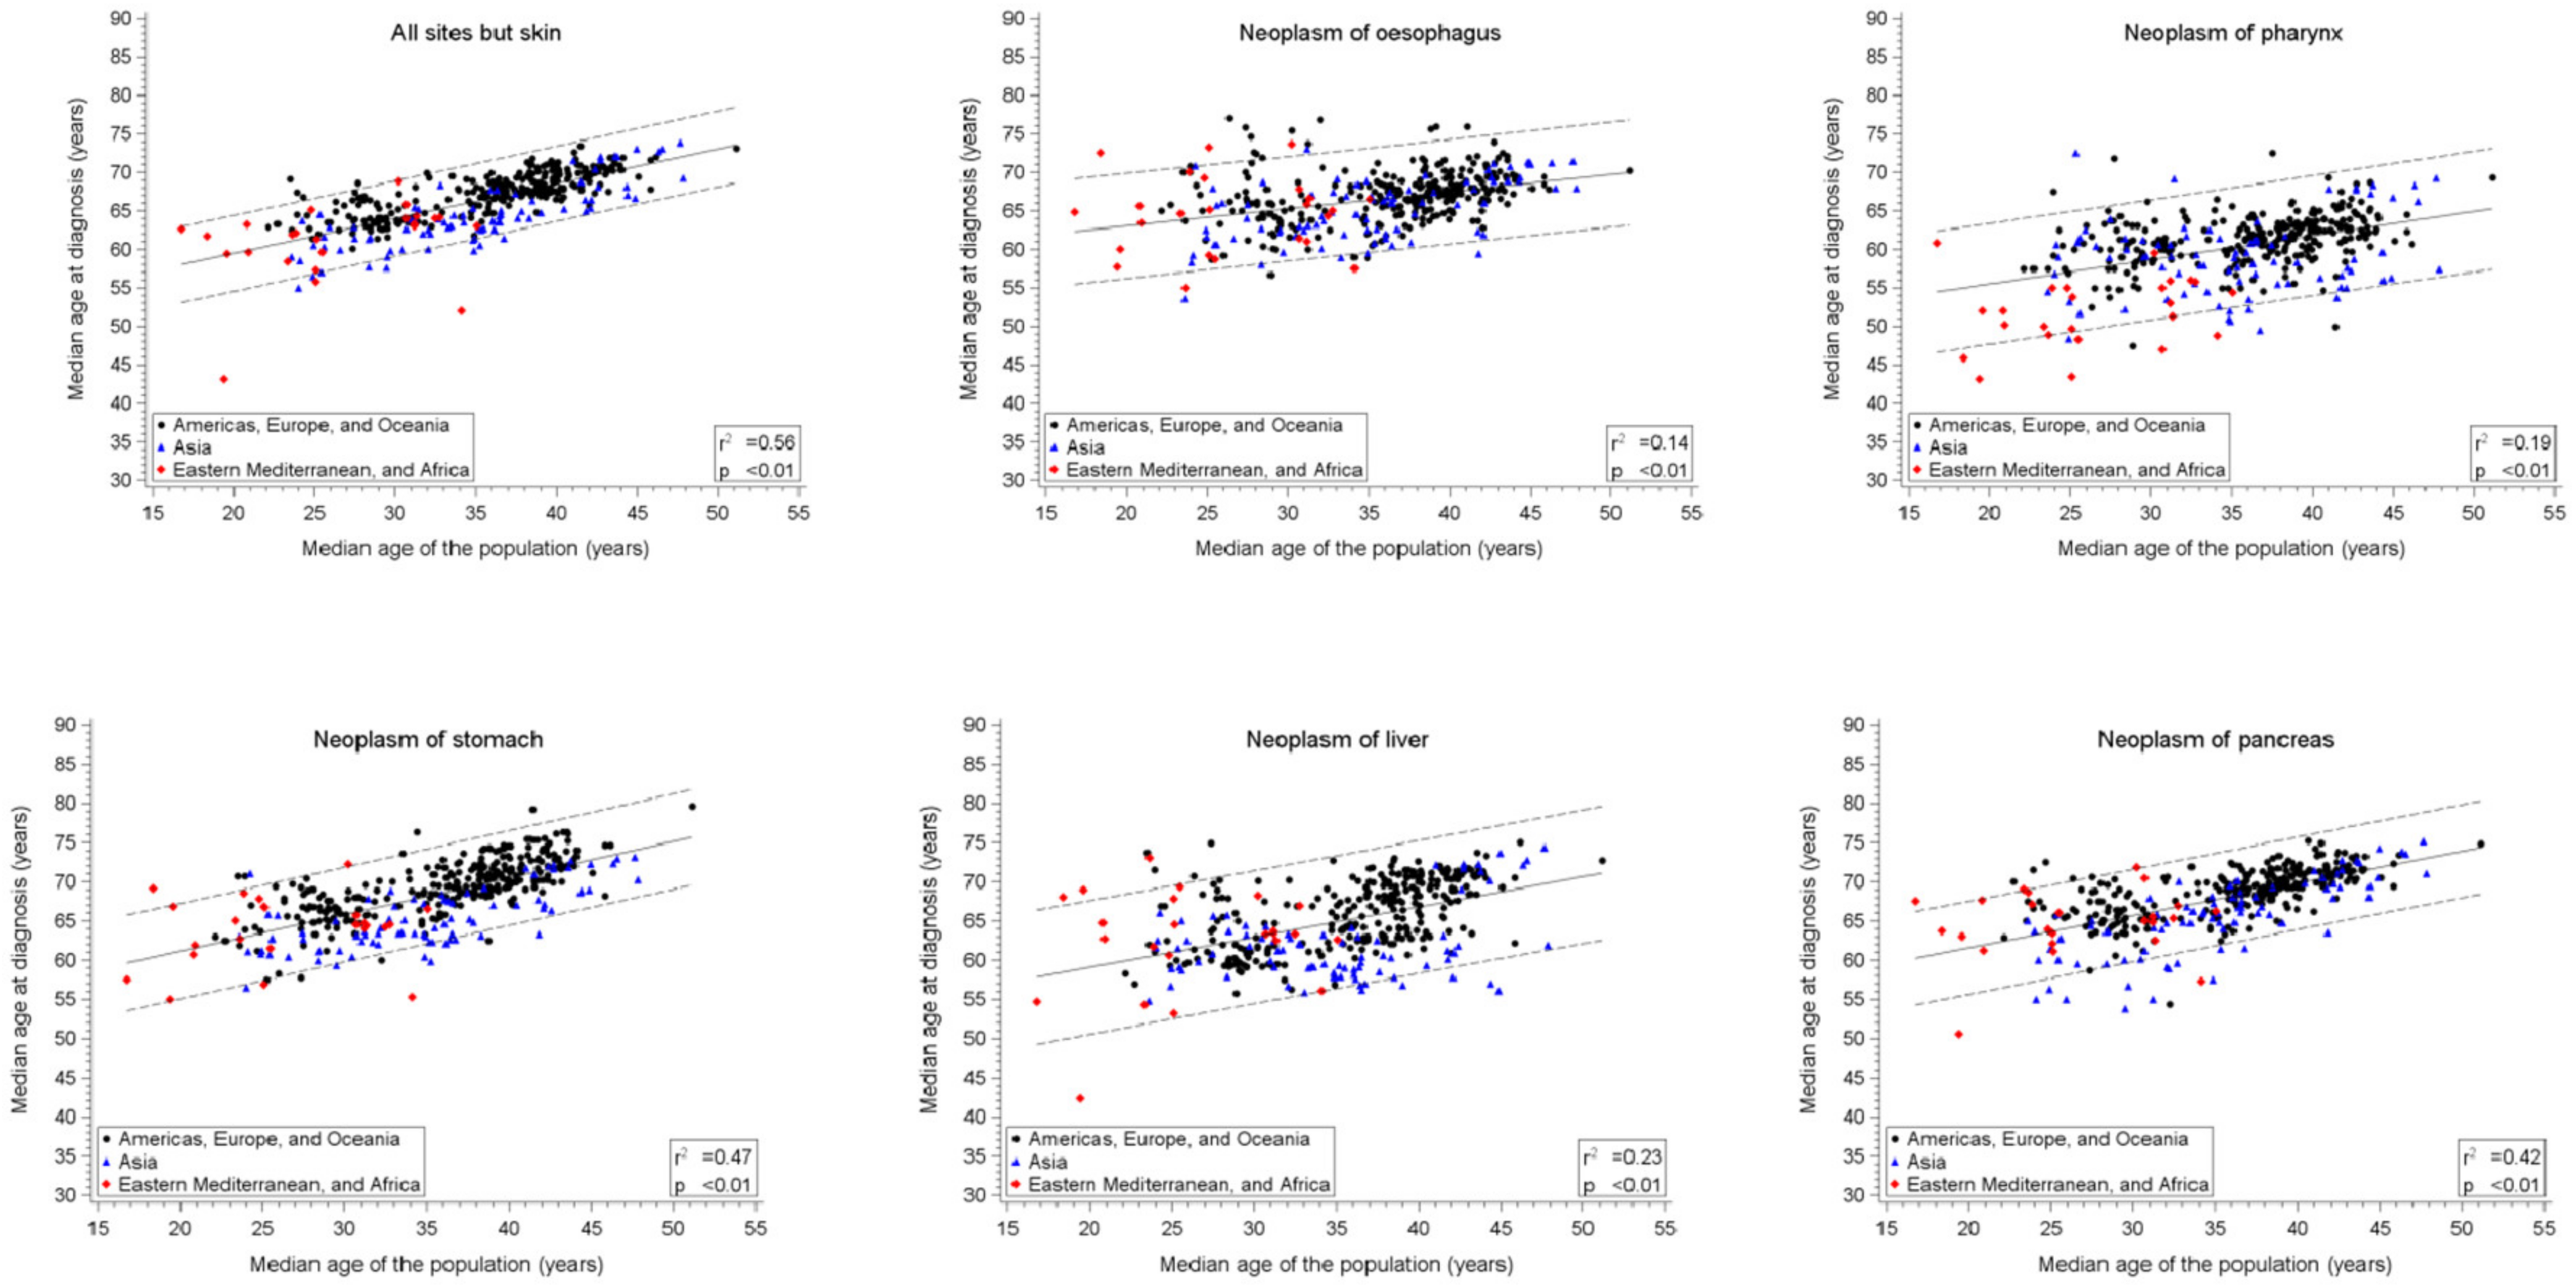
| All sites, but skin | C00–96, but C44 | 0.42+ | 49.8 | 0.52 * | (0.43–0.62) | 0.56+ | 50.4 | 0.45 * | (0.41–0.49) |
| Pharynx | C09–C14 | 0.13+ | 50.3 | 0.32 * | (0.19–0.44) | 0.19+ | 49.2 | 0.31 * | (0.25–0.38) |
| Oesophagus | C15 | 0.11+ | 58.3 | 0.24 * | (0.13–0.35) | 0.14+ | 58.6 | 0.22 * | (0.17–0.28) |
| Stomach | C16 | 0.36+ | 54.2 | 0.45 * | (0.36–0.54) | 0.47+ | 51.8 | 0.47 * | (0.42–0.52) |
| Liver | C22 | 0.27+ | 49.6 | 0.52 * | (0.38–0.65) | 0.24+ | 51.4 | 0.39 * | (0.32–0.45) |
| Pancreas | C25 | 0.24+ | 54.5 | 0.42 * | (0.30–0.53) | 0.42+ | 53.4 | 0.41 * | (0.36–0.46) |
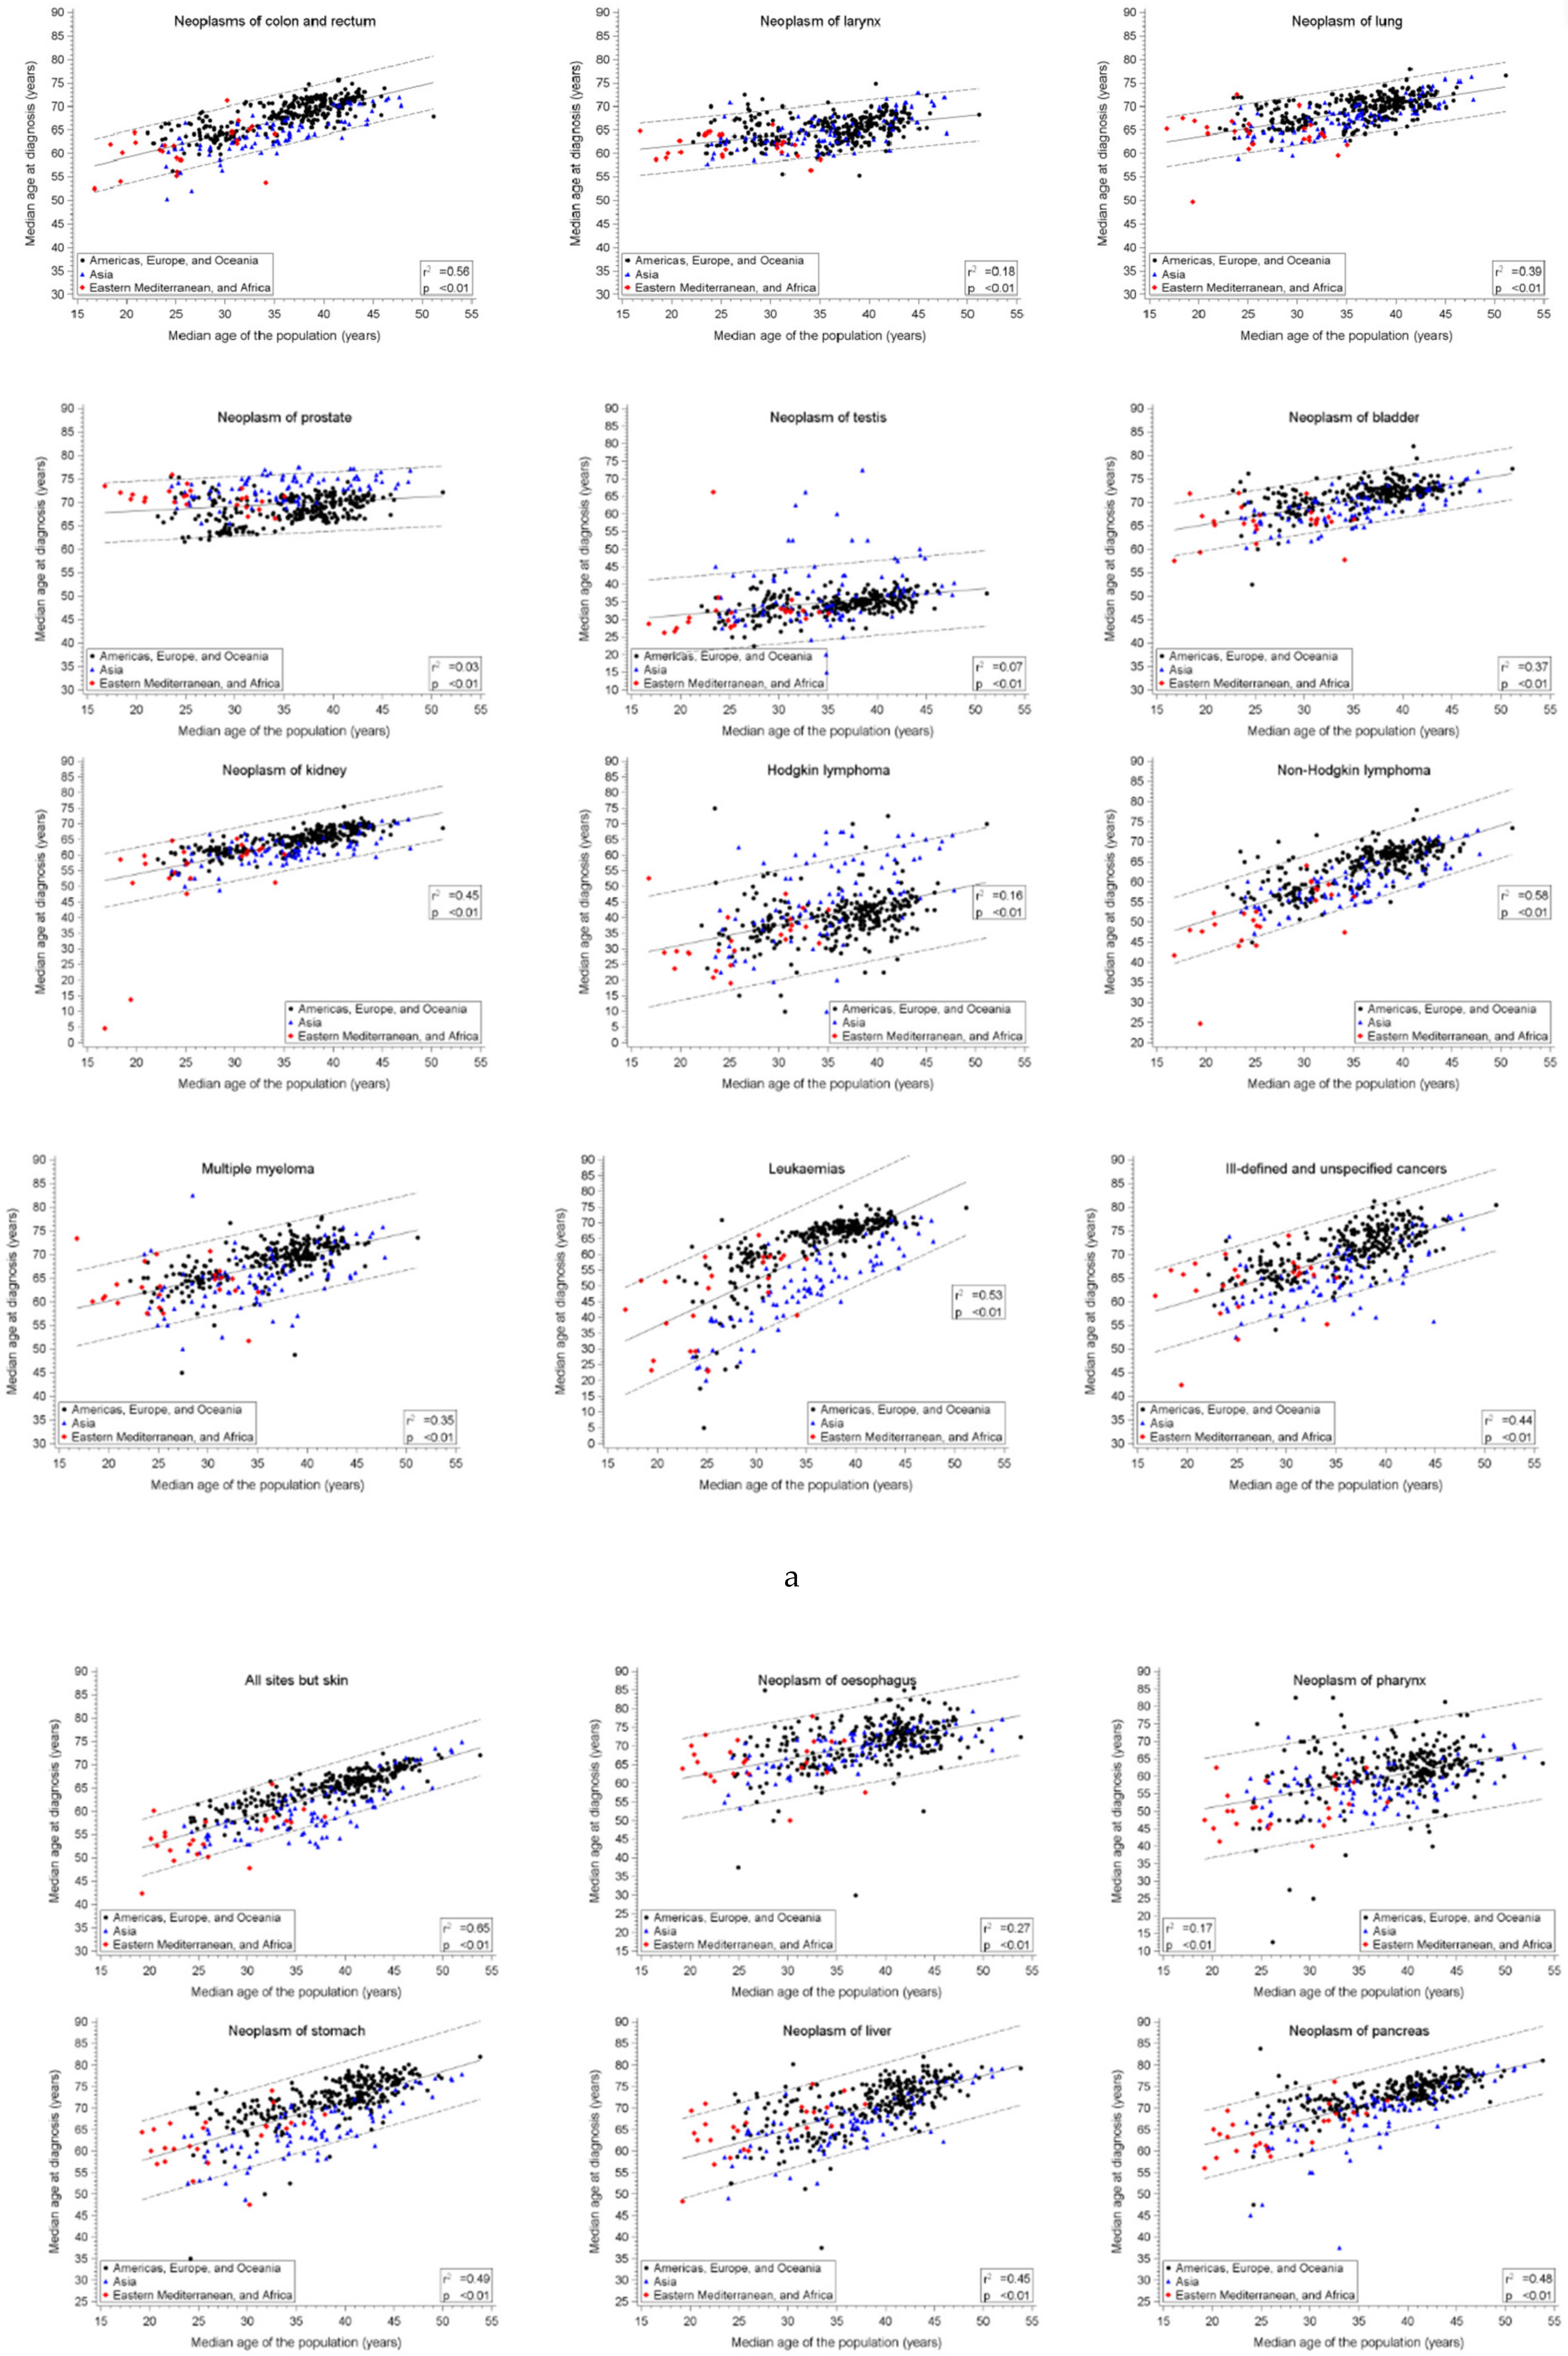
| Colon, rectum, and anus | C18–21 | 0.42+ | 51.8 | 0.51 * | (0.42–0.60) | 0.56+ | 48.8 | 0.52 * | (0.47–0.56) |
| Larynx | C32 | 0.13+ | 55.9 | 0.22 * | (0.13–0.31) | 0.18+ | 57.3 | 0.21 * | (0.17–0.26) |
| Lung | C33–34 | 0.27+ | 57.0 | 0.29 * | (0.22–0.37) | 0.39+ | 56.7 | 0.34 * | (0.30–0.38) |
| Prostate | C61 | 0.19+ | 68.8 | 0.16 * | (0.11–0.21) | 0.04+ | 66.1 | 0.10 * | (0.05–0.15) |
| Testis | C62 | 0.07+ | 26.9 | 0.20 * | (0.08–0.32) | 0.07+ | 26.4 | 0.24 * | (0.16–0.33) |
| Bladder | C67 | 0.23+ | 60.6 | 0.26 * | (0.19–0.33) | 0.37+ | 58.3 | 0.35 * | (0.30–0.39) |
| Kidney | C64–66, C68 | 0.36+ | 37.4 | 0.82 * | (0.65–0.99) | 0.45+ | 41.2 | 0.63 * | (0.56–0.70) |
| Hodgkin lymphoma | C81 | 0.18+ | 17.8 | 0.70 * | (0.47–0.94) | 0.17+ | 18.3 | 0.64 * | (0.50–0.79) |
| Non-Hodgkin lymphoma | C82–85, C96 | 0.52+ | 28.1 | 1.03 * | (0.87–1.19) | 0.59+ | 34.6 | 0.79 * | (0.72–0.85) |
| Myeloma | C88, 90 | 0.24+ | 54.5 | 0.41 * | (0.30–0.53) | 0.36+ | 50.5 | 0.48 * | (0.42–0.55) |
| Leukaemias | C91–95 | 0.52+ | 3.3 | 1.79 * | (1.52–2.06) | 0.53+ | 7.9 | 1.47 * | (1.33–1.60) |
| Ill-defined or unspecified | 0.44+ | 47.6 | 0.62 * | (0.55–0.69) | |||||
| Females | |||||||||
| All sites, but skin | C00–96, but C44 | 0.65+ | 41.7 | 0.68 * | (0.60–0.75) | 0.65+ | 40.3 | 0.62 * | (0.57–0.66) |
| Pharynx | C09–C14 | 0.21+ | 43.6 | 0.52 * | (0.36–0.67) | 0.17+ | 41.3 | 0.49 * | (0.39–0.60) |
| Oesophagus | C15 | 0.29+ | 52.9 | 0.54 * | (0.41–0.68) | 0.27+ | 52.0 | 0.49 * | (0.41–0.57) |
| Stomach | C16 | 0.45+ | 51.3 | 0.61 * | (0.51–0.72) | 0.49+ | 44.9 | 0.67 * | (0.60–0.74) |
| Liver | C22 | 0.41+ | 47.6 | 0.66 * | (0.54–0.79) | 0.45+ | 46.2 | 0.63 * | (0.56–0.70) |
| Pancreas | C25 | 0.41+ | 55.0 | 0.49 * | (0.40–0.58) | 0.48+ | 50.6 | 0.57 * | (0.51–0.63) |
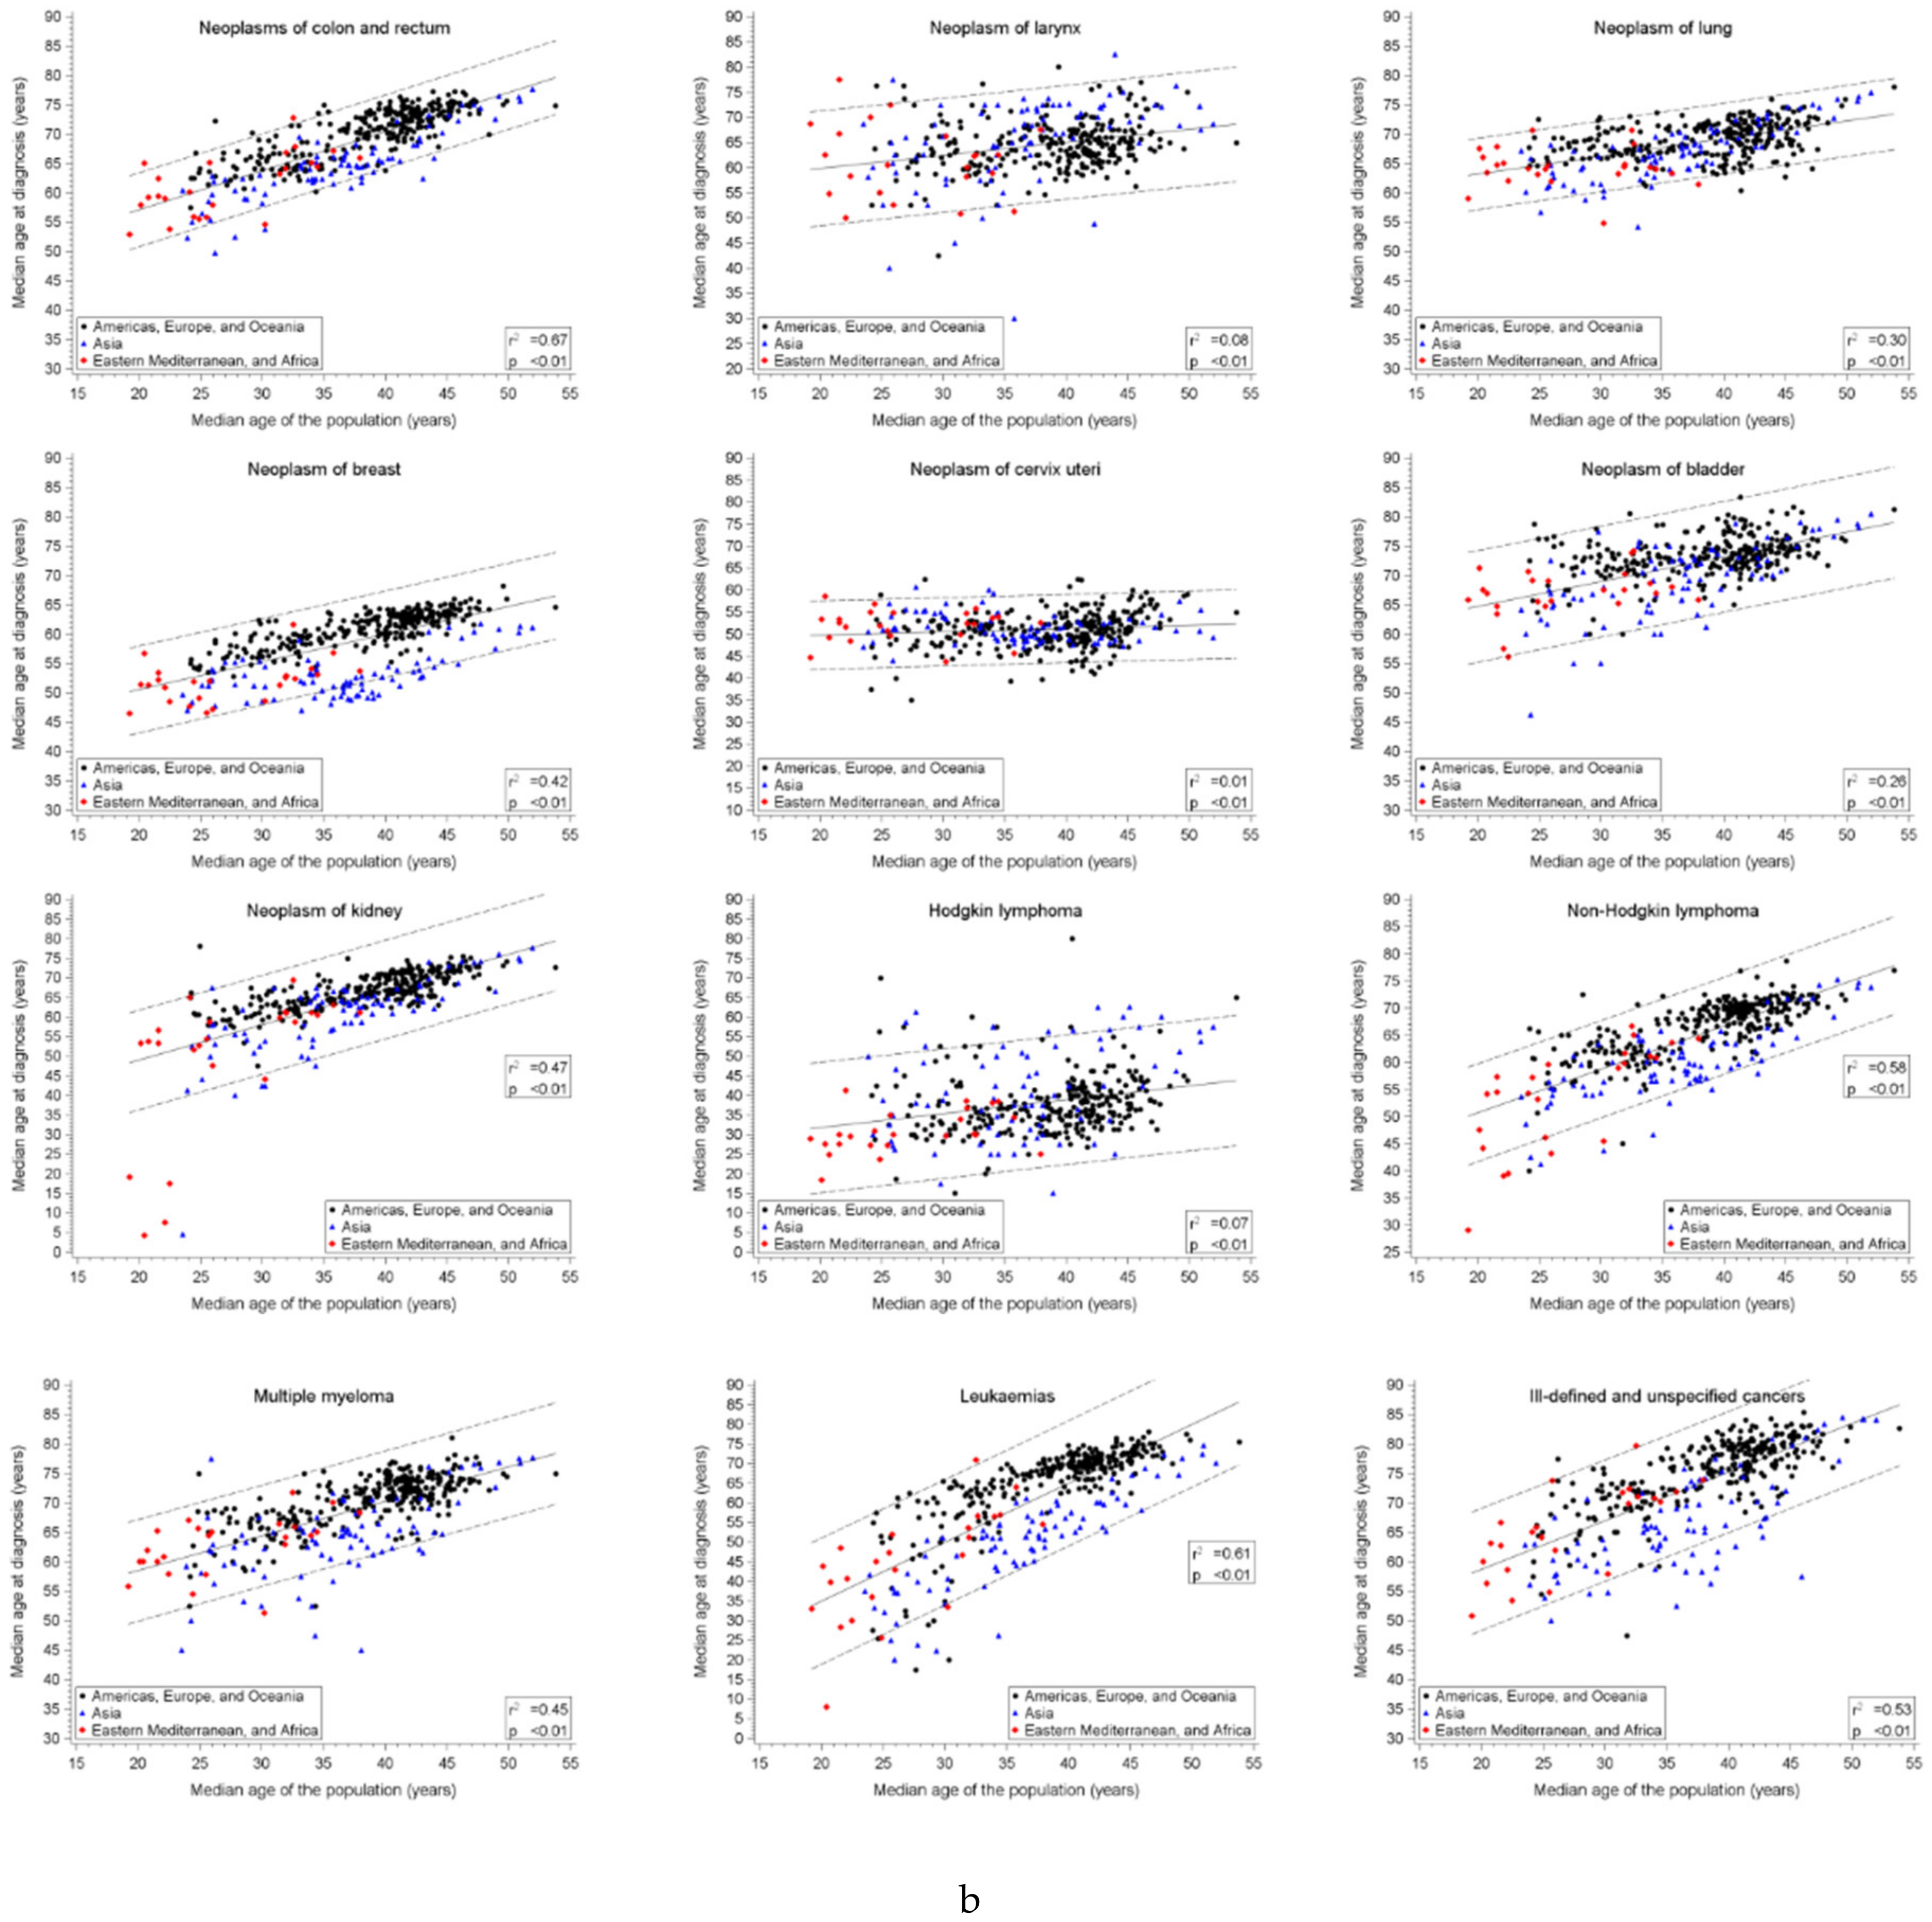
| Colon. rectum and anus | C18–21 | 0.48+ | 48.9 | 0.62 * | (0.52–0.72) | 0.67+ | 43.8 | 0.67 * | (0.62–0.71) |
| Larynx | C32 | 0.08+ | 54.8 | 0.25 * | (0.11–0.39) | 0.08+ | 54.7 | 0.26 * | (0.17–0.35) |
| Lung | C33–34 | 0.37+ | 55.2 | 0.35 * | (0.28–0.42) | 0.31+ | 57.1 | 0.30 * | (0.26–0.35) |
| Breast | C61 | 0.45+ | 41.7 | 0.53 * | (0.44–0.62) | 0.42+ | 41.1 | 0.47 * | (0.42–0.53) |
| Cervix uteri | C62 | 0.32+ | 38.5 | 0.46 * | (0.35–0.56) | 0.02+ | 48.3 | 0.07 * | (0.02–0.13) |
| Bladder | C67 | 0.33+ | 51.4 | 0.58 * | (0.46–0.71) | 0.26+ | 56.3 | 0.42 * | (0.35–0.49) |
| Kidney | C64–66, C68 | 0.42+ | 35.3 | 0.87 * | (0.71–1.03) | 0.47+ | 31.1 | 0.90 * | (0.80–0.99) |
| Hodgkin lymphoma | C81 | 0.11+ | 22.1 | 0.47 * | (0.26–0.67) | 0.07+ | 24.7 | 0.36 * | (0.23–0.48) |
| Non-Hodgkin lymphoma | C82–85, C96 | 0.54+ | 31.5 | 0.98 * | (0.84–1.12) | 0.58+ | 34.7 | 0.80 * | (0.73–0.87) |
| Myeloma | C88, 90 | 0.41+ | 52.3 | 0.52 * | (0.42–0.62) | 0.45+ | 46.8 | 0.59 * | (0.52–0.65) |
| Leukaemias | C91–95 | 0.56+ | -0.1 | 1.81 * | (1.56–2.06) | 0.61+ | 4.9 | 1.50 * | (1.38–1.62) |
| Ill-defined or unspecified | 0.53+ | 42.2 | 0.83 * | (0.75–0.90) | |||||
Publisher’s Note: MDPI stays neutral with regard to jurisdictional claims in published maps and institutional affiliations. |
© 2021 by the authors. Licensee MDPI, Basel, Switzerland. This article is an open access article distributed under the terms and conditions of the Creative Commons Attribution (CC BY) license (https://creativecommons.org/licenses/by/4.0/).
Share and Cite
Bidoli, E.; Lamaj, E.; Angelin, T.; Forgiarini, O.; De Santis, E.; Serraino, D. Linearity of Age at Cancer Onset Worldwide: 25-Year Population-Based Cancer Registry Study. Cancers 2021, 13, 5589. https://0-doi-org.brum.beds.ac.uk/10.3390/cancers13215589
Bidoli E, Lamaj E, Angelin T, Forgiarini O, De Santis E, Serraino D. Linearity of Age at Cancer Onset Worldwide: 25-Year Population-Based Cancer Registry Study. Cancers. 2021; 13(21):5589. https://0-doi-org.brum.beds.ac.uk/10.3390/cancers13215589
Chicago/Turabian StyleBidoli, Ettore, Elda Lamaj, Tiziana Angelin, Ornella Forgiarini, Emilia De Santis, and Diego Serraino. 2021. "Linearity of Age at Cancer Onset Worldwide: 25-Year Population-Based Cancer Registry Study" Cancers 13, no. 21: 5589. https://0-doi-org.brum.beds.ac.uk/10.3390/cancers13215589