
Experimental and Bioinformatic Approaches to Studying DNA Methylation in Cancer


1
Bioinformatics Unit, Josep Carreras Leukemia Research Institute (IJC), 08916 Barcelona, Spain
2
Cancer Epigenetics Group, Josep Carreras Leukemia Research Institute (IJC), 08916 Barcelona, Spain
3
Centro de Investigación Biomédica en Red Cáncer (CIBERONC), 28029 Madrid, Spain
4
Institucio Catalana de Recerca Avançats (ICREA), 08010 Barcelona, Spain
5
Physiological Sciences Department, School of Medicine and Health Sciences, University of Catalonia, 08017 Barcelona, Spain
*
Authors to whom correspondence should be addressed.
Cancers 2022, 14(2), 349; https://0-doi-org.brum.beds.ac.uk/10.3390/cancers14020349
Submission received: 26 November 2021
/
Revised: 26 December 2021
/
Accepted: 6 January 2022
/
Published: 11 January 2022
(This article belongs to the Special Issue Epigenetic Regulation in Human Cancers)
Abstract
:Simple Summary
Aberrations of normal DNA methylation patterns are observed in many cancers and are associated with chromatin alterations, changes in gene expression and genomic instability, making the study of DNA methylation paramount to our understanding of cancer biology and evolution and the development of biomarkers. Here, we present an overview of genome-wide approaches for the analysis of DNA methylation with relevance to cancer research and clinics.
Abstract
DNA methylation is an essential epigenetic mark. Alterations of normal DNA methylation are a defining feature of cancer. Here, we review experimental and bioinformatic approaches to showcase the breadth and depth of information that this epigenetic mark provides for cancer research. First, we describe classical approaches for interrogating bulk DNA from cell populations as well as more recently developed approaches for single cells and multi-Omics. Second, we focus on the computational analysis from primary data processing to the identification of unique methylation signatures. Additionally, we discuss challenges such as sparse data and cellular heterogeneity.
1. Introduction
DNA methylation, as supposed to other epigenetic marks, represents a direct modification of the genome, that is, the addition of a methyl group at the 5th Carbon of the cytosine base. In mammalian genomes predominantly found at CpG dinucleotides, it is an essential mark for normal mammalian development and a defining feature of cellular identity [1]. Aberrant DNA methylation patterns have been observed in numerous diseases, particularly in cancer where global hypomethylation and promoter hyper-methylation are characteristic of the disease [2]. The combined potential to identify subtypes in genetically highly heterogenous cancers and its relative stability during cell proliferation has made DNA methylation an attractive mark for cancer research and diagnostics [3].
DNA methylation is thought to alter chromatin structure in concert with other epigenetic marks, such as histone modifications, transcription factors, etc., and henceforth modify transcriptional potential or, in other words, regulate gene expression. However, the associated biological phenomena are manifold. Initially, much attention was given to the excessive methylation of CpG-rich promotors that occurs at many cancer-related genes. Hyper-methylation in these regions is associated with repression of transcription, whereas in normal tissues, these are generally unmethylated and associated with active gene expression [4,5]. More recently, technological advances of genome-wide high-throughput technologies have revealed that a large proportion of regulatory elements for which DNA methylation marks tissue specificity are located in CpG-poor regions far away from genes [6]. Additionally, DNA methylation may be altered dynamically, affecting TF-binding [7] and thus gene expression in an environmentally dependent manner. Finally, DNA methylation within large hypo- or partially methylated regions occurs in a stochastic manner and follows heterochromatic domains—a phenomena that ultimately has been observed not only in cancers but also in normal cells and that has been associated with cell proliferation history [8,9].
Not only have recent technological advances allowed analysing the smallest amounts of input material down to individual cells but also made it possible to simultaneously capture information from multiple omics essays. These, together with the existing technologies for high-throughput genome-wide analysis, have resulted in a large diversity of computational tools to process and analyse methylation data. Here, we provide an overview of approaches for DNA methylation analysis. We do not attempt to include all available tools but rather have selected the most popular methods to showcase the breadth and depth of information that this epigenetic mark provides for cancer research. We first review established and recent experimental approaches used in the field; second, we focus on bioinformatic data processing and analysis. Finally, we discuss outstanding challenges and future perspectives.
2. DNA Methylation Assays
In short, DNA methylation can be interrogated based on three approaches: (1) bisulfite conversion-based (chemical conversion of unmethylated cytosine to uracil, whereas methylated cytosines are not converted); (2) methylation-sensitive-enzyme-restriction-based (MSRE, restriction site includes methylated or unmethylated cytosine); or (3) affinity enrichment-based (active binding site includes methylated cytosine). Once established, the methylation signal is then analysed by either DNA hybridization or sequencing. To date, analyses of bisulfite-converted DNA by microarray or Next Generation Sequencing are the most commonly employed approaches for methylome studies (Figure 1A). MSRE approaches are limited to the existing restriction sites; therefore, their resolution is limited to fragment size, which particularly for CpG-poor regions, is low. Affinity-based approaches, such as methylated DNA immunoprecipitation sequencing (MeDIP-seq), methylated DNA capture by affinity purification (MethylCap-seq) or methylated DNA binding domain sequencing (MBD-seq), enrich for CpG-rich regions. Although they avoid the DNA damaging bisulfite-treatment, they are more labour intensive, requiring an additional step to retrieve the DNA fragments bound by the respective proteins, and the interpretation of the DNA methylation signal is somewhat difficult.
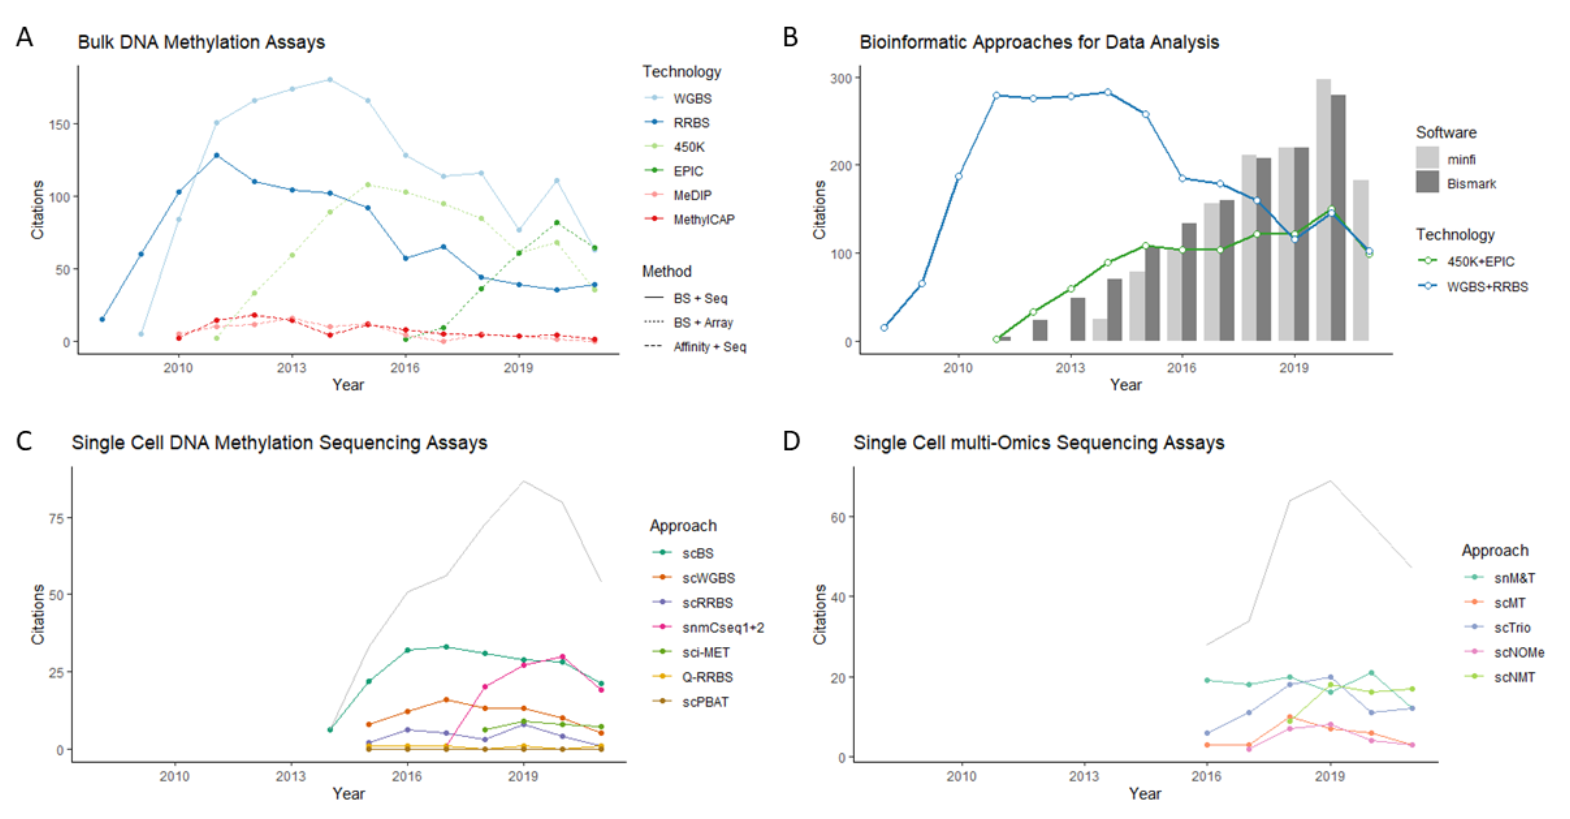
Whole Genome Bisulfite Sequencing (WGBS) constitutes the gold standard for DNA methylation analysis, providing single-base-pair, genome-wide resolution at a coverage of up to 95% of all CpGs in the human genome (~28 × 106 CpG). More cost efficient due to less sequencing required, Reduced Representation Bisulfite Sequencing (RRBS) enriches for CpG-rich fragments via Msp1 restriction and fragment size selection, covering mainly CpG islands and providing coverage of 2–4.5 × 10⁶ CpGs. By far, the most popular approach, due to its low cost and fast turnaround, is the analysis of a fixed set of CpG probes via DNA hybridization microarrays. The widely distributed Illumina BeadChip microarray can cover 27,578 (27K), ~450,000 (450K) [10], or in its latest generation, ~850,000 human CpGs (EPIC array) [11]. Probes mostly include CpG-rich regions, gene promoters, and known cis- regulatory elements (EPIC array). Importantly, for its potential clinical use, the described DNA methylation microarrays perform well for DNA extracted from paraffin-embedded (FFPE) sections [12]. Costs for studies with high sample through-put can be reduced by using targeted sequencing approaches or custom design microarrays (for comprehensive reviews see [13,14]. With the increased application of single-cell and single-cell multi-omics approaches, studies using approaches based on bulk DNA sequencing (WGBS, RBBS) have seemingly declined in popularity compared to microarray-based studies. (Figure 1B–D) However, bioinformatics tools for analysing bisulfite sequencing data, such as Bismark [15], have retained traction since processing of single-cell DNA methylation data is mostly the same as for bulk DNA (Figure 1B).
Bisulfite-based approaches do not distinguish between 5-methyl-(5mC) and 5-hydroxymethyl Cytosine (hmC) modifications. 5-hmC is generated by oxidation of 5mC by TEN-Eleven Translocation (TET) enzymes and was initially perceived as intermediate in a replication-independent demethylation pathway leading to unmodified cytosine [16]. Studies, however, have reported abundant tissue specific stable hydroxymethylation in neurons and embryonic stem cells making 5-hmC, an epigenetic mark in its own right [17,18]. Additionally, loss of 5-hmC has been observed hematopoietic malignancies and solid cancers [19,20]. Hydroxymethylation can be assessed via oxidative bisulfite sequencing (oxBS) or TET-assisted bisulfite sequencing (TAB-seq). oxBS involves the specific oxidation of 5hmC to 5-formylcytosine (5fC) and conversion of the newly formed 5fC to uracil (under bisulfite conditions) [21]. TAB-seq involves β-glucosyltransferase (β-GT)-mediated protection of 5-hmC (glucosylation) and recombinant mouse Tet1(mTet1)-mediated oxidation of 5-methylcytosine (5-mC) to 5-carboxylcytosine (5-caC). After the subsequent bisulfite treatment and PCR amplification, both cytosine and 5-caC (derived from 5-mC) are converted to thymine (T), whereas 5-hmC reads as C [22].
An alternative approach to detect DNA modifications (5mC, hmC, 6mA and others) without involving aggressive chemical treatment is direct long-read sequencing via nanopore sequencing technology. Long reads also allow to study the co-occurrence of base modifications along individual molecules, as well as their phasing with genetic variants, opening up opportunities in exploring epigenetic heterogeneity (see Section 4.2.). Nanopore sequencers (MinION, GridION and PromethION) measure ionic current fluctuation of single-stranded nucleic acid polymers when passing through a biological nanopore [23]. Each nucleotide, including their chemical modifications, exhibits different alterations of the current, and therefore the sequence of bases can be inferred from the specific patterns of current variation. Modifications are inferred as differential patterns from modified and unmodified base calls. Although nanopore basecalling has significantly improved in recent years and there have been several proof-of-concept studies (see [24] for a review), prediction of methylation states from basecalls are still somewhat suboptimal [25]. This has prompted other innovative approaches such as enzymatic methyl-seq (EMseq), which employs C-T conversion via 5-carboxylcytosine combined with nanopore sequencing to increase prediction accuracy and show good accordance with standard approaches such as WGBS [26].
2.1. Single-Cell and Single-Cell Multi-Omics Approaches
During the previous two decades, NGS and microchip technology have elevated DNA methylation studies to yield higher and wider genomic resolution and throughputs of hundreds of samples. More recently, however, technological development has focused on lower DNA input, such as single cells, and the simultaneous incorporation of other “Omics” assays, so-called “multi-Omics methods” (Figure 1C,D).
The first single-cell protocol, scRRBS [27], was established as an adaptation of bulk DNA sequencing for low input material but had only limited genomic coverage (40% of conventional RRBS) and showed excessive PCR duplicates (a fall-back which was later tackled by Q-RRBS with the addition of unique molecular identifiers (UMI) to each initial DNA fragment [28]). scBS-seq [29] implemented post-bisulfite adapter tagging (PBAT) and increased coverage to about 18% of genomic CpGs. Here, sequencing adapters are added to the DNA after bisulfite treatment to prevent loss of fragmented DNA, which is a result of the aggressive BS reaction. It was quickly followed by scWGBS [30] that also utilized PBAT, although without a pre-amplification step that was used by scBS-seq and allowed the preservation of strandedness and reduced amplification bias. Other approaches, such as single nucleus methylcytosine sequencing (snmC-seq), improved the recovery of bisulfite-converted, single-stranded DNA during library preparation [31], or such as sci-Met, added high-throughput single-cell processing by combinatorial indexing [32].
Single-cell multi-omics approaches that included methylation analysis were developed starting in 2016: scMT [33] and scM&T to interrogate DNA methylation and the transcriptome simultaneously [34]; and scTrio to interrogate methylome, transcriptome and copy number variation at the same time [35]. DNA and RNA are physically separated prior to bisulfite treatment and are analysed by scBS-seq or scRRBS, scWGS and Smartseq2, respectively. Shortly after, the Nucleosome Occupancy and Methylation sequencing protocol (NoMe-seq) which interrogates open chromatin, nucleosome positioning and DNA methylation was adapted for single-cell analysis with scNOMe-seq [36] and further combined with Smartseq2 for transcriptome analysis with scNMT [37] (Figure 1D). Other developments of multi-omics approaches are directed towards higher sample throughput and systems that prevent DNA loss, such as single tube reactions and multi-fluid systems (for an extensive review on single-cell/ single-cell-Omics methods, see [38]).
2.2. Cell-Free Circulating Tumour DNA (ct) from Liquid Biopsies
Analysis of cell-free circulating tumour DNA (ct) from liquid biopsies provides a minimal-invasive approach for the study and monitoring of tumour evolution. Epigenomic analyses, including DNA methylation, can significantly contribute to information gained from genomic analysis of cf-DNA and have outperformed classifications and cell-of-origin assignments based on SNP and CNV calling [39]. Ct-DNA is highly fragmented (mostly 130–160 bp fragment length) and may make up 3–90% of the total cell-free DNA, depending on cancer type and stage [40], which requires highly sensitive analysis methods such as deep sequencing (BS-seq) or targeted approaches (hybrid capture, PCR). Alternatively, pooled cf-DNA extractions have been used for microarray analysis to reach sufficient amounts of required inputs [41]. Additionally, affinity-based approaches, specifically cfMeDIP-seq, have proven particularly successful, as they only require minute amounts of input material [42]. Due to the peculiarities of the input material, studies generally first establish reference panels to identify significant marker loci, then subsequently assay these [39,40].
3. Processing of DNA Methylation Data
All data processing, whether based on bisulfite sequencing, bisulfite microarrays or affinity enrichment, starts with an initial step of raw data quality control (Table 1). From here, sequence-based approaches perform trimming of unwanted bases from the reads, such as sequencing adapters or unwanted bases resulting from enzymatic end repair. However, alignment for BS-seq reads needs to consider the bisulfite-induced conversion of un-methylated Cytosine to Uracil (and subsequently to Thymine through PCR amplification). As such, BS aligners either perform a wild-card alignment against C or T equally (e.g., BSMAP [43]) or, more common, align against a converted and un-converted version of the reference genome (so-called ‘three-letter aligners’ such as Bismark [15], BS-seeker [44], gem3 [45]; for a recent benchmark of BS aligners, see [46]). MBP-seq approaches, since they do not undergo bisulfite treatment, require only standard genomic read alignment tools. The post-alignment removal of PCR duplicates (usually by identifying reads with the same start and end coordinates) is performed for all approaches involving sequencing, but due to the enrichment step, approaches such as RRBS or MeDiP-seq and MethylCap only remove duplicates above a certain coverage threshold. Since naturally occurring single-nucleotide variants (SNPs) affect the methylation estimates from BS-treated DNA, known SNPs are mostly filtered out. Some processing pipelines such as gemBS [45] incorporate SNP calling from BS-seq to detect additional SNPs.
Finally, methylation levels are estimated from read coverage. For BS-seq data, this is commonly calculated from reads containing unconverted (=methylated) or converted (=unmethylated) cytosines as the proportion of unconverted cytosines over all counts (unmethylated + methylated). More accurately, this can be estimated in a probabilistic manner, taking into account bs-conversion rates and sequencing errors as well as a beta-binomial distribution dependent on read counts, although in practise, the differences are marginal and become only significant at low read coverage [63]. For MeDIP-seq and MethylCAP, methylation levels are estimated as local enrichment of reads, which is derived from a normalized signal against the background [56,64].
Since they are based on hybridization technology, data from microarrays do not require any read alignments. For the Illumina BeadChip platforms, the initial chip image is internally processed inside the scanner. The output signal, the chips’ two colour channels (red and green), is then subsequently background corrected (quality controls probes) and normalised using a variety of methods [65]. The popular analysis package minfi includes several normalizations, amongst them, for example, ssNoob, which adjusts for technical variation across platforms [60]. Finally, methylation levels are inferred from the ratio of both colour channels as beta value or its log ratio, the M-value.
4. Analysis of DNA Methylation
4.1. Exploratory Data Analysis and Sparse Data
As a first step after the primary data processing, exploratory analysis usually involves visualizing similarities between samples to check for technical biases (batch effects) or phenotypes (Table 2). Principle component analysis (PCA) is useful for visualizing data spread along individual components of sample variance. In the case of complex data, such as single-cell data, dimensionality reduction methods such as classical multidimensional scaling (MDS), t-distributed stochastic neighbour embedding (t-SNE), or negative matrix factorization (NMF) have proven successful [31,32]. Further, clustering approaches such as k-means or hierarchical clustering (un-/supervised) are useful in identifying meaningful groupings such as cancer sub-types, treatment conditions or cell populations. Specialized algorithms have been used for single-cell data analysis (e.g., DBSCAN [32]) and multi-omics data [66,67]. Multi-omics clustering leverages data from multiple assays and allows for a more comprehensive insight into population structure, while at the same time facing computational and statistical challenges of multi-dimensional integration (for in-depth evaluation of different methods, see [66,67]).
Compared to bulk DNA, single-cell data are sparse and discrete. As there are theoretically only two copies of any given DNA fragment present and bisulfite treatment aggressively attacks those, any failure of capturing a particular fragment or sequencing error results in data loss. Sequencing data from single-cell DNA typically suffers generally low mappability and reduced heterogenic genomic coverage. As a result, methylomes from single-cell data are often composed of 10–100s of individual cells, or the methylation signal is summarized over genomic regions [30]. To achieve more even genomic coverage and facilitate downstream analysis, several algorithms have been developed that leverage the correlation of methylation levels across neighbouring CpG as well as information from across-cells information. For example, Melissa [75] and Epiclonal [76] use local regression models combined with a (Bayesian) model prior to predict latent methylation profiles of genomic regions. DeepCpG [77], on the other hand, employs deep learning (neural networks) to predict methylation levels based on sequence composition (Table 2).
4.2. Deconvolution of Cellular Heterogeneity and Estimating Tumour Purity
When investigating bulk DNA, a major convoluting factor in analysing differential methylation is that variance amongst conditions might be caused by factors not related to differences in cellular phenotypes but rather to differences in the cell type composition of samples. Surrogate variance analysis (SVA) is an established method to remove unwanted variation (batch correction) of unknown origin, and it can similarly be applied to correct for the difference in cell-type composition (Table 3). Other reference-free and semi-reference-free approaches employ methods such as NMF and recursive Quantile Projection (QP) which have been used to estimate cell type proportions. However, when the contributing cell types are known and/or reference data are available, reference-based approaches for cell-type deconvolution such as robust partial correlations (RPC), support vector regression (see CIBERSORT/METHYLCIBERSORT) or constrain projection (see Houseman CP) are preferrable [78,79]. Naturally, the success of the deconvolution highly depends on the quality and applicability of the reference and the knowledge about which cell types to expect. Low or inappropriate reference data can lead to biased results. Classically, pure sorted cell populations have been used as refences, but single-cell data are increasingly incorporated. Teschendorff et al. [80] even developed deconvolution of bulk WGBS using scRNA-seq data.
The latter class of algorithms has been applied predominantly to blood since it is a medium frequently used for research (and diagnostics) and is known for a cellular composition that readily changes depending on a variety of factors. In cancer research, however, an important issue is to estimate tumour-purity by accounting for non-tumoral cells, but often tumour reference data are rarely available. Here, the package HEpiDiSH uses reference data from immune cells, fibroblasts, epithelial cells and adipocytes to infer the tumour model (e.g., for oral and breast cancer) [84]. Other packages such as MethylResolveR [86] have concentrated on using a set of distinct immune cell types or, similar to METHYLCIBERSORT (based on CIBERSORT) [85], have additionally established a large cancer reference set from cell lines to demonstrate that the type and proportion of contributing/invading immune cells are associated with survival and other characteristics.
Any deconvolution of heterogeny as described above has is based on differentially methylated, cell specific informative sites, which have to be identified and extracted upfront from the global set (see Section 5.1). Alternative approaches utilize information from neighbouring CpGs that are co-located within sequencing reads from bisulfite sequencing data. As mentioned before, methylation patterns tend to spread across a region such that there is high correlation between neighbouring CpGs in normal cells. Cancers have aberrant methylation, showing higher variations in DNA methylations than normal cells. By stratifying sequencing reads from bisulfite sequencing data into concordant reads (all CpGs are either methylated or unmethylated) and discordant reads (CpG have disordered methylation patterns), the proportion of discordant reads can be used to estimate the tumour proportion in a given sample—an approach that has been successfully implemented in predicting the tumour-derived cell free-DNA fraction in human cancer plasma [87]. Similarly, measures such as epipolymorphism and methylation entropy are based on epiallele frequency (epiallele—unique combination of CpG methylation states within a read) and have also been used to quantify within sample heterogeneity [89].
5. DNA Methylation Signatures
5.1. Differential Methylation
Identifying meaningful specific methylation signatures is the ultimate goal of methylation analysis. Differential methylation can be described for single sites (DMC—differentially methylated CpGs; DMP—differentially methylated probes), sets of adjacent sites (DMR—differentially methylated regions), or pre-defined genomic regions such as tiling windows, promoters, enhancers, etc. (Table 4).
For microarray derived beta-values, significant differences between two groups of samples are commonly estimated based on t-statistics (t-test, Welsh-test, Permutation test) or moderated t-statistics (Empirical Bayes) since their distribution is approximately Gaussian. Methylation values derived from count data such as methylated/unmethylated sequencing reads follow a binomial distribution and are modelled by either a beta-binomial or negative-binomial distribution variance across samples estimated by a dispersion parameter (edgeR, DSS, MethylKit). For analysing multiple samples and/or to include covariates, regression analysis is the natural choice. Once significance is established (e.g. p-value < 0.01), relevant sites are usually selected by a minimum threshold of absolute differences between mean methylation values which may depend on the phenotype in question. For example, many smoking-associated DMCs show differences as low as 5%, whereas most cancer-associated DMCs exhibit differences much larger (25–30%) [78].
In practice, changes in methylation are typically estimated for differentially methylated regions (DMRs) rather than individual DMCs. This reduces data dimensionality and increases the power of detection by employing nearby CpGs. In the case of pre-defined regions, the methylation signal is simply summarized over the entire region, and statistical testing, similar as for single sites, is applied (e.g., MethylKit [88], RnBeads [92], edgeR [96], MethylSig [90]). Alternatively, de novo DMRs can be defined as an extension of DMCs, where a DMR constitutes a region containing a minimum number of DMCs at a maximum distance and minimum/maximum absolute length (e.g., DSS package [97]). Other tools take into account the correlation between nearby CpGs. Bumbphunter [98] (implemented in the minfi package) first fits a linear regression model for each locus and then smooths the coefficient within clusters along the genome to identity bumps, i.e., DMRs. Similarly, DMRcate [94] first establishes local moderate t statistics (limmas t2s) and then applies a Gausschian kernel for smoothing within a specific window—a method the authors claim to be platform agnostic and to remove bias derived from sparse and irregularly spaced CpGs. Dmrff [95] derives subregions from stretches of DMCs, evaluates and adjusts them, and then combines the most significant into candidate DMRs which are then evaluated again.
5.2. Methylome Segmentation and the DNA Methylation Landscape
Another approach to describe methylation signatures takes into account larger scale methylation features in the form of genomic segments that have been shown to be associated with certain chromatin states and 3D structures. Hidden Markov Models (HMMs) have been implemented in several applications to identify regions of similar methylation states (Table 5). For example, Stadler et al. (2011) [7] implemented a three-state HMM that identified unmethylated regions (UMRs), lowly methylated regions (LMRs) and fully methylated regions (HMRs), which corresponded to unmethylated CpG islands, short CpG-poor regions with intermediate methylation and the remaining bulk of the genome, respectively. UMRs were associated with open chromatin and active transcription start sites, whereas LMRs were identified as active enhancers. A two-state HMM by Song et al. (2013) [99] identified hypo- and hypermethylated regions recorded in MethBase, a public database of tissue-specific DNA methylation features. Longer hypo-methylated regions of several kilobase pair lengths were coined ‘DNA methylation valleys (DMVs) and canyons’ and have been implicated in developmental processes and cancers, such as leukaemia and advanced prostate cancer [100,101,102].
On a larger scale, at the size of tens of kilobase and megabase pairs, so called “hypomethylated domains” or “partially methylated domains” (PMDs) are associated with heterochromatin and transcriptional silencing and coincide with topologically associated domains (TADs) and lamina-associated domains (LADs) [9,104]. The stochastically occurring methylation in these domains and the associated global hypomethylation are characteristic for many cancers. However, several studies have shown they also occur in normal tissues, such as fibroblast, adipocytes or mature lymphocytes [6,8].
6. Downstream Analysis: Interpretation and Application of DNA Methylation Signatures for Research and Clinics
Interpretating DNA methylation signatures generally involves other types of omics data for additional downstream analysis. For example, the correlation of DNA methylation with gene expression via RNA-seq or expression arrays allows assessing the phenotypic impact of epigenetic modifications and insights into biological processes via pathway and/or network analysis. Associating DNA methylation states with histone modifications and TF motif binding (e.g., from ChIP-seq experiments) as well as chromatin accessibility (e.g., via DNAseq, ATAC-seq) and conformation (e.g., Hi-C seq) allows to unravel mechanisms of gene regulation (see https://epigenie.com/epigenetic-tools-and-databases/, last accessed on 1 January 2022, for a list of epigenetic tools and databases for downstream analysis and visualization).
A vital output of DNA methylation analysis for cancer diagnostics is the identification of novel and clinically relevant subtypes. Recent statistical approaches for integrative multi-omics analysis (including similarity- and correlation-based, Bayesian, fusion and other multi-variate methods) have greatly improved subtyping of cancers and feature selection identifying novel biomarkers and driver genes [105]. Machine learning algorithms, such as random-forest or neural networks, have enabled the classification of brain tumours [106] and sarcomas [107] and even the assignment of primary tumour sites for metastases of unknown origin [108]. Similarly, important for the clinic, they have been applied to predict responses to pharmacological [109] and cellular immunotherapy [110] and model patient survival [111].
7. Conclusion and Remaining Challenges
Next generation sequencing and microarray technology have allowed to interrogate DNA methylation at unpreceded genomic resolution and sample throughput, while recent low input and single-cell technologies have enabled interrogation of cell-free DNA and rare-cell populations. Through computational tools, these data have yielded insights into the interplay of DNA methylation and chromatin structure and have greatly improved our understanding of cancer biology and evolution. Together, they have greatly aided the molecular characterisation, classification and ultimate detection of cancers and their tissue of origin. While genome-wide methylation analyses are paramount for the development of biomarkers, for clinical practice, they are further informative to determine treatment resistance and predict cancer risk, fragility, and mortality rates.
Challenges remain in areas of deconvoluting cellular heterogeneity, where clonal or and/or cellular heterogeneity is excessive, or reference data are sparse or not available. Furthermore, cell–cell interactions represent an important characteristic in tumour biology and remain largely unaccounted for by most algorithms.
Author Contributions
Conceptualization, A.M. and M.E.; writing—original draft preparation, A.M.; writing—editing and review, A.M. and M.E. All authors have read and agreed to the published version of the manuscript.
Funding
We thank CERCA Programme/Generalitat de Catalunya for institutional support. This work was supported by the Health Department PERIS-project no. SLT/002/16/00374 and AGAUR-projects no. 2017SGR1080 of the Catalan Government (Generalitat de Catalunya); Ministerio de Ciencia e Innovación (MCI), Agencia Estatal de Investigación (AEI) and European Regional Development Fund (ERDF) project no. RTI2018-094049-B-I00.
Conflicts of Interest
M.E. is a consultant of Ferrer International and Quimatryx.
References
- Berdasco, M.; Esteller, M. Aberrant Epigenetic Landscape in Cancer: How Cellular Identity Goes Awry. Dev. Cell 2010, 19, 698–711. [Google Scholar] [CrossRef] [PubMed] [Green Version]
- Esteller, M. Cancer epigenomics: DNA methylomes and histone-modification maps. Nat. Rev. Genet. 2007, 8, 286–298. [Google Scholar] [CrossRef] [PubMed]
- Berdasco, M.; Esteller, M. Clinical epigenetics: Seizing opportunities for translation. Nat. Rev. Genet. 2019, 20, 109–127. [Google Scholar] [CrossRef] [PubMed]
- Esteller, M. CpG island hypermethylation and tumor suppressor genes: A booming present, a brighter future. Oncogene 2002, 21, 5427–5440. [Google Scholar] [CrossRef] [PubMed] [Green Version]
- Deaton, A.M.; Bird, A. CpG islands and the regulation of transcription. Genes Dev. 2011, 25, 1010–1022. [Google Scholar] [CrossRef] [Green Version]
- Lister, R.; Pelizzola, M.; Kida, Y.S.; Hawkins, R.D.; Nery, J.R.; Hon, G.; Antosiewicz-Bourget, J.; O’Malley, R.; Castanon, R.; Klugman, S.; et al. Hotspots of aberrant epigenomic reprogramming in human induced pluripotent stem cells. Nature 2011, 471, 68–73. [Google Scholar] [CrossRef] [Green Version]
- Stadler, M.B.; Murr, R.; Burger, L.; Ivanek, R.; Lienert, F.; Schöler, A.; van Nimwegen, E.; Wirbelauer, C.; Oakeley, E.J.; Gaidatzis, D.; et al. DNA-binding factors shape the mouse methylome at distal regulatory regions. Nature 2011, 480, 490–495. [Google Scholar] [CrossRef]
- Kulis, M.; Merkel, A.; Heath, S.; Queirós, A.C.; Schuyler, R.P.; Castellano, G.; Beekman, R.; Raineri, E.; Esteve, A.; Clot, G.; et al. Whole-genome fingerprint of the DNA methylome during human B cell differentiation. Nat. Genet. 2015, 47, 746–756. [Google Scholar] [CrossRef]
- Gaidatzis, D.; Burger, L.; Murr, R.; Lerch, A.; Dessus-Babus, S.; Schübeler, D.; Stadler, M.B. DNA Sequence Explains Seemingly Disordered Methylation Levels in Partially Methylated Domains of Mammalian Genomes. PLoS Genet. 2014, 10, e1004143. [Google Scholar] [CrossRef] [Green Version]
- Sandoval, J.; Heyn, H.A.; Moran, S.; Serra-Musach, J.; Pujana, M.A.; Bibikova, M.; Esteller, M. Validation of a DNA methylation microarray for 450,000 CpG sites in the human genome. Epigenetics 2011, 6, 692–702. [Google Scholar] [CrossRef]
- Moran, S.; Arribas, C.; Esteller, M. Validation of a DNA methylation microarray for 850,000 CpG sites of the human genome enriched in enhancer sequences. Epigenomics 2016, 8, 389–399. [Google Scholar] [CrossRef] [PubMed] [Green Version]
- Moran, S.; Esteller, M. Infinium DNA Methylation Microarrays on Formalin-Fixed, Paraffin-Embedded Samples. In CpG Islands: Methods and Protocols; Vavouri, T., Peinado, M.A., Eds.; Springer: New York, NY, USA, 2018; pp. 83–107. [Google Scholar]
- Laird, P.W. Principles and challenges of genome—Wide DNA methylation analysis. Nat. Rev. Genet. 2010, 11, 191–203. [Google Scholar] [CrossRef] [PubMed]
- Bock, C. Analysing and interpreting DNA methylation data. Nat. Rev. Genet. 2012, 13, 705–719. [Google Scholar] [CrossRef] [PubMed]
- Krueger, F.; Andrews, S.R. Bismark: A flexible aligner and methylation caller for Bisulfite-Seq applications. Bioinformatics 2011, 27, 1571–1572. [Google Scholar] [CrossRef]
- Amarasinghe, S.L.; Su, S.; Dong, X.; Zappia, L.; Ritchie, M.E.; Gouil, Q. Opportunities and challenges in long-read sequencing data analysis. Genome Biol. 2020, 21, 1–16. [Google Scholar] [CrossRef] [Green Version]
- Lister, R.; Mukamel, E.A.; Nery, J.R.; Urich, M.; Puddifoot, C.A.; Johnson, N.D.; Lucero, J.; Huang, Y.; Dwork, A.J.; Schultz, M.D.; et al. Global epigenomic reconfiguration during mammalian brain development. Science 2013, 341, 1237905. [Google Scholar] [CrossRef] [Green Version]
- Ficz, G.; Branco, M.R.; Seisenberger, S.; Santos, F.; Krueger, F.; Hore, T.A.; Marques, C.J.; Andrews, S.; Reik, W. Dynamic regulation of 5-hydroxymethylcytosine in mouse ES cells and during differentiation. Nature 2011, 473, 398–402. [Google Scholar] [CrossRef]
- Lian, C.G.; Xu, Y.; Ceol, C.; Wu, F.; Larson, A.; Dresser, K.; Xu, W.; Tan, L.; Hu, Y.; Zhan, Q.; et al. Loss of 5-hydroxymethylcytosine is an epigenetic hallmark of Melanoma. Cell 2012, 150, 1135–1146. [Google Scholar] [CrossRef] [Green Version]
- Ko, M.; An, J.; Pastor, W.A.; Koralov, S.B.; Rajewsky, K.; Rao, A. TET proteins and 5-methylcytosine oxidation in hematological cancers. Immunol. Rev. 2015, 263, 6–21. [Google Scholar] [CrossRef] [Green Version]
- Booth, M.J.; Ost, T.W.B.; Beraldi, D.; Bell, N.M.; Branco, M.R.; Reik, W.; Balasubramanian, S. Oxidative bisulfite sequencing of 5-methylcytosine and 5-hydroxymethylcytosine. Nat. Protoc. 2013, 8, 1841–1851. [Google Scholar] [CrossRef] [Green Version]
- Yu, M.; Hon, G.C.; Szulwach, K.E.; Song, C.X.; Jin, P.; Ren, B.; He, C. Tet-assisted bisulfite sequencing of 5-hydroxymethylcytosine. Nat. Protoc. 2012, 7, 2159–2170. [Google Scholar] [CrossRef] [Green Version]
- Jain, M.; Olsen, H.E.; Paten, B.; Akeson, M. The Oxford Nanopore MinION: Delivery of nanopore sequencing to the genomics community. Genome Biol. 2016, 17. [Google Scholar] [CrossRef] [Green Version]
- Li, W.; Ye, Z.; Wan, S.; Liu, H.; Zhang, J.; Xie, S.; Xu, J. Cancer biomarkers discovery of methylation modification with direct high-throughput nanopore qequencing. Front. Genet. 2021, 12, 672804. [Google Scholar] [CrossRef]
- Yuen, Z.W.S.; Srivastava, A.; Daniel, R.; McNevin, D.; Jack, C.; Eyras, E. Systematic benchmarking of tools for CpG methylation detection from nanopore sequencing. Nat. Commun. 2021, 12, 3438. [Google Scholar] [CrossRef]
- Sakamoto, Y.; Zaha, S.; Nagasawa, S.; Miyake, S.; Kojima, Y.; Suzuki, A.; Suzuki, Y. Long-read whole-genome methylation patterning using enzymatic base conversion and nanopore sequencing. Nucleic Acids Res. 2021, 49, e81. [Google Scholar] [CrossRef]
- Guo, H.; Zhu, P.; Wu, X.; Li, X.; Wen, L.; Tang, F. Single-Cell methylome landscapes of mouse embryonic stem cells and early embryos analyzed using reduced representation bisulfite sequencing. Genome Res. 2013, 23, 2126–2135. [Google Scholar] [CrossRef] [Green Version]
- Wang, K.; Li, X.; Dong, S.; Liang, J.; Mao, F.; Zeng, C.; Wu, H.; Wu, J.; Cai, W.; Sun, Z.S. Q-RRBS: A quantitative reduced representation bisulfite sequencing method for single-cell methylome analyses. Epigenetics 2015, 10, 775–783. [Google Scholar] [CrossRef]
- Smallwood, S.A.; Lee, H.J.; Angermueller, C.; Krueger, F.; Saadeh, H.; Peat, J.; Andrews, S.R.; Stegle, O.; Reik, W.; Kelsey, G. Single-cell genome-wide bisulfite sequencing for assessing epigenetic heterogeneity. Nat. Methods 2014, 27. [Google Scholar] [CrossRef]
- Farlik, M.; Sheffield, N.C.; Nuzzo, A.; Datlinger, P.; Schönegger, A.; Klughammer, J.; Bock, C. Single-Cell DNA Methylome Sequencing and Bioinformatic Inference of Epigenomic Cell-State Dynamics. Cell Rep. 2015, 10, 1386–1397. [Google Scholar] [CrossRef] [Green Version]
- Luo, C.; Keown, C.L.; Kurihara, L.; Zhou, J.; He, Y.; Li, J.; Castanon, R.; Lucero, J.; Nery, J.R.; Sandoval, J.P.; et al. Single-cell methylomes identify neuronal subtypes and regulatory elements in mammalian cortex. Sci. 2017, 357, 600–604. [Google Scholar] [CrossRef] [Green Version]
- Mulqueen, R.M.; Pokholok, D.; Norberg, S.J.; Torkenczy, K.A.; Fields, A.J.; Sun, D.; Sinnamon, J.R.; Shendure, J.; Trapnell, C.; O’Roak, B.J.; et al. Highly scalable generation of DNA methylation profiles in single cells. Nat. Biotechnol. 2018, 36, 428–431. [Google Scholar] [CrossRef]
- Hu, Y.; Huang, K.; An, Q.; Du, G.; Hu, G.; Xue, J.; Zhu, X.; Wang, C.Y.; Xue, Z.; Fan, G. Simultaneous profiling of transcriptome and DNA methylome from a single cell. Genome Biol. 2016, 17, 1–11. [Google Scholar] [CrossRef] [Green Version]
- Angermueller, C.; Clark, S.J.; Lee, H.J.; Macaulay, I.C.; Teng, M.J.; Hu, T.X.; Krueger, F.; Smallwood, S.A.; Ponting, C.P.; Voet, T.; et al. Parallel single-cell sequencing links transcriptional and epigenetic heterogeneity. Nat. Methods 2016, 13, 229–232. [Google Scholar] [CrossRef] [Green Version]
- Hou, Y.; Guo, H.; Cao, C.; Li, X.; Hu, B.; Zhu, P.; Wu, X.; Wen, L.; Tang, F.; Huang, Y.; et al. Single-cell triple omics sequencing reveals genetic, epigenetic, and transcriptomic heterogeneity in hepatocellular carcinomas. Cell Res. 2016, 26, 304–319. [Google Scholar] [CrossRef]
- Pott, S. Simultaneous measurement of chromatin accessibility, DNA methylation, and nucleosome phasing in single cells. elife 2017, 6, 1–19. [Google Scholar] [CrossRef]
- Clark, S.J.; Argelaguet, R.; Kapourani, C.A.; Stubbs, T.M.; Lee, H.J.; Alda-Catalinas, C.; Krueger, F.; Sanguinetti, G.; Kelsey, G.; Marioni, J.C.; et al. ScNMT-seq enables joint profiling of chromatin accessibility DNA methylation and transcription in single cells e. Nat. Commun. 2018, 9, 1–9. [Google Scholar] [CrossRef] [Green Version]
- Karemaker, I.D.; Vermeulen, M. Single-Cell DNA Methylation Profiling: Technologies and Biological Applications. Trends Biotechnol. 2018, 36, 952–965. [Google Scholar] [CrossRef]
- Angeles, A.K.; Janke, F.; Bauer, S.; Christopoulos, P.; Riediger, A.L.; Sültmann, H. Liquid biopsies beyond mutation calling: Genomic and epigenomic features of cell-free dna in cancer. Cancers 2021, 13, 5615. [Google Scholar] [CrossRef]
- Fettke, H.; Kwan, E.M.; Azad, A.A. Cell-free DNA in cancer: Current insights. Cell Oncol. 2019, 42, 13–28. [Google Scholar] [CrossRef]
- Moss, J.; Magenheim, J.; Neiman, D.; Zemmour, H.; Loyfer, N.; Korach, A.; Samet, Y.; Maoz, M.; Druid, H.; Arner, P.; et al. Comprehensive human cell-type methylation atlas reveals origins of circulating cell-free DNA in health and disease. Nat. Commun. 2018, 9, 5068. [Google Scholar] [CrossRef] [Green Version]
- Shen, S.Y.; Singhania, R.; Fehringer, G.; Chakravarthy, A.; Roehrl, M.H.A.; Chadwick, D.; Zuzarte, P.C.; Borgida, A.; Wang, T.T.; Li, T.; et al. Sensitive tumour detection and classification using plasma cell-free DNA methylomes. Nature 2018, 563, 579–583. [Google Scholar] [CrossRef] [PubMed]
- Xi, Y.; Li, W. BSMAP: Whole genome bisulfite sequence MAPping program. BMC Bioinform. 2009, 10, 1–9. [Google Scholar] [CrossRef] [PubMed] [Green Version]
- Chen, P.-Y.; Cokus, S.J.; Pellegrini, M. Open Access SOFTWARE Software BS Seeker: Precise mapping for bisulfite sequencing. BMC Bioinform. 2010, 11, 2–7. [Google Scholar] [CrossRef] [PubMed] [Green Version]
- Merkel, A.; Fernández-Callejo, M.; Casals, E.; Marco-Sola, S.; Schuyler, R.; Gut, I.G.; Heath, S.C. GemBS: High throughput processing for DNA methylation data from bisulfite sequencing. Bioinformatics 2019. [Google Scholar] [CrossRef] [Green Version]
- Nunn, A.; Otto, C.; Stadler, P.F.; Langenberger, D. Erratum to: Comprehensive benchmarking of software for mapping whole genome bisulfite data: From read alignment to DNA methylation analysis. Brief. Bioinform. 2021, 22, 1–9. [Google Scholar] [CrossRef]
- Simons, A. FastQC: A Quality Control Tool for High Throughput Sequencing Data. Available online: https://www.bioinformatics.babraham.ac.uk/projects/fastqc/ (accessed on 25 November 2021).
- Krueger, F. Trim Galore. Available online: https://www.bioinformatics.babraham.ac.uk/projects/trim_galore/ (accessed on 25 November 2021).
- GitHub. Picard Tools. Available online: https://broadinstitute.github.io/picard/ (accessed on 25 November 2021).
- Liu, Y.; Siegmund, K.D.; Laird, P.W.; Berman, B.P. Bis-SNP: Combined DNA methylation and SNP calling for Bisulfite-seq data. Genome Biol. 2012, 13, R61. [Google Scholar] [CrossRef] [Green Version]
- Van der Auwera, G.; O’Connor, B. Genomics in the Cloud, 1st ed.; O’Reilly Medi, Inc.: Newton, MS, USA, 2020. [Google Scholar]
- Barturen, G.; Rueda, A.; Oliver, J.L.; Hackenberg, M. MethylExtract: High-Quality methylation maps and SNV calling from whole genome bisulfite sequencing data. F1000Research 2013, 2, 1–23. [Google Scholar] [CrossRef]
- Langmead, B.; Salzberg, S.L. Fast gapped-read alignment with Bowtie 2. Nat. Methods 2012, 9, 357–359. [Google Scholar] [CrossRef] [Green Version]
- Li, H.; Durbin, R. Fast and accurate short read alignment with Burrows-Wheeler transform. Bioinformatics 2009, 25, 1754–1760. [Google Scholar] [CrossRef] [Green Version]
- Love, M.I.; Huber, W.; Anders, S. Moderated estimation of fold change and dispersion for RNA-seq data with DESeq2. Genome Biol. 2014, 15, 550. [Google Scholar] [CrossRef] [Green Version]
- Lienhard, M.; Grimm, C.; Morkel, M.; Herwig, R.; Chavez, L. MEDIPS: Genome-wide differential coverage analysis of sequencing data derived from DNA enrichment experiments. Bioinformatics 2014, 30, 284–286. [Google Scholar] [CrossRef]
- Stark, R.; Brown, R. DiffBind: Differential Binding Analysis of ChIP-Seq Peak Data. 2011. Available online: http://bioconductor.org/packages/release/bioc/vignettes/DiffBind/inst/doc/DiffBind.pdf (accessed on 25 November 2021).
- Lienhard, M.; Grasse, S.; Rolff, J.; Frese, S.; Schirmer, U.; Becker, M.; Börno, S.; Timmermann, B.; Chavez, L.; Sültmann, H.; et al. QSEA-modelling of genome-wide DNA methylation from sequencing enrichment experiments. Nucleic Acids Res. 2017, 45, e44. [Google Scholar] [CrossRef] [Green Version]
- Shabalin, A.A.; Hattab, M.W.; Clark, S.L.; Chan, R.F.; Kumar, G.; Aberg, K.A.; van den Oord, E.J.C.G. RaMWAS: Fast methylome-wide association study pipeline for enrichment platforms. Bioinformatics 2018, 34, 2283–2285. [Google Scholar] [CrossRef]
- Aryee, M.J.; Jaffe, A.E.; Corrada-Bravo, H.; Ladd-Acosta, C.; Feinberg, A.P.; Hansen, K.D.; Irizarry, R.A. Minfi: A flexible and comprehensive Bioconductor package for the analysis of Infinium DNA methylation microarrays. Bioinformatics 2014, 30, 1363–1369. [Google Scholar] [CrossRef] [Green Version]
- Ritchie, M.E.; Phipson, B.; Wu, D.; Hu, Y.; Law, C.W.; Shi, W.; Smyth, G.K. limma powers differential expression analyses for RNA-sequencing and microarray studies. Nucleic Acids Res. 2015, 43, e47. [Google Scholar] [CrossRef]
- Pidsley, R.; Wong, C.C.Y.; Volta, M.; Lunnon, K.; Mill, J.; Schalkwyk, L.C. A data-driven approach to preprocessing Illumina 450 K methylation array data. BMC Genom. 2013, 14, 293. [Google Scholar] [CrossRef] [Green Version]
- Merkel, A.; Heath, S.C. DNA Methylation Assays Using Bisulphite Sequencing and Next-Generation Sequencing. In Data Analysis for Omics Science: Methos and Applications; Jaumot, J., Bedia, C., Taula, R., Eds.; Elsvier: Oxford, UK, 2018; pp. 108–137. [Google Scholar]
- Rodriguez, B.A.T.; Frankhouser, D.; Murphy, M.; Trimarchi, M.; Tam, H.H.; Curfman, J.; Huang, R.; Chan, M.W.Y.; Lai, H.C.; Parikh, D.; et al. Methods for high-throughput MethylCap-Seq data analysis. BMC Genom. 2012, 13, 1–11. [Google Scholar] [CrossRef] [Green Version]
- Wilhelm-Benartzi, C.S.; Koestler, D.C.; Karagas, M.R.; Flanagan, J.M.; Christensen, B.C.; Kelsey, K.T.; Marsit, C.J.; Houseman, E.A.; Brown, R. Review of processing and analysis methods for DNA methylation array data. Br. J. Cancer 2013, 109, 1394–1402. [Google Scholar] [CrossRef] [Green Version]
- Rappoport, N.; Shamir, R. Multi-omic and multi-view clustering algorithms: Review and cancer benchmark. Nucleic Acids Res. 2018, 46, 10546–10562. [Google Scholar] [CrossRef]
- Chauvel, C.; Novoloaca, A.; Veyre, P.; Reynier, F.; Becker, J. Evaluation of integrative clustering methods for the analysis of multi-omics data. Brief. Bioinform. 2020, 21, 541–552. [Google Scholar] [CrossRef]
- R Core Team. R: A Language and Environment for Statistical Computing; Vienna, Austria. 2013. Available online: https://www.R-project.org/ (accessed on 25 November 2021).
- Venables, W.N.; Ripley, B.D. Modern Applied Statistics with S, Fourth; Springer: New York, NY, USA, 2002. [Google Scholar]
- Krijthe, J.H. Rtsne: T-Distributed Stochastic Neighbor Embedding Using a Barnes-Hut Implementation. 2015. Available online: https://github.com/jkrijthe/Rtsne (accessed on 25 November 2021).
- Gaujoux, R.; Seoighe, C. A flexible R package for nonnegative matrix factorization. BMC Bioinform. 2010, 11, 367. [Google Scholar] [CrossRef] [Green Version]
- Derrien, T.; Johnson, R.; Bussotti, G.; Tanzer, A.; Djebali, S.; Tilgner, H.; Guernec, G.; Martin, D.; Merkel, A.; Knowles, D.G.; et al. The GENCODE v7 catalog of human long noncoding RNAs: Analysis of their gene structure, evolution, and expression. Genome Res. 2012, 22, 1775–1789. [Google Scholar] [CrossRef] [Green Version]
- Maechler, M.; Rousseeuw, P.; Struyf, A.; Hubert, M.; Hornik, K. Cluster: Cluster Analysis Basics and Extensions. R Package Version 2.1.2. Available online: https://cran.r-project.org/web/packages/cluster/cluster.pdf (accessed on 25 November 2021).
- Hansen, K.D.; Langmead, B.; Irizarry, R.A.; Hansen, K.; Timp, W.; Bravo, H.C.; Sabunciyan, S.; Langmead, B.; McDonald, O.; Wen, B.; et al. BSmooth: From whole genome bisulfite sequencing reads to differentially methylated regions. Genome Biol. 2012, 13, R83. [Google Scholar] [CrossRef] [Green Version]
- Kapourani, C.A.; Sanguinetti, G. Melissa: Bayesian clustering and imputation of single cell methylomes. bioRxiv 2018, 8, 1–15. [Google Scholar] [CrossRef] [Green Version]
- de Souza, C.P.E.; Andronescu, M.; Masud, T.; Kabeer, F.; Biele, J.; Laks, E.; Lai, D.; Ye, P.; Brimhall, J.; Wang, B.; et al. Epiclomal: Probabilistic clustering of sparse single-cell DNA methylation data. PLoS Comput. Biol. 2020, 16, e1008270. [Google Scholar] [CrossRef]
- Angermueller, C.; Lee, H.J.; Reik, W.; Stegle, O. DeepCpG: Accurate prediction of single-cell DNA methylation states using deep learning. Genome Biol. 2017, 18, 1–13. [Google Scholar] [CrossRef] [Green Version]
- Teschendorff, A.E.; Relton, C.L. Statistical and integrative system-level analysis of DNA methylation data. Nat. Rev. Genet. 2018, 19, 129–147. [Google Scholar] [CrossRef]
- Teschendorff, A.E.; Zheng, S.C. Cell-type deconvolution in epigenome-wide association studies: A review and recommendations. Epigenomics 2017, 9, 757–768. [Google Scholar] [CrossRef] [Green Version]
- Teschendorff, A.E.; Zhu, T.; Breeze, C.E.; Beck, S. EPISCORE: Cell type deconvolution of bulk tissue DNA methylomes from single-cell RNA-Seq data. Genome Biol. 2020, 21, 1. [Google Scholar] [CrossRef]
- Leek, J.; Johnson, W.; Parker, H.; Fertig, E.; Jaffe, A.; Storey, J.; Zhang, Y.; Torres, L. SVA: Surrogate Variable Analysis. Available online: https://bioconductor.org/packages/release/bioc/html/sva.html (accessed on 25 November 2021).
- Gagnon-Bartsch, J.A. Ruv: Detect and Remove Unwanted Variation Using Negative Controls. Available online: http://www-personal.umich.edu/~johanngb/ruv/ (accessed on 25 November 2021).
- Phipson, B.; Maksimovic, J.; Oshlack, A. missMethyl: An R package for analyzing data from Illumina’s HumanMethylation450 platform. Bioinformatics 2016, 32, 286–288. [Google Scholar] [CrossRef]
- Teschendorff, A.E.; Breeze, C.E.; Zheng, S.C.; Beck, S. A comparison of reference-based algorithms for correcting cell-type heterogeneity in Epigenome-Wide Association Studies. BMC Bioinform. 2017, 18. [Google Scholar] [CrossRef] [PubMed] [Green Version]
- Chakravarthy, A.; Furness, A.; Joshi, K.; Ghorani, E.; Ford, K.; Ward, M.J.; King, E.V.; Lechner, M.; Marafioti, T.; Quezada, S.A.; et al. Pan-cancer deconvolution of tumour composition using DNA methylation. Nat. Commun. 2018, 9. [Google Scholar] [CrossRef] [PubMed] [Green Version]
- Arneson, D.; Yang, X.; Wang, K. MethylResolver—A method for deconvoluting bulk DNA methylation profiles into known and unknown cell contents. Commun. Biol. 2020, 3, 1–13. [Google Scholar] [CrossRef] [PubMed]
- Li, W.; Li, Q.; Kang, S.; Same, M.; Zhou, Y.; Sun, C.; Liu, C.C.; Matsuoka, L.; Sher, L.; Wong, W.H.; et al. CancerDetector: Ultrasensitive and non-invasive cancer detection at the resolution of individual reads using cell-free DNA methylation sequencing data. Nucleic Acids Res. 2018, 46, e89. [Google Scholar] [CrossRef] [Green Version]
- Akalin, A.; Kormaksson, M.; Li, S.; Garrett-bakelman, F.E.; Figueroa, M.E.; Melnick, A.; Mason, C.E. MethylKit: A comprehensive R package for the analysis of genome-wide DNA methylation profiles. Genome Biol. 2012, 13, R87. [Google Scholar] [CrossRef] [Green Version]
- Scherer, M.; Nebel, A.; Franke, A.; Walter, J.; Lengauer, T.; Bock, C.; Müller, F.; List, M. Quantitative comparison of within-sample heterogeneity scores for DNA methylation data. Nucleic Acids Res. 2021, 48. [Google Scholar] [CrossRef]
- Park, Y.; Figueroa, M.E.; Rozek, L.S.; Sartor, M.A. MethylSig: A whole genome DNA methylation analysis pipeline. Bioinformatics 2014, 30, 2414–2422. [Google Scholar] [CrossRef] [Green Version]
- Park, Y.; Wu, H. Differential methylation analysis for BS-seq data under general experimental design. Bioinformatics 2016, 32, 1446–1453. [Google Scholar] [CrossRef] [Green Version]
- Assenov, Y.; Müller, F.; Lutsik, P.; Walter, J.; Lengauer, T.; Bock, C. Comprehensive analysis of DNA methylation data with RnBeads. Nat. Methods 2014, 11, 1138–1140. [Google Scholar] [CrossRef] [Green Version]
- Robinson, M.D.; McCarthy, D.J.; Smyth, G.K. edgeR: A Bioconductor package for differential expression analysis of digital gene expression data. Bioinformatics 2010, 26, 139–140. [Google Scholar] [CrossRef] [Green Version]
- Peters, T.J.; Buckley, M.J.; Statham, A.L.; Pidsley, R.; Samaras, K.; V Lord, R.; Clark, S.J.; Molloy, P.L. De novo identification of differentially methylated regions in the human genome. Epigenetics and Chromatin 2015, 8, 1–16. [Google Scholar] [CrossRef] [Green Version]
- Suderman, M.; Staley, J.R.; French, R.; Arathimos, R.; Simpkin, A.; Tilling, K. Dmrff: Identifying differentially methylated regions efficiently with power and control. bioRxiv 2018, 508556. [Google Scholar] [CrossRef]
- Chen, Y.; Pal, B.; Visvader, J.E.; Smyth, G.K. Differential methylation analysis of reduced representation bisulfite sequencing experiments using edgeR. F1000Research 2018, 6, 2055. [Google Scholar] [CrossRef]
- Feng, H.; Conneely, K.N.; Wu, H. A Bayesian hierarchical model to detect differentially methylated loci from single nucleotide resolution sequencing data. Nucleic Acids Res. 2014, 42. [Google Scholar] [CrossRef] [Green Version]
- Jaffe, A.E.; Murakami, P.; Lee, H.; Leek, J.T.; Fallin, M.D.; Feinberg, A.P.; Irizarry, R.A. Bump hunting to identify differentially methylated regions in epigenetic epidemiology studies. Int. J. Epidemiol. 2012, 41, 200–209. [Google Scholar] [CrossRef] [Green Version]
- Song, Q.; Decato, B.; Hong, E.E.; Zhou, M.; Fang, F.; Qu, J.; Garvin, T.; Kessler, M.; Zhou, J.; Smith, A.D. A reference methylome database and analysis pipeline to facilitate integrative and comparative epigenomics. PLoS ONE 2013, 8, e81148. [Google Scholar] [CrossRef] [Green Version]
- Xie, W.; Schultz, M.; Lister, R.; Hou, Z.; Rajagopal, N.; Ray, P.; Whitaker, J.; Tian, S.; Hawkins, R.D.; Leung, D.; et al. Epigenomic Analysis of Multilineage Differentiation of Human Embryonic Stem Cells. Cell 2013, 153, 1134–1148. [Google Scholar] [CrossRef] [Green Version]
- Jeong, M.; Sun, D.; Luo, M.; Huang, Y.; Challen, G.A.; Rodriguez, B.; Zhang, X.; Chavez, L.; Wang, H.; Hannah, R.; et al. Large conserved domains of low DNA methylation maintained by Dnmt3a. Nat. Genet. 2013, 46, 17–23. [Google Scholar] [CrossRef] [Green Version]
- Zhao, S.G.; Chen, W.S.; Li, H.; Foye, A.; Zhang, M.; Sjöström, M.; Aggarwal, R.; Playdle, D.; Liao, A.; Alumkal, J.J.; et al. The DNA methylation landscape of advanced prostate cancer. Nat. Genet. 2020, 52, 778–789. [Google Scholar] [CrossRef]
- Burger, L.; Gaidatzis, D.; Schübeler, D.; Stadler, M.B. Identification of active regulatory regions from DNA methylation data. Nucleic Acids Res. 2013, 41, e155. [Google Scholar] [CrossRef] [Green Version]
- Timp, W.; Bravo, H.C.; McDonald, O.G.; Goggins, M.; Umbricht, C.; Zeiger, M.; Feinberg, A.P.; Irizarry, R. Large hypomethylated blocks as a universal defining epigenetic alteration in human solid tumors. Genome Med. 2014, 6, 61. [Google Scholar] [CrossRef]
- Subramanian, I.; Verma, S.; Kumar, S.; Jere, A.; Anamika, K. Multi-omics Data Integration, Interpretation, and Its Application. Bioinform. Biol. Insights 2020, 14, 1177932219899051. [Google Scholar] [CrossRef] [Green Version]
- Capper, D.; Jones, D.T.W.; Sill, M.; Hovestadt, V.; Schrimpf, D.; Sturm, D.; Koelsche, C.; Sahm, F.; Chavez, L.; Reuss, D.E.; et al. DNA methylation-based classification of central nervous system tumours. Nature 2018, 555, 469–474. [Google Scholar] [CrossRef]
- Koelsche, C.; Schrimpf, D.; Stichel, D.; Sill, M.; Sahm, F.; Reuss, D.E.; Blattner, M.; Worst, B.; Heilig, C.E.; Beck, K.; et al. Sarcoma classification by DNA methylation profiling. Nat. Commun. 2021, 12. [Google Scholar] [CrossRef]
- Moran, S.; Martínez-Cardús, A.; Sayols, S.; Musulén, E.; Balañá, C.; Estival-Gonzalez, A.; Moutinho, C.; Heyn, H.; Diaz-Lagares, A.; de Moura, M.C.; et al. Epigenetic profiling to classify cancer of unknown primary: A multicentre, retrospective analysis. Lancet Oncol. 2016, 17, 1386–1395. [Google Scholar] [CrossRef]
- Duruisseaux, M.; Martínez-Cardús, A.; Calleja-Cervantes, M.E.; Moran, S.; Castro de Moura, M.; Davalos, V.; Piñeyro, D.; Sanchez-Cespedes, M.; Girard, N.; Brevet, M.; et al. Epigenetic prediction of response to anti-PD-1 treatment in non-small-cell lung cancer: A multicentre, retrospective analysis. Lancet Respir. Med. 2018, 6, 771–781. [Google Scholar] [CrossRef]
- Garcia-Prieto, C.A.; Villanueva, L.; Bueno-Costa, A.; Davalos, V.; González-Navarro, E.A.; Juan, M.; Urbano-Ispizua, Á.; Delgado, J.; Ortiz-Maldonado, V.; del Bufalo, F.; et al. Epigenetic Profiling and Response to CD19 Chimeric Antigen Receptor T-Cell Therapy in B-Cell Malignancies. JNCI J. Natl. Cancer Inst. 2021, 1–10. [Google Scholar] [CrossRef]
- Pajtler, K.W.; Witt, H.; Sill, M.; Jones, D.T.W.; Hovestadt, V.; Kratochwil, F.; Wani, K.; Tatevossian, R.; Punchihewa, C.; Johann, P.; et al. Molecular Classification of Ependymal Tumors across All CNS Compartments, Histopathological Grades, and Age Groups. Cancer Cell 2015, 27, 728–743. [Google Scholar] [CrossRef] [Green Version]
Figure 1.
Popularity (Pubmed Citations) of DNA methylation approaches. (A) Bulk DNA methylation assays. (B) Experimental and bioinformatic approaches for bisulfite sequencing (WGBS + RRBS) and bisulfite arrays (450K and EPIC). Bismark, popular BS-seq analysis tool; Minfi, popular microarray analysis tool. (C) Single-cell DNA methylation sequencing assays. (D) Single-cell multi-omics sequencing assays.


Table 1.
Data analysis and methylation calling.
| Description | Software | Bulk BS-Seq | scBS-Seq | AE-Seq | BS- Arrays | Ref |
|---|---|---|---|---|---|---|
| Quality control | FastQC | yes | yes | yes | [47] | |
| Adapter/end-base trimming | TrimGalore | yes | yes | [48] | ||
| BS-aware read alignment | BISMARK, BS Seeker2, gemBS, BSMAP | yes | yes | [15,43,44,45] | ||
| Remove PCR duplicates | PicardTools | yes | yes | yes | [49] | |
| Variant calling | gemBS, Bis-SNP, GATK | yes | [45,50,51] | |||
| Methylation calling | BISMARK, Bis-SNP, gemBS, MethylExtract | yes | yes | [15,45,50,52] | ||
| standard read alignment | bowtie2, BWA | yes | [53,54] | |||
| Normalization | DESeq2, MEDIPS, Diffbind | yes | [55,56,57] | |||
| Enrichment analysis | QSEA, RaMWAS, Diffbind | yes | [57,58,59] | |||
| Quality control | minfi, limma, wateRmelon | yes | [60,61,62] | |||
| Normalization | minfi, limma, wateRmelon | yes | [60,61,62] | |||
| Methylation calling (bvalues, mvalues) | minfi, wateRmelon | yes | [60,62] |
Table 2.
Methods for data imputation and exploratory analysis.
| Process | Description | Method | Software | BulkBS-Seq | scBS-Seq | AE-Seq | BS-Arrays | Ref |
|---|---|---|---|---|---|---|---|---|
| Visualization | Variance decomposition | PCA | R | yes | yes | yes | yes | [68] |
| Dimensionality reduction | MDS, t-SNE, NMF | MASS, stats, Rtsne, NMF | yes | yes | (yes) | (yes) | [69,70,71] | |
| Clustering | Clustering (nearest neighbour) | k-means | ||||||
| Hierarchical clustering (un-/supervised) | hclust() | stats, cluster, | yes | yes | yes | yes | [72,73] | |
| Imputation of missing data | Based on local spatial methylation correlation | Local likelihood smoothing | BSmooth | yes | (yes) | [74] | ||
| Based on local spatial methylation correlations within and across cells and different genomic regions | glm, Bayesian clustering | Melissa | yes | [75] | ||||
| Based on local spatial methylation correlations within and across cells and different genomic regions | Bayesian clustering, hierarchical mixture model | Epiclonal | yes | yes | [76] | |||
| Based on neighbouring CpG correlation and sequence composition | Deep neural network | DeepCpG | yes | [77] |
Table 3.
Methods for cell-type deconvolution and estimation of tumour purity.
| Task | Class | Method | Software | Bulk BS-Seq | scBS-Seq | BS-Arrays | Ref |
|---|---|---|---|---|---|---|---|
| Remove unwanted variation (including batch effects) | Reference-free | Surrogate and independent surrogate variable analysis | SVA | yes | yes | [81] | |
| Remove unwanted variation | RUV, missMethyl | yes | [82,83] | ||||
| Intra-sample cell type deconvolution | Reference-free, semi-reference-free | NMF using recursive QP | RefFreeEWAS | yes | yes | ||
| Reference based | Robust partial correlations, CIBERSORT, Houseman CP, COMBAT | HEpiDISH/EpiDISH | yes | [84] | |||
| CIBERSORT | METHYLCIBERSORT | yes | yes | [85] | |||
| Reference based using scRNAseq | EPISCORE | yes | |||||
| Estimate immune cell fraction in tumours | Reference based | MethylResolveR | [86] | ||||
| Inference of tumour burden and tissue of origin from plasma cfDNA | CancerDetector | yes | |||||
| Estimate tumour purity from plasma cf-DNA | Reference-free | Concordance of neighbouring CpGs | CancerDetector | [87] | |||
| Estimate epipolymorphism, methylation entropy, clonal heterogeneity | Reference-free | Epiallele frequency | WSH | yes | (yes) | [88] |
Table 4.
Popular methods for differential DNA methylation.
| Type | Method | Distribution | Software | Bulk BS-Seq | scBS-Seq | AE-Seq | BS- Arrays | Ref |
|---|---|---|---|---|---|---|---|---|
| DMC, DMR (predefined) | Fisher’s Exact test, logistic regression | Binomial (dispersion) | MethylKit | yes | [88] | |||
| DMC, DMR (predefined) | Likelihood ratio | Beta-binomial | MethylSig | yes | [90] | |||
| DMC, DMR (defines) | Wald test, linear regression | Beta-binomial (dispersion) | DSS | yes | [91] | |||
| DMC, DMR (defines) | local linear regression, smoothing, t-test similar | Binomial | BSseq (BSmooth), | yes | [74] | |||
| DMC, DMR (predefind) | Linear regression, t-test | Linear | RnBeads | yes | yes | yes | [92] | |
| DMC, DMR (predefind) | glm, likelihood ratio | Negative-binomial (dispersion) | EdgeR | yes | yes | [93] | ||
| DMC, DMR (predefind) | glm, Wald test | Negative-binomial (dispersion) | DEseq2 (Diffbind) | yes | yes | [54] | ||
| DMC | non-parametric test, beta-regression | Gauss | limma | yes | [60] | |||
| DMC, DMR (defines) | local linear models, smoothing | Gauss | minfi (bump hunter, DMPfinder) | yes | [59] | |||
| DMC, DMR (defines) | local linear models, smoothing | DMRcate | yes | [94] | ||||
| DMC, DMR (defines) | Linear models, combining subregions | Gauss | dmrff | yes | [95] |
Publisher’s Note: MDPI stays neutral with regard to jurisdictional claims in published maps and institutional affiliations. |
© 2022 by the authors. Licensee MDPI, Basel, Switzerland. This article is an open access article distributed under the terms and conditions of the Creative Commons Attribution (CC BY) license (https://creativecommons.org/licenses/by/4.0/).
Share and Cite
MDPI and ACS Style
Merkel, A.; Esteller, M. Experimental and Bioinformatic Approaches to Studying DNA Methylation in Cancer. Cancers 2022, 14, 349. https://0-doi-org.brum.beds.ac.uk/10.3390/cancers14020349
AMA Style
Merkel A, Esteller M. Experimental and Bioinformatic Approaches to Studying DNA Methylation in Cancer. Cancers. 2022; 14(2):349. https://0-doi-org.brum.beds.ac.uk/10.3390/cancers14020349
Chicago/Turabian StyleMerkel, Angelika, and Manel Esteller. 2022. "Experimental and Bioinformatic Approaches to Studying DNA Methylation in Cancer" Cancers 14, no. 2: 349. https://0-doi-org.brum.beds.ac.uk/10.3390/cancers14020349
Note that from the first issue of 2016, this journal uses article numbers instead of page numbers. See further details here.