Article

Genome-Wide Association Study Identifies Candidate Loci Associated with Opioid Analgesic Requirements in the Treatment of Cancer Pain

1
Addictive Substance Project, Tokyo Metropolitan Institute of Medical Science, Tokyo 156-8506, Japan
2
Division of Internal Medicine, Department of Medicine, Higashi-Sapporo Hospital, Sapporo 003-8585, Japan
*
Author to whom correspondence should be addressed.
Submission received: 22 August 2022 / Revised: 20 September 2022 / Accepted: 21 September 2022 / Published: 27 September 2022
(This article belongs to the Special Issue Palliative and Supportive Care in Oncology: An Update)

Abstract

:

Simple Summary

Pain is experienced by ~55% of patients who undergo anti-cancer treatment. However, many genetic factors that are involved in the efficacy of opioid analgesics in the treatment of cancer pain remain unidentified. The aim of our genome-wide association study (GWAS) was to comprehensively explore genetic variations that are associated with opioid analgesic requirements in the treatment of cancer pain. We identified several single-nucleotide polymorphisms (SNPs) that are associated with opioid analgesic requirements, two of the most potent of which were the rs1283671 and rs1283720 SNPs in the ANGPT1 gene region, and SNPs in the SLC2A14 gene were also associated with the phenotype. These results indicate that these SNPs in the ANGPT1 and SLC2A14 genes could serve as markers that predict the efficacy of opioid analgesics in the treatment of cancer pain.

Abstract

Considerable individual differences have been widely observed in the sensitivity to opioids. We conducted a genome-wide association study (GWAS) in patients with cancer pain to identify potential candidate single-nucleotide polymorphisms (SNPs) that contribute to individual differences in opioid analgesic requirements in pain treatment by utilizing whole-genome genotyping arrays with more than 650,000 markers. The subjects in the GWAS were 428 patients who provided written informed consent and underwent treatment for pain with opioid analgesics in a palliative care unit at Higashi-Sapporo Hospital. The GWAS showed two intronic SNPs, rs1283671 and rs1283720, in the ANGPT1 gene that encodes a secreted glycoprotein that belongs to the angiopoietin family. These two SNPs were strongly associated with average daily opioid requirements for the treatment of pain in both the additive and recessive models (p < 5.0000 × 10⁻⁸). Several other SNPs were also significantly associated with the phenotype. In the gene-based analysis, the association was significant for the SLC2A14 gene in the additive model. These results indicate that these SNPs could serve as markers that predict the efficacy of opioid analgesics in cancer pain treatment. Our findings may provide valuable information for achieving satisfactory pain control and open new avenues for personalized pain treatment.

1. Introduction

Pain is defined by the International Association for the Study of Pain as “An unpleasant sensory and emotional experience associated with, or resembling that associated with, actual or potential tissue damage” [1]. Although pain is reportedly experienced by 55% of patients who undergo anti-cancer treatment and by 66% of patients who have advanced, metastatic, or terminal disease, many more cancer patients may potentially experience pain according to a recent systematic review and meta-analysis [2]. The World Health Organization recommends that any opioid may be considered for the maintenance of pain relief (alone or combined with nonsteroidal anti-inflammatory drugs [NSAIDs] and/or paracetamol) in adults (including older persons) and adolescents with cancer-related pain to achieve sustained, effective, and safe pain control, depending on clinical assessment and pain severity [3]. However, their effects are not uniform across all patients. Patient responses to opioid medications vary by patient, specific medication, and other factors [3,4,5]. Such significant variations in opioid responsiveness or sensitivity may influence analgesic effects that are necessary to achieve sufficient pain relief, which may hinder the clinical management of pain. Although twin studies by Angst et al. indicated that genetic effects on the opioid-induced elevation of heat or cold-pressor pain thresholds accounted for 12–60% of the observed response variance [6,7], many genetic factors remain to be elucidated.
To identify genetic variations, mostly single-nucleotide polymorphisms (SNPs), that are associated with human opioid sensitivity or responsiveness and related phenotypes, many candidate gene association studies have been conducted [8,9,10]. The most extensively investigated genetic variation is the functional A118G (rs1799971) SNP in the µ-opioid receptor gene, OPRM1. A recent meta-analysis indicated that G-allele carriers (AG+GG) of this SNP required higher opioid doses for cancer pain management than AA homozygotes [11]. Genetic polymorphisms in the COMT gene, which encodes catechol-O-methyltransferase, have also been often investigated, and SNPs in this gene were found to be associated with responsiveness to opioids even in advanced cancer patients [12,13]. Moreover, several other SNPs in the ABCB1, IL6, GCH1, and TAOK3 gene have also been found to be associated with the response to opioids in patients with cancer pain using a candidate gene approach [14].
Genome-wide association studies (GWASs) focus on genetic variations in all regions of the human genome without regard to preexisting theories about the relationship between variations and the phenotypes of interest [15]. GWASs can also be used to investigate genetic factors that are related to individual differences in analgesic effects of opioids. However, only a few studies have examined human opioid responsiveness and sensitivity based on GWASs. One of these studies investigated associations between SNPs and total morphine requirements as a quantitative trait locus in a retrospective population of opioid-naive children (4–18 years old) who had undergone day surgery tonsillectomy and adenoidectomy. This study identified an association between the rs795484 and rs1277441 SNPs at the TAOK3 gene locus and morphine dose [16]. Additionally, we performed a GWAS of traits that are linked to opioid sensitivity. We chose participants who were scheduled to undergo aesthetic orthognathic surgery for mandibular prognathism [17] and found that the best candidate was the rs2952768 SNP, located near the METTL21A (FAM119A) and CREB1 gene regions [18]. A GWAS was also conducted in patients with cancer from 11 European countries using a prospective cross-sectional multinational, multicenter design [19]. The rs12948783 SNP, which corresponds to chromosome 17 upstream of the RHBDF2 gene, had the strongest association with responsiveness to opioids in this study’s patients who received opioid treatment for moderate or severe pain [20]. However, no GWAS has yet been conducted in populations other than of European origin, such as Asian populations.
In the present study, we conducted a GWAS in patients with cancer pain to identify potential genetic variants that contribute to the efficacy of opioid analgesics that are used to treat pain, reflected by analgesic requirements.

2. Materials and Methods

2.1. Patients

2.1.1. Patients Who Underwent Cancer Pain Treatment with Opioid Analgesics

We enrolled 428 adult patients (20–94 years old, 213 males and 215 females) who suffered from various types of cancer and were hospitalized at Higashi-Sapporo Hospital (Hokkaido, Japan) for the treatment of cancer pain in 2017–2019 and were apparently Japanese. Higashi-Sapporo Hospital was established in 1983 as a hospital that specializes in cancer care, particularly palliative care. Characteristics of the hospital and palliative cancer care were detailed in previous reports [21,22]. All of the patients who were recruited in the present study were treated with opioid analgesics, and many were also appropriately treated with NSAIDs and/or other supplementary analgesics for the treatment of pain. We excluded patients who were considered to be unsuitable by their primary care doctors. Detailed demographic and clinical data of the subjects are provided in Table 1. Peripheral blood samples were collected from these subjects for gene analysis.
The study was conducted according to guidelines of the Declaration of Helsinki and approved by the Institutional Review Board or Ethics Committee of Higashi-Sapporo Hospital and Tokyo Metropolitan Institute of Medical Science (Tokyo, Japan). Written informed consent was obtained from all of the patients.

2.1.2. Patient Characteristics and Clinical Data

In the patient subjects, we obtained data on surgical history, treatment history, pain status (e.g., presence/absence of somatic pain, visceral pain, and neuropathic pain), drug treatments, and disease status (e.g., lung cancer, breast cancer, stomach cancer, etc.; Table 1). Some of the patients were affected by multiple diseases.
The treatment of pain was mainly conducted by administering opioid analgesics (e.g., morphine and oxycodone; Table 1). Various types of drugs, such as NSAIDs (e.g., loxoprofen and diclofenac) and/or other supplementary analgesics (e.g., pregabalin and dexamethasone), were also administered at the discretion of primary care doctors if required. To allow intersubject comparisons of opioid analgesic doses that were required for cancer pain treatment, the opioid doses were converted to equivalent doses of oral morphine as described in Supplementary Table S1, based on previous reports with slight modification [23,24,25]. The total dose of converted opioid analgesics that were administered was calculated daily, and the total dose of analgesics was calculated as a daily average based on the amount of 5 days of administration, 3–7 days before blood collection. This average total dose was used as the endpoint of opioid requirements for the genetic association analysis in the present study. Doses of analgesics that were administered were normalized to body weight. The detailed clinical data of the subjects are detailed in Table 1.

2.2. Whole-Genome Genotyping, Quality Control, and Gene-Based and Gene-Set Analyses

2.2.1. Whole-Genome Genotyping and Quality Control

A total of 428 DNA samples from the patients were used for genotyping. Total genomic DNA was extracted from whole-blood samples using standard procedures. The extracted DNA was dissolved in TE buffer (10 mM Tris-HCl and 1 mM ethylenediaminetetraacetic acid [EDTA], pH 8.0). The DNA concentration was adjusted to 50 ng/μL for whole-genome genotyping using a NanoDrop ND-1000 Spectrophotometer (NanoDrop Technologies, Wilmington, DE, USA).
According to the manufacturer’s recommendations, whole-genome genotyping was performed by utilizing the Infinium Assay II with an iScan system (Illumina, San Diego, CA, USA). Infinium Asian Screening Array-24 v. 1.0 BeadChips (one kind) were utilized to genotype 428 patient samples (total markers: 659,184). Numerous copy number variation markers were included in the BeadChips, but the majority of the BeadChips were for SNP markers on the human autosome or sex chromosome.
GenomeStudio with the Genotyping v. 2.0.4 module (Illumina) was used to examine data for samples that had their entire genomes genotyped to assess quality of the findings. Following data cleaning, samples with genotype call rates less than 0.95 were not included in the remaining studies. No patient samples were consequently disregarded for subsequent investigations (i.e., all of the 428 samples met the 0.95 quality control cutoff, and the entire samples were considered for further association analyses). In the subsequent association analyses, markers with genotype call frequencies less than 0.95 and “Cluster sep” (a measure of genotype cluster separation) values less than 0.1 were not included. The patient samples retained a total of 650,504 SNP markers after this screening step. Markers were further filtered based on a test of Hardy–Weinberg equilibrium (HWE). Markers with p values (df = 1) less than 0.001 were considered to be deviated in the HWE tests and thus were excluded. Finally, the analysis only included the 648,817 SNPs that passed the full filtration procedure.
A log quantile-quantile (QQ) p-value plot as a result of the GWAS for the entire sample was subsequently drawn to check the pattern of the generated p-value distribution in the association studies between the SNPs and phenotype, in which the observed p values against the values that were expected from the null hypothesis of a uniform distribution, calculated as –log10 (p value), were plotted for each model. All of the plots were mostly concordant with the expected line (y = x), especially over the range of 0 < –log10 (p value) < 2 for each model, indicating no apparent population stratification of the samples that were used in the study (Supplementary Figure S1). Additionally, results of the GWAS are presented as Manhattan plots, in which the –log10 (p value) for each SNP on each chromosome was plotted simultaneously.

2.2.2. Gene-Based and Gene-Set Analyses

Gene-based and gene-set approaches were adopted with Multi-marker Analysis of GenoMic Annotation (MAGMA) v. 1.06 [26], which is also available on the Functional Mapping and Annotation of Genome-Wide Association Studies (FUMA GWAS) v. 1.3.9 platform [27], to better understand genetic backgrounds and molecular mechanisms that underlie complex traits, such as opioid requirements in cancer pain treatment. To examine the combined relationship between all genetic markers in the gene and the phenotype, genetic marker data were aggregated to the level of full genes in the gene-based analysis. Similarly, individual genes were compiled into groupings of genes with similar biological, functional, or other properties for the gene-set analysis. Gene-set analysis can thus shed light on the role that particular biological pathways or cellular processes may play in the genetic basis of a trait [26]. In these analyses, associations were explored for genes on autosomes 1–22 and the X chromosome, and the window of the genes to assign SNPs was set to 20 kb, thereby assigning SNPs within the 20 kb window of the gene (both sides) to that gene. For the reference panel, the 1000 Genome Phase3 EAS population was selected (http://ftp.1000genomes.ebi.ac.uk/vol1/ftp/release/20130502/ accessed on 26 July 2022). In the gene-set analysis, gene sets were defined using the Molecular Signatures Database (MSigDB) v. 7.5.1 (https://www.gsea-msigdb.org/gsea/msigdb accessed on 26 September 2022) [28]. A total of 10,678 gene sets (curated gene sets: 4761, GO terms: 5917) from MsigDB were tested. In both analyses, Bonferroni correction for multiple testing was performed for all tested genes and gene sets. Adjusted values of p < 0.05 in the results were considered significant.

2.3. Statistical Analysis

In the association studies of patients who underwent cancer pain treatment with opioids, the total dose of analgesics as a daily average that was calculated based on the amount of 5 days of administration, 3–7 days before blood collection, was used as an index of opioid sensitivity. Before the analyses, the quantitative values of total analgesic requirements that were equivalent to oral morphine (mg/kg) were natural log-transformed for approximation to the normal distribution according to the following formula: Value for analyses = Ln (1 + total analgesic requirements on average per day [mg/kg]). To explore associations between the SNPs and phenotypes, linear regression analyses were conducted, in which total analgesic requirements as a daily average (mg/kg; log-transformed) and genotype data for each SNP were incorporated as dependent and independent variables, respectively. Additionally, weight and binary data on the presence/absence of neuropathic pain were incorporated as covariables because these parameters were strongly associated with the dependent variable in a preliminary study (data not shown). Additive, dominant, and recessive genetic models were used for the analyses because of previously insufficient knowledge about genetic factors that are associated with opioid sensitivity. Male genotypes were not included in the analysis of X chromosome markers, whereas both male and female individuals were included in the association study for autosomal markers. PLINK v. 1.07 (https://zzz.bwh.harvard.edu/plink/index.shtml accessed on 28 July 2022) [29], gPLINK v. 2.050 [29], and Haploview v. 4.2 [30] were used to perform the statistical analyses. The criterion for significance in the GWAS was set at p < 5 × 10⁻⁸, which is widely known to be a conventional criterion for the level of significance in GWASs [31,32]. Additionally, Hardy–Weinberg equilibrium was tested using Exact Tests for genotypic distributions of SNPs that were significantly associated with the phenotype.

2.4. Additional in Silico Analysis

2.4.1. Power Analysis

G*Power 3.0.5 software (https://www.psychologie.hhu.de/arbeitsgruppen/allgemeine-psychologie-und-arbeitspsychologie/gpower accessed on 26 September 2022) was used to perform preliminary statistical power analyses [33]. When the type I error probability was set at 1 × 10⁻⁷ (less than 5 × 10⁻⁸) and the sample size was 428, power assessments for the linear regression analysis showed that the expected power (1 minus type II error probability) was over 99.4% for a Cohen’s conventional “middle” effect size of 0.15 [34]. When Cohen’s conventional “small” effect size was 0.02, however, for the same type I error probability and sample sizes of 428, the estimated power decreased to 0.7%. In contrast, assuming the same type I error probability and sample sizes of 428 to obtain 80% power, the predicted effect size was 0.0919. For effect sizes from large to moderately small but not too small, a single analysis in the preceding study was anticipated to detect true associations with the phenotype with 80% statistical power, although the precise effect size has not been well understood in cases of SNPs that significantly influence opioid sensitivity.

2.4.2. Linkage Disequilibrium Analysis

Linkage disequilibrium (LD) analysis was performed using Haploview v. 4.2 [30] for a total of 428 samples from patients who underwent cancer pain treatment with opioids for the locus of the ~243 kbp region that was annotated as the ANGPT1 gene and its flanking region on chromosome 8 based on an annotation file that was provided by Illumina (San Diego, CA, USA) to identify relationships between SNPs in the ANGPT1 gene region. The commonly used D′ and r2 values were pairwise calculated using the genotype dataset for each SNP to estimate the strength of LD between SNPs. Linkage disequilibrium blocks were defined as in a previous study [35].

2.4.3. Reference of Databases

Several databases and bioinformatic tools were referenced to more thoroughly examine the candidate SNP that may be related to human opioid analgesic sensitivity, including the National Center for Biotechnology Information (NCBI) database (http://www.ncbi.nlm.nih.gov accessed on 28 July 2022), Genotype-Tissue Expression (GTEx) portal (https://www.gtexportal.org/home/; accessed on 28 July 2022) [36], HaploReg v. 4.1 (https://pubs.broadinstitute.org/mammals/haploreg/haploreg.php; accessed on 28 July 2022) [37], and SNPinfo Web Server (https://snpinfo.niehs.nih.gov/; accessed on 28 July 2022) [38]. The GTEx project, an ongoing effort to create a comprehensive public resource to research tissue-specific gene expression and regulation [36], is the basis for the GTEx portal, which offers open access to such data as gene expression, quantitative trait loci, and histology images. HaploReg is a tool for investigating non-coding genomic annotations at variations in haplotype blocks, such as potential regulatory SNPs at disease-associated sites [37]. The SNPinfo Web Server is a set of web-based SNP selection tools (freely available at https://snpinfo.niehs.nih.gov/; accessed on 28 July 2022) where investigators can specify genes or linkage regions and select SNPs based on GWAS results, LD, and predicted functional characteristics of both coding and non-coding SNPs [38].

3. Results

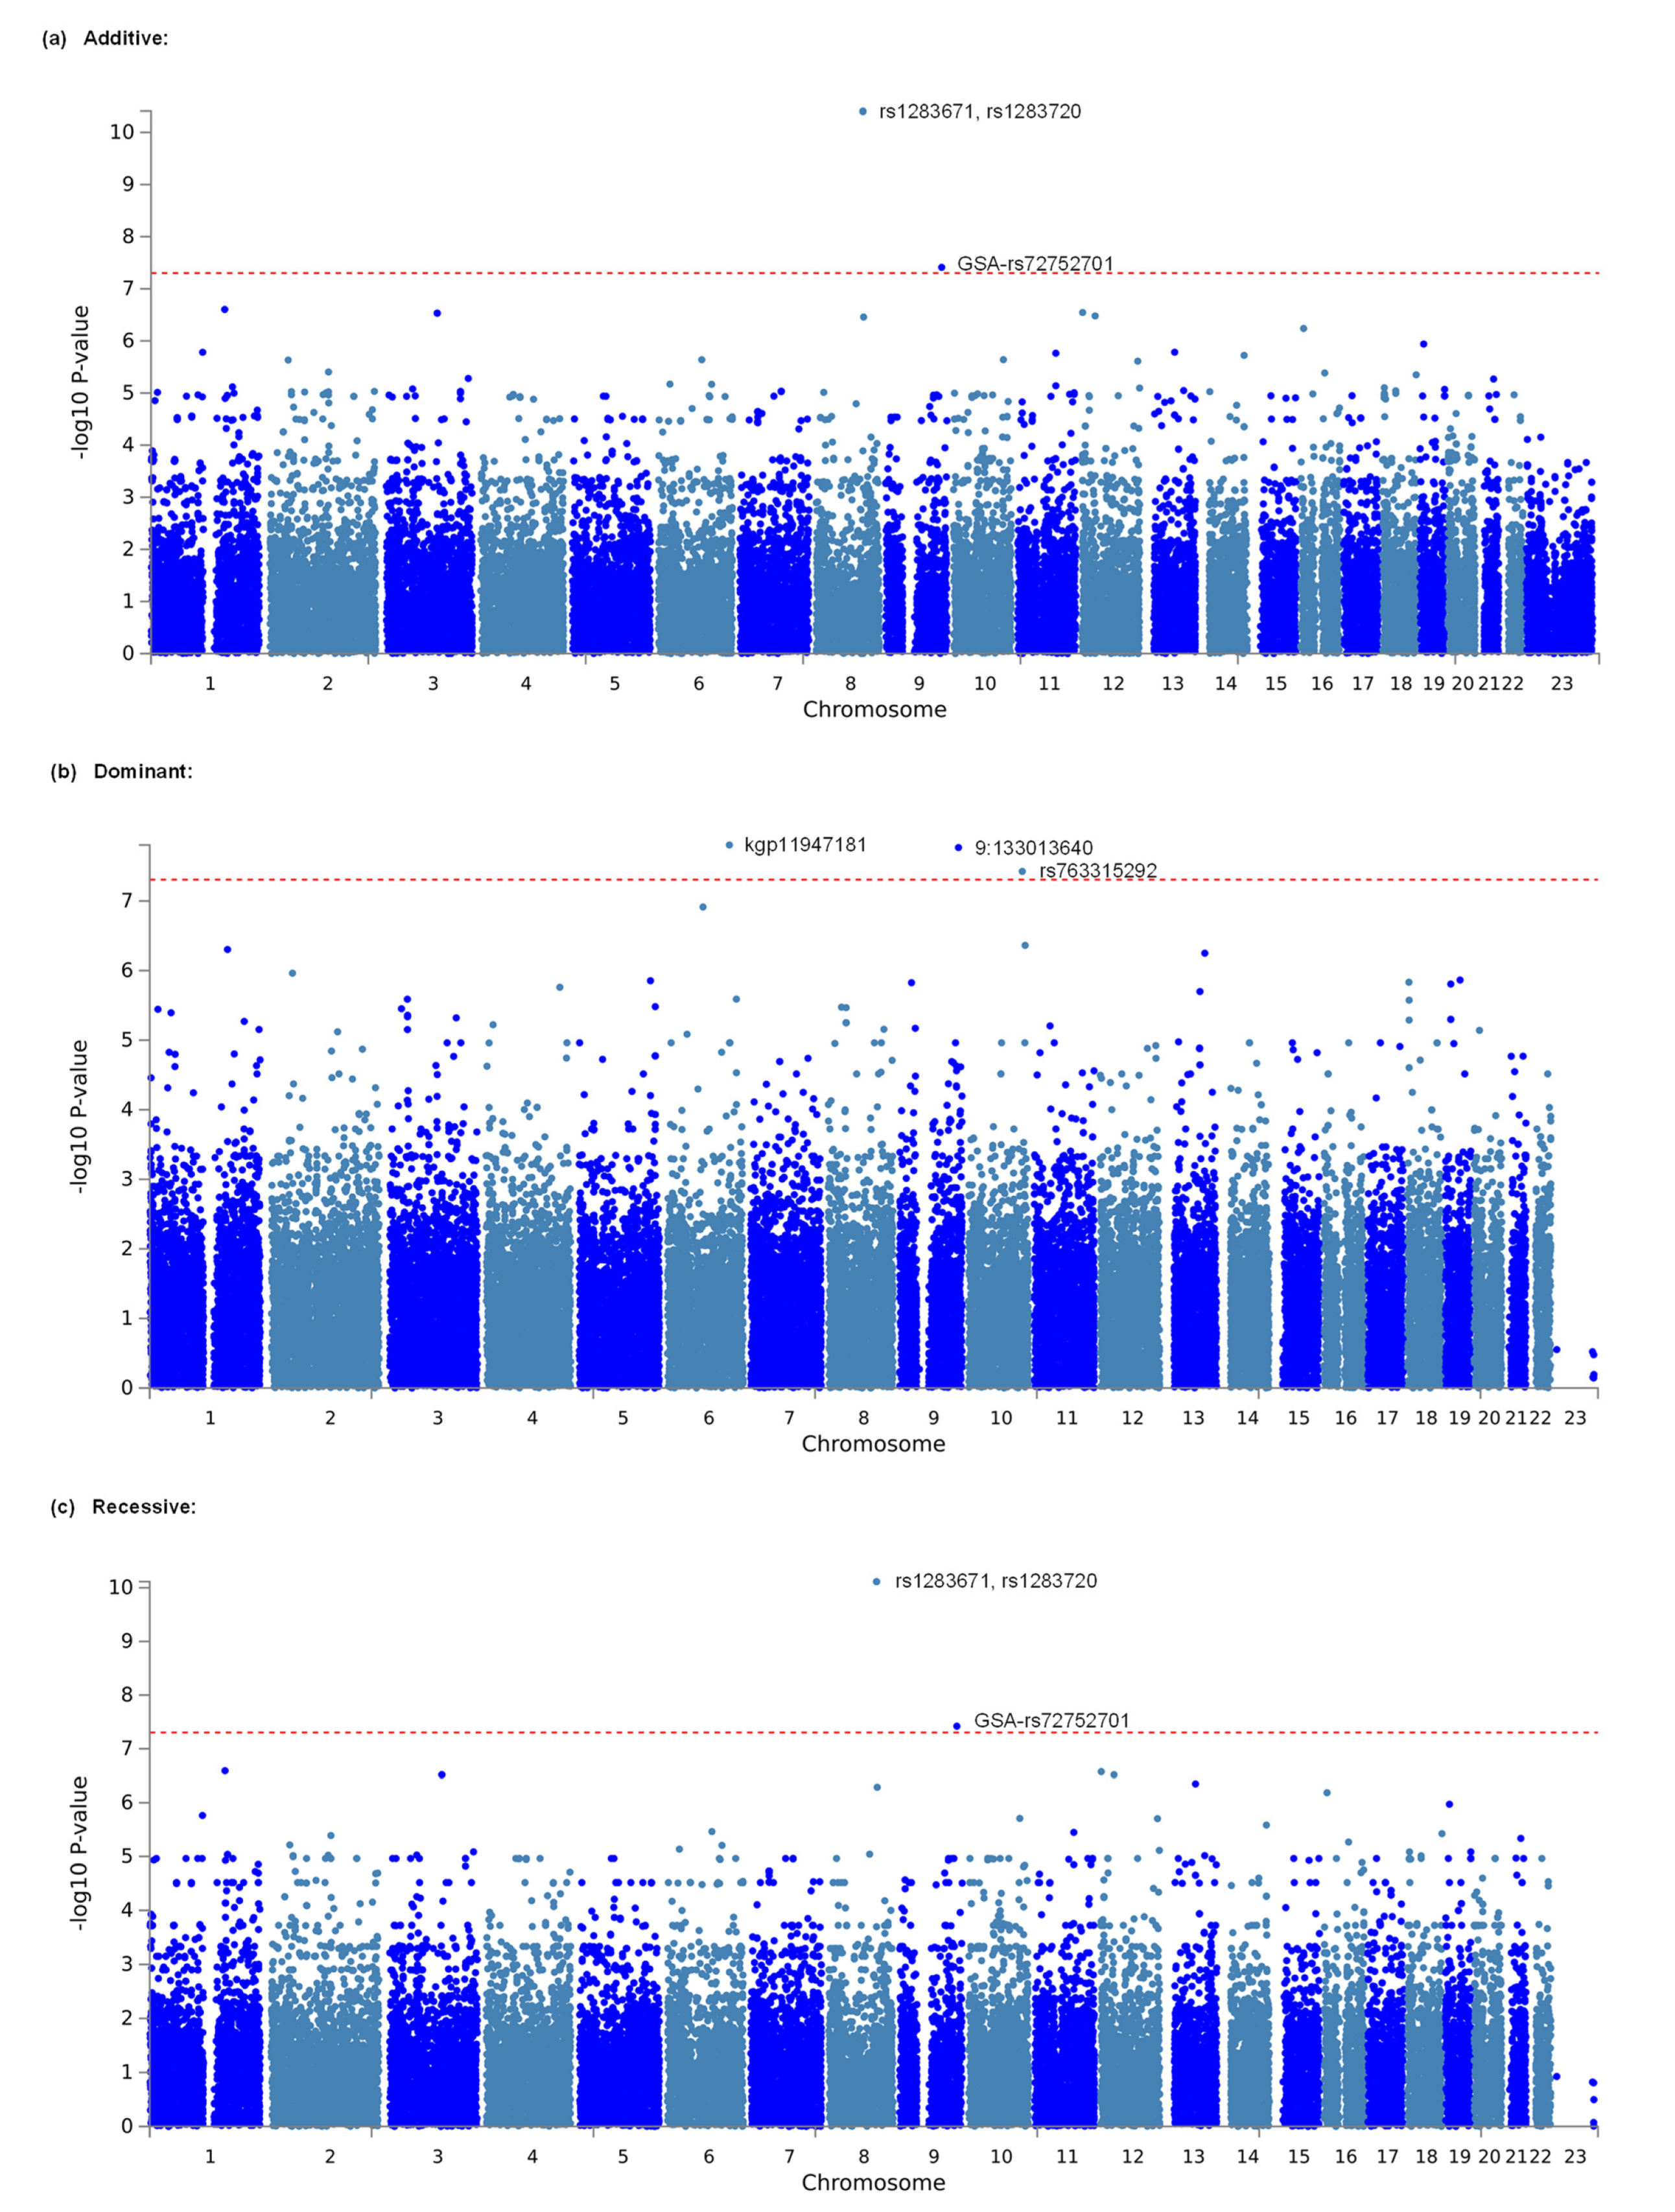
3.1. Identification of Genetic Polymorphisms Associated with Opioid Analgesic Requirements in the Treatment of Cancer Pain by GWAS

We comprehensively explored genetic variations that were associated with opioid analgesic requirements per day in the treatment of cancer pain in a total of 428 patients. A total of 648,817 SNPs that met the quality control standards in the GWAS of all patients were examined for relationships with the phenotype in the additive, dominant, and recessive models. The top 20 potential SNPs for the additive, dominant, and recessive models are shown in Table 2, Table 3 and Table 4, respectively. Significant associations were found for the rs1283671 and rs1283720 SNPs on chromosome 8 and the GSA-rs72752701 (rs72752701) SNP on chromosome 9 in the additive model (p = 3.876 × 10⁻¹¹ for rs1283671, p = 4.007 × 10⁻¹¹ for rs1283720, p = 3.879 × 10⁻⁸ for GSA-rs72752701; Table 2, Figure 1a). Significant associations were also found for the kgp11947181 (rs79524268) SNP on chromosome 6, 9:133013640 (rs2417163) SNP on chromosome 9, and rs763315292 SNP on chromosome 10 in the dominant model (p = 1.592 × 10⁻⁸ for kgp11947181, p = 1.730 × 10⁻⁸ for 9:133013640, p = 3.807 × 10⁻⁸ for rs763315292; Table 3, Figure 1b). Significant associations were also found in the recessive model for the same three SNPs as in the additive model (p = 7.698 × 10⁻¹¹ for rs1283671, p = 7.698 × 10⁻¹¹ for rs1283720, p = 3.814 × 10⁻⁸ for GSA-rs72752701; Table 4, Figure 1c). Many of the examined SNPs’ computed -log10 p values (observed p values), which are based on the null hypothesis of a uniform distribution in the QQ plot, differed from the predicted values (Supplementary Figure S1). The values for SNPs with significant relationships in Table 2, Table 3 and Table 4 (rs1283671 and rs1283720) and other SNPs were obviously higher than predicted values (Supplementary Figure S1). The gene that encodes angiopoietin-1, ANGPT1, was in the vicinity of the rs1283671 and rs1283720 SNPs (i.e., the best candidate SNPs in the additive and recessive models). Meanwhile, the kgp11947181 SNP, the best candidate SNP in the dominant model, was located in an intergenic region on chromosome 6 (Supplementary Figure S2b). The rs1283671 and rs1283720 SNPs were in strong LD with each other (r2 = 0.97), although these two SNPs were not in strong LD (r2 < 0.80) with other neighboring SNPs within and around the ANGPT1 gene (Supplementary Figure S3). As shown in Table 2 and Table 4, an increase in the minor allele carry in the rs1283671 and rs1283720 SNPs was associated with greater opioid analgesic requirements in cancer pain treatment.

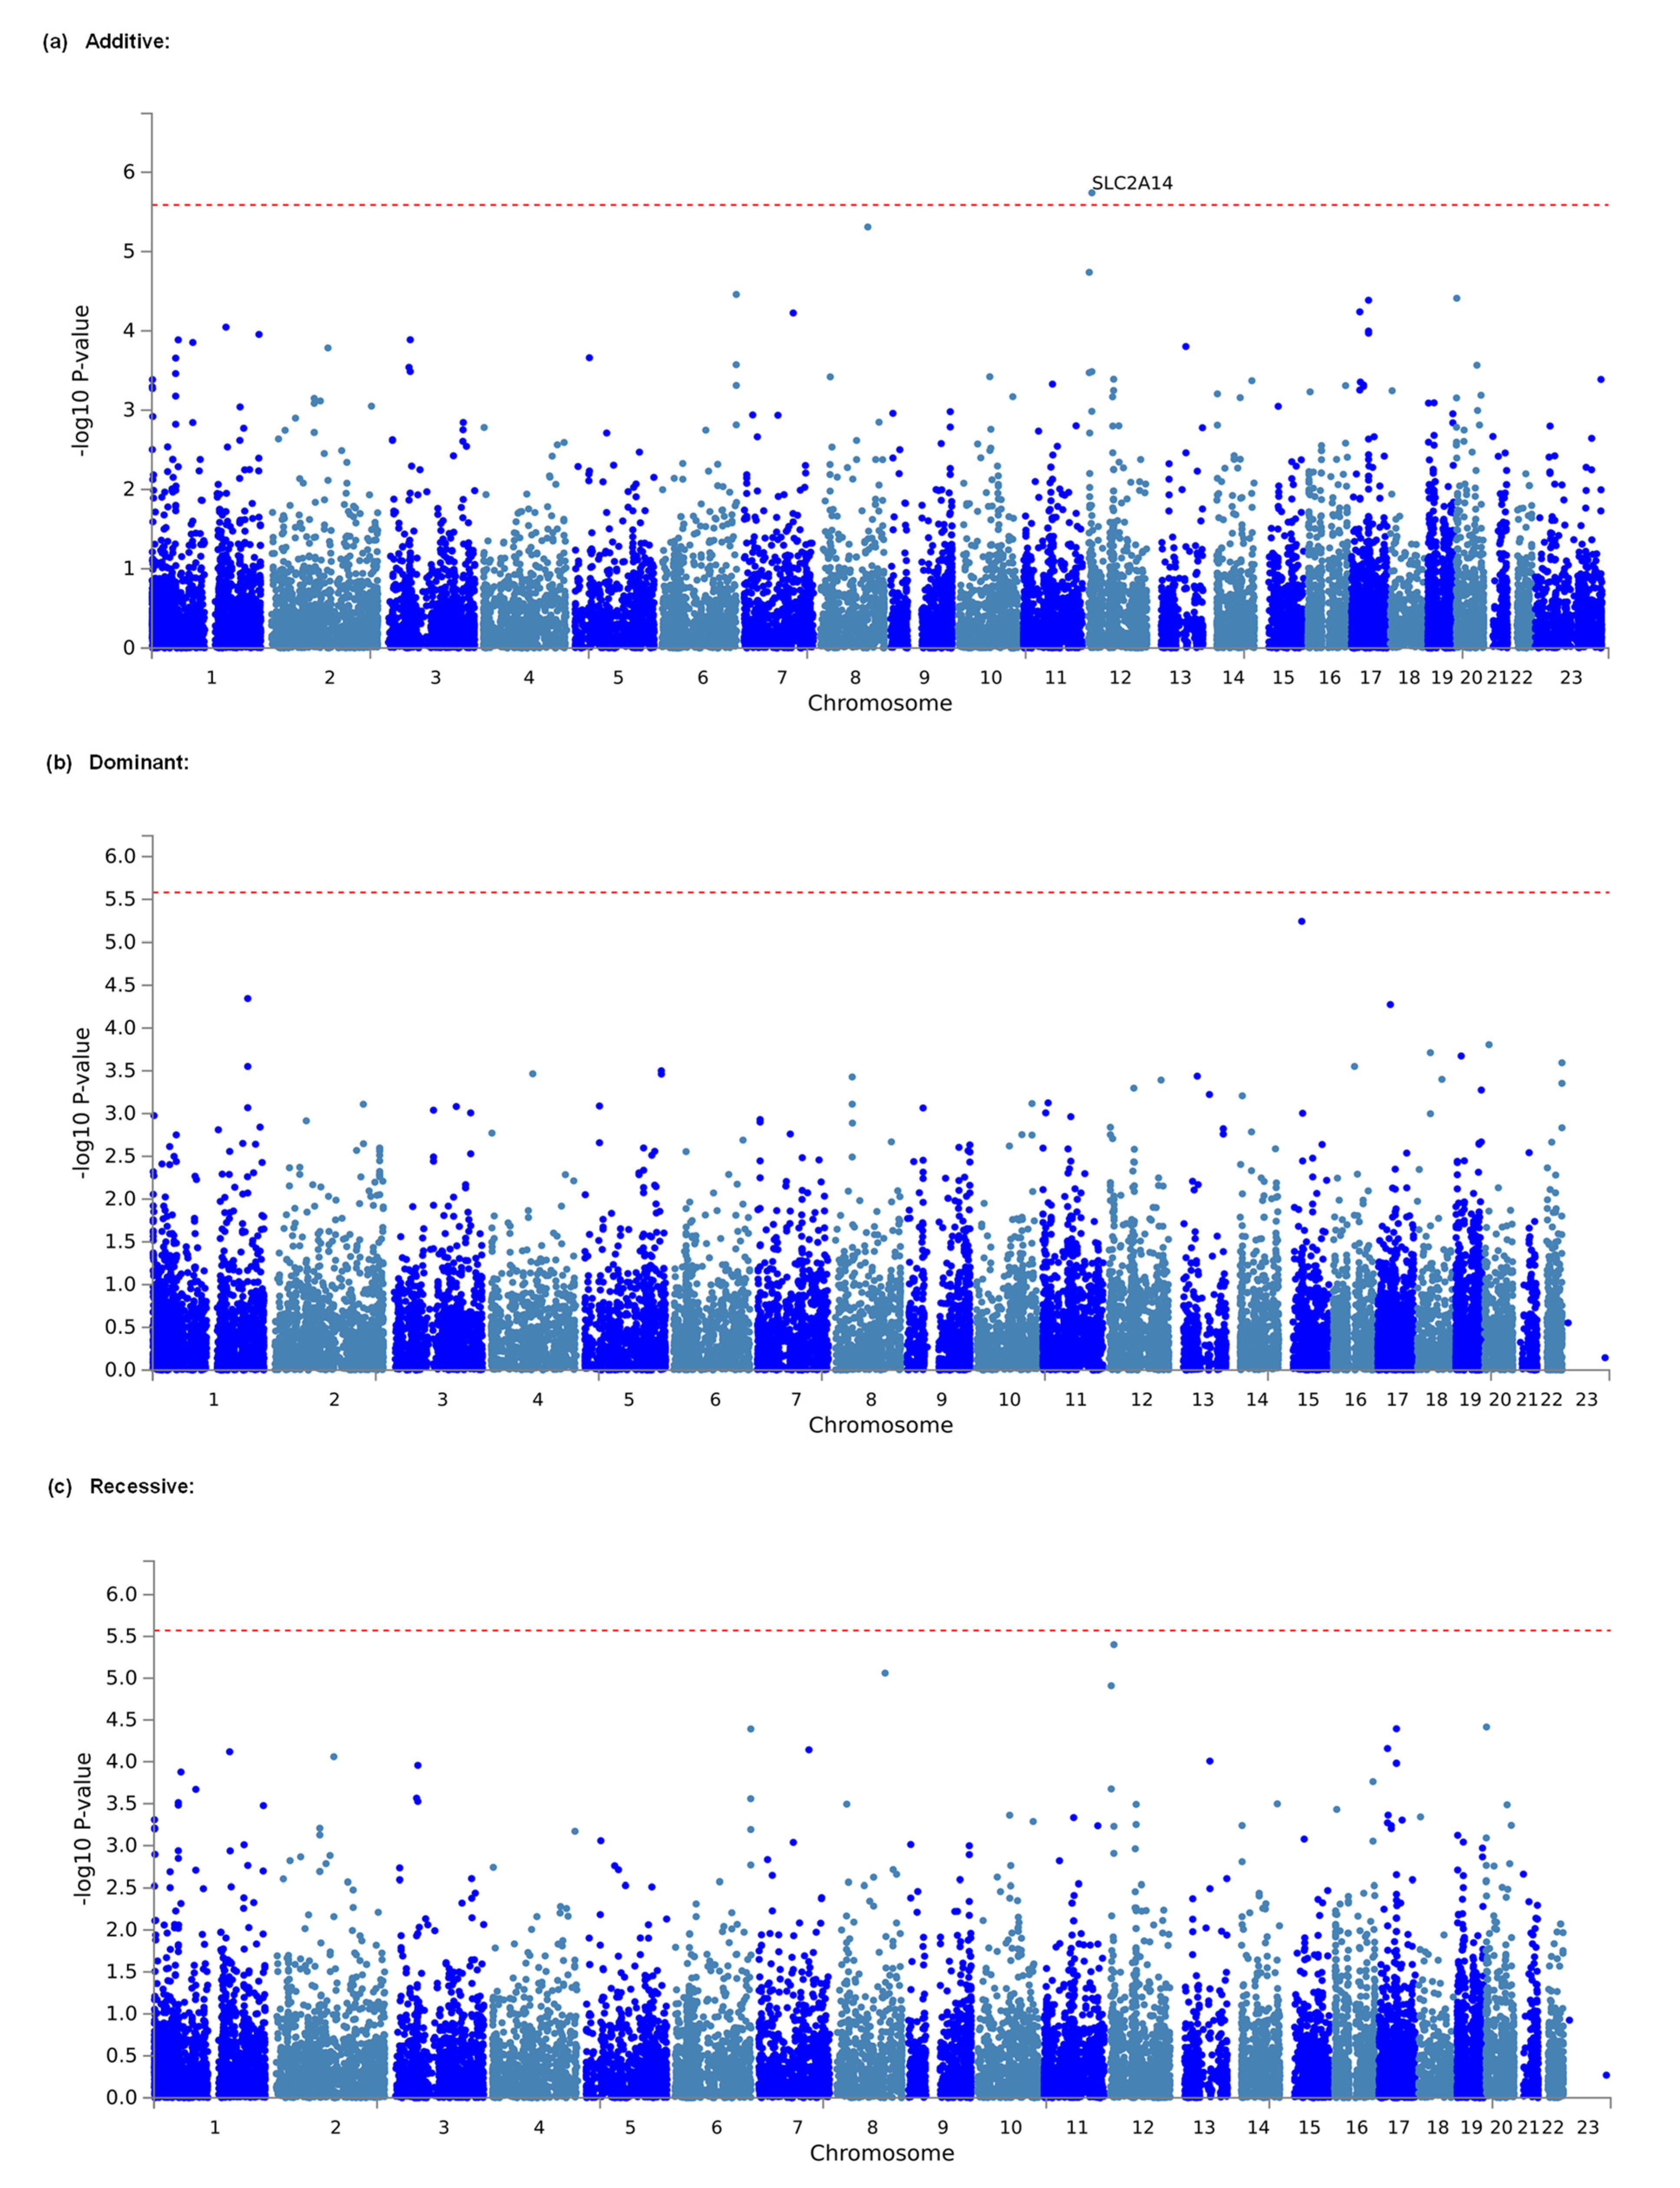
3.2. Identification of Genes and Gene Sets Associated with Opioid Analgesic Requirements in the Treatment of Cancer Pain by Gene-Based and Gene-Set Analyses

Considering that the effects of individual markers tend to be too weak to be detected by comprehensive analyses, such as GWASs, that target only single polymorphisms, we conducted gene-based and gene-set analyses, which are statistical methods that are used to analyze multiple genetic markers simultaneously to determine their joint effect. In both analyses, using MAGMA software [26], which was made accessible in the FUMA GWAS platform [27], we investigated genes and gene sets that were related to the amount of opioid analgesics that were required daily for the management of cancer pain in a total of 428 individuals. As a result, 648,817 SNPs from the selected candidate genes and gene sets in the additive, dominant, and recessive models were included in the analyses of all patients. The top 20 candidate genes that were found in each genetic model by the gene-based analysis are listed in Table 5. In the additive model, SLC2A14, the top candidate gene, was significantly associated with the phenotype (adjusted p = 0.03722; Table 5, Figure 2a). However, in both the dominant and recessive models, none of the genes were significantly associated with the phenotype (Table 5, Figure 2b,c), although the association with the SLC2A14 gene was marginally significant in the recessive model (p = 0.07384; Table 5). The top 10 candidate gene sets that were found in each genetic model using the gene-set analysis are listed in Supplementary Table S1. However, in none of the genetic models were any of the gene sets significantly related to the phenotype (Supplementary Table S1).

4. Discussion

To identify potential genetic variants that contribute to the requirements of opioid analgesics that were used to treat cancer pain, we conducted a GWAS in patient subjects who were diagnosed with various types of cancers (Table 1). The GWAS results suggested that carriers of minor alleles of the rs1283671 and rs1283720 SNPs within the ANGPT1 gene region were less sensitive to opioid analgesics and thus required greater amounts of daily opioid analgesics in cancer pain treatment (Table 2 and Table 4). Our GWAS also identified other potent SNPs that are possibly associated with opioid sensitivity, including GSA-rs72752701 (rs72752701) in the additive and recessive models (Table 2 and Table 4) and kgp11947181 (rs79524268), 9:133013640 (rs2417163), and rs763315292 in the dominant model (Table 3). Additionally, numerous SNPs in or near the SLC2A14 gene region collectively increased the amount of analgesic that was required for cancer pain management (Table 5). No relevant gene sets that may have been related to the trait were identified (Supplementary Table S1). These findings show that in the genetic etiology of the trait, individual genes did not properly aggregate to groups of genes that shared specific biological, functional, or other features. Future studies with larger sample sizes are required to find candidate gene sets that are associated with the phenotype and corroborate the significant results that were identified in our GWAS of single SNPs and gene-set analysis.
Previous studies identified several genetic variations that are associated with phenotypes that are related to opioid responsiveness in the treatment of cancer pain [11,12,13,14,20]. Included in those candidate genetic variations are the rs1799971, rs1319339, and rs34427887 SNPs in the OPRM1 gene, rs4680, rs4818, rs4633, rs4646316, and rs35478083 SNPs in the COMT gene, rs1045642 SNP in the ABCB1 gene, −174G>C (rs1800795) SNP in the IL6 gene, rs8007267, rs3783641, and rs10483639 SNPs in the GCH1 gene, rs12948783 SNP in the RHBDF2 gene, and rs1277441 and rs795484 SNPs in the TAOK3 gene [11,12,13,14,20]. Among these SNPs, rs1799971, rs4680, rs4633, rs4646316, rs1045642, rs1800795, rs8007267, rs3783641, rs10483639, rs12948783, and rs795484 SNPs were included in the SNP array that was used in the present study. However, no SNPs except rs8007267 (p = 0.007411) and rs3783641 (p = 0.006942) in the GCH1 gene were even nominally significantly associated with opioid analgesic requirements (p > 0.05) in our association analysis results (details not shown). The GCH1 gene encodes GTP cyclohydrolase 1, which is the first and rate-limiting enzyme in tetrahydrobiopterin (BH4) biosynthesis. Although these two SNPs, with the other rs10483639 SNP, were reported to be associated with opioid therapy initiation in cancer pain patients [39], these three SNPs were not shown to be associated with the responsiveness to opioids itself. These results might indicate the general difficulty of replicating results of human genetic association studies, probably because of the heterogeneity of study designs, diagnoses of different types of cancer, pain severity, types of opioid analgesics used, and genetic background of the subjects, among other factors.
The best candidate SNPs in the present study were rs1283671 and rs1283720, which are found in the intronic region of the ANGPT1 gene on chromosome 8. These SNPs had the lowest p values among the candidate SNPs. Angiopoietin-1, a secreted glycoprotein that is a member of the angiopoietin family, is encoded by the ANGPT1 gene. Angiopoietin-1 is an angiogenic growth factor with antipermeability and anti-inflammatory properties [40]. Chronic or uncontrolled inflammation plays an important role in many diseases [41], including stroke [42]. When the angiopoetin-1 receptor, Tie2, becomes inactivated, important molecular brakes are released in the endothelium, which in turn potentiate inflammation and vascular leakage [43]. ANGPT1 mRNA is known to be broadly expressed in fat, the lungs, the prostate, and several other tissues in humans, according to the NCBI database. Mice that were engineered to lack angiopoietin-1 exhibited angiogenic deficits [44]. A missense mutation (807G>T, A119S) that was identified in a family was associated with hereditary angioedema in humans [45]. Meanwhile, angiogenesis may be protected against by angiotensin-converting enzyme (ACE) inhibitors [46], and the inhibition of ACE activity might prevent or even reverse hypoglycemia-associated autonomic failure (HAAF) [47]. β-endorphin has also been reported to influence the autonomic response to hypoglycemia via opioid receptor activation [48]. The opioid receptor antagonist naloxone improved counterregulatory responses [49] and prevented HAAF [48] in humans. Therefore, both the inhibition of ACE activity and antagonism of opioid receptors may protect against angiogenesis and HAAF in humans, suggesting that angiogenesis, in which angiopoietin-1 is involved, could also be modulated by actions of opioids. Therefore, a possible explanation for the present results may be that genetic variations in the ANGPT1 gene could influence individual differences in angiogenic effects, which in turn may lead to individual differences in opioid analgesic efficacy. However, to date, no genetic variations of the ANGPT1 gene have been reported to be related to functions of the opioid system. The rs1283671 and rs1283720 SNPs (i.e., the best candidate SNPs in the present study) have not been previously reported to be associated with any phenotypes to date. Although the rs1283671 and rs1283720 SNPs were in strong LD with each other (r2 = 0.97), these two SNPs were not in strong LD (r2 < 0.80) with other neighboring SNPs in our data (Supplementary Figure S3). When these SNPs were referenced in HaploReg v. 4.1 [37] (accessed on 2 August 2022), they were in strong LD (r2 ≥ 0.80) with 20 neighboring SNPs (data not shown). HaploReg v. 4.1 also showed that the rs1283671 and rs1283720 SNPs could change eight and three motifs, respectively, for DNA-binding proteins. Nevertheless, none of these SNPs were significantly associated with mRNA expression levels of any genes in any tissues, according to the GTEx portal (accessed on 2 August 2022), suggesting that these SNPs unlikely influence variations in opioid sensitivity among individuals by influencing the mRNA expression of some genes.
Our GWAS identified several other potent SNPs beyond rs1283671 and rs1283720 that were significantly associated with opioid requirements in cancer pain patients, including GSA-rs72752701 (rs72752701) in the additive and recessive models (Table 2 and Table 4) and kgp11947181 (rs79524268), 9:133013640 (rs2417163), and rs763315292 in the dominant model (Table 3). Among these, the GSA-rs72752701, kgp11947181, and 9:133013640 SNPs are located in intergenic regions, whereas rs763315292 is located in the SEC23 interacting protein gene (SEC23IP) region. Although no significant expression quantitative trait loci (eQTLs) were found for kgp11947181 and rs763315292, the GSA-rs72752701 SNP is associated with mRNA expression of the heat shock protein family A (Hsp70) member 5 (HSPA5) gene, and the 9:133013640 SNP is associated with mRNA expression of the hemicentin 2 (HMCN2) and long intergenic non-protein coding RNA 963 (LINC00963) genes, according to the GTEx portal [36]. The SEC23IP, HMCN2, and LINC00963 genes have not been previously reported to be related to the opioid system or its receptors. In a previous quantitative mass spectrometry proteomics study of purified synaptosomes that were isolated from the caudate in two groups of rhesus macaques that were chronically infected with simian immunodeficiency virus (SIV) and differed with regard to morphine treatment regimens, the upregulation of HSPA5 was found in the SIV+morphine group, indicating an increase in cellular stress as a result of the SIV/morphine interaction, thereby leading to central nervous system dysfunction [50]. This previous study suggests that the expression and function of HSPA5 could interact with the opioid system, and alterations of HSPA5 mRNA expression through the GSA-rs72752701 SNP might influence the function of opioids.
Although none of the top 30 candidate SNPs in the additive model in the present study included SNPs that were annotated as this gene (Table 2), the SLC2A14 gene was significantly associated with the trait in the gene-based analysis of all patients (Table 5, Figure 2a). The SLC2A14 gene encodes solute carrier family 2 member 14 (SLC2A14), which is a member of the glucose transporter (GLUT) family. Members of the GLUT family, including SLC2A14, are highly conserved integral membrane proteins that transport hexoses, such as glucose and fructose, into all mammalian cells. However, the functional relationship between this protein and the opioid system is unknown. SLC2A14 mRNA is known to be highly expressed in the testis [51], followed by bone marrow, the urinary bladder, the placenta, the gall bladder, the appendix, and the brain, according to the NCBI database. In human genetic studies, SNPs in the SLC2A14 gene region were reported to be associated with some diseases, including Alzheimer’s disease and inflammatory bowel disease [52,53]. Notably, several SNPs in the SLC2A14 gene region were also reported to be associated with alcohol dependence at the p ≤ 10−4 level of significance [54], which is known to be at least partly pertinent to the opioid system in its etiology [55]. Since alcohol dependence could be caused by the rewarding effects of alcohol, in which the opioid system is also involved, an antagonist of opioid receptors, naltrexone, is widely used for the treatment of alcohol dependence [56]. One of the associated SNPs, rs11612319, was also included in our GWAS and not strongly but rather modestly associated with the phenotype (p = 4.325 × 10⁻⁴). Although the impact of this SNP on SLC2A14 function and the opioid system remains unknown, this SNP may have some influence on both the risk for alcohol dependence and opioid sensitivity.
One limitation of the present study was the relatively small sample size, which might have led to an inability to detect significant associations in the gene-set analysis. Other limitations include heterogeneity of the primary disease and the level of cancer pain. In the present study, patients with various types of cancer were recruited, and a GWAS was conducted in all samples. With much larger sample sizes, GWASs could be performed in a particular subset of patients, such as only in patients with lung cancer (Table 1), which was actually difficult in the present study because only a small number of such patients (<100) would have been included in the GWAS. The lack of data on the level of cancer pain in each patient in the present study also hampered the ability to conduct a GWAS only in patients with cancer pain of relatively homogeneous severity. Notwithstanding these limitations, the present study identified several SNPs and the SLC2A14 gene that were significantly associated with the phenotype. Regardless of the type of cancer or severity of cancer pain, these SNPs and this gene might commonly impact opioid sensitivity, and they were associated with the need for opioids to treat cancer pain in analyses of whole samples.
The results of the present study suggest that the rs1283671 and rs1283720 SNPs of the ANGPT1 gene could be clinical markers that predict analgesic requirements, in which the minor alleles of these SNPs are possibly associated with lower opioid sensitivity and thus greater requirements for opioid analgesics in the treatment of cancer pain. Before clinically applying these findings, further studies should be designed to better predict analgesic requirements, such as studies of the construction and validation of prediction formulas for analgesic requirements, similar to previous studies [57,58], by considering the influence of other possible candidate SNPs and non-genetic factors.

5. Conclusions

In conclusion, our GWASs discovered SNPs and a gene that were associated with opioid analgesic requirements in the treatment of cancer pain, including the ANGPT1 rs1283671 and rs1283720 SNPs and SLC2A14 gene. Although the present results need to be corroborated by more research with larger sample sizes, these findings indicate that these SNPs in the ANGPT1 and SLC2A14 genes could serve as markers that predict the efficacy of opioid analgesics in the treatment of cancer pain.

Supplementary Materials

The following supporting information can be downloaded at https://0-www-mdpi-com.brum.beds.ac.uk/article/10.3390/cancers14194692/s1, Figure S1: Log quantile-quantile (QQ) p-value plot as a result of the GWAS for all patient samples; Figure S2: Regional plots of potent loci that were associated with daily opioid requirements in cancer pain treatment; Figure S3: State of linkage disequilibrium (LD) between SNPs in the genomic region of the ANGPT1 gene; Table S1: Estimated systemic dose equipotent to 90 mg oral morphine (mg); Table S2: Top 10 candidate gene sets selected from gene-set analysis.

Author Contributions

Conceptualization, T.T. and K.I. (Kazutaka Ikeda); methodology, D.N., J.H., K.N. and Y.E.; software, D.N.; validation, D.N., J.H., K.N. and Y.E.; formal analysis, D.N.; investigation, D.N. and S.K.; resources, T.T. and K.I. (Kunihiko Ishitani); data curation, D.N., J.H., K.N. and Y.E.; writing—original draft preparation, D.N.; writing—review and editing, D.N., T.T. and K.I. (Kazutaka Ikeda); visualization, D.N.; supervision, T.T. and K.I. (Kazutaka Ikeda); project administration, K.I. (Kazutaka Ikeda); funding acquisition, D.N. and K.I. (Kazutaka Ikeda). All authors have read and agreed to the published version of the manuscript.

Funding

This research was funded by grants from the Japan Society for the Promotion of Science (JSPS) KAKENHI (no. 22790518, 23390377, 24790544, 26293347, JP22H04922 [AdAMS], 17H04324, 17K08970, 18K08829, 20K09259, and 21H03028), Ministry of Health, Labour, and Welfare (MHLW) of Japan (no. H26-Kakushintekigan-ippan-060), Japan Agency for Medical Research and Development (AMED; no. JP19ek0610011 and JP19dk0307071), Smoking Research Foundation (Tokyo, Japan), and Japan Research Foundation for Clinical Pharmacology (JRFCP). The article processing charge (APC) was funded by the Japan Society for the Promotion of Science (JSPS) KAKENHI.

Institutional Review Board Statement

The study was conducted according to guidelines of the Declaration of Helsinki and approved by the Institutional Review Board (or Ethics Committee) of Higashi-Sapporo Hospital (protocol code: none, date of approval: November 20, 2016) and Tokyo Metropolitan Institute of Medical Science (protocol code: 17-1, date of approval: 31 March 2017).

Informed Consent Statement

Informed consent was obtained from all subjects who were involved in the study.

Data Availability Statement

Data that are presented in this study are available upon request from the corresponding author.

Acknowledgments

We thank Michael Arends for editing the manuscript. We are grateful to the volunteers for their participation in the study and anesthesiologists and surgeons for collecting the clinical data.

Conflicts of Interest

Kazutaka Ikeda has received support from Asahi Kasei Pharma Corporation for a project that is unrelated to this research and speaker’s and consultant’s fees from MSD K.K., VistaGen Therapeutics, Inc., Atheneum Partners Otsuka Pharmaceutical Co. Ltd., Taisho Pharmaceutical Co. Ltd., Eisai, Daiichi-Sankyo, Inc., Sumitomo Pharma, Japan Tobacco, Inc., EA Pharma Co. Ltd., and Nippon Chemiphar. The authors declare no other conflicts of interest. The funders had no role in the design of the study; in the collection, analyses, or interpretation of data; in writing the manuscript; or in the decision to publish the results.

References

  1. Raja, S.N.; Carr, D.B.; Cohen, M.; Finnerup, N.B.; Flor, H.; Gibson, S.; Keefe, F.J.; Mogil, J.S.; Ringkamp, M.; Sluka, K.A.; et al. The revised International Association for the Study of Pain definition of pain: Concepts, challenges, and compromises. Pain 2020, 161, 1976–1982. [Google Scholar] [CrossRef]
  2. Van den Beuken-van Everdingen, M.H.; Hochstenbach, L.M.; Joosten, E.A.; Tjan-Heijnen, V.C.; Janssen, D.J. Update on prevalence of pain in patients with cancer: Systematic review and meta-analysis. J. Pain Symptom Manag. 2016, 51, 1070–1090. [Google Scholar] [CrossRef]
  3. WHO Guidelines for the Pharmacological and Radiotherapeutic Management of Cancer Pain in Adults and Adolescents. Available online: https://www.who.int/publications/i/item/9789241550390 (accessed on 9 August 2022).
  4. Ikeda, K.; Ide, S.; Han, W.; Hayashida, M.; Uhl, G.R.; Sora, I. How individual sensitivity to opiates can be predicted by gene analyses. Trends Pharmacol. Sci. 2005, 26, 311–317. [Google Scholar] [CrossRef]
  5. Nishizawa, D.; Ikeda, K. Genome-wide association studies and human opioid sensitivity. In Neuropathology of Drug Addictions and Substance Misuse Volume 1: Foundations of Understanding, Tobacco, Alcohol, Cannabinoids and Opioids; Preedy, V.R., Ed.; Academic Press: London, UK, 2016; pp. 909–921. [Google Scholar]
  6. Angst, M.S.; Phillips, N.G.; Drover, D.R.; Tingle, M.; Galinkin, J.L.; Christians, U.; Swan, G.E.; Lazzeroni, L.C.; Clark, J.D. Opioid pharmacogenomics using a twin study paradigm: Methods and procedures for determining familial aggregation and heritability. Twin Res. Hum. Genet. 2010, 13, 412–425. [Google Scholar] [CrossRef]
  7. Angst, M.S.; Phillips, N.G.; Drover, D.R.; Tingle, M.; Ray, A.; Swan, G.E.; Lazzeroni, L.C.; Clark, J.D. Pain sensitivity and opioid analgesia: A pharmacogenomic twin study. Pain 2012, 153, 1397–1409. [Google Scholar] [CrossRef]
  8. Branford, R.; Droney, J.; Ross, J.R. Opioid genetics: The key to personalized pain control? Clin. Genet. 2012, 82, 301–310. [Google Scholar] [CrossRef]
  9. Droney, J.; Riley, J.; Ross, J. Opioid genetics in the context of opioid switching. Curr. Opin. Supportive Palliat. Care 2012, 6, 10–16. [Google Scholar] [CrossRef]
  10. Vuilleumier, P.H.; Stamer, U.M.; Landau, R. Pharmacogenomic considerations in opioid analgesia. Pharm. Pers. Med. 2012, 5, 73–87. [Google Scholar] [CrossRef]
  11. Yu, Z.; Wen, L.; Shen, X.; Zhang, H. Effects of the OPRM1 A118G polymorphism (rs1799971) on opioid analgesia in cancer pain: A systematic review and meta-analysis. Clin. J. Pain 2019, 35, 77–86. [Google Scholar] [CrossRef]
  12. Matic, M.; Jongen, J.L.; Elens, L.; de Wildt, S.N.; Tibboel, D.; Sillevis Smitt, P.A.; van Schaik, R.H. Advanced cancer pain: The search for genetic factors correlated with interindividual variability in opioid requirement. Pharmacogenomics 2017, 18, 1133–1142. [Google Scholar] [CrossRef]
  13. Yennurajalingam, S.; Astolfi, A.; Indio, V.; Beccaro, M.; Schipani, A.; Yu, R.; Shete, S.; Reyes-Gibby, C.; Lu, Z.; Williams, J.L.; et al. Genetic factors associated with pain severity, daily opioid dose requirement, and pain response among advanced cancer patients receiving supportive care. J. Pain Symptom Manag. 2021, 62, 785–795. [Google Scholar] [CrossRef]
  14. Yang, G.S.; Barnes, N.M.; Lyon, D.E.; Dorsey, S.G. Genetic variants associated with cancer pain and response to opioid analgesics: Implications for precision pain management. Semin. Oncol. Nurs. 2019, 35, 291–299. [Google Scholar] [CrossRef]
  15. Daly, A.K. Genome-wide association studies in pharmacogenomics. Nat. Rev. Genet. 2010, 11, 241–246. [Google Scholar] [CrossRef]
  16. Cook-Sather, S.D.; Li, J.; Goebel, T.K.; Sussman, E.M.; Rehman, M.A.; Hakonarson, H. TAOK3, a novel genome-wide association study locus associated with morphine requirement and postoperative pain in a retrospective pediatric day surgery population. Pain 2014, 155, 1773–1783. [Google Scholar] [CrossRef]
  17. Fukuda, K.; Hayashida, M.; Ide, S.; Saita, N.; Kokita, Y.; Kasai, S.; Nishizawa, D.; Ogai, Y.; Hasegawa, J.; Nagashima, M.; et al. Association between OPRM1 gene polymorphisms and fentanyl sensitivity in patients undergoing painful cosmetic surgery. Pain 2009, 147, 194–201. [Google Scholar] [CrossRef]
  18. Nishizawa, D.; Fukuda, K.; Kasai, S.; Hasegawa, J.; Aoki, Y.; Nishi, A.; Saita, N.; Koukita, Y.; Nagashima, M.; Katoh, R.; et al. Genome-wide association study identifies a potent locus associated with human opioid sensitivity. Mol. Psychiatry 2014, 19, 55–62. [Google Scholar] [CrossRef]
  19. Kurita, G.P.; Sjogren, P.; Ekholm, O.; Kaasa, S.; Loge, J.H.; Poviloniene, I.; Klepstad, P. Prevalence and predictors of cognitive dysfunction in opioid-treated patients with cancer: A multinational study. J. Clin. Oncol. 2011, 29, 1297–1303. [Google Scholar] [CrossRef]
  20. Galvan, A.; Skorpen, F.; Klepstad, P.; Knudsen, A.K.; Fladvad, T.; Falvella, F.S.; Pigni, A.; Brunelli, C.; Caraceni, A.; Kaasa, S.; et al. Multiple loci modulate opioid therapy response for cancer pain. Clin. Cancer Res. 2011, 17, 4581–4587. [Google Scholar] [CrossRef]
  21. Terui, T.; Koike, K.; Hirayama, Y.; Kusakabe, T.; Ono, K.; Mihara, H.; Kobayashi, K.; Takahashi, Y.; Nakajima, N.; Kato, J.; et al. Recent advances in palliative cancer care at a regional hospital in Japan. Am. J. Hosp. Palliat. Med. 2014, 31, 717–722. [Google Scholar] [CrossRef]
  22. Hirayama, Y.; Terui, T.; Kusakabe, T.; Koike, K.; Ono, K.; Kato, J.; Ishitani, K. A survey of patients who were referred to our palliative care division from other hospitals and appeared to have obvious indications for cancer chemotherapies. Am. J. Hosp. Palliat. Care 2014, 31, 804–807. [Google Scholar] [CrossRef]
  23. McPherson, M.L.; Walker, K.A.; Davis, M.P.; Bruera, E.; Reddy, A.; Paice, J.; Malotte, K.; Lockman, D.K.; Wellman, C.; Salpeter, S.; et al. Safe and appropriate use of methadone in hospice and palliative care: Expert consensus white paper. J. Pain Symptom Manag. 2019, 57, 635–645. [Google Scholar] [CrossRef] [PubMed]
  24. Quigley, C.; Wiffen, P. A systematic review of hydromorphone in acute and chronic pain. J. Pain Symptom Manag. 2003, 25, 169–178. [Google Scholar] [CrossRef]
  25. Cherny, N.I.; Fallon, M.T.; Kaasa, S.; Portenoy, R.K.; Currow, D.C. Oxford Textbook of Palliative Medicine, 6th ed.; Oxford University Press: Oxford, UK, 2021. [Google Scholar]
  26. De Leeuw, C.A.; Mooij, J.M.; Heskes, T.; Posthuma, D. MAGMA: Generalized gene-set analysis of GWAS data. PLoS Comput. Biol. 2015, 11, e1004219. [Google Scholar] [CrossRef]
  27. Watanabe, K.; Taskesen, E.; van Bochoven, A.; Posthuma, D. Functional mapping and annotation of genetic associations with FUMA. Nat. Commun. 2017, 8, 1826. [Google Scholar] [CrossRef] [PubMed]
  28. Subramanian, A.; Tamayo, P.; Mootha, V.K.; Mukherjee, S.; Ebert, B.L.; Gillette, M.A.; Paulovich, A.; Pomeroy, S.L.; Golub, T.R.; Lander, E.S.; et al. Gene set enrichment analysis: A knowledge-based approach for interpreting genome-wide expression profiles. Proc. Natl. Acad. Sci. USA 2005, 102, 15545–15550. [Google Scholar] [CrossRef] [PubMed]
  29. Purcell, S.; Neale, B.; Todd-Brown, K.; Thomas, L.; Ferreira, M.A.; Bender, D.; Maller, J.; Sklar, P.; de Bakker, P.I.; Daly, M.J.; et al. PLINK: A tool set for whole-genome association and population-based linkage analyses. Am. J. Hum. Genet. 2007, 81, 559–575. [Google Scholar] [CrossRef] [PubMed]
  30. Barrett, J.C.; Fry, B.; Maller, J.; Daly, M.J. Haploview: Analysis and visualization of LD and haplotype maps. Bioinformatics 2005, 21, 263–265. [Google Scholar] [CrossRef]
  31. De Bakker, P.I.; Ferreira, M.A.; Jia, X.; Neale, B.M.; Raychaudhuri, S.; Voight, B.F. Practical aspects of imputation-driven meta-analysis of genome-wide association studies. Hum. Mol. Genet. 2008, 17, R122–R128. [Google Scholar] [CrossRef]
  32. Barsh, G.S.; Copenhaver, G.P.; Gibson, G.; Williams, S.M. Guidelines for genome-wide association studies. PLoS Genet. 2012, 8, e1002812. [Google Scholar] [CrossRef]
  33. Faul, F.; Erdfelder, E.; Lang, A.G.; Buchner, A. G*Power 3: A flexible statistical power analysis program for the social, behavioral, and biomedical sciences. Behav. Res. Methods 2007, 39, 175–191. [Google Scholar] [CrossRef]
  34. Cohen, J. Statistical Power Analysis for the Behavioral Sciences, revised ed.; Academic Press: New York, NY, USA, 1977. [Google Scholar]
  35. Gabriel, S.B.; Schaffner, S.F.; Nguyen, H.; Moore, J.M.; Roy, J.; Blumenstiel, B.; Higgins, J.; DeFelice, M.; Lochner, A.; Faggart, M.; et al. The structure of haplotype blocks in the human genome. Science 2002, 296, 2225–2229. [Google Scholar] [CrossRef] [PubMed]
  36. GTEx Consortium. The Genotype-Tissue Expression (GTEx) project. Nat. Genet. 2013, 45, 580–585. [Google Scholar] [CrossRef]
  37. Ward, L.D.; Kellis, M. HaploReg: A resource for exploring chromatin states, conservation, and regulatory motif alterations within sets of genetically linked variants. Nucleic. Acids Res. 2012, 40, D930–D934. [Google Scholar] [CrossRef] [PubMed]
  38. Xu, Z.; Taylor, J.A. SNPinfo: Integrating GWAS and candidate gene information into functional SNP selection for genetic association studies. Nucleic. Acids Res. 2009, 37, W600–W605. [Google Scholar] [CrossRef] [PubMed]
  39. Lotsch, J.; Klepstad, P.; Doehring, A.; Dale, O. A GTP cyclohydrolase 1 genetic variant delays cancer pain. Pain 2010, 148, 103–106. [Google Scholar] [CrossRef]
  40. Chen, J.; Yang, T.; Yu, H.; Sun, K.; Shi, Y.; Song, W.; Bai, Y.; Wang, X.; Lou, K.; Song, Y.; et al. A functional variant in the 3’-UTR of angiopoietin-1 might reduce stroke risk by interfering with the binding efficiency of microRNA 211. Hum. Mol. Genet. 2010, 19, 2524–2533. [Google Scholar] [CrossRef]
  41. Nathan, C. Points of control in inflammation. Nature 2002, 420, 846–852. [Google Scholar] [CrossRef]
  42. Elkind, M.S. Inflammation, atherosclerosis, and stroke. Neurologist 2006, 12, 140–148. [Google Scholar] [CrossRef]
  43. Parikh, S.M. Angiopoietins and Tie2 in vascular inflammation. Curr. Opin. Hematol. 2017, 24, 432–438. [Google Scholar] [CrossRef]
  44. Suri, C.; Jones, P.F.; Patan, S.; Bartunkova, S.; Maisonpierre, P.C.; Davis, S.; Sato, T.N.; Yancopoulos, G.D. Requisite role of angiopoietin-1, a ligand for the TIE2 receptor, during embryonic angiogenesis. Cell 1996, 87, 1171–1180. [Google Scholar] [CrossRef] [Green Version]
  45. Bafunno, V.; Firinu, D.; D’Apolito, M.; Cordisco, G.; Loffredo, S.; Leccese, A.; Bova, M.; Barca, M.P.; Santacroce, R.; Cicardi, M.; et al. Mutation of the angiopoietin-1 gene (ANGPT1) associates with a new type of hereditary angioedema. J. Allergy Clin. Immunol. 2018, 141, 1009–1017. [Google Scholar] [CrossRef] [PubMed]
  46. Converse, M.P.; Sobhanian, M.; Taber, D.J.; Houston, B.A.; Meadows, H.B.; Uber, W.E. Effect of angiotensin II inhibitors on gastrointestinal bleeding in patients with left ventricular assist devices. J. Am. Coll. Cardiol. 2019, 73, 1769–1778. [Google Scholar] [CrossRef] [PubMed]
  47. Poplawski, M.M.; Mastaitis, J.W.; Mobbs, C.V. Naloxone, but not valsartan, preserves responses to hypoglycemia after antecedent hypoglycemia: Role of metabolic reprogramming in counterregulatory failure. Diabetes 2011, 60, 39–46. [Google Scholar] [CrossRef] [PubMed]
  48. Leu, J.; Cui, M.H.; Shamoon, H.; Gabriely, I. Hypoglycemia-associated autonomic failure is prevented by opioid receptor blockade. J. Clin. Endocrinol. Metab. 2009, 94, 3372–3380. [Google Scholar] [CrossRef] [PubMed]
  49. Caprio, S.; Gerety, G.; Tamborlane, W.V.; Jones, T.; Diamond, M.; Jacob, R.; Sherwin, R.S. Opiate blockade enhances hypoglycemic counterregulation in normal and insulin-dependent diabetic subjects. Am. J. Physiol. 1991, 260, E852–E858. [Google Scholar] [CrossRef] [PubMed]
  50. Pendyala, G.; Periyasamy, P.; Callen, S.; Fox, H.S.; Lisco, S.J.; Buch, S.J. Chronic SIV and morphine treatment increases heat shock protein 5 expression at the synapse. J. Neurovirol. 2015, 21, 592–598. [Google Scholar] [CrossRef] [PubMed]
  51. Wu, X.; Freeze, H.H. GLUT14, a duplicon of GLUT3, is specifically expressed in testis as alternative splice forms. Genomics 2002, 80, 553–557. [Google Scholar] [CrossRef]
  52. Wang, W.; Yu, J.T.; Zhang, W.; Cui, W.Z.; Wu, Z.C.; Zhang, Q.; Tan, L. Genetic association of SLC2A14 polymorphism with Alzheimer’s disease in a Han Chinese population. J. Mol. Neurosci. 2012, 47, 481–484. [Google Scholar] [CrossRef]
  53. Amir Shaghaghi, M.; Zhouyao, H.; Tu, H.; El-Gabalawy, H.; Crow, G.H.; Levine, M.; Bernstein, C.N.; Eck, P. The SLC2A14 gene, encoding the novel glucose/dehydroascorbate transporter GLUT14, is associated with inflammatory bowel disease. Am. J. Clin. Nutr. 2017, 106, 1508–1513. [Google Scholar] [CrossRef]
  54. Edenberg, H.J.; Koller, D.L.; Xuei, X.; Wetherill, L.; McClintick, J.N.; Almasy, L.; Bierut, L.J.; Bucholz, K.K.; Goate, A.; Aliev, F.; et al. Genome-wide association study of alcohol dependence implicates a region on chromosome 11. Alcohol. Clin. Exp. Res. 2010, 34, 840–852. [Google Scholar] [CrossRef]
  55. Nutt, D.J. The role of the opioid system in alcohol dependence. J. Psychopharmacol. 2014, 28, 8–22. [Google Scholar] [CrossRef] [PubMed]
  56. Michalak, A.; Biala, G. Alcohol dependence: Neurobiology and treatment. Acta Pol. Pharm. 2016, 73, 3–12. [Google Scholar] [PubMed]
  57. Yoshida, K.; Nishizawa, D.; Ichinomiya, T.; Ichinohe, T.; Hayashida, M.; Fukuda, K.; Ikeda, K. Prediction formulas for individual opioid analgesic requirements based on genetic polymorphism analyses. PLoS ONE 2015, 10, e0116885. [Google Scholar] [CrossRef]
  58. Cheng, H.; Zeng, R.; Kong, L.; Ding, C.; He, Y.; Zhuang, W.; Sun, Y. Establishment of predicting equation for individual sufentanil dosage postoperatively based on gene polymorphisms. Pain Pract. 2022, 22, 39–46. [Google Scholar] [CrossRef] [PubMed]
Figure 1. Manhattan plot of GWAS outcomes. (a) Analytical plot in the additive model. (b) Analytical plot in the dominant model. (c) Analytical plot in the recessive model. The dashed red line shows the significant association threshold.
Cancers 14 04692 g001
Figure 2. Manhattan plot of results of gene-based analysis. (a) Analytical plot in the additive model. (b) Analytical plot in the dominant model. (c) Analytical plot in the recessive model. The dashed red line shows the significant association threshold.
Cancers 14 04692 g002
Table 1. Demographic and clinical data of patient subjects.
Demographic Data:nMinimumMaximumMeanSDMedian
Gender
male213
female215
Age [years]428209471.59 12.33 72.50
Height [cm]423136181157.61 8.56 158.00
Weight [kg]4213011050.56 11.07 50.00
Diagnosis (primary disease):n Diagnosis (primary disease):n
lung cancer81 breast cancer 60
stomach cancer26 pancreas cancer 25
prostate cancer25 colon cancer 22
bladder cancer17 rectal cancer 13
hepatocellular cancer12 esophageal cancer 10
uterus cancer9 ovary cancer 8
others120
Status and side effects:absencepresence
somatic pain38390
visceral pain34682
neuropathic pain327101
nausea193138
constipation113245
Breakdown of opioids:nmorphineoxicodonefentanyltapentadoltramadolmethadonehydromorphone
Number of administered patients426972091071031541
Administration of opioids:nMinimumMaximumMeanSDMedian
Total dose of opioids [mg/kg]4190.06024132.4074071.74 3.09 0.8163265
(converted to oral morphine)
Administration of other drugs:absencepresence
NSAIDs137291
supplementary analgesics171257
Table 2. Top 30 candidate SNPs selected from the GWAS (additive model).
ModelRankCHRSNPPositionpRelated Gene Genotype (Patients)Phenotype (Mean)
A/A A/B B/BA/A A/B B/B
Additive18rs12836711074214593.876 × 10−11 *ANGPT15873272.3750.8730.703
Additive28rs12837201074601004.007 × 10−11 *ANGPT15893252.3750.860.705
Additive39GSA−rs727527011259922743.879 × 10−8 * 2503673.0110.7760.743
Additive41rs39177441696087522.485 × 10−7SELP2513662.8320.7780.744
Additive512rs1106199618363332.846 × 10−7CACNA2D4,LRTM22473702.7740.7140.752
Additive63rs613554501179543170.000000294 2363812.8690.7860.744
Additive63rs67985121180198190.000000294 2363812.8690.7860.744
Additive812GSA-rs117577524305496383.316 × 10−7 2273902.8690.7940.744
Additive98rs46202591089794390.000000349 5743402.1750.8280.722
Additive1016rs7400703867858565.776 × 10−7RBFOX15793352.0760.7810.733
Additive1119rs7501776089409410.00000115MUC162643532.8830.7080.755
Additive1213rs9529111666528390.000001648PCDH9191312691.4260.6720.752
Additive1311:1188130001182703770.000001653 2393782.9170.8050.741
Additive1411rs10501687887990110.000001725GRM5221592371.3070.7680.7
Additive1514kgp196446751000775960.000001896EVL5573571.9270.8510.727
Additive1610rs107491511140174650.000002292 71053071.8330.7040.752
Additive176rs17059990999801790.0000023MCHR22653522.8170.8660.726
Additive1822:42166453419393130.00000233C2orf91351622201.1680.740.702
Additive1912rs15540801281830130.00000245 5703441.8140.7010.754
Additive202rs116925861341594340.000003951 111023061.5930.7510.73
Additive2116rs75384045553088680.000004132 3523642.2420.850.732
Additive2218rs117231913796912890.000004475CTDP13553612.4210.6930.754
Additive233rs731844921894051460.000005259 1533643.5090.9390.718
Additive2421rs2834573346680830.000005392 2933242.6460.6960.764
Additive256kgp17238235271752790.000006765 4853301.9190.7950.734
Additive266kgp33519581227549060.00000681 2363802.8380.7090.751
Additive2711rs10831496888248230.000007262GRM5241672281.2510.7570.707
Additive281rs757317511874434850.000007626 1503683.5090.9440.725
Additive2918rs98964442312030.000007922DLGAP11493683.5090.7840.742
Additive301212:1329322181323556320.000008031 1203953.5090.780.743
Model, the genetic model in which the GWAS selected candidate SNPs; CHR, chromosome number; Related gene, the gene that is closest to the SNP location; A/A, each SNP’s minor allele is homozygous; A/B, each SNP’s major allele is heterozygous; B/B, each SNP’s major allele is homozygous; * p < 5 × 10⁻⁸.
Table 3. Top 30 candidate SNPs selected from the GWAS (dominant model).
ModelRankCHRSNPPositionpRelated GeneGenotype (Patients)Phenotype (Mean)
A/A A/B B/BA/A A/B B/B
Dominant16kgp119471811395828221.592 × 10−8 * 02417NA3.1760.746
Dominant299:1330136401302513611.730 × 10−8 * 02417NA3.1180.746
Dominant310rs7633152921199121263.807 × 10−8 *SEC23IP03416NA2.620.744
Dominant466:80456944797472271.223 × 10−7 04415NA2.4340.742
Dominant577:1182633731186233192.066 × 10−7 02417NA2.9530.747
Dominant610rs777175821263939474.341 × 10−7 023396NA1.4110.72
Dominant71rs7554312521753650914.979 × 10−7TNR03416NA2.6770.744
Dominant81313:88770953881186985.634 × 10−7 04415NA2.1090.745
Dominant92rs63751260474033090.000001091MSH202416NA2.8830.749
Dominant1019rs146815072328306390.000001368SLC7A904415NA2.2890.743
Dominant115rs1457782771613112530.0000014GABRB2013406NA1.5160.734
Dominant121818:345222234522250.000001471TGIF102415NA2.8590.75
Dominant139GSA-rs10967750271661610.000001495TEK05414NA1.9930.743
Dominant141919:12311461122006460.000001562LOC100289333194082.4711.5370.738
Dominant154JHU_4.1663269861654058350.000001738CPE3543620.9421.0790.708
Dominant161313:77841745772676100.000002003MYCBP204412NA2.0310.747
Dominant176rs1925967821553059080.000002575TFB1M03413NA2.3970.745
Dominant183rs117341459396304840.00000258 04415NA2.1440.744
Dominant1918rs463222639891880.000002665DLGAP1,DLGAP1-AS41273900.1791.2870.722
Dominant205kgp57175691720425970.0000033STK101313862.1251.1360.725
Dominant218GSA-rs147608943300524190.000003361 05414NA1.9550.743
Dominant2288:40320989404634700.000003413 04414NA2.1630.739
Dominant233kgp2760268263006000.000003538 03416NA2.3230.747
Dominant241kgp15630468180457400.000003604 012407NA1.4790.737
Dominant251kgp15515856476362110.000004042 08411NA1.590.742
Dominant2633:40166299401248080.00000439MYRIP02415NA2.6460.75
Dominant2733:40027538399860470.000004617MYRIP02417NA2.6460.749
Dominant2833:1498172301500994430.000004786 04415NA2.0750.745
Dominant291919:12306462121956470.000005029LOC1002893331144042.4711.3450.733
Dominant291919:12352578122417630.000005029 1144042.4711.3450.733
Model, the genetic model in which the GWAS selected the candidate SNPs; CHR, chromosome number; Related gene, the gene that is closest to the SNP location; A/A, each SNP’s minor allele is homozygous; A/B, each SNP’s major allele is heterozygous; B/B, each SNP’s major allele is homozygous; NA, not available; * p < 5 × 10⁻⁸.
Table 4. Top 30 candidate SNPs selected from the GWAS (recessive model).
ModelRankCHRSNPPositionpRelated Gene Genotype (Patients)Phenotype (Mean)
A/A A/B B/BA/A A/B B/B
Recessive18rs12836711074214597.698 × 10−11 *ANGPT15873272.3750.8730.703
Recessive18rs12837201074601007.698 × 10−11 *ANGPT15893252.3750.860.705
Recessive39GSA-rs727527011259922743.814 × 10−8 * 2503673.0110.7760.743
Recessive41rs39177441696087522.568 × 10−7SELP2513662.8320.7780.744
Recessive512rs1106199618363332.672 × 10−7CACNA2D4,LRTM22473702.7740.7140.752
Recessive63rs613554501179543173.039 × 10−7 2363812.8690.7860.744
Recessive63rs67985121180198193.039 × 10−7 2363812.8690.7860.744
Recessive612GSA-rs117577524305496383.039 × 10−7 2273902.8690.7940.744
Recessive913rs9529111666528394.469 × 10−7PCDH9191312691.4260.6720.752
Recessive108rs46202591089794395.146 × 10−7 5743402.1750.8280.722
Recessive1116rs7400703867858566.499 × 10−7RBFOX15793352.0760.7810.733
Recessive1219rs7501776089409410.000001066MUC162643532.8830.7080.755
Recessive1311:1188130001182703770.000001725 2393782.9170.8050.741
Recessive1410rs107491511140174650.000001958 71053071.8330.7040.752
Recessive1512rs15540801281830130.000001979 5703441.8140.7010.754
Recessive1614kgp196446751000775960.000002605EVL5573571.9270.8510.727
Recessive176rs17059990999801790.000003439MCHR22653522.8170.8660.726
Recessive1811rs10501687887990110.000003562GRM5221592371.3070.7680.7
Recessive1918rs117231913796912890.000003767CTDP13553612.4210.6930.754
Recessive202rs116925861341594340.00000408 111023061.5930.7510.73
Recessive2121rs2834573346680830.000004617 2933242.6460.6960.764
Recessive2216rs75384045553088680.000005399 3523642.2420.850.732
Recessive2322:42166453419393130.000006107C2orf91351622201.1680.740.702
Recessive246kgp33519581227549060.00000622 2363802.8380.7090.751
Recessive256kgp17238235271752790.000007322 4853301.9190.7950.734
Recessive261212:1329322181323556320.00000773 1203953.5090.780.743
Recessive273rs731844921894051460.000008219 1533643.5090.9390.718
Recessive2718rs98964442312030.000008219DLGAP11493683.5090.7840.742
Recessive2719rs112363595566608730.000008219 1183993.5090.7070.748
Recessive308rs4734909918613900.000009082 131202861.4670.6560.768
Model, the genetic model in which the GWAS selected the candidate SNPs; CHR, chromosome number; Related gene, the gene that is closest to the SNP location; A/A, each SNP’s minor allele is homozygous; A/B, each SNP’s major allele is heterozygous; B/B, each SNP’s major allele is homozygous; * p < 5 × 10⁻⁸.
Table 5. Top 20 candidate genes selected from gene-based analysis.
ModelRankCHRGene Start PositionGene Stop PositionGenenSNPsZ StatisticpP a
Additive11279451088063744SLC2A14304.63131.8167 × 10−60.035151328 *
Additive28108241721108530283ANGPT1244.42164.8995 × 10−60.094800426
Additive31219094331965918LRTM2194.12830.0000182750.353602975
Additive46170131718170201680ERMARD43.9780.0000347470.672319703
Additive52011412051186059TMEM74B83.95180.0000387840.750431616
Additive6173911396839163387KRT4073.9380.0000410890.795031061
Additive7171910267419145839AC106017.123.85610.0000576071
Additive87112439202112599971C7orf6053.84810.0000595191
Additive91169538087169619431SELP213.74610.0000897991
Additive10173909466939143144KRT3953.71750.000100591
Additive11173912968639170385KRTAP3-363.70190.000107021
Additive121245113007245310466EFCAB2263.69280.000110921
Additive1335010634150176454RBM543.65320.000129491
Additive1416033898060412462CYP2J223.65250.000129861
Additive1519362547693764287CCDC1863.63290.000140141
Additive16137583880876076250TBC1D4423.60250.000157581
Additive172128828774128973251UGGT163.59180.000164221
Additive1853266917632811819NPR3193.51680.000218391
Additive1915447734754539177TMEM5933.51430.000220451
Additive206169837307170122159WDR27153.46290.000267181
Dominant1154145492341542941EXD154.38825.7145 × 10−60.108884083
Dominant21212983483213040991C1orf22753.91540.0000451290.859887966
Dominant3172823621828455470EFCAB5103.8760.0000530861
Dominant42094980369839689PAK7863.60460.000156341
Dominant5182893674029014875DSG4173.5480.000194091
Dominant6191225387912320064ZNF136133.52480.000211911
Dominant7225104118251086607ARSA193.47570.000254781
Dominant8164709161447197908NETO263.44940.000280921
Dominant91213011597213092705FLVCR193.44930.000281061
Dominant105171268553171453877FBXW11213.41780.000315661
Dominant1149319840293245329RP11-9B6.133.39540.000342671
Dominant125171449077171635390STK10643.39340.000345121
Dominant13135046684250530626SPRYD733.37820.000364821
Dominant1483768078637727422BRF2113.3720.000373121
Dominant15185479429354837531BOD1L2153.35440.000397631
Dominant1612116375711116735143MED13L333.3490.000405511
Dominant17225101911451072409MAPK8IP2253.32440.000443011
Dominant18125550346555544586OR9K273.28810.000504341
Dominant19195730144557372096PEG3143.27390.000530341
Dominant20137759879277921185MYCBP2283.23970.000598261
Recessive11279451088063744SLC2A14304.4673.9655 × 10−60.073841576
Recessive28108241721108530283ANGPT1244.29618.6923 × 10−60.161859318
Recessive31219094331965918LRTM2194.21810.0000123170.229354857
Recessive42011412051186059TMEM74B83.95410.0000384140.715307094
Recessive5173911396839163387KRT4073.94250.0000403180.750761478
Recessive66170131718170201680ERMARD43.94120.0000405430.754951203
Recessive7171910267419145839AC106017.123.80990.0000695181
Recessive87112439202112599971C7orf6053.80120.0000719981
Recessive91169538087169619431SELP213.78780.0000760021
Recessive102128828774128973251UGGT163.75360.0000871581
Recessive11137583880876076250TBC1D4423.72310.0000983781
Recessive12173912968639170385KRTAP3-363.70970.000103751
Recessive13173909466939143144KRT3953.70680.000104961
Recessive1435010634150176454RBM543.69360.000110571
Recessive1516033898060412462CYP2J223.64680.000132761
Recessive16168570369085804735C16orf74113.57850.000172791
Recessive171218811232048002CACNA2D4413.52560.000211261
Recessive1819362547693764287CCDC1863.52270.000213581
Recessive1934724951647344941KIF933.45810.000271971
Recessive206169837307170122159WDR27153.4540.000276181
Model, the genetic model in which candidate genes were selected by analysis; CHR, chromosome number; nSNPs, the number of SNPs annotated to the gene; Z Statistic, gene-based test statistic; p a, adjusted p value for multiple testing; *, significant association after conservative Bonferroni correction.
Publisher’s Note: MDPI stays neutral with regard to jurisdictional claims in published maps and institutional affiliations.

