Article

Pt Modified Heterogeneous Catalysts Combined with Ozonation for the Removal of Diclofenac from Aqueous Solutions and the Fate of by-Products

1
Laboratory of Industrial Chemistry and Reaction Engineering, Johan Gadolin Process Chemistry Centre, Åbo Akademi University, Biskopsgatan 8, FI-20500 Åbo/Turku, Finland
2
Laboratory of Organic Chemistry, Johan Gadolin Process Chemistry Centre, Åbo Akademi University, Biskopsgatan 8, FI-20500 Åbo/Turku, Finland
3
Technical Chemistry Department of Chemistry Chemical-Biological Center, Umeå University, SE-90187 Umeå
4
Wihuri Physical Laboratory, University of Turku, FI-20540 Turku, Finland
5
Institute of Biomedicin, University of Turku, Kiinamyllynkatu 10, FI-20520 Turku, Finland
*
Authors to whom correspondence should be addressed.
Submission received: 7 February 2020 / Revised: 28 February 2020 / Accepted: 9 March 2020 / Published: 12 March 2020

Abstract

:
The degradation of the pharmaceutical compound diclofenac in an aqueous solution was studied with an advanced oxidation method, catalytic ozonation. Diclofenac was destroyed in a few minutes by ozonation but several long-lasting degradation by-products were formed. For this reason, the combination of heterogeneous catalysts and ozonation was applied to eliminate them completely. The kinetics of the diclofenac degradation and the formation of by-products were thoroughly investigated. Loading of Pt on the catalysts resulted in an improvement of the activity. The Mesoporous Molecular Sieves (MCM) were one of the promising catalysts for the degradation of organic pollutants. In this study, six heterogeneous catalysts were screened, primarily MCM-22-100 catalysts with different Pt concentrations loaded via the evaporation-impregnation (EIM) method, and they were applied on the degradation of diclofenac. It was found that the presence of Pt improved the degradation of diclofenac and gave lower concentrations of by-products. The 2 wt % Pt-H-MCM-22-100-EIM demonstrated the highest degradation rate compared to the proton form, 1% or 5 wt % Pt concentration, i.e., an optimum was found in between. Pt-H-Y-12-IE and Pt-γ-Al2O3 (UOP)-IMP catalysts were applied and compared with the MCM-22 structure. Upon use of both of these catalysts, an improvement in the degradation of diclofenac and by-products was observed, and the 2 wt % Pt-H-MCM-22-100-EIM illustrated the maximum activity. All important characterization methods were applied to understand the behavior of the catalysts (X-ray powder diffraction, transmission electron microscopy, nitrogen physisorption, scanning electron microscopy, energy dispersive X-ray micro-analyses, pyridine adsorption-desorption with FTIR spectroscopy, X-ray photoelectron spectroscopy). Finally, leaching of Pt and Al were analyzed by inductively coupled optical emission spectrometry.

1. Introduction

The appearance of pharmaceutical compounds in the aquatic environment, particularly in the surface waters, has become a global concern because various pharmaceuticals are frequently detected in wastewaters, surface waters as well as ground waters around the world. In rivers and surface waters, pharmaceuticals are sometimes observed at very high concentrations, even up to mg per liter scales [1,2,3]. This is mainly due to the residuals of veterinary and medical pharmaceuticals discharged to surface waters from the excreta of human and animals, the sewage effluent of water treatment processes, as well as hospital and domestic wastewaters [4]. Owing to the typically strong biological activity of the pharmaceuticals, they are harmful for marine animals, micro-organisms and potentially human beings as well [5,6]. Most of these compounds are persistent to the treatment applied in conventional wastewater treatment plants [7].
Diclofenac (2-(2-(2,6-dichlorophenylamino) phenyl) acetic acid), or DCF, is a non-steroidal anti-inflammatory drug (NSAID). The molecular structure of DCF is displayed in Figure 1. DCF can be used as oral tablets or as a topical gel for the prescription of osteoarthritis, rheumatoid arthritis, migraine headache, and menstrual cramps [8,9]. DCF has been identified in numerous freshwaters worldwide, and more than 100 publications have announced its occurrence in surface waters and ground waters. This medicine is analyzed in freshwaters at Eco toxicological levels [10]. As an example, DCF was reported by the Ministry of Health of Malaysia (2010) as one the most generally used domestic drug, and it was detected in the three largest rivers Lui, Gombak, and Selangor at concentrations of 2.76, 4.84 ng/L, and 4.30 ng/L, respectively [4]. In Pakistan, DCF and five of its transformation by-products have been detected in the Malir and Lyari River, as well as in surface and effluent waters of Karachi. The highest measured concentrations of DCF, 4′-hydroxydiclofenac, and 5-hydroxydiclofenac were 85,000 ng/L, 18,000 ng/L, and 3000 ng/L, respectively [11]. The occurrence of DCF has been studied in waste waters of Colombian rivers too. Concentrations corresponding to 400 ng/L at Bogotá and 256 ng/L at Medellin wastewater influent have been detected. Even after the water treatment plants (in the effluents), the concentrations were 340 ng/L and 170 ng/L [2]. In Europe, too, the concentrations of DCF are alarming. For example, in the surface waters of Milan it was detected at up to 100 ng/L [6]. In the investigation of the concentrations of pharmaceuticals along a 32 km expansion of a highly wastewater contaminated watercourse (rivers and lakes) in Eastern Finland, the DCF load varied from 6000 mg/day to 10,000 mg/day depending on the seasons [12].
DCF is reported to have potentially adverse effects on aquatic organisms such as that it has an influence on the kidney and gill integrity in the brown trout a salmonid kind and more over it have potential of bioaccumulation via food chain [13,14,15]. Stickleback fish which was exposed to sewage effluents containing DCF at low concentrations (μg/L) were affected by kidney alterations [16].
Usually, DCF is not entirely degraded via wastewater treatment methods. It is in fact poorly biodegradable throughout the entire wastewater treatment plants [8,17]. Consequently, it remains in effluents and pollutes surface and ground waters which are the principal sources of drinking water. Indeed, frequent detection of DCF in drinking water sources prove this evidence [18,19]. DCF can potentially interact with organic and inorganic contaminants in the environment, especially in the wastewater treatment processes, for instance with organic pollutants and metals, which may drive to the production of other harmful pollutants [20].
Various studies have focused on how to decrease the toxicity and improve the degradation of emerging pharmaceutical pollutants. Advanced oxidation processes (AOPs) are one of the most promising technologies for the removal of organic macro-pollutants. They could provide practical technologies to the degradation of non-biodegradable pharmaceuticals in contaminated wastewater as a replacement to the biological treatment [21,22,23]. Some methods have been proposed for the removal of DCF from wastewater using adsorption [24], photocatalytic degradation [25], the use of microorganisms [26], and sludge treatment [8]. Still, most of the treatments proposed have issues such as long-term procedure, low effectiveness, adverse environmental impact, high cost, or they have been proposed without analyzing the by-products at all [24]. A promising AOP method is ozonation, because ozone has the ability to attack aromatic molecules and unsaturated bonds, and it is a well-known method for the removal of pharmaceuticals [27,28]. There is, however, a risk concerning the formation of toxic by-products appearing during ozone treatment [29]. While 99% of DCF can be removed 99% by ozonation, only 24% of it was mineralized and the toxicity was only slightly decreased [30]. Combination of heterogeneous catalysis and ozonation improves the removal of organic micro pollutants by the transformation of ozone into high reactive species or by direct reactions on the surface of catalysts [31]. Aguinaco et al. investigated the elimination of DCF from the water via photocatalytic ozonation, where TiO2 was employed as a catalyst. Their study revealed that DCF was removed after 6 min, and the total amount of organic compounds were removed to 60% after 60 min of reaction [32]. Loading Pt on supported catalysts increases their activity during the ozonation process in the elimination of organic pollutants such as Pt-supported alumina in the removal of paracetamol and Pt-Ce/BEA catalyst in toluene oxidation [33,34].
This work investigates the efficiency of catalytic ozonation on the removal of DCF and the evolution of by-products. Pt-modified catalysts were synthetized, several types of characterizations were applied to understand the catalytic behavior. The effect of the Pt loading on the catalysts, the catalyst concentration and catalyst structures in the transformation of DCF and its degradation by-products were studied, too.

2. Results and Discussion

2.1. Results Physico-Chemical Characterization of Pt-Modified Catalysts

2.1.1. X-Ray Powder Diffraction (XRD)

X-ray powder diffraction was used to determine the phase purities and structures of H-MCM-22-100, 1 wt % Pt-MCM-22-100-EIM, 2 wt % Pt-MCM-22-100-EIM, 5 wt % Pt-MCM-22-100-EIM, Pt-H-Y-12-IE and Pt-γ-Al₂O₃ (UOP)-IMP catalysts. The measured XRD patterns of the MCM-22-100 samples are shown in Figure 2a. (2θ: 0–40) and 2b. (2θ: 40–100). The reference pattern fitted to the data is a zeolite structure with the MWW framework [35]. The 2% and 5 wt % Pt samples were phase pure. The detection limit for the impurities is around 1 vol.% when the reference pattern fits the data well, like in this case. The 1 wt % Pt sample has a hint of Si phase visible. The sample without Pt has extra peaks possibly originating from a different type of a framework. Estimating from the relative peak intensity, amount of the impurity phase was about 10–20 vol.%. The results are collected in Table 1. The lattice parameters given in the table were obtained from the Rietveld refinements and the crystal sizes were estimated from the FWHMs of the (102) peaks using the Scherrer equation after correcting the FWHMs for the instrument resolution. The agreement between the fits and the measured XRD data is good in the MCM-22-100 sample series. Thus, the phase identification and the lattice parameters can be reported with a high degree of certainty. The impurities in the H-MCM-22-100 sample could have two different sources: one is a large unit cell structure visible as peaks at the low angles and the other is a small unit cell structure visible as a shoulder in the peak at 26֩ and as a separate peak at 49.5֩. The latter peaks do not match with Al, Si or Al2O3.
The measured XRD pattern of the Pt-H-Y-12-IE sample is shown in Figure 2c. The reference pattern fitted to the data is a zeolite structure with the Faujasite (FAU) framework [36]. In addition to the FAU framework, the Pt-H-Y-12-IE sample shows a Pt phase. A fcc structure was used to fit the Pt phase. The fit results are collected in Table 1. The lattice parameters given in the table were obtained from the Rietveld refinements and the crystal sizes were estimated from the FWHMs of the (331) peak for FAU and of the (111) peak for Pt phase using the Scherrer equation after correcting the FWHMs for the instrument resolution.
The measured XRD pattern of the Pt-γ-Al₂O₃ (UOP)-IMP sample is displayed in Figure 2d. The pattern shows broad smooth features which contain multiple peaks smeared by the Scherrer broadening into a single large peak. The data were Rietveld refined using a tetragonal unit cell [37]. The fit results are collected in Table 1. The lattice parameters and the crystal sizes given in the table for the Pt-γ-Al₂O₃ (UOP)-IMP sample were obtained from the Rietveld refinements.
The majority phase in all the four types of MCM-22 zeolite catalysts were MWW. There were some impurities present in the catalysts, which were present as SiO2 domains in the synthesized MCM-22 zeolite. The presence of SiO2 phase in the MCM-22 catalysts were attributed to the unreacted source of silica. It is noteworthy to mention that some of the peaks appearing, which were not identified as SiO2, Al2O3 can be attributed to the PtO2 oxide phase. The three Pt-modified catalysts 1 wt % Pt-MCM-22-100-EIM, 2 wt % Pt-MCM-22-100-EIM and 5 wt % Pt-MCM-22-100-EIM, peaks present as PtO2 should be observed. However, due to small amounts of Pt in 1 wt % Pt-MCM-22-100-EIM and 2 wt % Pt-MCM-22-100-EIM, PtO2 phase was not visible. Further explanation for the absence of the PtO2 phase could be nano size of PtO2 < 3 nm which are not detected by an X-ray powder diffractometer.
The agreement between the fits and the measured XRD data is reasonable in both Pt-H-Y-12-IE and Pt-γ-Al₂O₃(UOP)-IMP samples. Resolving a small fraction of Pt particles from the γ-Al2O3 phase is very challenging because all the Pt peaks, except for a single peak at 80◦, coincide with the γ -Al2O3 peaks. To detected small amounts of Pt in γ-Al2O3 would need to be compared the Pt-γ-Al₂O₃(UOP)-IMP sample measurement to a clean reference sample of γ-Al2O3.

2.1.2. Transmission Electron Microscopy (TEM)

The TEM images of (a) H-MCM-22-100, (b) 1 wt % Pt-MCM-22-100-EIM, (c) 2 wt % Pt-MCM-22-100-EIM, (d) 5 wt % Pt-MCM-22-100-EIM, (e) Pt-H-Y-12-IE and (f) Pt-γ-Al₂O₃ (UOP)-IMP catalysts and Pt particle size distributions are illustrated in histograms displayed in Figure 3. Figure 3a shows the structure of H-MCM-22-100 by TEM images, the lengths of the channels can be measured from these images between 1.12–1.63 nm.
The TEM images exhibited the largest Pt particles for the Pt-H-Y-IE catalyst (30.6 nm) and the second largest Pt particles for 1 wt % Pt-MCM-22-100-EIM (24.9 nm). The smallest average Pt- particles were obtained for 5 wt % Pt-MCM-22-100-EIM (2.7 nm) catalyst. The explanation for the very small nanoparticles of Pt in 5 wt % Pt-MCM-22-100-EIM compared to 1 wt % Pt-MCM-22-100-EIM can be attributed to a very high dispersion of Pt on the H-MCM-22-100 catalyst. Furthermore, high dispersion of Pt nanoparticles in H-MCM-22-100 can also be attributed to the presence of Pt nanoparticles only at the size of 5 nm (Figure 3d). Additionally, the description of variations in the average Pt particles is attributed to the methods of Pt introduction in the support materials H-MCM-22, H-Y and Al2O3 (Table 2). Furthermore, the structures of the supports H-MCM-22, H-Y and Al2O3, surface area, Brønsted and Lewis acid sites of these catalytic materials can also influence the formation of Pt particles, size and dispersion.

2.1.3. Nitrogen Physisorption

The catalysts were characterized by nitrogen physisorption for the measurement of the specific surface areas and the specific pore volumes. The surface areas were calculated the aid of the Brunauer-Emmett-Teller (BET) theory. The results from nitrogen physisorption analysis are presented in Table 3.
The highest specific surface areas and pore volumes were obtained for the Pt-H-Y-12-IE catalyst (835 m2/g). For the spent Pt-H-Y-12-IE catalyst a decrease of the surface area and pore volume was observed. This decrease in the surface area and pore volume is attributed to the coke formation in the pores of the Pt-H-Y-IE zeolite catalyst. All the spent catalysts studied in the reaction showed a decrease in the surface area and the pore volume. However, the extent to which the decrease in surface area and pore volume took place, was dependent on the structure of zeolite, i.e., H-MCM-22, H-Y and Al2O3. The Pt-γ-Al2O3 (UOP)-IMP spent catalyst showed the highest decrease in the surface area, followed by H-MCM-22 spent zeolite catalyst according to Table 3. The Pt-modified H-MCM-22 and H-Y-12 zeolite catalysts exhibited lower surface areas than the Pt-modified H-MCM-22, H-Y-12 fresh catalysts. The reason for such a decrease in the surface area for Pt-γ-Al2O3 (UOP)-EIM (189 m2/g) is probably due to the coke formation in the pores of the catalysts. The Pt-modified MCM-22-100-EIM catalysts exhibited a smaller decrease in the surface area (Table 3) for the spent catalysts. A plausible explanation for the lower decrease in the surface area for 1 wt % Pt-, 2 wt % Pt-, 5 wt % Pt-H-MCM-22-100-EIM can be attributed to the presence of Pt- in the MCM-22 zeolite catalysts, which has a coke inhibiting property. Similarly, decrease in the surface area for the Pt-H-Y-IE catalyst (767 m2/g) spent catalyst was much lower than the fresh Pt-H-Y-IE (835 m2/g) catalyst.

2.1.4. Scanning Electron Microscopy (SEM) and Energy Dispersive X-Ray Microanalyses

Scanning electron microscopy (SEM) was applied for the measurement of the crystal size, shape and distributions of the synthesized catalytic materials. Furthermore, the crystal size distributions for the H-MCM-22, Pt-modified H-MCM-22-100-EIM, H-Y-IE and γ-Al₂O₃ (UOP)-IMP catalysts were measured as (100–800 nm) and (300–800 nm), respectively (Figure 4). The differences in the crystal size distributions for Pt-modified H-MCM-22-100-EIM and Pt-modified H-Y-IE are attributed to the variations in the shapes and structures of the studied H-MCM-22 (MWW) and H-Y (FAU) zeolites. It is noteworthy to mention that modifications of pristine H-MCM-22 and H-Y zeolite catalysts with Pt- did not influence the parent structures (Figure 4). The largest average crystal size (396 nm) was measured for 5 wt % Pt-H-MCM-22-100-EIM catalyst among the 1 wt % Pt-, 2 wt % Pt-, 5 wt % Pt- catalysts. The second largest crystals were measured for H-MCM-22 (386 nm) catalyst. The Pt-H-Y-IE zeolite catalyst exhibited the average crystal size (493 nm). The crystal size distribution of the (a) H-MCM-22-100, (b) 1 wt % Pt-MCM-22-100-EIM, (c) 2 wt % Pt-MCM-22-100-EIM, (d) 5 wt % Pt-MCM-22-100-EIM, (e) Pt-H-Y-12-IE and (f) Pt-γ-Al₂O₃ (UOP)-IMP catalysts are presented in Figure 4a–f.
The amounts of Pt (wt %) in the Pt-modified H-MCM-22-100-EIM, H-Y-12 and γ-Al2O3 catalysts were determined using energy dispersive X-ray micro-analysis. The smallest amount of Pt (0.63 wt %) (Table 4) was measured for 1 wt % Pt-H-MCM-22-100-EIM catalyst and the largest amount of Pt (7.13 wt %) was measured for Pt-γ-Al2O3 catalyst. The differences in the loadings of Pt in H-MCM-22-100, H-Y-12 and γ -Al2O3 catalysts were attributed to the methods of the catalyst synthesis, the support structure and the SiO2/Al2O3 ratio of the zeolites.

2.1.5. Measurements of the Brønsted and Lewis Acid Sites by FTIR Spectroscopy Using Pyridine as a Probe Molecule

The amount of Brønsted and Lewis acid sites of the pristine H-MCM-22-100 and Pt-modified H-MCM-22-100-EIM, H-Y-12-IE and γ-Al2O3 catalysts were determined by FTIR spectroscopy using pyridine adsorption/desorption. Pyridine was desorbed at 250, 350, and 450 °C, and these temperatures indicate the presence of weak, medium and strong acid sites (Table 5).
The largest amount of Brønsted acid sites was obtained for Pt-H-Y-12-IE (145 µmol/g), the zeolite catalyst with lowest SiO2/Al2O3 ratio 12, the second largest amount of Brønsted acid site was obtained for the 1 wt % Pt-MCM-22-100-EIM catalyst (111 µmol/g), the lower amount of Brønsted acid cites is attributed to the high SiO2/Al2O3 ratio 100. It is noteworthy to mention that the H-MCM-22 zeolite catalyst exhibited a much lower amount of Brønsted acid sites (33 µmol/g). The Pt-modified H-MCM-22 i.e., 1 wt % Pt-MCM-22-100-EIM, 2 wt % Pt-MCM-22-100-EIM and 5 wt % Pt-MCM-22-100-EIM catalysts, exhibited an increase of the Brønsted acid sites, the enhancement is attributed to the presence of Pt in the structure of MCM-22. The Pt-γ-Al2O3 (UOP)-IMP catalyst exhibited the lowest amount of Brønsted acid sites, which is attributed to the lower amount of acid sites in γ-Al2O3.

2.1.6. Characterization of the Oxidation States of Pt in Pt-Modified H-MCM-22-100-EIM, Pt-H-Y-12-EIM and Pt-γ-Al2O3-EIM Catalysts by X-ray Photoelectron Spectroscopy (XPS)

X-ray photoelectron spectroscopy (XPS) was used to analyze the oxidation states of Pt (PtO, PtO2 and Pt0) catalysts in 1 wt % Pt-H-MCM-22-100-EIM, 2 wt % Pt-H-MCM-22-100-EIM, 5 wt % Pt-H-MCM-22-100-EIM, Pt-H-Y-12-EIM and Pt-γ-Al2O3 (UOP)-EIM catalysts. The presence of PtO, PtO2 and Pt0 were observed in all the above-mentioned Pt-modified catalysts (Figure 5). The binding energies (eV) of the Pt0 – 71 (eV), PtO – 72 (eV), PtO2 – 74 (eV) were measured for all the studied Pt-modified catalysts. It was inferred from these binding energies that the surface of Pt modified catalytic materials consisted of oxidation states of Pt0, PtO and PtO2, respectively. Similar binding energies for Pt0, PtO, PtO2 have been previously reported by J. Z. Shyu et al. [38] and R. Bouwman et al. [39].

2.2. Non-Catalytic and Catalytic Ozonation of Diclofenac

2.2.1. Influence of Pt Modified Catalysts in Degradation of Diclofenac

The degradation of DCF was investigated by non-catalytic as well as catalytic experiments using ozone as the oxidant. Initially, the catalysts H-MCM-22-100 with different Pt-modified concentrations were used (Figure 6). The kinetic experiments revealed that the degradation rate of DCF was higher in the presence of heterogeneous catalysts compared to non-catalytic experiments. The 2 wt % Pt-MCM-22-100-EIM showed the highest decomposition rate, 95% of DCF had transformed at 4 min, whereas there was still 65% of DCF was left when no catalyst was used. Moreover, the 2 wt % Pt-MCM-22-100-EIM demonstrated a higher degradation efficiency compared to 5 wt % Pt-MCM-22-100-EIM. The excessive loading of metals on the support could decrease the amount of active sites, thus weakening the interaction among the metal and the support [40].
In addition, ozonation of DCF was investigated with 0, 0.25, 0.50 and 1.00 g of 2 wt % Pt-MCM-22-100-EIM catalyst. The results reveal that using 0.25 g of 2 wt % Pt-MCM-22-100-EIM catalyst increased the degradation rate compared to non-catalytic experiments. Moreover, 0.5 g and 1 g of 2 wt % Pt-MCM-22-100-EIM catalyst showed a maximum degradation rate of DCF. After 4 min of ozonation, 65% of DCF was still left in case of non-catalytic experiments whereas in case of catalytic reactions, 35% remained when 0.25 g catalyst was added, 8.3% when 0.5 g was added and 13% when 1 g of 2 wt % Pt-MCM-22-100-EIM catalyst was added (Figure 7a). Moreover, the normalized figure (Figure 7b) of these three amounts of catalyst illustrates an overlap of the kinetic curves revealing that the degradation rate is not dependent on the catalyst amount, which suggests the absence of gas-liquid mass transfer limitations.
A comprehensive study on the ozonation of DCF using different Pt-modified catalyst structures was conducted to evaluate its effect on the degradation of DCF. Two catalysts, Pt-H-Y-IE and Pt-γ-Al₂O₃ (UOP)-IMP were used and compared with the 2 wt % Pt-MCM-22-100-EIM. Figure 8 reveals that the transformation of DCF was relatively similar for these three catalysts.

2.2.2. Quantification of Ozonation Transformation-Products

According to the literature, the advanced oxidation process of DCF leads to the formation of one or more hydroxylated products [30,41]. Two of the hydroxylated products (4’-OH-DCF and 5-OH-DCF) were purchased (Figure 9) and an MRM method was developed to quantify them in order to investigate the effect of heterogeneous catalysis on the formation and transformation of hydroxylated DCF products. The transition used to quantify both 4’-OH-DCF and 5-OH-DCF was the same (m/z 310 -> 266), but the isomers were distinguished by their different retention times. The qualitative transitions were different for the isomers. The presence of the hydroxylated internal standard of the 4’-OH-DCF isomer further helped with distinguishing between the isomers. Chen et al. investigated the mineralization of DCF by ozonation combined with Fe-MCM-41 and Fe-MCM-48 catalysts. Their studies illustrated that mineralization of DCF using these catalysts is higher compared to non-catalytic ozonation [42,43]. For this reason, the MCM-structured catalyst was applied in our experiments to study the degradation of by-products and the performance of the MCM catalyst was compared by other structures.

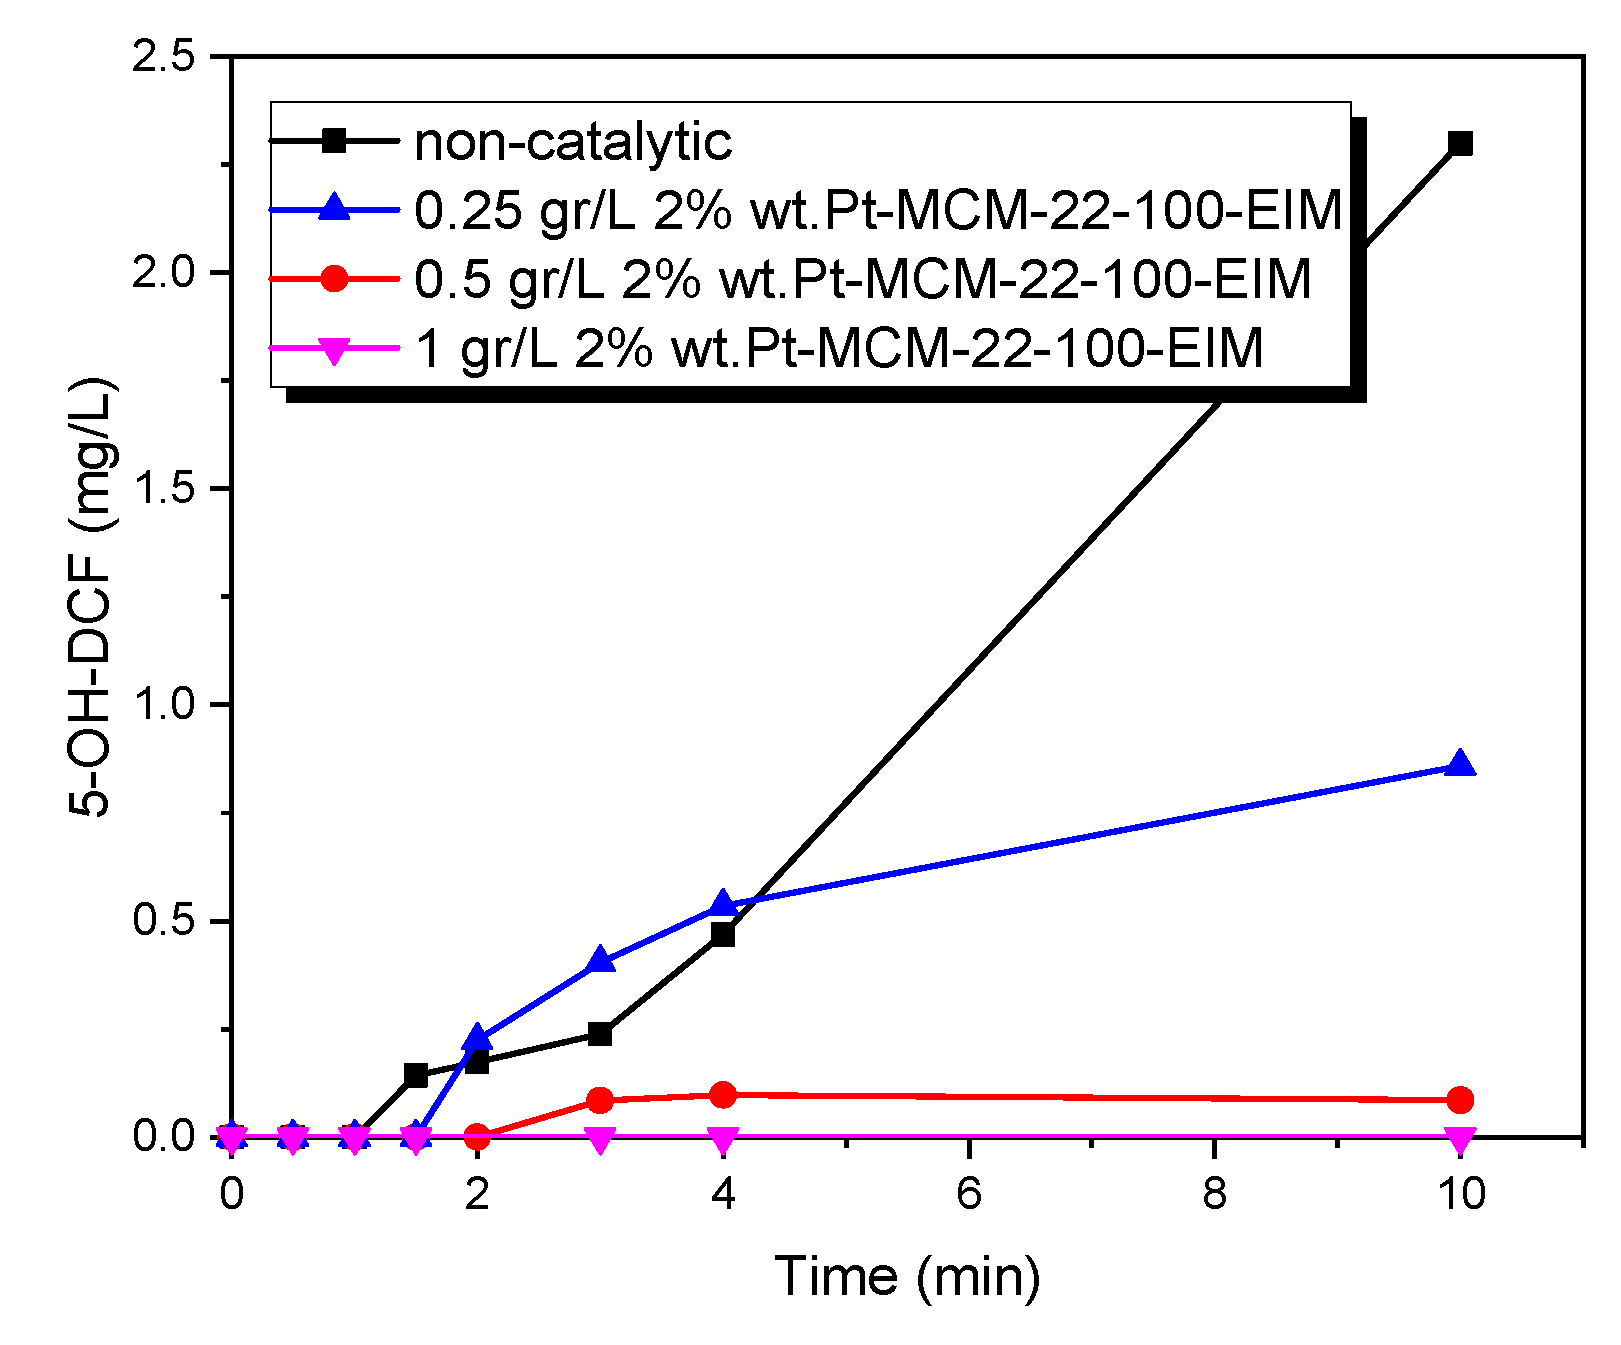
2.2.3. 5-Hydroxy Diclofenac

Figure 10 illustrates the growth of one of the by-products, 5-OH-DCF, which emerges during the ozonation of DCF. In these experiments, using a heterogeneous catalyst resulted in a lower concentration of 5-OH-DCF compared to non-catalytic experiments. The lowest concentration of 5-OH-DCF was observed for the 2 wt % Pt-MCM-22-100-EIM catalyst. The presence of the heterogeneous catalysts affects the formation of 5-OH-DCF. When only the H-MCM-22-100 catalyst was used, the concentration of 5-OH-DCF increased more rapidly than in the metal-catalyzed experiments. The presence of Pt-modified catalyst resulted in a decrease of the maximum concentration of 5-OH-DCF.
Three different catalyst amounts 0.25, 0.5, 1 g of 2 wt % Pt-MCM-22-100-EIM were studied (Figure 11). The formation of 5-OH-DCF decreased when the higher amount of catalyst was employed. As 1 g of catalyst was used, 5-OH-DCF could not be detected at all, which implies that the catalyst inhibits the formation of 5-OH-DCF.
The transformation of 5-OH-DCF with three different catalyst structures in the ozonation process of DCF are illustrated in Figure 12. The decrease of 5-OH-DCF was strongly influenced by different kinds of Pt modified catalysts, especially with 2 wt % Pt-MCM-22-100-EIM and the use of this catalyst resulted in the lowest amount of 5-OH-DCF. Moreover, the concentration of 5-OH-DCF started to decline after 4 min in the presence of the Pt-H-Y-12-IE catalyst.

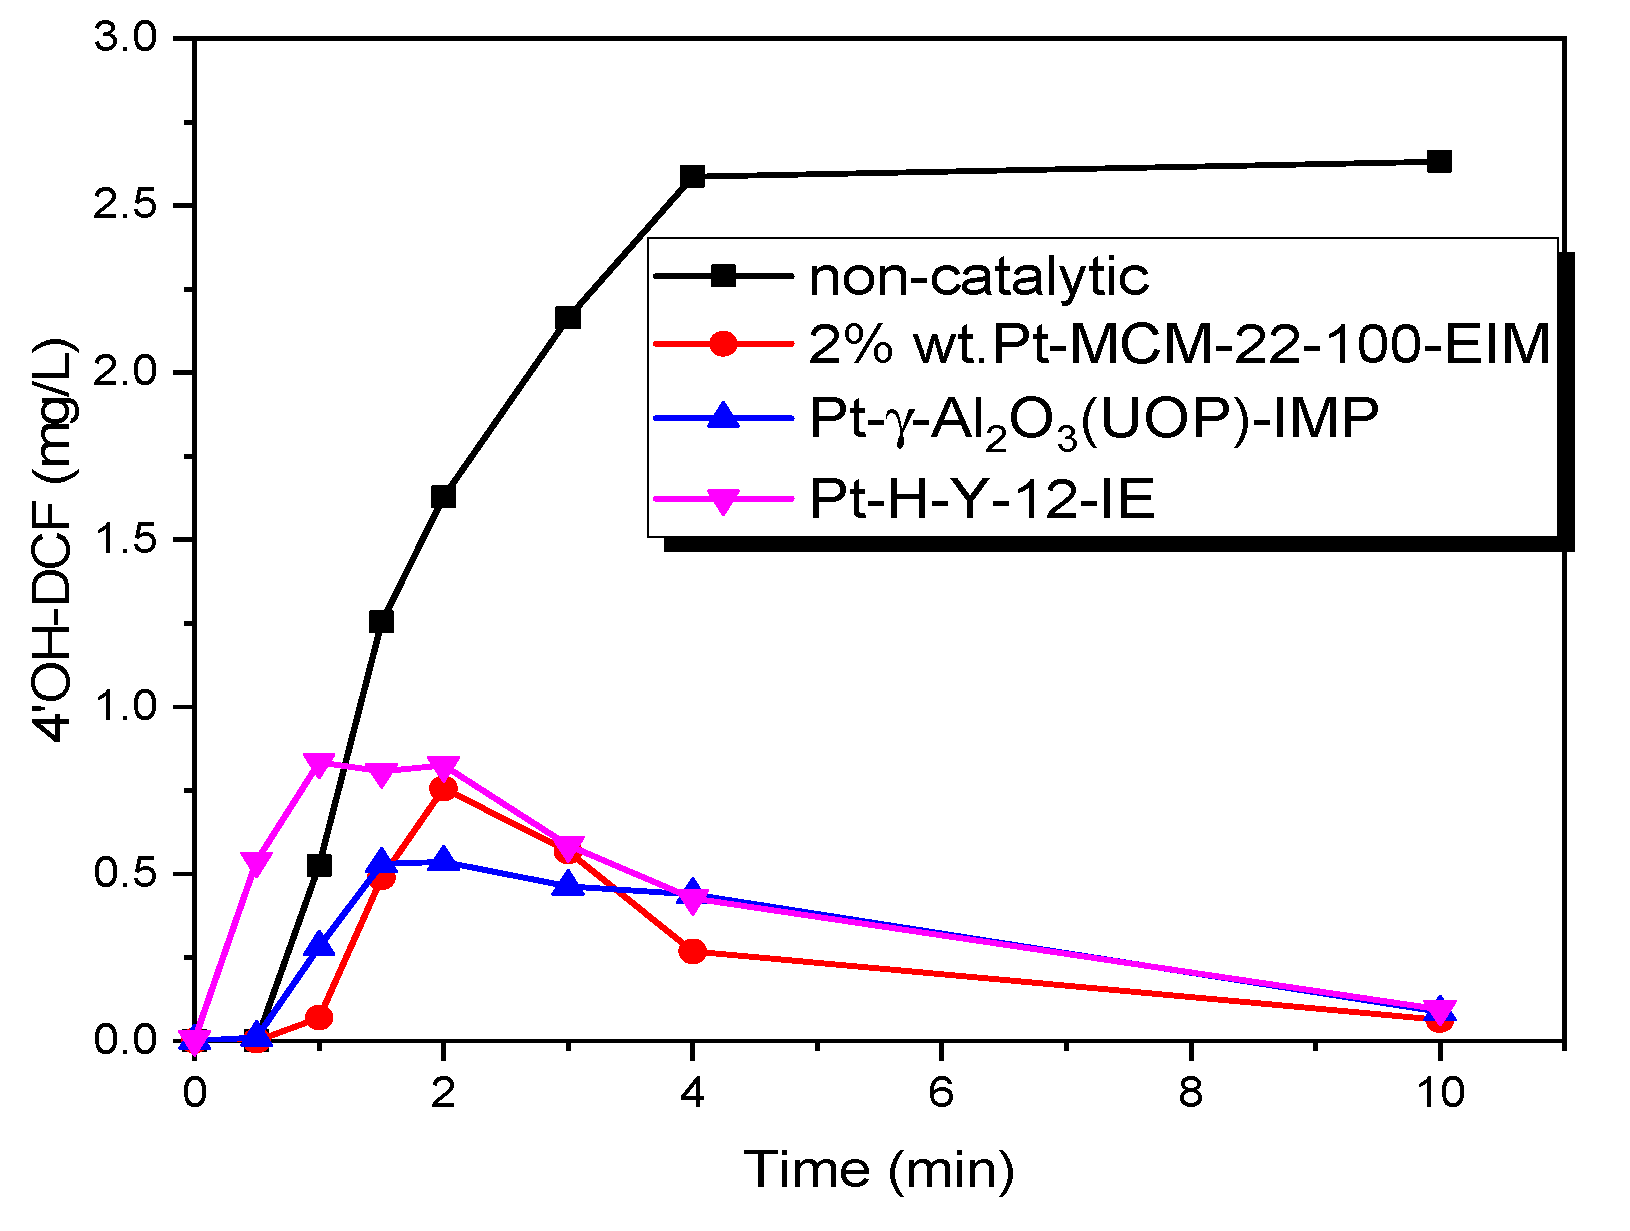
2.2.4. 4’-Hydroxy Diclofenac

The other main by-product formed was 4’-OH-DCF (Figure 9). During non-catalytic experiments, the concentration of 4’-OH-DCF increased to a maximum in 4 minutes but remained stable until the end of the experiment (Figure 13). As MCM-22-100 was used, the maximum concentration of 4’-OH-DCF was lower than in the non-catalytic experiment, and the concentration of 4’-OH-DCF started to decrease towards the end of the experiment. The lowest final concentration was observed as 2 wt % Pt-MCM-22-100 was used.
As mentioned before, three different catalyst amounts (0.25, 0.5, 1 g) of 2 wt % Pt-MCM-22-100-EIM were studied in DCF elimination (Figure 14). The maximum concentration of 4’-OH-DCF which was formed decreased as the amount of catalyst increased. The concentration of 4’-OH-DCF after 10 min of ozonation was 0.06 mg/L only when 1 g of 2 wt % Pt-MCM-22-100-EIM was used, compared to 2.63 mg/L when no catalyst was present. This implies that the catalyst inhibits the formation of 4’-OH-DCF and/or enhances the transformation of it to the low molecular by-products.
The effects of the different structures of Pt-modified catalysts combined with the ozonation on the transformation of 4’-OH-DCF are displayed in Figure 15. The amount of 4’-OH-DCF increased to around 1 mg/L at 2 min; later it declined to zero at 10 min in catalytic ozonation. All these three catalysts turned to be efficient upon transformation of 4’-OH-DCF compared to the non-catalytic process.
The mechanisms that could enhance the degradation of DCF and by-products in the presence of heterogeneous catalysts were as follows: the first pathway is the ozone adsorption on the catalyst surface, following the generation of more active radical species which react with DCF and by-products; the second pathway is that the DCF and/or by-products adsorb on the catalyst surface resulting in a reaction by dissolved ozone; and the third pathway is that the ozone, DCF and its by-products adsorb on the catalyst surface and react by direct or indirect reaction on the surface [44].

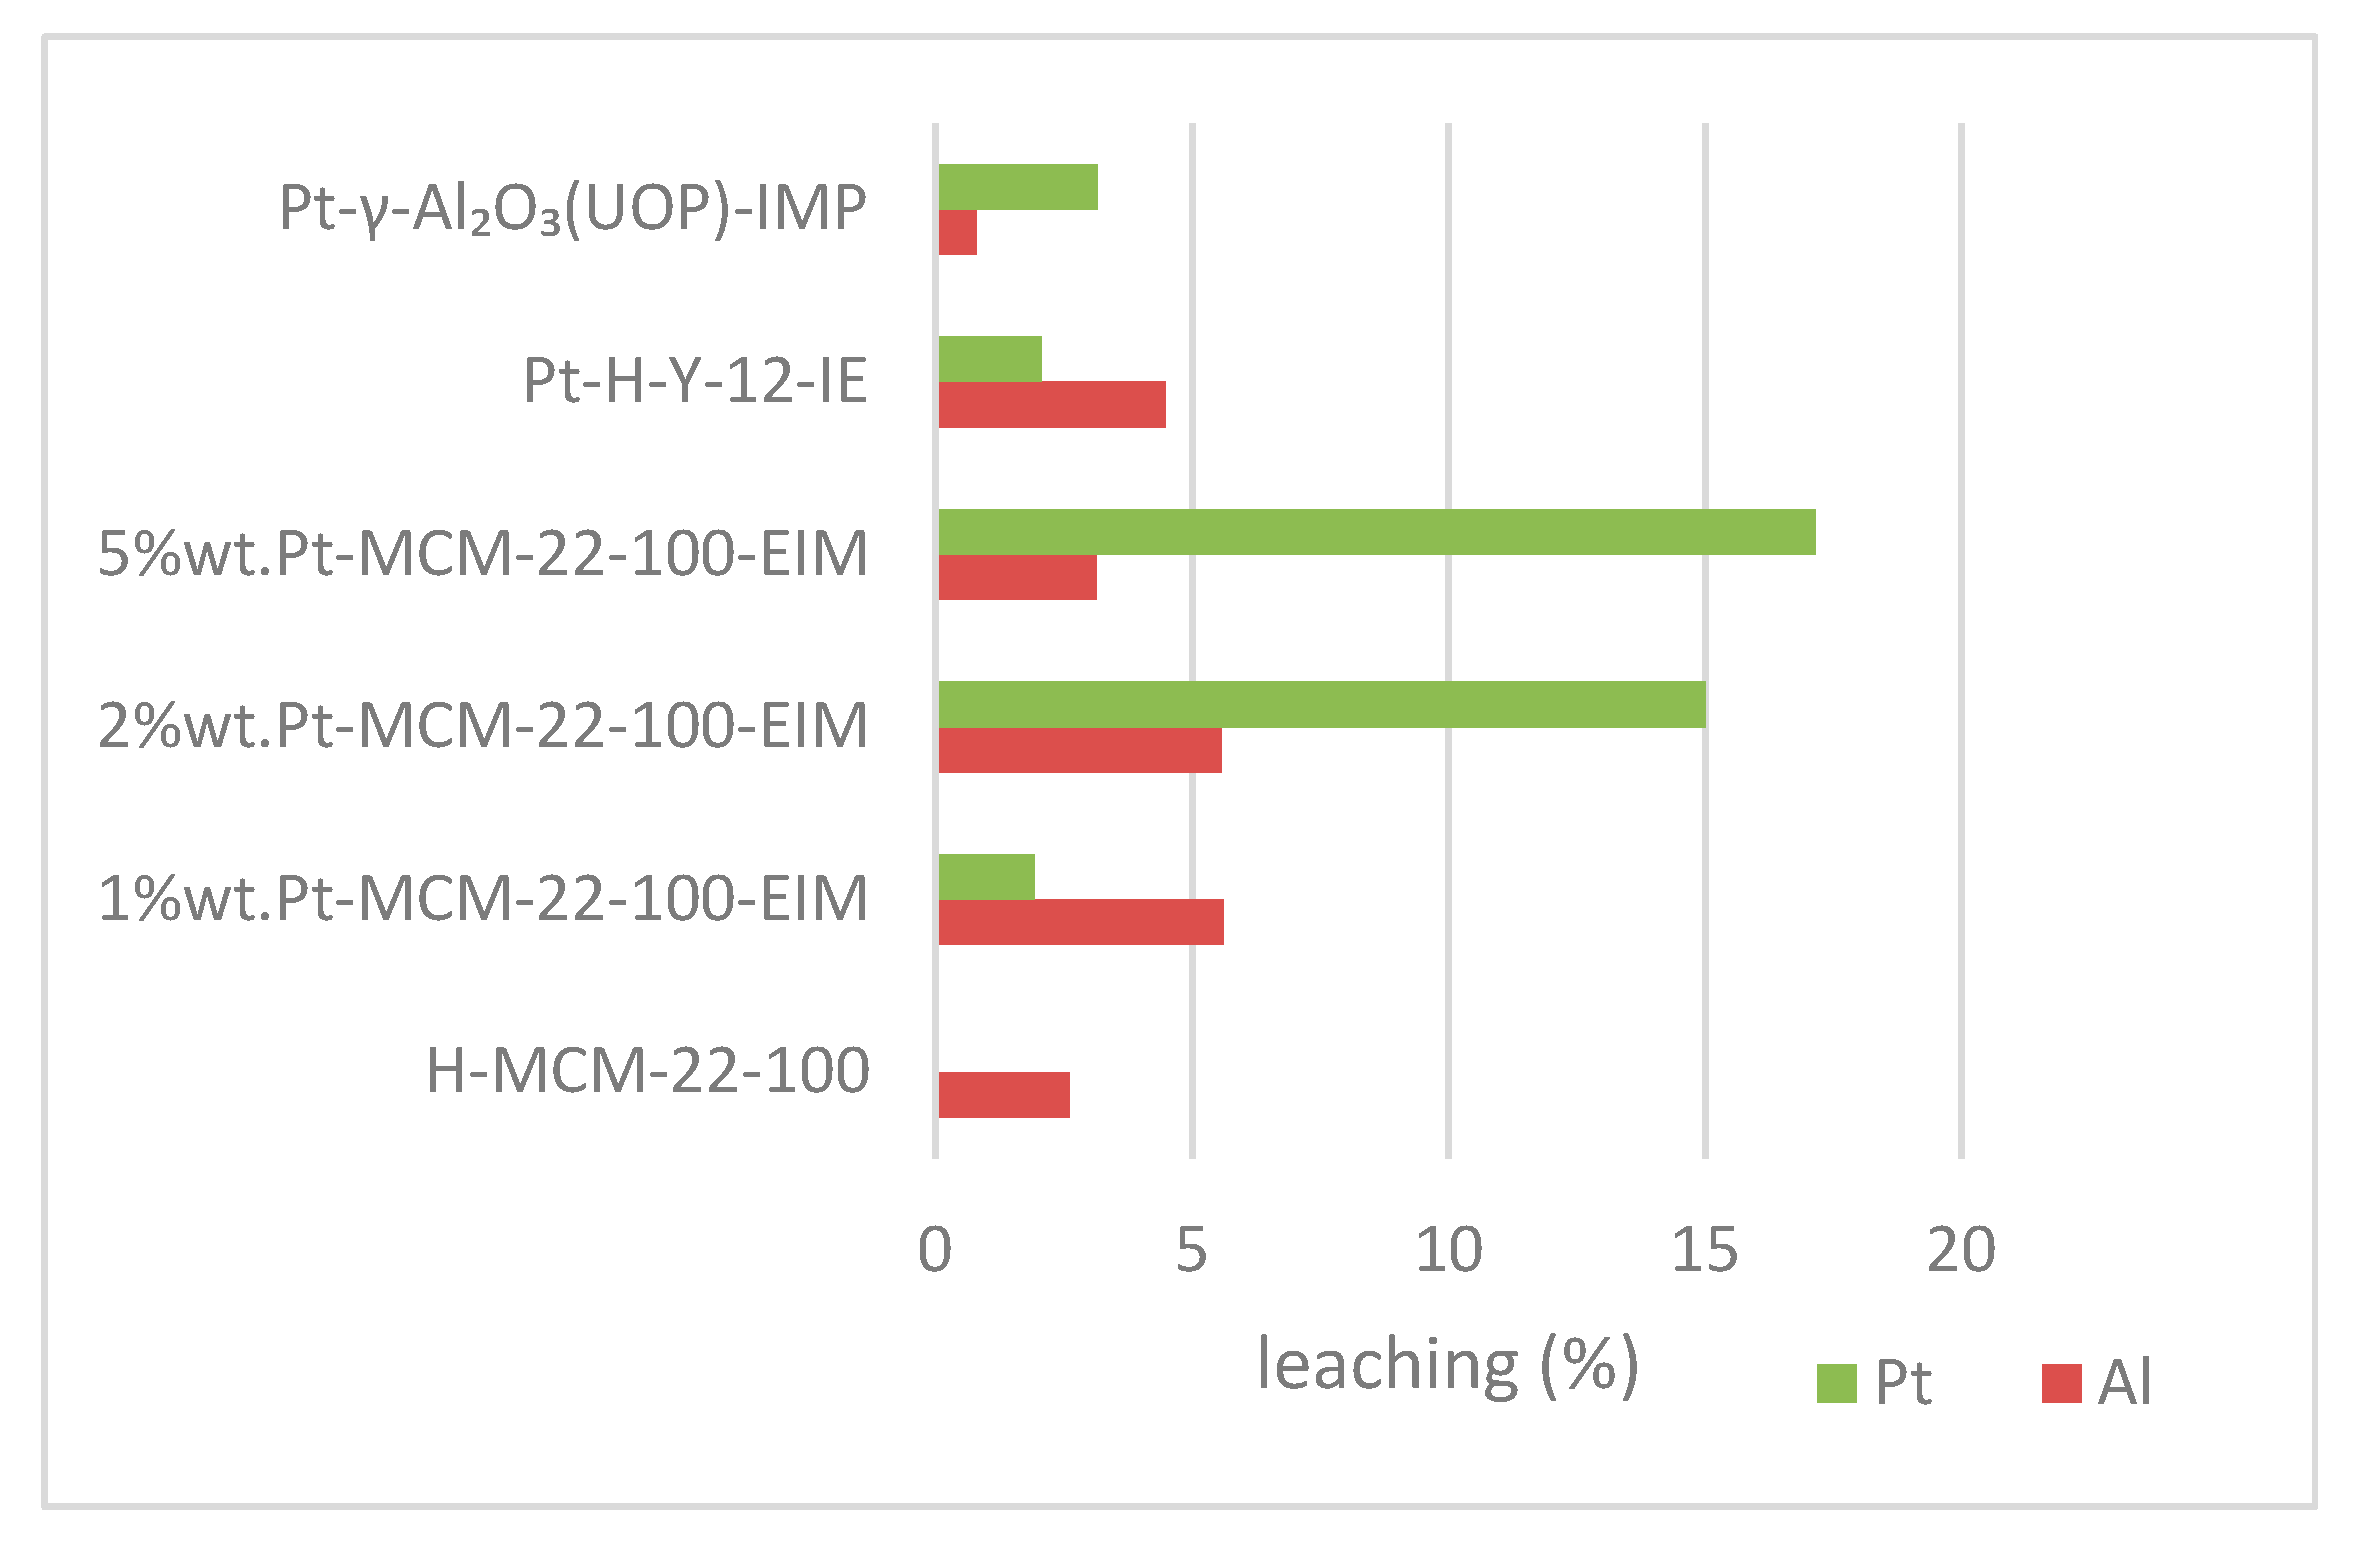
2.2.5. Leaching of Pt and Al in the Reaction Media During the Catalytic Ozonation of Diclofenac

The Al and Pt concentrations were analyzed from the end samples of the catalytic ozonation of DCF (Figure 16). The results from this experiments revealed that 2 wt % Pt-MCM-22-100-EIM and 5 wt % Pt-MCM-22-100-EIM catalysts have the highest leaching of Pt about 15 to 18%, also MCM-22-100 catalysts showed a small amount of Al leaching nearby 5%. Moreover, the Pt-γ-Al2O3-IMP and Pt-H-Y-12-IE catalysts exhibited a small amount of Pt and Al less than 5% in these experiments. Plausible explanations for the Pt and Al leaching during the catalytic ozonation of diclofenac can be attributed to the contents of Pt in the Pt-H-MCM-22-100-EIM, Pt-H-Y-12-EIM and Pt-γ-Al2O3 catalysts. Furthermore, the extent of leaching of Pt can be also attributed to the structure and acidic properties of H-MCM-22-100, H-Y-12 and Al2O3. In general, the leaching of the metals during ozonation for the applied catalysts was quite low.

3. Materials and Methods

3.1. Chemicals

DCF (2-[(2,6-dichlorophenyl)amino]- phenylacetic acid, C14H11Cl2NO2, MW: 296.148 g/mol, CAS number: 15307-86-5, >98% purity) was purchased from Sigma-Aldrich, St. Louis, MO, USA). The water used in the LC-MS analysis was purified using a Millipore Simplicity 185 system (Millipore S.A.S., Molsheim, France). The acetonitrile used in the LC-MS analysis was of LC-MS grade obtained from Fischer scientificTM. Finland, ammonium formate was obtained from Fischer Scientific. Ozone was produced in situ using Nano ozonator. The catalysts used were synthesized by the methods described below.

3.2. Preparation of Pt-Modified H-MCM-22-100, H-Y-12 and γ-Al2O3 Catalysts

Six different heterogeneous catalysts H-MCM-22-100, 1 wt % Pt-MCM-22-100-EIM, 2 wt % Pt-MCM-22-100-EIM, 5 wt % Pt-MCM-22-100-EIM, Pt-H-Y-12-IE and Pt-γ-Al2O3 (UOP)-IMP were synthesized. The Na-MCM-22-100 was synthesized in the laboratory [45]. The Pt-MCM-22-100 modified catalysts were prepared by the evaporation impregnation (EIM) method. The modification of the MCM-22-100 and Pt(NO3)2 solution was carried out in a rotator evaporator at 60 °C for 24 h. After the modification, the Pt-MCM-22-100 catalysts were dried at 100 °C in oven and calcined at 450 °C for 240 min in muffle oven [46]. In addition, the Pt-γ-Al2O3 (UOP)-IMP likewise was prepared by EIM method. Pt-H-Y-12-IE was prepared by solution ion exchange (IE) method, which was carried out in a beaker using an aqueous solution of Pt(NO3)2 and H-Y-12 for 24h. The catalyst was filtered and washed with two liters of distilled water and the Pt-H-Y-12-IE catalyst was dried in an oven at 100 °C. Later, the Pt-H-Y-12-IE catalyst was calcined at 450 °C in a muffle oven for 4.5 h.

3.3. Catalytic Physico-Chemical Characterizations

The crystallinity and structural properties of the catalysts were characterized using a powder X-ray diffraction (XRD) with PANalytical Empyrean diffractometer in Bragg-Brentano mode. The incident X-ray beam was collimated with parallel beam optics consisting of a 1/2 divergence slit, a 10 mm mask, a 0.04 rad Soller, a Göbel mirror and 1 antiscatter slit. On the diffracted side, a 7.5 mm antiscatter slit, a 0.04 rad Soller and a PIXcel3D detector array by 255 × 255 pixels were applied. The Göbel mirror monochromatizes the beam into Cu-Kα1 and Cu-Kα2 lines giving an average wavelength of λ = 1.542 Å. The powder samples were determined on a siliceous zero background sample holder from 5֩ to 100֩ including a step size of 0.026 and counting for 120 s per step. The XRD data was fitted via the Rietveld refinement using the MAUD software [47]. The Pt particle size distributions and structural properties were measured from images obtained with JEM-1400 Plus transmission electron microscope (TEM, model JEM 1400 plus: Jeol Ltd., Tokyo, Japan) by a voltage of 120 kV. The specific surface area and pore volume were measured by nitrogen physisorption using the Sorptomatic 1900 apparatus Carlo Erba Instrument. The fresh catalysts outgassed for 3 h at 150 °C while the catalyst in the ozonation process was outgassed for 3 h at 100 °C. The specific surface areas and pore distribution were interpreted by using the BET: nitrogen physisorption (Carlo Erba Sorptomatic 1900-Fisons Instruments, Milan, Italy) and Dubinin equations. The morphology and crystal size distribution catalysts were studied by a scanning electron microscope Zeiss Leo 1530 Gemini equipped by ThermoNORAN vantage X-ray detector. Energy-dispersive X-ray analysis (EDXA: Zeiss Leo Gemini 1530, oberkochen, Germany) was carried out with the same instrument to analyze the Pt and Al contents of the catalysts.
The amount of Brønsted and Lewis acid sites in the catalysts were determined by FTIR (ATI Mattson Infinity series, Madison, U.S.A) using pyridine as a probe molecules. Molar extinction coefficients from Emeis were used to quantify Brønsted and Lewis acid sites at bands 1545 cm−1 and 1455 cm−1 through pyridine as probe molecule.
X-ray photoelectron spectroscopy (XPS) was used to investigate the oxidation state of Pt. A Kratos Axis Ultra DLD electron spectrometer with monochromated Al K source was operated at 150 W. Analyser pass energy of 160 eV for acquiring wide spectra and a pass energy of 20 eV for individual photoelectron lines were used. The surface potential was stabilized with the spectrometer charge neutralization system and the binding energy (BE) scale was referenced to the C 1s line of aliphatic carbon, set at 285.0 eV. Processing of the spectra was accomplished with the Kratos software. The powder samples were gently hand-pressed into a pellet directly on a sample holder using clean Ni spatula. Energy dispersive X-ray microanalysis was used to determine the chemical compositions of fresh catalytic materials.
The content of metals in the spent catalysts after catalytic ozonation process was determined by inductively coupled plasma optical emission spectroscopy (ICP-OES: PerkinElmer precisely. Selton, USA), using an Optima 5300 DV Perkin Elmer instrument to investigate the potential leaching of Pt and Al.

3.4. Kinetic Experiments

Ozonation experiments were conducted in the presence and absence of heterogeneous catalysts in a double jacket glass reactor having a 1000 mL capacity. The reactor vessel was covered by aluminum foil to prevent photo-degradation. The reactor was connected to an ozone generator (Absolute Ozone, Nano model, Canada), and the gas was continuously dispersed to the liquid by a 7 µm disperser placed on the bottom of the reactor vessel. The kinetic experiments were operating in two phases (gas-liquid) when no catalyst was used, or in three phases (gas, liquid and solid) when a catalyst was used. The gas flow rate in these experiments was 110 mL/min (mixed oxygen 108.5 mL/min and nitrogen 1.5 mL/min) which produced 21 mg/L of ozone in gas phase (determined by iodine volumetric titration). In the liquid phase, 0.03 g of DCF was dissolved in 1000 mL of de-ionized water to provide 30 mg/L of DCF solution. The solid catalyst was, immobilized in a SpinchemTM rotating bed reactor using a 200 µm mesh that allowed the trapping of the catalyst (150–500 µm catalyst particle sizes) inside the stirrer. The stirring rate was 900 rpm to provide a high mass transfer rate between the three phases. Due to a rapid reaction of DCF by ozone, the total reaction time was 10 min and samples were collected at 0, 0.5, 1, 1.5, 2, 3, 4 and 10 min, respectively. The dissolved ozone concentration was 0.44 mg/L, determined by the indigo method. Because this reaction is so rapid compared to ibuprofen degradation described in our earlier study (2018) [46] a much smaller gas flow (110 mL/min) was used and therefore dissolved ozone concentration was only 0.44 mg/L. Even if 30 mg/L of DCF is much higher than ordinarily detected in the aquatic environments using a concentration of 30 mg/L enables to identify and classify the transformed by-products at low concentration level (Figure 17).

3.5. Quantification of DCF

DCF was quantified by using the LC-UV method. The chromatographic separation was performed using an Agilent 1100 binary pump equipped with a vacuum degasser, an autosampler, a thermostated column oven set to 30 °C, a variable wavelength detector, and a Waters Atlantis T3 C18 column 2.1 × 100 mm, 3 μm) with a pre-column made from the same material. The eluents were 0.1% formic acid in water (A) and 0.1% formic acid in acetonitrile (B). Initially the composition was kept at 30% (B) for 2 min, then the composition increased linearly to 95% (B) over 8 min. The eluent composition was held at 95% (B) for 1 min before being returned to the initial conditions over the next 0.1 min and given 8.9 min for equilibration. The gas flow rate was 0.3 mL/min and the injection volume was 30 μL. The detector was set to 254 nm. For quantification, a seven-point calibration curve was prepared in water by diluting the stock solution. The ozonated samples were injected without sample preparation.

3.6. Quantification of 4’-OH-DCF and 5-OH-DCF

For LC-MS/MS analysis of 4’-OH-DCF and 5-OH-DCF, an Agilent 6460 triple quadrupole mass spectrometer equipped with an Agilent Jet Spray electrospray ionization (ESI source was used in full scan and MSn scan modes. Manufacturer: Agilent Technologies, USA) source was used in the multiple reaction monitoring (MRM) mode. Nitrogen was used as the drying, sheath, nebulizer, and collision gas. The drying gas and sheath gas were held at 6 and 12 L/min respectively and the gas flow and sheath gas flow were heated to 180 and 400 °C, respectively. The nebulizer pressure was set to 20 psi. A capillary voltage of 1500 V and a nozzle voltage of 500 V were applied. The cell acceleration voltage was 3 V. The fragmentor voltage and collision energy were optimized for the compounds individually using the Mass Hunter Optimizer software (Table 6). The chromatographic separation was performed using an Agilent 1290 binary pump equipped with a vacuum degasser, an autosampler, a thermostated column oven set to 30 °C, and a Waters xbrigde C18 column (2.1 × 50 mm, 3 μm) with a pre-column made from the same material. The eluents used were 10 mM ammonium formate in water (A) and acetonitrile (B). Initially the composition was held at 10% (B) for 0.5 min, the composition increased linearly to 30% (B) over 2.5 min, followed by a linear increase to 95% (B) over 1 min. The eluent composition was held at 95% (B) for 1 min before being returned to the initial conditions over the next 0.1 min and given 1.4 min for equilibration. The flow rate was 0.4 mL/min and the injection volume was 10 μL. The internal standard method was used for the quantification. The quantification was performed using a ten-point calibration curve prepared in water. An internal standard (100 ng/mL) was added to the calibration samples. The ozonated samples were prepared by adding 50 µL of internal standard solution (1000 ng/mL) to 450 µL of the sample.

4. Conclusions

Pt-modified H-MCM-22-100, H-Y-12 and γ-Al2O3 catalysts were synthesized using evaporation impregnation method. The physico-chemical characterization of the catalytic materials was carried out using several techniques such as XRD, SEM, EDX, TEM, XPS and N2-physisorption. Pt-modified H-MCM-22-100, H-Y-12 and Al2O3 catalysts were observed to be active in the degradation of diclofenac. Furthermore, by-products of diclofenac such as 5-hydroxydiclofenac, 4-hydroxydiclofenac were removed from the aqueous phase using 1 wt % Pt-H-MCM-22-100-EIM, 2 wt % Pt-H-MCM-22-100-EIM, 5 wt % Pt-H-MCM-22-100-EIM, Pt-γ-Al₂O₃ (UOP)-IMP and Pt-H-Y-12-EIM and catalysts. The main selected factors for this work were the concentration of Pt on MCM-22-100 catalyst, concentration of catalysts in ozonation process and different types of Pt-modified catalysts for degradation of DCF. The highest degradation rate of DCF, side products 5-hydroxy diclofenac and 4-hydroxydeclofenac was obtained using 2 wt % Pt-MCM-22-100-EIM catalyst. It was observed that 0.5 g/L and 1 g/L amount of 2 wt % Pt-MCM-22-100-EIM catalyst gives a similar degradation efficiency of DCF and ozonation by-products. Moreover, most of applied catalysts were exhibited low decrease in the surface area and pore volume, which it was expressed that these kinds of catalysts could be used again.

Author Contributions

S.S. catalytic and non-catalytic ozonation experiments, preparation and characterization of catalysts, writing. M.K. analysis and quantification of DCF and by-product. senior scientists and supervisors with the following competences: P.T.: ozonation technology, N.K.: catalyst specialist, K.E.: reactor design, T.S.: chemical kinetics and experimental planning, J.-P.M.: stirrer expert, L.K.: analysis of organic components in aqueous environment, P.E.: organic reaction technology, H.P.: XRD expert, M.P.: TEM expert, A.A.: FTIR expert, A.S.: XPS expert. All authors have read and agreed to the published version of the manuscript.

Funding

This research was funded Centret for internationell mobilitet och internationellt samarbete (CIMO), 4.2.2016. Finnish fondation for technology promotion (TES), 2016. Finnish fondation for technology promotion (TES), 2017.Svenska litteratursällskapet i Finland (SLS), 21.11.2016. graduate school of Åbo Ackademi: Graduate School in Chemical Engineering (GSCE) for 2018 and 2019.

Acknowledgments

This work is part of the activities of the Johan Gadolin Process Chemistry Centre (PCC) at the Åbo Akademi University. The foundation support from Graduate School in Chemical Engineering (GSCE) is gratefully acknowledged (by Soudabeh Saeid). Spinchem AB is acknowledged for providing the Rotating Bed Reactor.

Conflicts of Interest

The authors declare no conflict of interest.

References

  1. Hossain, A.; Nakamichi, S.; Habibullah-Al-Mamun, M.; Tani, K.; Masunaga, S.; Matsuda, H. Occurrence and ecological risk of pharmaceuticals in river surface water of Bangladesh. Environ. Res. 2018, 165, 258–266. [Google Scholar] [CrossRef]
  2. Arias-Marín, L.P.; Boix, C.; Rincón, R.J.; Torres-Palma, R.; Martínez-Pachón, D.; Manrique-Losada, L.; Botero-Coy, A.M.; Castillo, N.; Hernández, F.; Moncayo-Lasso, A. An investigation into the occurrence and removal of pharmaceuticals in Colombian wastewater. Sci. Total Environ. 2018, 642, 842–853. [Google Scholar]
  3. Nizzetto, L.; Klánová, J.; Scheringer, M.; Bharat, G.K.; Whitehead, P.G.; Sharma, B.M.; Bečanová, J.; Sharma, A. Health and ecological risk assessment of emerging contaminants (pharmaceuticals, personal care products, and artificial sweeteners) in surface and groundwater (drinking water) in the Ganges River Basin, India. Sci. Total Environ. 2018, 646, 1459–1467. [Google Scholar]
  4. Sukiman, S.; Nasir, F.A.M.; Hanafi, Z.; Aris, A.Z.; Shaifuddin, S.N.M.; Kamarudin, N.; Praveena, S.M.; Ismail, T.H.T. Pharmaceuticals residues in selected tropical surface water bodies from Selangor (Malaysia): Occurrence and potential risk assessments. Sci. Total Environ. 2018, 642, 230–240. [Google Scholar]
  5. Ebele, A.J.; Abou-Elwafa Abdallah, M.; Harrad, S. Pharmaceuticals and personal care products (PPCPs) in the freshwater aquatic environment. Emerg. Contam. 2017, 3, 1–16. [Google Scholar] [CrossRef]
  6. Fattore, E.; Zuccato, E.; Castiglioni, S.; Davoli, E.; Riva, F. Risk assessment of a mixture of emerging contaminants in surface water in a highly urbanized area in Italy. J. Hazard. Mater. 2018, 361, 103–110. [Google Scholar]
  7. Ahmed, M.J.; Hameed, B.H. Insights into the isotherm and kinetic models for the coadsorption of pharmaceuticals in the absence and presence of metal ions: A review. J. Environ. Manage. 2019, 252, 109617. [Google Scholar] [CrossRef]
  8. Vieno, N.; Sillanpää, M. Fate of diclofenac in municipal wastewater treatment plant—A review. Environ. Int. 2014, 69, 28–39. [Google Scholar] [CrossRef]
  9. Cheikh, D.; García-Villén, F.; Majdoub, H.; Viseras, C.; Zayani, M.B. Chitosan/beidellite nanocomposite as diclofenac carrier. Int. J. Biol. Macromol. 2019, 126, 44–53. [Google Scholar] [CrossRef]
  10. Acuña, V.; Ginebreda, A.; Mor, J.R.; Petrovic, M.; Sabater, S.; Sumpter, J.; Barceló, D. Balancing the health benefits and environmental risks of pharmaceuticals: Diclofenac as an example. Environ. Int. 2015, 85, 327–333. [Google Scholar] [CrossRef]
  11. Scheurell, M.; Franke, S.; Shah, R.M.; Hühnerfuss, H. Occurrence of diclofenac and its metabolites in surface water and effluent samples from Karachi, Pakistan. Chemosphere 2009, 77, 870–876. [Google Scholar] [CrossRef] [PubMed]
  12. Meierjohann, A.; Brozinski, J.M.; Kronberg, L. Seasonal variation of pharmaceutical concentrations in a river/lake system in Eastern Finland. Environ. Sci. Process. Impacts 2016, 18, 342–349. [Google Scholar] [CrossRef] [PubMed]
  13. Hoeger, B.; Köllne, B.; Dietrich, D.R.; Hitzfeld, B. Water-borne diclofenac affects kidney and gill integrity and selected immune parameters in brown trout (Salmo trutta f. fario). Aquat. Toxicol. 2005, 75, 53–64. [Google Scholar] [CrossRef] [PubMed] [Green Version]
  14. Bonnefille, B.; Gomez, E.; Courant, F.; Escande, A.; Fenet, H. Diclofenac in the marine environment: A review of its occurrence and effects. Mar. Pollut. Bull. 2018, 131, 496–506. [Google Scholar] [CrossRef]
  15. Lee, J.; Ji, K.; Lim Kho, Y.; Kim, P.; Choi, K. Chronic exposure to diclofenac on two freshwater cladocerans and Japanese medaka. Ecotoxicol. Environ. Saf. 2011, 74, 1216–1225. [Google Scholar] [CrossRef]
  16. Näslund, J.; Fick, J.; Asker, N.; Ekman, E.; Larsson, D.G.J.; Norrgren, L. Diclofenac affects kidney histology in the three-spined stickleback (Gasterosteus aculeatus) at low Μg/L concentrations. Aquat. Toxicol. 2017, 189, 87–96. [Google Scholar] [CrossRef]
  17. Fatta-Kassinos, D.; Hapeshi, E.; Achilleos, A.; Meric, S.; Gros, M.; Petrovic, M.; Barcelo, D. Existence of Pharmaceutical Compounds in Tertiary Treated Urban Wastewater that is Utilized for Reuse Applications. Water Resour. Manag. 2011, 25, 1183–1193. [Google Scholar] [CrossRef]
  18. Gros, M.; Petrović, M.; Ginebreda, A.; Barceló, D. Removal of pharmaceuticals during wastewater treatment and environmental risk assessment using hazard indexes. Environ. Int. 2010, 36, 15–26. [Google Scholar] [CrossRef] [PubMed]
  19. Rivera-Utrilla, J.; Sánchez-Polo, M.; Ángeles Ferro-García, M.; Prados-Joya, G.; Ocampo-Pérez, R. Pharmaceuticals as emerging contaminants and their removal from water. A review. Chemosphere 2013, 93, 1268–1287. [Google Scholar] [CrossRef]
  20. Lonappan, L.; Brar, S.K.; Das, R.K.; Verma, M.; Surampalli, R.Y. Diclofenac and its transformation products: Environmental occurrence and toxicity—A review. Environ. Int. 2016, 96, 127–138. [Google Scholar] [CrossRef] [Green Version]
  21. Oral, O.; Kantar, C. Diclofenac removal by pyrite-Fenton process: Performance in batch and fixed-bed continuous flow systems. Sci. Total Environ. 2019, 664, 817–823. [Google Scholar] [CrossRef] [PubMed]
  22. Turk Sekulic, M.; Boskovic, N.; Slavkovic, A.; Garunovic, J.; Kolakovic, S.; Pap, S. Surface functionalised adsorbent for emerging pharmaceutical removal: Adsorption performance and mechanisms. Process. Saf. Environ. Prot. 2019, 125, 50–63. [Google Scholar] [CrossRef]
  23. Peake, B.M.; Braund, R.; Tong, A.Y.C.; Tremblay, L.A. Degradation of Pharmaceuticals in Wastewater; Elsevier Ltd.: Amsterdam, The Netherlands, 2016. [Google Scholar]
  24. Ghemit, R.; Makhloufi, A.; Djebri, N.; Flilissa, A.; Zerroual, L.; Boutahala, M. Adsorptive removal of diclofenac and ibuprofen from aqueous solution by organobentonites: Study in single and binary systems. Groundw. Sustain. Dev. 2019, 8, 520–529. [Google Scholar] [CrossRef]
  25. Li, W.; Yu, R.; Li, M.; Guo, N.; Yu, H.; Yu, Y. Photocatalytical degradation of diclofenac by Ag-BiOI-rGO: Kinetics, mechanisms and pathways. Chemosphere 2019, 218, 966–973. [Google Scholar] [CrossRef]
  26. Facey, S.J.; Nebel, B.A.; Kontny, L.; Allgaier, M.; Hauer, B. Rapid and complete degradation of diclofenac by native soil microorganisms. Environ. Technol. Innov. 2018, 10, 55–61. [Google Scholar] [CrossRef]
  27. Hansen, K.M.S.; Spiliotopoulou, A.; Chhetri, R.K.; Escolà Casas, M.; Bester, K.; Andersen, H.R. Ozonation for source treatment of pharmaceuticals in hospital wastewater—Ozone lifetime and required ozone dose. Chem. Eng. J. 2016, 290, 507–514. [Google Scholar] [CrossRef] [Green Version]
  28. Moreira, N.F.F.; Orge, C.A.; Ribeiro, A.R.; Faria, J.L.; Nunes, O.C.; Pereira, M.F.R.; Silva, A.M.T. Fast mineralization and detoxification of amoxicillin and diclofenac by photocatalytic ozonation and application to an urban wastewater. Water Res. 2015, 87, 87–96. [Google Scholar] [CrossRef]
  29. Shang, N.C.; Yu, Y.H.; Ma, H.W.; Chang, C.H.; Liou, M.L. Toxicity measurements in aqueous solution during ozonation of mono-chlorophenols. J. Environ. Manag. 2006, 78, 216–222. [Google Scholar] [CrossRef] [PubMed]
  30. Coelho, A.D.; Sans, C.; Agüera, A.; Gómez, M.J.; Esplugas, S.; Dezotti, M. Effects of ozone pre-treatment on diclofenac: Intermediates, biodegradability and toxicity assessment. Sci. Total Environ. 2009, 407, 3572–3578. [Google Scholar] [CrossRef]
  31. Orge, C.A.; Órfão, J.J.M.; Pereira, M.F.R. Catalytic ozonation of organic pollutants in the presence of cerium oxide-carbon composites. Appl. Catal. B Environ. 2011, 102, 539–546. [Google Scholar] [CrossRef]
  32. Aguinaco, A.; Beltrán, F.J.; García-Araya, J.F.; Oropesa, A. Photocatalytic ozonation to remove the pharmaceutical diclofenac from water: Influence of variables. Chem. Eng. J. 2012, 189–190, 275–282. [Google Scholar] [CrossRef]
  33. Xiao, H.; Wu, J.; Wang, X.; Wang, J.; Mo, S.; Fu, M.; Chen, L.; Ye, D. Ozone-enhanced deep catalytic oxidation of toluene over a platinum-ceria-supported BEA zeolite catalyst. Mol. Catal. 2018, 460, 7–15. [Google Scholar] [CrossRef]
  34. Ziylan-Yavaş, A.; Ince, N.H. Catalytic ozonation of paracetamol using commercial and Pt-supported nanocomposites of Al2O3: The impact of ultrasound. Ultrason. Sonochem. 2018, 40, 175–182. [Google Scholar] [CrossRef] [PubMed]
  35. Camblor, M.A.; Corma, A.; Díaz-Cabañas, M.-J.; Baerlocher, C. Synthesis and Structural Characterization of MWW Type Zeolite ITQ-1, the Pure Silica Analog of MCM-22 and SSZ-25. J. Phys. Chem. B 2002, 102, 44–51. [Google Scholar] [CrossRef]
  36. Colligan, M.; Forster, P.M.; Cheetham, A.K.; Lee, Y.; Vogt, T.; Hriljac, J.A.; York, N. Synchrotron X-ray powder diffraction and computational investigation of purely siliceous zeolite Y under pressure. J. Am. Chem. Soc. 2004, 126, 12015–12022. [Google Scholar] [CrossRef]
  37. Paglia, G.; Buckley, C.E.; Rohl, A.L.; Hunter, B.A.; Hart, R.D.; Hanna, J.V.; Byrne, L.T. Tetragonal structure model for boehmite-derived γ-alumina. Am. Phys. Soc. 2003, 68, 144110. [Google Scholar] [CrossRef]
  38. Shyu, J.Z.; OTTO, K. Identification of platinum phases on γ-alumina by XPS. Appl. Surf. Sci. 1988, 32, 246–252. [Google Scholar] [CrossRef]
  39. Bouwman, R.; Biloen, P. Valence state and interaction of platinum and germanium on investigated by X-ray photoelectron spectroscopy. J. Catal. 1977, 48, 209–216. [Google Scholar] [CrossRef]
  40. Chen, C.; Chen, Y.; Yoza, B.A.; Du, Y.; Wang, Y.; Li, Q.X.; Yi, L.; Guo, S.; Wang, Q. Comparison of efficiencies and mechanisms of catalytic ozonation of recalcitrant petroleum refinery wastewater by Ce, Mg, and Ce-Mg oxides loaded Al2O3. Catalysts 2017, 7, 72. [Google Scholar] [CrossRef] [Green Version]
  41. Monteagudo, J.M.; El-taliawy, H.; Durán, A.; Caro, G.; Bester, K. Sono-activated persulfate oxidation of diclofenac: Degradation, kinetics, pathway and contribution of the different radicals involved. J. Hazard. Mater. 2018, 357, 457–465. [Google Scholar] [CrossRef]
  42. Li, X.; Chen, W.; Tang, Y.; Li, L. Relationship between the structure of Fe-MCM-48 and its activity in catalytic ozonation for diclofenac mineralization. Chemosphere 2018, 206, 615–621. [Google Scholar] [CrossRef] [PubMed]
  43. Chen, W.; Li, X.; Pan, Z.; Ma, S.; Li, L. Effective mineralization of Diclofenac by catalytic ozonation using Fe-MCM-41 catalyst. Chem. Eng. J. 2016, 304, 594–601. [Google Scholar] [CrossRef]
  44. Gottschalk, C.; Libra, J.A.; Saupe, A. Ozonation of Water and Waste Water; WILEY-VCH: Hoboken, NJ, USA, 2010. [Google Scholar]
  45. Maduna, K.; Kumar, N.; Murzin, D.Y. Influence of SI/AL ratios on the properties of copper bearing zeolites with different framework types. Tech. J. 2017, 6168, 96–100. [Google Scholar]
  46. Saeid, S.; Tolvanen, P.; Kumar, N.; Eränen, K.; Peltonen, J.; Peurla, M.; Mikkola, J.P.; Franz, A.; Salmi, T. Advanced oxidation process for the removal of ibuprofen from aqueous solution: A non-catalytic and catalytic ozonation study in a semi-batch reactor. Appl. Catal. B Environ. 2018, 230, 77–90. [Google Scholar] [CrossRef]
  47. Lutterotti, L.; Matthies, S.; Wenk, H.R.; Schultz, A.S.; Richardson, J.W. Combined texture and structure analysis of deformed limestone from time-of-flight neutron diffraction spectra. J. Appl. Phys. 1997, 81, 594–600. [Google Scholar] [CrossRef]
Figure 1. Structural formula of diclofenac (DCF).
Catalysts 10 00322 g001
Figure 2. X-ray powder diffraction patterns of H-MCM-22-100, 1 wt % Pt-MCM-22-100-EIM, 2 wt % Pt-MCM-22-100-EIM, 5 wt % Pt-MCM-22-100-EIM (a,b), Pt-H-Y-12-IE (c) and Pt-γ-Al₂O₃ (UOP)-IMP (d) catalysts.
Catalysts 10 00322 g002
Figure 3. Transmission electron microscope (TEM) images and Pt particle size distribution histograms of (a) H-MCM-22-100, (b) 1 wt % Pt-MCM-22-100-EIM, (c) 2% nwt Pt-MCM-22-100-EIM, (d) 5% nwt Pt-MCM-22-100-EIM, (e) Pt-H-Y-12-IE, and (f) Pt-γ-Al₂O₃ (UOP)-IMP.
Catalysts 10 00322 g003aCatalysts 10 00322 g003b
Figure 4. SEM images and crystal size distribution histograms of (a) H-MCM-22-100, (b) 1 wt % Pt-MCM-22-100-EIM, (c) 2 wt % Pt-MCM-22-100-EIM, (d) 5 wt % Pt-MCM-22-100-EIM, (e) Pt-H-Y-12-IE and (f) Pt-γ-Al₂O₃ (UOP)-IMP catalysts.
Catalysts 10 00322 g004aCatalysts 10 00322 g004b
Figure 5. XPS spectra of (a) H-MCM-22-100, (b) 1 wt % Pt-MCM-22-100, (c) 2 wt % Pt-MCM-22-100, (d) 5 wt % Pt-MCM-22-100, (e) Pt-H-Y-12-IE and (f) Pt-γ-Al₂O₃ (UOP)-IMP catalysts.
Catalysts 10 00322 g005aCatalysts 10 00322 g005bCatalysts 10 00322 g005c
Figure 6. DCF degradation by ozonation and H-MCM-22-100, 1 wt % Pt-MCM-22-100-EIM, 2 wt % Pt-MCM-22-100-EIM and 5 wt % Pt-MCM-22-100-EIM catalysts. CDCF = 30 mg/L, gas flow rate = 110 mL/min, T = 20 °C, stirring speed = 900 rpm, CO3, g = 21 mg/L, C catalysts = 0.5 g/L.
Catalysts 10 00322 g006
Figure 7. (a) DCF degradation by ozonation without, and with 0.25, 0.50 and 1.00 g of 2 wt % Pt-MCM-22–100 catalyst, (b) Normalized. CDCF = 30 mg/L, gas flow rate = 110 mL/min, T = 20 °C, stirring speed = 900 rpm, CO3, g = 21 mg/L.
Catalysts 10 00322 g007
Figure 8. DCF degradation by ozonation and 2 wt % Pt-MCM-22-100-EIM, Pt-γ-Al₂O₃ (UOP)-IMP and Pt-H-Y-12-IE catalysts. CDCF = 30 mg/L, gas flow rate = 110 mL/min, T = 20 °C, stirring speed = 900 rpm, CO3, g = 21 mg/L, C catalysts = 0.5 g/L.
Catalysts 10 00322 g008
Figure 9. DCF and its major hydroxylation products.
Catalysts 10 00322 g009
Figure 10. 5-OH-DCF concentration during the decomposition of DCF by catalytic and non-catalytic ozonation. CDCF = 30 mg/L, gas flow rate = 110 mL/min, T = 20 °C, stirring speed = 900 rpm, CO3, g = 21 mg/L, C catalysts = 0.5 g/L.
Catalysts 10 00322 g010
Figure 11. 5-OH-DCF concentration during the ozonation of DCF using different amount of 2 wt % Pt-MCM-22-100-EIM catalyst (0.25, 0.50 and 1.00 g/L). CDCF = 30 mg/L, gas flow rate = 110 mL/min, T= 20 °C, stirring speed = 900 rpm, CO3, g = 21 mg/L.
Catalysts 10 00322 g011
Figure 12. 5-OH-DCF concentration during the decomposition of DCF by catalytic and non-catalytic ozonation. CDCF = 30 mg/L, gas flow rate = 110 mL/min, T = 20 °C, stirring speed = 900 rpm, CO3, g = 21 mg/L, C catalysts = 0.5 g/L.
Catalysts 10 00322 g012
Figure 13. 4´OH-DCF concentration during the decomposition of DCF by catalytic and non-catalytic ozonation. CDCF = 30 mg/L, gas flow rate = 110 mL/min, T = 20 °C, stirring speed = 900 rpm, CO3, g = 21 mg/L, C catalysts = 0.5 g/L.
Catalysts 10 00322 g013
Figure 14. 4’OH-DCF concentration during the ozonation of DCF using different amount of 2 wt % Pt-MCM-22-100 catalyst (0.25, 0.50 and 1.00 g). CDCF = 30 mg/L, gas flow rate = 110 mL/min, T = 20 °C, stirring speed = 900 rpm, CO3, g = 21 mg/L.
Catalysts 10 00322 g014
Figure 15. 4’OH-DCF concentration during the decomposition of DCF by catalytic and non-catalytic ozonation. CDCF = 30 mg/L, gas flow rate = 110 mL/min, T = 20 °C, stirring speed = 900 rpm, CO3, g = 21 mg/L, C catalysts = 0.5 g/L.
Catalysts 10 00322 g015
Figure 16. Leaching of aluminum and Platinum (%) in the catalytic ozonation of DCF at 20 °C.
Catalysts 10 00322 g016
Figure 17. Schematic view of the semi-batch reactor system for the ozonation of DCF.
Catalysts 10 00322 g017
Table 1. The Rietveld refinement results for the H-MCM-22-100, 1 wt % Pt-MCM-22-100-EIM, 2 wt % Pt-MCM-22-100-EIM, 5 wt % Pt-MCM-22-100-EIM Pt-H-Y-12-IE and Pt-γ-Al₂O₃ (UOP)-IMP catalysts.
SamplePhasePhase Fraction (wt %)α (A֩)ⅽ (A֩)Crystal Size (nm)
H-MCM-22-100MWW80–9014.252529
1 wt % Pt-MCM-22-100-EIMMWW
Si
96.1
3.9
14.27
5.4
25
19
2 wt % Pt-MCM-22-100-EIMMWW>9914.252520
5 wt % Pt-MCM-22-100-EIMMWW>9914.232522
Pt-H-Y-12-IEFAU
Pt (fcc)
98.4(3)
1.6(3)
24.341(1)
3.925(1)
-66
30
Pt-γ-Al₂O₃ (UOP)-IMPγ-Al₂O₃-5.678(3)7.866(4)4.6
Table 2. Pt particle size average of 1 wt % Pt-MCM-22-100, 2 wt % Pt-MCM-22-100, 5 wt % Pt-MCM-22-100-EIM, Pt-H-Y-12-IE and Pt-γ-Al₂O₃ (UOP)-IMP catalysts.
EntryCatalystAverage Pt Particle Size Distribution (nm)
11 wt % Pt-MCM-22-100-EIM24.9
22 wt % Pt-MCM-22-100-EIM8.1
35 wt % Pt-MCM-22-100-EIM2.7
4Pt-H-Y-12-IE30.6
5Pt-γ-Al2O3 (UOP)-IMP9.5
Table 3. Specific surface area and pore volume of the catalysts used in the ozonation experiments.
EntryCatalystSpecific Surface Area (m2/g)Specific Pore Volume (cm3/g)
FreshSpentFreshSpent
1H-MCM-22-1005384310.1910.153
21 wt % Pt-MCM-22-100-EIM7084930.2510.175
32 wt % Pt-MCM-22-100-EIM6314640.2240.165
45 wt % Pt-MCM-22-100-EIM6524680.2310.166
5Pt-H-Y-12-IE8357670.2960.275
6Pt-γ-Al2O3 (UOP)-IMP2381890.7670.493
Table 4. Average crystal size and Pt concentration of H-MCM-22-100, 1 wt % Pt-MCM-22-100, 2 wt % Pt-MCM-22-100, 5 wt % Pt-MCM-22-100-EIM, Pt-H-Y-12-IE and Pt-γ-Al₂O₃ (UOP)-IMP catalysts.
EntryCatalystAverage Crystal Size (nm)Pt Concentration (wt %)
1H-MCM-22-100386.20-
21 wt % Pt-MCM-22-100-EIM169.670.63
32 wt % Pt-MCM-22-100-EIM193.511.60
45 wt % Pt-MCM-22-100-EIM396.796.81
5Pt-H-Y-12-IE493.963.65
6Pt-γ-Al2O3 (UOP)-IMP116.167.13
Table 5. Brønsted and Lewis acidities of proton and Pt modified zeolites.
CatalystsBrønsted Acidity (µmol/g)Lewis Acidity (µmol/g)
250 °C350 °C450 °C250 °C350 °C450 °C
H-MCM-22-1003367201310
1 wt % Pt-MCM-22-100-EIM11140300
2 wt % Pt-MCM-22-100-EIM8630500
5 wt % Pt-MCM-22-100-EIM62021011
Pt-H-Y-12-IE145601130
Pt-γ-Al2O3 (UOP)-IMP63112392
Table 6. Mass spectrometric parameters for DCF transformation products.
CompoundPrecursor IonProduct IonFragmentor (V)Collision Energy (V)
5-OH-DCF3102661004
-2301004
-166.110024
4’-OH-DCF310266804
-222.18012
-179.98012
-35.18020
4’-OH-DCF-d43142341050

