In Situ Spectroscopic Methods for Electrocatalytic CO2 Reduction


1
Institute of Fundamental and Frontier Sciences, University of Electronic Science and Technology of China, Chengdu 610054, China
2
Department of Chemical Engineering, McGill University, 3610 University Street, Montreal, QC H3A 0C5, Canada
*
Author to whom correspondence should be addressed.
Catalysts 2020, 10(5), 481; https://0-doi-org.brum.beds.ac.uk/10.3390/catal10050481
Submission received: 13 April 2020
/
Revised: 22 April 2020
/
Accepted: 27 April 2020
/
Published: 28 April 2020
(This article belongs to the Special Issue Spectroscopy in Catalysis)
Abstract
:Electrochemical reduction of CO2 to value-added chemicals and fuels is a promising approach to store renewable energy while closing the anthropogenic carbon cycle. Despite significant advances in developing new electrocatalysts, this system still lacks enough energy conversion efficiency to become a viable technology for industrial applications. To develop an active and selective electrocatalyst and engineer the reaction environment to achieve high energy conversion efficiency, we need to improve our knowledge of the reaction mechanism and material structure under reaction conditions. In situ spectroscopies are among the most powerful tools which enable measurements of the system under real conditions. These methods provide information about reaction intermediates and possible reaction pathways, electrocatalyst structure and active sites, as well as the effect of the reaction environment on products distribution. This review aims to highlight the utilization of in situ spectroscopic methods that enhance our understanding of the CO2 reduction reaction. Infrared, Raman, X-ray absorption, X-ray photoelectron, and mass spectroscopies are discussed here. The critical challenges associated with current state-of-the-art systems are identified and insights on emerging prospects are discussed.
1. Introduction
The increasing concentration of atmospheric carbon dioxide (CO2) is believed to contribute to the anthropogenic climate change [1,2]. In response, considerable efforts have been devoted toward reducing the CO2, among which, electrochemical (EC) CO2 reduction reaction (CO2RR) presents promising potential, for it can produce value-added chemicals from CO2 to address the energy crisis while mitigating CO2 emission [3,4,5,6,7]. Unlike water splitting where H2 and O2 are single products in cathode and anode of the electrochemical cell, the process of CO2RR is more complicated because different possible reaction intermediates/products are formed by multiple protons (H+) /electrons (e–) transfer processes after the adsorption of CO2 (*CO2, * denotes the surface-coordinated state of the ligand) [4,8,9]. Figure 1a depicts the representative possible reaction pathways. Moreover, CO2 is so inactive that the CO2RR is quite unfavorable thermodynamically. Therefore, the application of CO2RR in the industrial scale requires high activity and selectivity toward valuable products, which is often determined by [10,11,12,13]: (i) structure and composition of the electrode surface, (ii) the catalytic chemical transformations at the interfaces between the solid electrode and liquid electrolyte or gaseous reactants, and (iii) the nature of the electrolyte components.
Measurement of electrochemical properties, such as Tafel slope, can provide models for reaction kinetics and mechanisms [14], however, these models are mostly too macroscopic and provide indirect and incomplete information of the microscopic reaction mechanism. Theoretical quantum mechanics calculations, such as density functional theory (DFT), have been shown to correlate well with experimental results on simple and well-ordered catalytic systems. However, utilizing DFT to get information for less ordered catalysts and complicated reactions with multiple steps, is very challenging [15]. Ex situ (i.e., off-site) spectroscopic measurements are commonly employed for pre- and post-chemical states of electrocatalysts in a specific electrochemical reaction to deduce the possible active sites and stability. Electrochemical activation or exposure of samples to air during chamber-to-chamber transportation, however, introduces contamination and undesired surface functional groups to the surface of the electrocatalyst, thereby disturbing the interpretation of spectroscopic fingerprints. To overcome these shortcomings and accurately picture the physical and chemical processes, and to further develop efficient electrocatalysts for CO2RR with high performance and durability, we need to take advantage of additional characterization tools.
In situ (i.e., on-site) spectroscopies study catalytic systems under reaction conditions and provide in-depth insights into the nature of active sites and reaction mechanisms [16,17,18,19]. In situ spectroscopic techniques have been applied on CO2RR systems with the goal of addressing five key issues [5]: (1) capturing and identifying reaction intermediates; (2) identifying active sites; (3) determining preferred reaction pathways; (4) clarifying the role of reaction environment; and (5) investigating the state changes of catalysts under reaction condition. The insights gained here sharpens our understanding of the electrocatalytic CO2RR system and enables rational design of efficient electrocatalysts and electrolytes for this reaction. For instance, combining operando X-ray absorption spectroscopy (XAS) and quasi in situ X-ray photoelectron spectroscopy (XPS), enabled providing a correlation between the electrocatalyst’s structure and multi-carbon hydrocarbon (C2+) production [20,21,22]. This finding further paved the way for designing a Cu catalyst with improved C2+ selectivity and production rate [23]. Numerous reports have theoretically proposed various possible reaction pathways and active sites for specific CO2RR products, whereas they all lack experimental verification under operando reaction conditions. Massive efforts have been made in recent years to develop in situ spectroscopies to be compatible with CO2RR [20,21,22,24,25,26,27,28,29,30]. However, each of the presented techniques has its own specific potentials and limitations to reveal details on the active electrocatalyst surface.
Although there are several excellent reviews on spectroscopic methods, to the best of our knowledge, this review is the first of its kind which summarizes the in situ spectroscopies for the CO2RR. In this perspective, we highlight the significant in situ spectroscopies applicable for electrochemical CO2RR and how they can assist to address key issues described above. Remarkable cases, including in situ infrared spectroscopy (IR), Raman spectroscopy (RS), XAS, XPS, and mass spectrometry (MS) are summarized. The advantages, limitations, and applications of these characterizations are analyzed. Additionally, challenges and future directions for developing in situ techniques in the electrochemical CO2RR are discussed to provide fresh insights into the development of CO2RR.
2. In Situ Spectroscopic Techniques
In situ spectroscopy requires measuring the properties of a system continuously under practical working conditions. The challenge, however, is to propose a strategy that allows CO2RR to occur while satisfying the measurement conditions. The most convenient in situ characterization techniques applied in CO2RR, are IR and RS, as the wavelength range is relevant to the vibration frequency of the adsorbed intermediates in this reaction. However, these optical-based techniques are limited in probing catalyst surfaces. With the development of third-generation synchrotron radiation sources, in situ X-ray techniques, such as XAS and high-resolution XPS, can be the complements by offering element-, state-, coordination- sensitive probing capabilities. In addition, to realize in-depth understanding of the underlying CO2RR mechanism, direct identification of reaction intermediates/products is crucial. In this regard, MS has been used for qualitative identification of unknown compounds and quantitative analysis of the amount of known compounds. An illustration of these relevant in situ spectroscopies applicable for CO2RR, along with their known lateral resolution and atomic detection limit range, is shown in Figure 1b. Individually, they can capture the information of the structural, physical, and chemical properties of materials to address the key issues discussed above.
2.1. Infrared Spectroscopy (IR)
IR spectroscopy exploits the specific absorption of molecular vibrations at resonant frequencies of IR radiation [31], which could be used to in situ monitor functional groups, molecular symmetry, as well as the interaction between a catalyst and molecules in solution [32]. The first application of in situ IR in the electrode/electrolyte interface goes back to the 1970 s [33]. In recent years, extensive applications of IR spectroscopy were witnessed in exploring various interfacial phenomena in electrochemical CO2RR, which features the low cost, facile optical design and operation, simple surface selection rule, and broad applicability to electrodes [34]. Four major configurations are accessible to in situ IR spectroscopy measurement: transmission [35], diffuse reflectance (DRIFTS) [36], reflection-absorption (RAS-IR), and attenuated total reflection (ATR-IR). Osawa and co-workers combined ATR-IR geometry with surface-enhancement of the IR absorption (SEIRA) [37,38,39,40]. The CO2RR process is based on catalytic chemical transformations at the interface of electrode and electrolyte. To minimize the light absorption by the electrolyte, the path length of IR light needs to be reduced. RAS-IR (external reflection) and ATR-IR modes (internal reflection), which are both suitable for flat model surfaces [41] and characterization of solid/gas and solid/liquid interfaces [42], are more frequently used to minimize the path length of the IR light. In RAS-IR (Figure 2a), the beam passes through an IR-transparent window and crosses a thin electrolyte layer before being reflected from the electrode surface. RAS-IR allows the measurement of a wide range of materials and distinguishes gas-phase and adsorbed species [43,44,45]. However, RAS-IR is restricted by its weak signal and the test requirement of a very thin electrolyte layer (<100 μm) [46]. This latter restriction often introduces a high concentration gradient at the electrode surface which complicates spectroscopic measurements, especially for gas-evolving reactions. Conversely, ATR-IR (Figure 2b) overcomes these problems [40,47,48,49] by utilizing a metal thin film deposited on an IR-transparent material with a high refractive index as the working electrode. When the incident IR beam is positioned near the critical angle of the specially constructed ATR crystal, an evanescent wave is formed above the crystal that interacts with the adsorbed molecules (internal reflection phenomenon). This minimizes the electrolyte layer interference with high surface sensitivity, free mass transport, and insusceptibility to gas evolution [34]. Notably, in the surface-enhanced ATR-IR absorption spectroscopy (ATR-SEIRAS) [40,50], molecules reside on the thin metallic layer deposited on various ATR prisms (e.g., Si and ZnSe), and the absorption signal enhances tens of times due to electromagnetic field resonance from the surface enhancement effect [40].
IR spectroscopy is particularly vital for the direct observation of intermediate species of CO2RR [19,51,52,53,54,55]. Notably, the adsorption configuration of certain reaction intermediates could be identified through IR, which would be otherwise very difficult to detect through electrochemical techniques. Molecules and species such as CO, CO2, CO32−, HCOO−, COO−, and further-reduced products (such as CH4, CH2CH2) typically exhibit molecule-specific and highly IR active vibrational modes that allow for their monitoring during the CO2RR electrocatalysis. For instance, intense vibrations at 1288, 1386, and 1660 cm−1 were observed on a silver electrocatalyst over a potential range of −1.4 to −1.6 V (vs. Ag/AgCl) in 0.1 M KCl electrolyte, which have been assigned to C-OH, C-O, and C=O stretches of an adsorbed, carbon-bound *COOH intermediate [56]. Unlike Au and Ag that primarily generate CO, among various reaction intermediates on Cu electrocatalyst [39,57], chemisorbed CO (*CO) is the most frequently reported intermediate due to the high IR absorption cross-section of the C-O bond [58,59,60,61,62,63,64]. The *CO is well-known to have various adsorption configurations on metal surfaces with different vibrational frequencies. For instance, it is usually detected as a broad and asymmetric band located between 2100 and 1900 cm−1 during the cathodic scan of a Cu electrode [58,60,65]. Note should be taken that *CO is not always reactive intermediate [66]. Unlike atop-bonded *CO (*COatop) active intermediate, bridge-bonded *CO (*CObridge) is irreversibly adsorbed and electrochemically inert, and can only be removed from the surface by oxidizing the Cu electrode. Except for the commonly detected *CO, other intermediates such as *CHO, *COOH, and bidentate COO− (Figure 3a), were identified with much lower band intensities [65]. Nevertheless, hydrogenated CO dimers (*OCCOH) were observed on Cu (100) for the first time via RAS-IR, which proposed the reductive dimerization of carbons (i.e., C-C coupling) as a critical step for C2 species production [25].
IR spectroscopy played an essential role in identifying active sites. For example, bands located at 1500, 1385, 1100 cm−1 were detected on indium and tin films, which correspond to surface-bound tin carbonate species (Figure 3b) [67,68]. While after further removing the surface SnOx/Sn6O4(OH)4 by chemical etching, these bands disappeared, indicating that the surface oxide is the real active site for the formation of tin carbonate and subsequent formation of formic acid. In comparison, no carbonate intermediates were detected on Pb and Bi [68], indicating that the CO2RR likely proceeded directly on metal surfaces rather than oxide species.
IR spectroscopy is also powerful for demonstrating the possible mechanisms and preferred reaction pathways. CO2 molecule adsorbed to the surface of Ag thin film in the form of *COOH was detected using ATR-Fourier-transform IR (FTIR) (Figure 3c) [56]. At most of the applied potentials (−1.4 V to −1.55 V vs. Ag/AgCl), Ag-COOH (1288, 1386 and 1660 cm−1) and Ag-CO were the only detected intermediates. This observation suggests the proton-coupled electron transfer (PCET) step [CO2(g) + * + H+(aq) + e− ↔ *COOH] as the dominant reaction pathway on silver electrocatalyst which is consistent with product measurements and theoretical studies [69]. However, at a more negative applied potential (−1.6 V vs. Ag/AgCl), both *COO− (1559 cm−1) and *COOH intermediates were observed, indicating the electron transfer step [CO2(g) + * + e− ↔ *COO− and *COO− + H+ ↔ *COOH] as the preferred CO2RR mechanism. Liu et al. used potential-dependent ATR-IR to investigate the reaction pathway of CO2RR on non-metallic electrocatalysts, namely an N-doped nano-diamond/Si nanorod array [70]. A strong band at 1307 cm−1 was assigned to a surface-bound OOC−COO intermediate species, which is a likely precursor to CH3COO−.
Moreover, IR spectroscopy provides insights into the influence of the reaction environment, such as an electrolyte [65]. Recently, the role of accessible bicarbonate (HCO3−)-based electrolyte on the CO2RR was studied with the combination of IR [26] and isotopic labeled reactants (Figure 3e–g). It was found that the observed *CO band was not the dissolved 13CO2 but more from H12CO3− in the electrolyte. It means that HCO3− enhances the CO2RR rate by increasing the reducible CO2 concentration in solution through rapid equilibrium, rather than merely acting as pH buffer [71] or proton donor [72]. Similar phenomena were also observed on Cu surfaces [65].
In summary, in situ IR spectroscopic techniques are powerful tools for direct observation of several reaction intermediates of CO2RR. This technique is suitable for qualitative analysis and to prove the existence of functional groups in a molecule. But the maximum absorption peak can also be used for quantitative analysis under specific conditions, such as keeping the reaction environment (e.g., temperature, pressure, voltage, etc.) unchanged with time to avoid any changes in the optic properties of the electrolyte. However, there are some limitations for its application though, such as the limited IR transmission at low wavenumbers on Si prisms (below 1200 cm−1). Recently, a micromachined Si wafer was developed to access wavenumber down to 725 cm−1 [73] by minimizing the travel path of the IR beam in the internal reflection element. Modification of the prism structures with better IR penetration, such as ZnGe and Ge, maybe another solution. However, ZnSe suffers from low electrochemical stability during potential cycling, preventing its direct application as a working electrode. To solve this problem, a thin Si wafer was pressed against the ZnSe prism for the ATR window [74,75]. Another limitation is that regular SEIRAS occurs due to the plasmon resonance of randomly oriented nanoparticles, while their absorption range is mainly in the visible spectrum. Therefore, depending on the nanoparticle’s sizes and shapes, the enhancement varies a lot at different spectrum range. In 2008, Neubrec et al. [76] applied metal nano-antennas on dry samples and demonstrated higher enhancements (5-orders of magnitude). Although the increase happens in a narrow IR region, it was found that the spectral range can be tuned by controlling the aspect ratio and geometry of nano-antennas [77]. It is herein possible to make the enhancement range compatible with the interest spectral region of CO2RR. The only concern about these metal nano-antennas is that they are isolated. To overcome the issue of discontinuity and conductivity of the metal layer, one could consider creating nano-slits [78], which has been predicted to feature strong nanorod-like resonances in the IR spectral range.
2.2. Raman Spectroscopy (RS)
RS is used to detect inelastically scattered lights due to changes in sample rotational and vibrational state after the interaction between the electron cloud of a sample and the external electric field of the monochromatic light typically in the visible frequency range. In this sense, RS is complementary to IR, but with the additional advantage that water can be used as a solvent due to its low Raman scattering cross-section. As a scattering-based technique, RS offers a significant advantage over similar absorption-based methods since the incident light is not absorbed by the electrolyte solution adjacent to the electrode surface. By measuring energy differences between the incident and scattered photons, RS peaks with different intensities and Raman shifts provide a “fingerprint” of the subject molecule or material. Therefore, combined RS and electrochemical measurement—that already provides information about the charge transfer—present real-time spectroscopic information on the reaction. To realize the in situ (EC)-RS setup, three central components are required: a potentiostat, an EC-RS cell, and a Raman spectrometer. A key challenge for in situ RS measurements is to increase the spectroscopic limits of detection, while not distorting the electrochemical responses [79].
There have been several generations of in situ RS cells since the first generation was reported by Fleischmann [80]. The cell needs to operate in an aqueous environment and reduces light losses. A confocal mode where a working electrode is illuminated from a microscope objective positioned overtop [29] and a long working-distance air-objective were usually used [79,81]. A representative EC-RS cell is made of Teflon or polychlorotrifluoroethylene (commonly referred to as Kel-F) with a facing up working electrode, where an electrolyte layer, a quartz windows (ca. 1.0 mm in thickness) and a water droplet were sandwiched between the objective [numerical aperture (NA) = 1] and the electrode surface [79] (Figure 4a). The value match of the refractive indices of water (n = 1.33), quartz (typical crown glass n = 1.52; fused quartz n = 1.46), and electrolyte (n = 1.33) helped to reduce the attenuation of signals. This long working-distance (2.8 mm) lens also allows the utilization of a thick electrolyte layer (2.0 mm) to avoid severe diffusion hindrance. However, the presence of the quartz window in this design adversely affects the detection limits of the setup. Instead of using the quartz window, a 13 μm thin Teflon film was applied to wrap the water immersion objective [82,83]. The same refractive index of Teflon film (n = 1.33) as water ensures light losses being attenuated to a minimum, and the high numerical aperture (NA = 1.23) allows the laser light to focus tightly, thereby increasing the signal collection. However, this setup suffers from the short working distance (0.21–0.31 mm) to maintain normal electrochemical responses. Furthermore, it is challenging to wrap the Teflon film with optical quality but no electrolyte leakage. To increase the Raman signal, surface-enhanced RS (SERS, Figure 4b,c) was developed. SERS increases RS signals several orders of magnitude with plasmonic interfaces by primarily stem from enhanced local electromagnetic fields upon light excitation [84]. The sharp decay of enhanced local electromagnetic field distance from the interface makes SERS highly surface-selective and suitable for the investigation of interfacial reactions. Ag, Au, and Cu are the most largely investigated electrocatalysts with SERS because these nanostructured surfaces give rise to a strong surface-enhancement upon laser excitation at wavelength ∼500 nm for Ag and >600 nm for Au and Cu.
Thus far, in situ RS has been employed for the identification of reaction intermediates. The majority of studies based on in situ EC-RS have observed *CO as the most common CO2RR intermediate on Cu and Ag surfaces [63,85,86]. For instance, in situ RS was performed on CuSx electrocatalyst and peaks at 275, 356, and 2080 cm−1 were ascribed to C≡O frustrated rotation, Cu-CO vibration, and C≡O stretching vibration of *CO intermediate adsorbed on Cu surface [87]. The increase in band intensities indicates a buildup of *CO intermediates on the Cu surface. A broad band at 2890 cm−1 also appeared, which could be from the C-H stretching vibration [ν(C–H)] of adsorbed formate (HCOO−). In addition to the *CO intermediate, *CHx adsorbates and formate signals were also observed (broad 2900 cm−1 and weak 1450 cm−1 bands) in the study of Smith et al. [88], but with a less-intense signal. Smith’s group employed in situ RS on a roughened Cu surface in 0.1 M NaHCO3 electrolyte to provide evidence for the first common reaction intermediate for CO and formate production [89]. The surface-bound *COO− intermediate was detected over a wide potential window with vibrational fingerprints at 1540 and 350 cm−1 (Figure 5a), purportedly bound by the carbon and oxygen atoms, which correspond to η2(C, O)(CO2−). Very recently, a bidentate O-bound *OCHO intermediate on a polycrystalline Ag surface in 0.05 M Li2B4O7 aqueous electrolyte was indicated by RS, which has a crucial influence on the *H coverage on the surface, inhibiting the formation of HCOO− and H2, and providing a higher selectivity to CO [89].
In situ RS helps to understand the influence of the reaction environment. For instance, Schmitt and Gewirth performed in situ SERS measurements to investigate the beneficial impact of 3,5-diamino-1,2,4- triazole (DAT) on the CO2RR to CO on a silver electrode (Figure 5b) [90]. In the absence of DAT, Raman bands of adsorbed *CO were recorded at ∼1880 and 1945 cm−1 at −0.05 V vs. Ag/AgCl, corresponding to *CO adsorbed on a 3-fold hollow and bridge sites on Ag surface [91,92,93], respectively. With the addition of DAT, the 1880 cm−1 band is no longer observable. The band associated with the bridge-bound *CO was still observed, but the wavenumber (red) shifted to 1924 cm−1. Two new *CO adsorption peaks appeared at 2049 and 2099 cm−1, attributed to atop-bound and weakly-bound/physisorbed *CO on the Ag surface [91,92,93,94]. These results imply that in the presence of DAT, *CO intermediate will desorb rather than stay on the surface, and thus CO production enhances as a consequence.
In situ RS is also powerful for the determination of active sites on the electrocatalyst surface. Dutta et al. performed in situ RS on SnO2 (Figure 5c) [30]. At a moderately negative potential of −1 V vs. Ag/AgCl (pH = 9.7), a high Faradaic efficiency (FE) of ∼80% for formate was obtained. In the RS investigation, the intensity of the marker band of SnO2 at 623 cm−1 only slightly decreased, indicating the electrocatalyst was just partially reduced. When a more negative potential of −1.5 V was applied, the peak at 623 cm−1 disappeared, indicating SnO2 was entirely reduced to metallic Sn. The accompanied significant decrease in FE identifies SnO2, as the active surface for CO2RR to formate [30].
In situ RS also contributes to probing the state changes of electrocatalysts. Metal-oxide and oxide-derived CO2RR electrocatalysts have been extensively characterized with RS because their metal−oxygen vibrational modes could indicate the metal’s coordination and oxidation state. In this context, RS could provide information such as potential-induced transformations of the electrocatalyst structure, which may not be detected with common ex situ methods, such as XPS. For example, Raman spectra were collected on oxide-derived Cu-Zn electrocatalyst (Figure 5d) [95]. It was found that the as-deposited Cu showed Raman bands corresponding to Cu2O (142, 216, 525, 630 cm−1), the Zn electrode showed ZnO (430, 560 cm−1) phases, and the Cu4Zn showed both Cu2O and ZnO characteristic peaks [96,97]. At −0.85 V in CO2-saturated 0.1 M KHCO3 electrolyte, Cu2O, and ZnO bands disappeared, indicating that Cu2O and ZnO were sufficiently reduced to the Cu and Zn metallic state, respectively. Notably, three new bands (280, 365, and 2060 cm−1) belonging to adsorbed CO intermediates [98] observed on Cu and Cu-Zn electrocatalyst after all signals from oxides had disappeared, indicating that the metallic sites, other than oxides, were the active sites for the CO2RR to CO. Ren et al. followed a similar approach to investigate the Cu2O film [99]. The Cu-O marker bands at 47, 218, 526, and 624 cm−1 disappeared under cathodic potentials in 0.1 M KHCO3, accompanied by the rise of bands at 365 and 502 cm−1, indicating the reduction of Cu2O to metallic Cu. Beyond the transformation of materials, the interface can also be monitored. For instance, the local pH at different locations on Cu foam surface was monitored by tracking the marker bands associated with the pH-dependent HCO3− (1015 and 1365 cm−1)/CO32− (1065 cm−1) equilibrium [27].
In summary, in situ EC-RS is an accessible powerful tool to detect the surface structural changes and adsorbed intermediates on the electrocatalyst surface. The high-speed (in the order of seconds) acquisition of spectrum (200−4000 cm−1) allows the real-time analysis of the activity of an electrocatalyst. However, this exciting field faces challenges as it moves forward. Typically, the Raman peak intensity depends on the type and power of the laser, the exposure time, the scanning speed, the type and concentration of the electrolyte, and the morphology and structure of the catalyst surface. In this regard, it is difficult to use RS for direct quantitative analysis for CO2RR. Likewise, in situ EC-RS has not been frequently used for the detection of surface absorbed molecules in aqueous CO2RR. The spatial resolution of conventional RS is approximately half the wavelength of the incident light (Rayleigh criterion). For instance, the best spatial resolution of incident visible light at 633 nm is around 300 nm. To surpass this limit, the development of tip-enhanced Raman spectroscopy (TERS) [100] significantly improved the intensity and spatial resolution of Raman, while allowing the probing of adsorbates at nanometre resolution (<20 nm). However, the signal is generally derived from a hot spot where the electromagnetic field is particularly intense, so it is difficult to obtain information representative of the entire electrode surface. Besides, RS cannot detect the intermediates with low scattering cross-sections, such as *COOH. To overcome this challenge, the catalyst could be deposited on a SERS-active substrate such as Au or Ag. On the other hand, as highlighted in a recent review by Van Duyne and co-workers [101], the combination of RS with high-resolution chemical imaging of electrochemical interfaces would be the next major step, which will enable us to correlate interfacial properties with surface topography at the nanoscale and ultimately with local atomic structure.
2.3. X-ray Absorption Spectroscopy (XAS)
XAS is a powerful spectroscopic technique that provides local (4−5 Å) geometric and electronic structure information on materials. The fast development of synchrotron X-ray sources, especially the continuous tunable hard X-ray (energy higher than 5 keV) has enabled operating in situ measurements at ambient conditions. XAS can be employed on both amorphous and crystalline materials, for it is element-specific and sensitive to very minimal concentrations (such as 10−100 particles per mol) [102].
XAS is based on photon absorption, and the fine structure of the X-ray absorption coefficient is energy-dependent. If the energy of X-ray is lower than the binding energy of the electron in the orbital of an element, electrons do not excite to higher unoccupied states, resulting in a flat region as shown in Figure 6a. An intense peak below the absorption edge (pre-edge peak) presents due to orbital hybridization. It has been recognized that the pre-edge peak is strongly influenced by the coordinating species, such as ligands. When the energy of incident X-ray is at and above the absorption edge of the desired element, core electrons excited to unoccupied states and X-ray is strongly absorbed, resulting in a significant jump in the spectrum which is called the X-ray absorption near edge structure (XANES). XANES is sensitive to electronic transition, site symmetries, and changes in the oxidation state of the probed element, because the energy of core electrons is affected by the electron distribution in the valence state [102,103]. When the X-ray energy further increases, the core electrons excite to the continuum state. The consequent constructive or destructive interferences of outgoing and scattering waves with adjacent atoms in the extended X-ray absorption fine structure (EXAFS) form the oscillation, which reflects the local environment of an element regarding its coordination number, bond length and the chemical species of the nearest atoms [104,105,106]. Thanks to the high precision range (10−2−10−3 A) of EXAFS, it is an efficient tool for studying the transient structure of reaction intermediates [102].
There are three XAS modes for testing the specimen (Figure 6b,c). Transmission mode detects the difference between the incident and transmitted X-ray after the X-ray interacts with the specimen. The attenuation of X-ray intensity can be characterized by the X-ray absorption coefficient [103,107], according to Beer’s law [108]. From the data quality point of view, the sample should be concentrated and homogenous [108]. Fluorescence mode collects the emitted X-ray from an element. This mode is more suitable for dilute specimens since the emission intensity is also affected by the self-absorption apart from the absorption of the element. Electron yield mode measures the emitted photoelectrons. Different from the above bulk sensitive modes, electron yield mode is surface-sensitive due to the relatively short mean free path of photoelectrons (~10 Å) [107].
In situ XAS is suitable for the identification of active sites. In a recent work conducted by Wu et al. [109], a transition-metal-based zinc-porphyrin complex was developed for the CO2RR to CO, with a Faradaic efficiency as high as 95%. Interestingly, in situ XAS revealed that Zn (II) center maintains its oxidation state under reaction conditions, which means that the Zn center does not experience a redox reaction. Combining these observations with the result of cyclic voltammetry (CV), the porphyrin ligand was found to be active for the CO2RR. In other work, using in situ XAS, Sargent’s group demonstrated the preferential exposure of highly active Bi (10) facets on BiOBr− electrocatalyst caused achieving a high selectivity toward formate over 90% [110].
In situ XAS also provides information on the coordination environment. For example, XAS was explored to study the influence of surrounding covalent organic frameworks (COF) on the electronic structure of incorporated catalytic cobalt porphyrin units. The additional pre-edge peaks indicated the direct electronic modulation of Co coupled into extended lattice [111]. Figure 7a shows the XANES spectrum of the Ni K-edge in the material, where atomically dispersed Ni atoms coordinated in graphene vacancies [112]. The pre-edge peak position of Ni-coordinated N-doped graphene (Ni-NG) located between Ni metal and NiO, indicates that Ni free electrons are partially depleted by the neighboring atoms (C or N). No apparent changes were observed in Ni XANES under different applied potentials, showing the high stability of Ni-NG. To further investigate the possible coordination environment around Ni single atoms, k2-weighted Fourier transforms analysis of EXAFS (Figure 7b) was performed. The Ni-Ni bonding was dominant in Ni nanoparticles loaded graphene nanosheets (Ni NPs/G), which generate H2 exclusively. The Ni-Ni bonding was weakened in the Ni-coordinated graphene (Ni-G) with the coexistence of Ni–C, where nearly 40% selectivity of CO2 reduction was observed. The Ni-Ni bonding was further eliminated, and Ni–C/N peak dominated in the Ni–NG, which presents more than 95% CO selectivity. It also proved that Ni single atomic sites are active for the CO2RR. In another similar work, the EXAFS fitting revealed that Mn center is coordinated with one Cl atom (Mn-Cl mean bond distance: 2.39 Å) and four N atoms (Mn-N mean bond distance: 2.08 Å) in the Mn-Cl-N-doped graphene catalysts [113]. On the other hand, in situ XAS was used for tracking the coordination number of Cu clusters [114].
Theoretical EXAFS dynamic simulation could also estimate particle sizes because the coordination number declines with the decreasing size [115], as shown in Figure 7f. Although the coordination number calculations are highly dependent on the particle shape, EXAFS is becoming a premier method to estimate the small nanoclusters, such as Pt nanoparticles, which were estimated in the range of 17–70 Å [116] through analyses of EXAFS data.
In situ XAS is also useful to probe changes in the structure and oxidation state of electrocatalysts [3,115,117,118,119,120,121]. For instance, Weng et al. performed XANES (Figure 7g) and EXAFS (Figure 7h) on copper (II) phthalocyanine (CuPc) to obtain complex structural and oxidation state changes during the CO2RR [115]. Under the initial condition of XANES, a characteristic peak of Cu (II) appeared at ~8985 eV. With the applied potential decreased to −0.86 V vs. RHE, a small absorption peak corresponding to Cu (I) appeared at ~8981 eV and Cu (0) started to dominate the XANES when the applied potential further decreased to −1.06 V. It is consistent with the characteristic metallic Cu–Cu bond at R = ~2.2 Å in the corresponding EXAFS spectrum. The Cu (II) peak remained existence at all applied potentials in the XANES spectra and peaks features to CuPc persisted in the EXAFS, indicating that Cu (II) is not totally converted into lower oxidation states during the CO2RR. Interestingly, when the applied potential was switched back to positive 0.64V, Cu (0) peak of CuPc electrocatalyst disappeared and the XANES spectrum was almost recovered, suggesting the state changes of CuPc were reversible.
In summary, XAS is a relatively straightforward process to monitor changes in the catalyst state, structure, and coordination regardless of the state of the sample (gas, liquid, or solid). It is also useful to quantify the oxidation states of species, binding distance, coordination number, and electronic structure properties. Its resolution is very high (up to 0.05 angstrom for the binding distance) since it is capable of gathering information from even a very small number of atoms (down to tens of atoms). Nevertheless, XAS investigation of light elements remains challenging, and their edges can only be observed in the tender (S, P, Cl) or soft (B, C, N, O) X-ray energy range [122]. Moreover, the intrinsic core-hole lifetime broadening [full width at half maximum (FWHM), e.g., 5−10 eV for metal L-edges [123]] results in the spectra overlap from multiple scatters, leading to poor atomic and energy resolution. Alternatively, X-ray Raman (also known as Inelastic X-ray Scattering) can probe light elements using hard X-rays by a photon-in-photon-out energy-loss process [124]. Such an experimental setup also allows for performing Resonant Inelastic X-ray scattering measurements, which provides a more comprehensive picture of localized and delocalized electronic states of a material [125]. For instance, the Pt valence d-band change was observed as CO adsorbed onto Pt [126], which originated from newly formed bonding and antibonding orbitals. In addition to the common in situ XAS which measures the thermodynamic steady states, there is emerging XAS with the temporal resolution, namely ultrafast XAS (or pump-and-probe spectroscopy). In this technique, a stronger pump beam is used to excite the sample to generate a non-equilibrium state. A weaker probe beam is applied to observe the relaxation dynamics in the femtosecond or picosecond time regime by testing changes in the optical constants with a time delay between pump-and-probe pluses [102,127]. Therefore, ultrafast XAS may be a useful tool to investigate the intramolecular dynamics, such as the in situ observation of valence electron motion that controls the physical and chemical properties of CO2RR electrocatalysts [128].
2.4. X-ray Photoelectron Spectroscopy (XPS)
Similar to XAS, XPS is also an element-specific technique (Figure 8a), where the electrons are ejected from the surface of a material due to the direct excitation or relaxation of core holes in response to incident X-ray excitation (the photoelectric effect theory). By detecting the number and characteristic kinetic energies of escaped electrons from the surface of materials (top 10 nm), the elemental composition, empirical formula, chemical state, and electronic state of the target material could be obtained. Traditional XPS requires a high vacuum (HV, at least 10−8 millibar) because of the strong scattering of photoelectrons by gas molecules and short inelastic mean free path of electrons under ambient conditions. Working under a high vacuum condition creates a lot of limitations for employing in situ XPS at solid-liquid interfaces during the CO2RR. Synchrotron facilities providing tunable and high-brilliance X-rays have enabled the development of near-ambient-pressure XPS (NAP-XPS). There are several different setups to realize NAP-XPS. One is to expose the sample at pressures close to ambient (up to 20 mbar) while maintaining the high vacuum (<10−9 bar) in the analyzer and detector area by incorporating several differential pumping stages with electrostatic lenses between the sample surface and the photoelectron detection [130], as shown in Figure 8b (up). The small aperture of a cone placed close to the sample area reduces the gas flow into the analyzer. The smaller the aperture, the more reduced gas flow to the analyzer and the higher pressure at the sample. However, it should be noticed that the reduction in aperture size decreases the acceptance angle of the analyzer and lessens the photoelectron collection as a consequence. Moreover, to minimize the photoelectrons attenuation arising from the inelastic scattering with gas-phase molecules, the sample should be placed close to the aperture. An alternative NAP-XPS setup is to cover the sample tightly with a photoelectron-semitransparent but gas/liquid/solid impermeable membrane, which acts as a pressure barrier between the reaction cell and the analyzer, as shown in Figure 8b (down). This design allows the testing of liquid samples and rules out the pressure heterogeneity effect at the sample. Different membranes have been developed in the last 20 years, such as thin carbon foils [131,132], graphene sheets [133], and silicon nitride membranes [134]. In addition to the mechanical strength of the membrane, its low-kinetic-energy electron permeability is crucial. In this regard, two-dimensional materials, such as graphene oxide and graphene [135,136,137] were developed as membranes [138]. However, few groups have utilized the graphene membrane for NAP-XPS because it is still challenging to achieve the synthesis of a single layer graphene membrane with a large area (µm range). Besides, the dip-and-pull strategy (Figure 8c) has been developed to perform in situ XPS investigation [139]. By pulling the electrodes halfway from the electrolyte to the XPS chamber, a thin electrolyte layer (10–30 nm) was produced, allowing the EC bias to be applied.
In situ XPS provides an insight into the characterization at the electrode/electrolyte interface (Figure 8d), where the most critical elemental processes take place [14]. The X-ray penetrates the solid or liquid layer and generates signals solely from the interface layer (several nm) without interference with the bulk solid or liquid. In this vein, in situ XPS helped the understanding of the interaction between the CO2 and catalyst surface. For instance, Favaro performed in situ XPS on Cu electrocatalyst and showed the critical role of subsurface oxides below the Cu surface for physisorbed linear CO2 (l-CO2) [140]. They showed that the presence of suboxide, aided by the water in the gas phase, converted the CO2 from l-CO2 to the chemisorbed configuration (b-CO2), promoting the initial CO2RR to formate as a consequence.
In situ XPS is also useful in identifying changes in the chemical state of electrocatalysts during the CO2RR. For instance, the quasi in situ XPS was carried out on the Ag substrate supported dendritic Cu electrocatalyst [141]. The Cu LMM Auger lines confirmed the initial existence of CuxO species for all samples, and O2-plasma pretreated ones had fully oxidized CuO surface before the CO2RR. No residual CuxO were found after the CO2RR (Figure 8e), indicating that the enhanced selectivity of C2 and C3 products are not linked to residual Cu oxides, which was contrary to the previous postulated results based on ex situ spectroscopic data [142,143]. Rosen et al. also applied in situ XPS on a nanostructured Zn-dendrite electrocatalyst [144]. The oxidation state of Zn remained unchanged, suggesting its excellent stability during CO2 electrolysis at potentials more negative than −0.7 V vs. RHE. However, continuous changes of the oxidation state of Zn were observed under a less-negative potential (−0.5 V vs. RHE), which was proposed as the origin of stability and selectivity issues associated with Zn catalysts.
In summary, in situ XPS is a surface-sensitive quantitative technique, which is not only used to measure the elemental composition (at parts per thousand range), chemical/electronic state, the empirical formula of the elements, but also to generate empirical formulas thanks to its excellent quantitative accuracy (80%–90% for each major peak). The opportunities for in situ XPS are enormous, especially at the catalytic interfaces. The catalytic process lies within an essential time scale of a microsecond to second range. Time-resolved studies, such as investigation of transient kinetics and the rapid change in a catalytic structure is necessary. It requires the improvement of XPS in terms of the time resolution. Moreover, more efforts should be devoted to decreasing the pressure gap between the in situ XPS and real catalytic pressure. On the other hand, the fast development of nanomaterials requires the corresponding understanding process at nanoscale, which calls for the improvement of the spatial resolution. In 1990, Ade et al. [145] developed scanning photoelectron microscopes (SPEM), which are capable of adding spatial resolution and imaging capabilities to XPS in a high vacuum environment. Thanks to the efforts from the ESCA microscopy beamline research team at Elettra [146,147], photoemission spectromicroscopy is capable of being performed under near-ambient pressure in recent years. It will provide new insights onto the CO2RR by developing in situ XPS towards photoemission spectromicroscopy measurement with a spatial resolution of nanometers and a time resolution of sub-second, operational at atmospheric and/or higher pressure.
2.5. In Situ Mass Spectrometry (MS)
CO2RR produces both gaseous and liquid-phase products [8], which can be analyzed by gas chromatography (GC)/MS and high-performance liquid chromatography (HPLC)/nuclear magnetic resonance (NMR), respectively. Although GC is sensitive enough to quantify gaseous products from the effluent of the electrochemical cell, HPLC or NMR requires constant-potential or constant-current electrolysis performing for a longer time to collect enough products for the measurement [8]. MS collects signals by ionizing the chemical species and measuring the mass-to-charge ratio of ions. It qualitatively and quantitatively identifies the reaction intermediates, thereby enabling to predict reaction pathways. Since the MS analysis time is on a second scale, volatile and gaseous products could also be identified and quantified in real-time [149].
Tremendous efforts have been devoted to developing real-time MS for the CO2RR [28,150,151,152]. The gaseous hydrocarbon products of the CO2RR have been successfully detected with differential electrochemical mass spectrometry (DEMS) [149,150,153,154,155,156,157], which utilizes pervaporation to separate and collect electrochemical reaction products continuously [149]. However, the analysis of liquid products in real-time is often complicated because ions get suppressed by the non-volatile salts in the electrolyte [158,159,160]. To alleviate this issue, Koper et al. [153] combined cyclic voltammetry with an online fraction collection near the electrode. Through post-analysis, products such as hydrogen, methane, ethylene, ethane, methanol, acetaldehyde, and ethanol, were detected in a time resolution of about one minute. However, delineating all the CO2RR products through DEMS is hard because sample molecules are not only ionized but often broken-down during the electron ionization process. Moreover, the quantification of the products is also challenging as a consequence of the low and/or ill-defined product collection [153,161]. Aim for solving these issues, Bell and team members [150] used an innovative electrochemical flow cell for the DEMS system to extracts liquid and gaseous products through a membrane (Figure 9c), enabling the quantitative product analysis, such as hydrogen, methane, ethylene, 1-propanol and so on.
To realize the simultaneous real-time detection of both liquid and gaseous CO2RR products, the Ager group [151] further explored selective-ion flow-tube (SIFT) based MS and nearly all of the expected products can be quantified (Figure 9b). Very recently, an electrochemical real-time MS (EC-RTMS) setup [152] was developed where the electrolyte and products are withdrawn from a scanning flow cell [162] using a capillary and transferred continuously for analysis (Figure 9d). By applying a hydrophobic membrane, the gas is extracted from the electrolyte stream and analyzed through an electron ionization quadrupole MS. Then the degassed electrolyte is nebulized with the aid of a high-flow gas stream. Large liquid droplets in the mist are separated into a spray chamber and the fine mist is analyzed. To demonstrate its extraordinary potential, the EC-RTMS approach is used to determine CO2RR products during potential step or sweep experiments on pristine and in situ anodized copper [8]. The enhanced formation of several C2+ products over C1 products was tracked directly after copper anodization, with unprecedented temporal resolution (Figure 9e,f). The most important aspect of the EC-RTMS is its potential for real-time characterization of liquid products which significantly expand the capacity for full analysis of CO2RR products, regardless of the vapor pressure or the existence of salt.
In situ MS provides a solution for understanding reaction pathways of complex reactions by directly monitoring the formation of gaseous/liquid intermediates and final products in real-time. Moreover, the local reaction environment can be observed and quantified using an MS cell, where the catalyst is deposited directly onto the pervaporation membrane [163]. To ensure the capabilities of MS, one should carefully design the cell, which should achieve product quantification, rapid response time, and high product collection efficiency [156,164].
3. Summary and Outlook
This review is focused on the recent development of in situ spectroscopically probing tools employed for the electrochemical CO2RR and unique information obtained from experiments. It is demonstrated that in situ spectroscopic characterizations are powerful tools to shed light on the CO2RR mechanism through capturing the reaction intermediates, identifying the active sites, understanding the possible reaction pathways, clarifying the effect of reaction environment, and investigating the electrocatalysts changes. The most significant advantage of these in situ techniques is the real-time information that they provide. For instance, in situ IR and RS are sensitive to the vibration mode of the molecules, in situ XAS/XPS probe the element-specific structural information, while in situ MS is robust in identifying the reaction intermediates. However, there are still several key challenges to be addressed.
As shown in Table 1, each technique has strengths and limitations. For example, in situ IR is powerful to detect reaction intermediates, while it is restricted by the limited IR transmission. In situ RS is complementary to in situ IR, but it cannot detect intermediates with low scattering cross-sections. In situ XAS is powerful to collect geometric and/or electronic structure information of electrocatalysts, but it is hard to detect light elements. In situ XPS can provide an insight into catalytic interfaces, however, it suffers from the pressure gap between the XPS operation and the real catalytic process. In situ MS can illustrate direct qualitative/quantitative information about the intermediate, while achieving all product/intermediate quantification with high collection efficiency and rapid response time are challenging. The CO2RR is complicated and looking at data from a respective technique in isolation could lead to incomplete conclusions. Combining two or even more spectroscopic characterizations would provide a more realistic picture of the reaction mechanism. For instance, a combination of in situ IR, RS, XAS, and XPS might obtain surface-specific chemical information, including local coordination environment, structure, and oxidation state of an electrocatalyst during catalytic processes. With the further integration of in situ MS, the evolution of intermediates produced over the CO2RR process could be provided. The additional combination of theoretical calculation should achieve a more comprehensive understanding of the fundamental processes and offer more in-depth insights into the reaction mechanism.
To capture more conclusive information to recognize the real-time CO2RR reaction, the future direction relies on the suitable design of electrochemical cells with high reproducibility [165], and state-of-the-art techniques with enhanced signal quality and high time and spatial resolutions. The emerging free-electron lasers [166] present enormous potential to work as a laser source in optical spectroscopies because they produce X-rays with brightness nearly ten-times higher than conventional synchrotron sources and pulse duration from 500 to 10 fs. These beam characteristics can be helpful to reveal the structure of the material at the atomic size and to investigate the dynamics under higher time resolution.
To this end, a quantitative analysis of in situ spectroscopic data would be useful to monitor the CO2RR mechanism more accurately. We also believe that the data collected through in situ spectroscopies could be added in the structure databases for machine learning, which could be useful to design new electrocatalysts for the CO2RR.
Author Contributions
A.S. conceived the outline for this review paper; L.J. prepared the draft manuscript; A.S. and L.J. both commented, revised, reviewed, and proofread the final manuscript. All authors have read and agreed to the published version of the manuscript.
Funding
This research received no external funding.
Acknowledgments
L.J. acknowledges the Chinese Scholarship Council (CSC, NO. 201906070283) for the Post-Doctoral scholarship under the State Scholarship Fund.
Conflicts of Interest
The authors declare no conflict of interest.
Abbreviations
| ATR | attenuated total reflection |
| ATR-SEIRAS | surface-enhanced ATR-IR spectroscopy |
| CO2 | carbon dioxide |
| CO2RR | CO2 reduction reaction |
| COF | covalent organic frameworks |
| CuPc | copper (II) phthalocyanine |
| CV | cyclic voltammetry |
| DEMS | differential electrochemical mass spectrometry |
| DFT | density functional theory |
| DRIFTS | diffuse reflectance infrared Fourier-transform spectroscopy |
| EC | electrochemical |
| EC-RTMS | electrochemical real-time mass spectrometry |
| EXAFS | extended X-ray absorption fine structure |
| FTIR | Fourier-transform infrared spectroscopy |
| FWHM | full width at half maximum |
| GC | gas chromatography |
| HPLC | high-performance liquid chromatography |
| HV | high vacuum |
| IR | infrared spectroscopy |
| MS | mass spectrometry |
| NAP-XPS | near-ambient-pressure XPS |
| Ni-G | Ni-coordinated graphene |
| NMR | nuclear magnetic resonance |
| Ni-NG | Ni-coordinated N-doped graphene |
| Ni NPs/G | Ni nanoparticles loaded graphene nanosheets |
| PCET | proton coupled electron transfer |
| RAS-IR | reflection-absorption infrared spectroscopy |
| SEIRA | surface-enhancement of the infrared absorption |
| SIFT | selective-ion flow-tube |
| SPEM | scanning photoelectron microscopes |
| XAS | X-ray absorption spectroscopy |
| XANES | X-ray absorption near edge structure |
| XPS | X-ray photoelectron spectroscopy |
References
- Connell, S.D.; Kroeker, K.J.; Fabricius, K.E.; Kline, D.I.; Russell, B.D. The other ocean acidification problem: CO2 as a resource among competitors for ecosystem dominance. Philos. Trans. R. Soc. B 2013, 368, 20120442. [Google Scholar] [CrossRef] [PubMed] [Green Version]
- Doney, S.C.; Fabry, V.J.; Feely, R.A.; Kleypas, J.A. Ocean acidification: The other CO2 problem. Annu. Rev. Mar. Sci. 2009, 1, 169–192. [Google Scholar] [CrossRef] [PubMed] [Green Version]
- Dinh, C.-T.; Burdyny, T.; Kibria, M.G.; Seifitokaldani, A.; Gabardo, C.M.; de Arquer, F.P.G.; Kiani, A.; Edwards, J.P.; De Luna, P.; Bushuyev, O.S.; et al. CO2 electroreduction to ethylene via hydroxide-mediated copper catalysis at an abrupt interface. Science 2018, 360, 783–787. [Google Scholar] [CrossRef] [PubMed] [Green Version]
- Kibria, M.G.; Edwards, J.P.; Gabardo, C.M.; Dinh, C.T.; Seifitokaldani, A.; Sinton, D.; Sargent, E.H. Electrochemical CO2 Reduction into Chemical Feedstocks: From Mechanistic Electrocatalysis Models to System Design. Adv. Mater. 2019, 1807166. [Google Scholar] [CrossRef]
- Handoko, A.D.; Wei, F.; Yeo, B.S.; Seh, Z.W. Understanding heterogeneous electrocatalytic carbon dioxide reduction through operando techniques. Nat. Catal. 2018, 1, 922. [Google Scholar] [CrossRef]
- Benson, E.E.; Kubiak, C.P.; Sathrum, A.J.; Smieja, J.M. Electrocatalytic and homogeneous approaches to conversion of CO2 to liquid fuels. Chem. Soc. Rev. 2009, 38, 89–99. [Google Scholar] [CrossRef]
- Qiao, J.; Liu, Y.; Hong, F.; Zhang, J. A review of catalysts for the electroreduction of carbon dioxide to produce low-carbon fuels. Chem. Soc. Rev. 2014, 43, 631–675. [Google Scholar] [CrossRef]
- Kuhl, K.P.; Cave, E.R.; Abram, D.N.; Jaramillo, T.F. New insights into the electrochemical reduction of carbon dioxide on metallic copper surfaces. Energy Environ. Sci. 2012, 5, 7050–7059. [Google Scholar] [CrossRef]
- Kortlever, R.; Shen, J.; Schouten, K.J.P.; Calle-Vallejo, F.; Koper, M.T. Catalysts and reaction pathways for the electrochemical reduction of carbon dioxide. J. Phys. Chem. Lett. 2015, 6, 4073–4082. [Google Scholar] [CrossRef]
- Koper, M.T. Structure sensitivity and nanoscale effects in electrocatalysis. Nanoscale 2011, 3, 2054–2073. [Google Scholar] [CrossRef]
- Nørskov, J.K.; Bligaard, T.; Rossmeisl, J.; Christensen, C.H. Towards the computational design of solid catalysts. Nat. Chem. 2009, 1, 37. [Google Scholar] [CrossRef]
- Bandarenka, A.S.; Koper, M.T. Structural and electronic effects in heterogeneous electrocatalysis: Toward a rational design of electrocatalysts. J. Catal. 2013, 308, 11–24. [Google Scholar] [CrossRef]
- Stephens, I.E.; Bondarenko, A.S.; Grønbjerg, U.; Rossmeisl, J.; Chorkendorff, I. Understanding the electrocatalysis of oxygen reduction on platinum and its alloys. Energy Environ. Sci. 2012, 5, 6744–6762. [Google Scholar] [CrossRef] [Green Version]
- Bard, A.J.; Faulkner, L.R.; Leddy, J.; Zoski, C.G. Electrochemical Methods: Fundamentals and Applications; Wiley: New York, NY, USA, 1980; Volume 2. [Google Scholar]
- Kirk, C.; Chen, L.D.; Siahrostami, S.; Karamad, M.; Bajdich, M.; Voss, J.; Nørskov, J.K.; Chan, K. Theoretical investigations of the electrochemical reduction of CO on single metal atoms embedded in graphene. ACS Cent. Sci. 2017, 3, 1286–1293. [Google Scholar] [CrossRef] [Green Version]
- Bañares, M.A. Operando spectroscopy: The knowledge bridge to assessing structure–performance relationships in catalyst nanoparticles. Adv. Mater. 2011, 23, 5293–5301. [Google Scholar] [CrossRef]
- Zhu, K.; Zhu, X.; Yang, W. Application of In Situ Techniques for the Characterization of NiFe-Based Oxygen Evolution Reaction (OER) Electrocatalysts. Angew. Chem. Int. Ed. 2019, 58, 1252–1265. [Google Scholar] [CrossRef]
- Yuan, Y.; Li, M.; Bai, Z.; Jiang, G.; Liu, B.; Wu, T.; Chen, Z.; Amine, K.; Lu, J. The Absence and Importance of Operando Techniques for Metal-Free Catalysts. Adv. Mater. 2019, 31, 1805609. [Google Scholar] [CrossRef]
- Lukashuk, L.; Foettinger, K. In Situ and Operando Spectroscopy: A Powerful Approach Towards Understanding Catalysts. Johnson Matthey Technol. Rev. 2018, 62, 316–331. [Google Scholar] [CrossRef]
- Mistry, H.; Varela, A.S.; Bonifacio, C.S.; Zegkinoglou, I.; Sinev, I.; Choi, Y.-W.; Kisslinger, K.; Stach, E.A.; Yang, J.C.; Strasser, P. Highly selective plasma-activated copper catalysts for carbon dioxide reduction to ethylene. Nat. Commun. 2016, 7, 12123. [Google Scholar] [CrossRef]
- Gao, D.; Zegkinoglou, I.; Divins, N.J.; Scholten, F.; Sinev, I.; Grosse, P.; Roldan Cuenya, B. Plasma-activated copper nanocube catalysts for efficient carbon dioxide electroreduction to hydrocarbons and alcohols. ACS Nano 2017, 11, 4825–4831. [Google Scholar] [CrossRef]
- Grosse, P.; Gao, D.; Scholten, F.; Sinev, I.; Mistry, H.; Roldan Cuenya, B. Dynamic changes in the structure, chemical state and catalytic selectivity of Cu nanocubes during CO2 electroreduction: Size and support effects. Angew. Chem. Int. Ed. 2018, 57, 6192–6197. [Google Scholar] [CrossRef] [Green Version]
- Zhou, Y.; Che, F.; Liu, M.; Zou, C.; Liang, Z.; De Luna, P.; Yuan, H.; Li, J.; Wang, Z.; Xie, H.; et al. Dopant-induced electron localization drives CO2 reduction to C2 hydrocarbons. Nat. Chem. 2018, 10, 974. [Google Scholar] [CrossRef]
- Bernal, M.; Bagger, A.; Scholten, F.; Sinev, I.; Bergmann, A.; Ahmadi, M.; Rossmeisl, J.; Cuenya, B.R. CO2 electroreduction on copper-cobalt nanoparticles: Size and composition effect. Nano Energy 2018, 53, 27–36. [Google Scholar] [CrossRef]
- Pérez-Gallent, E.; Figueiredo, M.C.; Calle-Vallejo, F.; Koper, M.T. Spectroscopic observation of a hydrogenated CO dimer intermediate during CO reduction on Cu (100) electrodes. Angew. Chem. Int. Ed. 2017, 129, 3675–3678. [Google Scholar] [CrossRef]
- Dunwell, M.; Lu, Q.; Heyes, J.M.; Rosen, J.; Chen, J.G.; Yan, Y.; Jiao, F.; Xu, B. The central role of bicarbonate in the electrochemical reduction of carbon dioxide on gold. J. Am. Chem. Soc. 2017, 139, 3774–3783. [Google Scholar] [CrossRef]
- Klingan, K.; Kottakkat, T.; Jovanov, Z.P.; Jiang, S.; Pasquini, C.; Scholten, F.; Kubella, P.; Bergmann, A.; Roldan Cuenya, B.; Roth, C.; et al. Reactivity determinants in electrodeposited Cu foams for electrochemical CO2 reduction. ChemSusChem 2018, 11, 3449–3459. [Google Scholar] [CrossRef]
- Mandal, L.; Yang, K.R.; Motapothula, M.R.; Ren, D.; Lobaccaro, P.; Patra, A.; Sherburne, M.; Batista, V.S.; Yeo, B.S.; Ager, J.W.; et al. Investigating the role of copper oxide in electrochemical CO2 reduction in real time. ACS Appl. Mater. Interfaces 2018, 10, 8574–8584. [Google Scholar] [CrossRef] [Green Version]
- Deng, Y.; Yeo, B.S. Characterization of electrocatalytic water splitting and CO2 reduction reactions using in situ/operando Raman spectroscopy. ACS Catal. 2017, 7, 7873–7889. [Google Scholar] [CrossRef]
- Dutta, A.; Kuzume, A.; Rahaman, M.; Vesztergom, S.; Broekmann, P. Monitoring the chemical state of catalysts for CO2 electroreduction: An in operando study. ACS Catal. 2015, 5, 7498–7502. [Google Scholar] [CrossRef]
- Stuart, B. Infrared spectroscopy. In Kirk-Othmer Encyclopedia of Chemical Technology; Wiley: New York, NY, USA, 2000; pp. 1–18. [Google Scholar]
- Ryczkowski, J. IR spectroscopy in catalysis. Catal. Today 2001, 68, 263–381. [Google Scholar] [CrossRef]
- Reed, A.H.; Yeager, E. Infrared internal reflexion studies of the germanium/electrolyte interface. Electrochim. Acta 1970, 15, 1345–1354. [Google Scholar] [CrossRef]
- Wang, H.; Zhou, Y.-W.; Cai, W.-B. Recent applications of in situ ATR-IR spectroscopy in interfacial electrochemistry. Curr. Opin. Electrochem. 2017, 1, 73–79. [Google Scholar] [CrossRef]
- Eischens, R.; Pliskin, W. The infrared spectra of adsorbed molecules. In Advances in Catalysis; Elsevier: Amsterdam, The Netherlands, 1958; Volume 10, pp. 1–56. [Google Scholar]
- Drochner, A.; Fehlings, M.; Krauß, K.; Vogel, H. A New DRIFTS Cell for the In-Situ Investigation of Heterogeneously Catalyzed Reactions. Chem. Eng. Technol. 2000, 23, 319–322. [Google Scholar] [CrossRef]
- Osawa, M.; Ikeda, M. Surface-enhanced infrared absorption of p-nitrobenzoic acid deposited on silver island films: Contributions of electromagnetic and chemical mechanisms. J. Phys. Chem. Lett. 1991, 95, 9914–9919. [Google Scholar] [CrossRef]
- Osawa, M.; Ataka, K.-I.; Yoshii, K.; Yotsuyanagi, T. Surface-enhanced infrared ATR spectroscopy for in situ studies of electrode/electrolyte interfaces. J. Electron. Spectros. Relat. Phenomena 1993, 64, 371–379. [Google Scholar] [CrossRef]
- Osawa, M.; Ataka, K.-I.; Yoshii, K.; Nishikawa, Y. Surface-enhanced infrared spectroscopy: The origin of the absorption enhancement and band selection rule in the infrared spectra of molecules adsorbed on fine metal particles. Appl. Spectrosc. 1993, 47, 1497–1502. [Google Scholar] [CrossRef]
- Osawa, M. Dynamic processes in electrochemical reactions studied by surface-enhanced infrared absorption spectroscopy (SEIRAS). Bull. Chem. Soc. Jpn. 1997, 70, 2861–2880. [Google Scholar] [CrossRef]
- Kan, B.-C.; Boo, J.-H.; Lee, I.; Zaera, F. Thermal chemistry of tetrakis (ethylmethylamido) titanium on Si (100) surfaces. J. Phys. Chem. A 2009, 113, 3946–3954. [Google Scholar] [CrossRef]
- Kubota, J.; Ma, Z.; Zaera, F. In situ characterization of adsorbates in solid−liquid interfaces by reflection−absorption infrared spectroscopy. Langmuir 2003, 19, 3371–3376. [Google Scholar] [CrossRef]
- Greenler, R.G. Infrared study of adsorbed molecules on metal surfaces by reflection techniques. J. Chem. Phys. 1966, 44, 310–315. [Google Scholar] [CrossRef]
- Hoffmann, F.M. Infrared reflection-absorption spectroscopy of adsorbed molecules. Surf. Sci. Rep. 1983, 3, 107–192. [Google Scholar] [CrossRef]
- Zaera, F. Infrared and molecular beam studies of chemical reactions on solid surfaces. Int. Rev. Phys. Chem. 2002, 21, 433–471. [Google Scholar] [CrossRef]
- Ye, S.; Kondo, T.; Hoshi, N.; Inukai, J.; Yoshimoto, S.; Osawa, M.; Itaya, K. Recent progress in electrochemical surface science with atomic and molecular levels. Electrochemistry 2009, 77, 2–20. [Google Scholar] [CrossRef] [Green Version]
- Osawa, M. Surface enhanced vibrational spectroscopy. Handb. Vib. Spectrosc. 2002, 1, 785–815. [Google Scholar]
- Osawa, M. In-situ surface-enhanced infrared spectroscopy of the electrode/solution interface. Adv. Electrochem. Sci. Eng. 2006, 9, 269. [Google Scholar]
- Kawata, S.; Ohtsu, M.; Irie, M. Near-Field Optics and Surface Plasmon Polaritons; Springer Science & Business Media: Berlin, Germany, 2001; Volume 81. [Google Scholar]
- Hartstein, A.; Kirtley, J.; Tsang, J. Enhancement of the infrared absorption from molecular monolayers with thin metal overlayers. Phys. Rev. Lett. 1980, 45, 201. [Google Scholar] [CrossRef]
- Vimont, A.; Thibault-Starzyk, F.; Daturi, M. Analysing and understanding the active site by IR spectroscopy. Chem. Soc. Rev. 2010, 39, 4928–4950. [Google Scholar] [CrossRef]
- Chakrabarti, A.; Ford, M.E.; Gregory, D.; Hu, R.; Keturakis, C.J.; Lwin, S.; Tang, Y.; Yang, Z.; Zhu, M.; Banares, M.A. A decade+ of operando spectroscopy studies. Catal. Today 2017, 283, 27–53. [Google Scholar] [CrossRef]
- Dou, J.; Sun, Z.; Opalade, A.A.; Wang, N.; Fu, W.; Tao, F.F. Operando chemistry of catalyst surfaces during catalysis. Chem. Soc. Rev. 2017, 46, 2001–2027. [Google Scholar] [CrossRef]
- Karim, W.; Kleibert, A.; Hartfelder, U.; Balan, A.; Gobrecht, J.; Van Bokhoven, J.A.; Ekinci, Y. Size-dependent redox behavior of iron observed by in-situ single nanoparticle spectro-microscopy on well-defined model systems. Sci. Rep. 2016, 6, 18818. [Google Scholar] [CrossRef] [Green Version]
- Edwards, M.; Whittle, D.; Rhodes, C.; Ward, A.; Rohan, D.; Shannon, M.; Hutchings, G.; Kiely, C. Microstructural studies of the copper promoted iron oxide/chromia water-gas shift catalyst. Phys. Chem. Chem. Phys. 2002, 4, 3902–3908. [Google Scholar] [CrossRef]
- Firet, N.J.; Smith, W.A. Probing the reaction mechanism of CO2 electroreduction over Ag films via operando infrared spectroscopy. ACS Catal. 2016, 7, 606–612. [Google Scholar] [CrossRef]
- Kraack, J.P.; Kaech, A.; Hamm, P. Surface enhancement in ultrafast 2D ATR IR spectroscopy at the metal-liquid interface. J. Phys. Chem. C 2016, 120, 3350–3359. [Google Scholar] [CrossRef]
- Gunathunge, C.M.; Li, X.; Li, J.; Hicks, R.P.; Ovalle, V.J.; Waegele, M.M. Spectroscopic observation of reversible surface reconstruction of copper electrodes under CO2 reduction. J. Phys. Chem. C 2017, 121, 12337–12344. [Google Scholar] [CrossRef]
- Heyes, J.; Dunwell, M.; Xu, B. CO2 reduction on Cu at low overpotentials with surface-enhanced in situ spectroscopy. J. Phys. Chem. C 2016, 120, 17334–17341. [Google Scholar] [CrossRef]
- Wuttig, A.; Liu, C.; Peng, Q.; Yaguchi, M.; Hendon, C.H.; Motobayashi, K.; Ye, S.; Osawa, M.; Surendranath, Y. Tracking a common surface-bound intermediate during CO2-to-fuels catalysis. ACS Cent. Sci. 2016, 2, 522–528. [Google Scholar] [CrossRef]
- Wain, A.J.; O’Connell, M.A. Advances in surface-enhanced vibrational spectroscopy at electrochemical interfaces. Adv. Phys. X 2017, 2, 188–209. [Google Scholar] [CrossRef] [Green Version]
- Hori, Y.; Koga, O.; Yamazaki, H.; Matsuo, T. Infrared spectroscopy of adsorbed CO and intermediate species in electrochemical reduction of CO2 to hydrocarbons on a Cu electrode. Electrochim. Acta 1995, 40, 2617–2622. [Google Scholar] [CrossRef]
- Oda, I.; Ogasawara, H.; Ito, M. Carbon monoxide adsorption on copper and silver electrodes during carbon dioxide electroreduction studied by infrared reflection absorption spectroscopy and surface-enhanced raman spectroscopy. Langmuir 1996, 12, 1094–1097. [Google Scholar] [CrossRef]
- Hori, Y.; Koga, O.; Watanabe, Y.; Matsuo, T. FTIR measurements of charge displacement adsorption of CO on poly-and single crystal (100) of Cu electrodes. Electrochim. Acta 1998, 44, 1389–1395. [Google Scholar] [CrossRef]
- Zhu, S.; Jiang, B.; Cai, W.-B.; Shao, M. Direct observation on reaction intermediates and the role of bicarbonate anions in CO2 electrochemical reduction reaction on Cu surfaces. J. Am. Chem. Soc. 2017, 139, 15664–15667. [Google Scholar] [CrossRef]
- Gunathunge, C.M.; Ovalle, V.J.; Li, Y.; Janik, M.J.; Waegele, M.M. Existence of an electrochemically inert CO population on Cu electrodes in alkaline pH. ACS Catal. 2018, 8, 7507–7516. [Google Scholar] [CrossRef]
- Baruch, M.F.; Pander, J.E., III; White, J.L.; Bocarsly, A.B. Mechanistic insights into the reduction of CO2 on tin electrodes using in situ ATR-IR spectroscopy. ACS Catal. 2015, 5, 3148–3156. [Google Scholar] [CrossRef]
- Pander, J.E., III; Baruch, M.F.; Bocarsly, A.B. Probing the mechanism of aqueous CO2 reduction on post-transition-metal electrodes using ATR-IR spectroelectrochemistry. ACS Catal. 2016, 6, 7824–7833. [Google Scholar] [CrossRef]
- Feaster, J.T.; Shi, C.; Cave, E.R.; Hatsukade, T.; Abram, D.N.; Kuhl, K.P.; Hahn, C.; Nørskov, J.K.; Jaramillo, T.F. Understanding selectivity for the electrochemical reduction of carbon dioxide to formic acid and carbon monoxide on metal electrodes. ACS Catal. 2017, 7, 4822–4827. [Google Scholar] [CrossRef]
- Liu, Y.; Chen, S.; Quan, X.; Yu, H. Efficient electrochemical reduction of carbon dioxide to acetate on nitrogen-doped nanodiamond. J. Am. Chem. Soc. 2015, 137, 11631–11636. [Google Scholar] [CrossRef]
- Hori, Y.I. Electrochemical CO2 reduction on metal electrodes. In Modern Aspects of Electrochemistry; Springer: Berlin, Germany, 2008; pp. 89–189. [Google Scholar]
- Chen, Y.; Li, C.W.; Kanan, M.W. Aqueous CO2 reduction at very low overpotential on oxide-derived Au nanoparticles. J. Am. Chem. Soc. 2012, 134, 19969–19972. [Google Scholar] [CrossRef]
- Morhart, T.A.; Unni, B.; Lardner, M.J.; Burgess, I.J. Electrochemical ATR-SEIRAS Using Low-Cost, Micromachined Si Wafers. Anal. Chem. 2017, 89, 11818–11824. [Google Scholar] [CrossRef] [PubMed]
- Xue, X.-K.; Wang, J.-Y.; Li, Q.-X.; Yan, Y.-G.; Liu, J.-H.; Cai, W.-B. Practically modified attenuated total reflection surface-enhanced IR absorption spectroscopy for high-quality frequency-extended detection of surface species at electrodes. Anal. Chem. 2008, 80, 166–171. [Google Scholar] [CrossRef]
- Shao, M.-h.; Liu, P.; Adzic, R.R. Superoxide anion is the intermediate in the oxygen reduction reaction on platinum electrodes. J. Am. Chem. Soc. 2006, 128, 7408–7409. [Google Scholar] [CrossRef]
- Neubrech, F.; Pucci, A.; Cornelius, T.W.; Karim, S.; García-Etxarri, A.; Aizpurua, J. Resonant plasmonic and vibrational coupling in a tailored nanoantenna for infrared detection. Phys. Rev. Lett. 2008, 101, 157403. [Google Scholar] [CrossRef] [PubMed] [Green Version]
- Neubrech, F.; Huck, C.; Weber, K.; Pucci, A.; Giessen, H. Surface-enhanced infrared spectroscopy using resonant nanoantennas. Chem. Rev. 2017, 117, 5110–5145. [Google Scholar] [CrossRef] [PubMed]
- Huck, C.; Vogt, J.; Sendner, M.; Hengstler, D.; Neubrech, F.; Pucci, A. Plasmonic enhancement of infrared vibrational signals: Nanoslits versus nanorods. ACS Photonics 2015, 2, 1489–1497. [Google Scholar] [CrossRef]
- Zeng, Z.-C.; Hu, S.; Huang, S.-C.; Zhang, Y.-J.; Zhao, W.-X.; Li, J.-F.; Jiang, C.; Ren, B. Novel electrochemical Raman spectroscopy enabled by water immersion objective. Anal. Chem. 2016, 88, 9381–9385. [Google Scholar] [CrossRef]
- Fleischmann, M.; Hendra, P.J.; McQuillan, A.J. Raman spectra of pyridine adsorbed at a silver electrode. Chem. Phys. Lett. 1974, 26, 163–166. [Google Scholar] [CrossRef]
- Ren, B.; Li, X.; She, C.; Wu, D.; Tian, Z. Surface Raman spectroscopy as a versatile technique to study methanol oxidation on rough Pt electrodes. Electrochim. Acta 2000, 46, 193–205. [Google Scholar] [CrossRef]
- Yeo, B.S.; Klaus, S.L.; Ross, P.N.; Mathies, R.A.; Bell, A.T. Identification of hydroperoxy species as reaction intermediates in the electrochemical evolution of oxygen on gold. ChemPhysChem 2010, 11, 1854–1857. [Google Scholar] [CrossRef]
- Deng, Y.; Handoko, A.D.; Du, Y.; Xi, S.; Yeo, B.S. In situ Raman spectroscopy of copper and copper oxide surfaces during electrochemical oxygen evolution reaction: Identification of CuIII oxides as catalytically active species. ACS Catal. 2016, 6, 2473–2481. [Google Scholar] [CrossRef]
- Stiles, P.L.; Dieringer, J.A.; Shah, N.C.; Van Duyne, R.P. Surface-enhanced Raman spectroscopy. Annu. Rev. Anal. Chem. 2008, 1, 601–626. [Google Scholar] [CrossRef] [Green Version]
- Ichinohe, Y.; Wadayama, T.; Hatta, A. Electrochemical reduction of CO2 on silver as probed by surface-enhanced Raman scattering. J. Raman Spectrosc. 1995, 26, 335–340. [Google Scholar] [CrossRef]
- Mahojey, M.R.; Howard, M.W.; Cooney, R.P. Carbon dioxide conversion to hydrocarbons at silver electrode surfaces: Raman Spectroscpic evidence for surface carbon intermediates. Chem. Phys. Lett. 1980, 71, 59–63. [Google Scholar] [CrossRef]
- Deng, Y.; Huang, Y.; Ren, D.; Handoko, A.D.; Seh, Z.W.; Hirunsit, P.; Yeo, B.S. On the Role of Sulfur for the Selective Electrochemical Reduction of CO2 to Formate on CuS x Catalysts. ACS Appl. Mater. Interfaces 2018, 10, 28572–28581. [Google Scholar] [CrossRef]
- Smith, B.; Irish, D.; Kedzierzawski, P.; Augustynski, J. A Surface Enhanced Roman Scattering Study of the Intermediate and Poisoning Species Formed during the Electrochemical Reduction of CO2 on Copper. J. Electrochem. Soc. 1997, 144, 4288–4296. [Google Scholar] [CrossRef]
- Bohra, D.; Ledezma-Yanez, I.; Li, G.; de Jong, W.; Pidko, E.A.; Smith, W.A. Lateral Adsorbate Interactions Inhibit HCOO− while Promoting CO Selectivity for CO2 Electrocatalysis on Silver. Angew. Chem. Int. Ed. 2019, 131, 1359–1363. [Google Scholar] [CrossRef] [Green Version]
- Schmitt, K.G.; Gewirth, A.A. In situ surface-enhanced Raman spectroscopy of the electrochemical reduction of carbon dioxide on silver with 3, 5-diamino-1, 2, 4-triazole. J. Phys. Chem. C 2014, 118, 17567–17576. [Google Scholar] [CrossRef]
- Mahoney, M.R.; Howard, M.W.; Cooney, R.P. Raman spectra of carbon monoxide adsorbed on silver electrodes. J. Electroanal. Chem. 1984, 161, 163–167. [Google Scholar] [CrossRef]
- Orozco, G.; Pérez, M.C.; Rincon, A.; Gutiérrez, C. Adsorption and electrooxidation of carbon monoxide on silver. Langmuir 1998, 14, 6297–6306. [Google Scholar] [CrossRef]
- Gajdoš, M.; Eichler, A.; Hafner, J. CO adsorption on close-packed transition and noble metal surfaces: Trends from ab initio calculations. J. Phys. Condens. Matter 2004, 16, 1141. [Google Scholar] [CrossRef] [Green Version]
- Ikezawa, Y.; Saito, H.; Matsubayashi, H.; Toda, G. Comparative study of CO adsorbed on Pt, Pd, Au and Ag electrodes in neutral solution by IR reflection absorption spectroscopy. J. Electroanal. Chem. 1988, 252, 395–402. [Google Scholar] [CrossRef]
- Ren, D.; Ang, B.S.-H.; Yeo, B.S. Tuning the selectivity of carbon dioxide electroreduction toward ethanol on oxide-derived CuxZn catalysts. ACS Catal. 2016, 6, 8239–8247. [Google Scholar] [CrossRef]
- Singhal, A.; Pai, M.R.; Rao, R.; Pillai, K.T.; Lieberwirth, I.; Tyagi, A.K. Copper (I) oxide nanocrystals–one step synthesis, characterization, formation mechanism, and photocatalytic properties. Eur. J. Inorg. Chem. 2013, 2013, 2640–2651. [Google Scholar] [CrossRef]
- Das, D.; Mondal, P. Photoluminescence phenomena prevailing in c-axis oriented intrinsic ZnO thin films prepared by RF magnetron sputtering. RSC Adv. 2014, 4, 35735–35743. [Google Scholar] [CrossRef]
- Jiang, S.; Klingan, K.; Pasquini, C.; Dau, H. New aspects of operando Raman spectroscopy applied to electrochemical CO2 reduction on Cu foams. J. Chem. Phys. 2019, 150, 041718. [Google Scholar] [CrossRef] [PubMed]
- Ren, D.; Deng, Y.; Handoko, A.D.; Chen, C.S.; Malkhandi, S.; Yeo, B.S. Selective electrochemical reduction of carbon dioxide to ethylene and ethanol on copper (I) oxide catalysts. ACS Catal. 2015, 5, 2814–2821. [Google Scholar] [CrossRef]
- Zhang, Z.; Sheng, S.; Wang, R.; Sun, M. Tip-Enhanced Raman Spectroscopy; ACS Publications: Washington, DC, USA, 2016. [Google Scholar]
- Zaleski, S.; Wilson, A.J.; Mattei, M.; Chen, X.; Goubert, G.; Cardinal, M.F.; Willets, K.A.; Van Duyne, R.P. Investigating nanoscale electrochemistry with surface-and tip-enhanced Raman spectroscopy. Acc. Chem. Res. 2016, 49, 2023–2030. [Google Scholar] [CrossRef]
- Bressler, C.; Chergui, M. Ultrafast X-ray absorption spectroscopy. Chem. Rev. 2004, 104, 1781–1812. [Google Scholar] [CrossRef]
- Koningsberger, D.; Prins, R. X-ray Absorption: Principles, Applications, Techniques of EXAFS, SEXAFS, and XANES; Wiley: New York, NY, USA, 1988. [Google Scholar]
- Stötzel, J.; Lützenkirchen-Hecht, D.; Fonda, E.; De Oliveira, N.; Briois, V.; Frahm, R. Novel angular encoder for a quick-extended x-ray absorption fine structure monochromator. Rev. Sci. Instrum. 2008, 79, 083107. [Google Scholar] [CrossRef]
- McBreen, J.; Ogrady, W.E.; Pandya, K.I. EXAFS: New tool for study of battery and fuel cell materials. J. Power Sour. 1987, 22, 323–340. [Google Scholar] [CrossRef] [Green Version]
- Giorgetti, M. A review on the structural studies of batteries and host materials by X-ray absorption spectroscopy. ISRN Mater. Sci. 2013, 2013, 1–22. [Google Scholar] [CrossRef] [Green Version]
- Bunker, G. Introduction to XAFS: A Practical Guide to X-ray Absorption Fine Structure Spectroscopy; Cambridge University Press: Cambridge, MA, USA, 2010. [Google Scholar]
- Beer, A. Bestimmung der absorption des rothen lichts in farbigen flussigkeiten. Ann. Phys. 1852, 162, 78–88. [Google Scholar] [CrossRef] [Green Version]
- Wu, Y.; Jiang, J.; Weng, Z.; Wang, M.; Broere, D.L.; Zhong, Y.; Brudvig, G.W.; Feng, Z.; Wang, H. Electroreduction of CO2 catalyzed by a heterogenized Zn–porphyrin complex with a redox-innocent metal center. ACS Cent. Sci. 2017, 3, 847–852. [Google Scholar] [CrossRef] [PubMed] [Green Version]
- García de Arquer, F.P.; Bushuyev, O.S.; De Luna, P.; Dinh, C.T.; Seifitokaldani, A.; Saidaminov, M.I.; Tan, C.S.; Quan, L.N.; Proppe, A.; Kibria, M.G.; et al. 2D Metal Oxyhalide-Derived Catalysts for Efficient CO2 Electroreduction. Adv. Mater. 2018, 30, 1802858. [Google Scholar] [CrossRef] [PubMed]
- Lin, S.; Diercks, C.S.; Zhang, Y.-B.; Kornienko, N.; Nichols, E.M.; Zhao, Y.; Paris, A.R.; Kim, D.; Yang, P.; Yaghi, O.M. Covalent organic frameworks comprising cobalt porphyrins for catalytic CO2 reduction in water. Science 2015, 349, 1208–1213. [Google Scholar] [CrossRef] [PubMed] [Green Version]
- Jiang, K.; Siahrostami, S.; Zheng, T.; Hu, Y.; Hwang, S.; Stavitski, E.; Peng, Y.; Dynes, J.; Gangisetty, M.; Su, D. Isolated Ni single atoms in graphene nanosheets for high-performance CO2 reduction. Energy Environ. Sci. 2018, 11, 893–903. [Google Scholar] [CrossRef]
- Zhang, B.; Zhang, J.; Shi, J.; Tan, D.; Liu, L.; Zhang, F.; Lu, C.; Su, Z.; Tan, X.; Cheng, X.; et al. Manganese acting as a high-performance heterogeneous electrocatalyst in carbon dioxide reduction. Nat. Commun. 2019, 10, 1–8. [Google Scholar] [CrossRef] [PubMed]
- Nam, D.-H.; Bushuyev, O.S.; Li, J.; De Luna, P.; Seifitokaldani, A.; Dinh, C.-T.; Garcia de Arquer, F.P.; Wang, Y.; Liang, Z.; Proppe, A.H.; et al. Metal–Organic Frameworks Mediate Cu Coordination for Selective CO2 Electroreduction. J. Am. Chem. Soc. 2018, 140, 11378–11386. [Google Scholar] [CrossRef]
- Weng, Z.; Wu, Y.; Wang, M.; Jiang, J.; Yang, K.; Huo, S.; Wang, X.-F.; Ma, Q.; Brudvig, G.W.; Batista, V.S.; et al. Active sites of copper-complex catalytic materials for electrochemical carbon dioxide reduction. Nat. Commun. 2018, 9, 415. [Google Scholar] [CrossRef] [Green Version]
- Clausen, B.; Grabaek, L.; Topsoe, H.; Hansen, L.; Stoltze, P.; Norskov, J.; Nielsen, O. A new procedure for particle size determination by EXAFS based on molecular dynamics simulations. J. Catal. 1993, 141, 368–379. [Google Scholar] [CrossRef]
- Seifitokaldani, A.; Gabardo, C.M.; Burdyny, T.; Dinh, C.-T.; Edwards, J.P.; Kibria, M.G.; Bushuyev, O.S.; Kelley, S.O.; Sinton, D.; Sargent, E.H. Hydronium-induced switching between CO2 electroreduction pathways. J. Am. Chem. Soc. 2018, 140, 3833–3837. [Google Scholar] [CrossRef]
- Gabardo, C.M.; Seifitokaldani, A.; Edwards, J.P.; Dinh, C.-T.; Burdyny, T.; Kibria, M.G.; O’Brien, C.P.; Sargent, E.H.; Sinton, D. Combined high alkalinity and pressurization enable efficient CO 2 electroreduction to CO. Energy Environ. Sci. 2018, 11, 2531–2539. [Google Scholar] [CrossRef]
- Kibria, M.G.; Dinh, C.T.; Seifitokaldani, A.; De Luna, P.; Burdyny, T.; Quintero-Bermudez, R.; Ross, M.B.; Bushuyev, O.S.; García de Arquer, F.P.; Yang, P. A surface reconstruction route to high productivity and selectivity in CO2 electroreduction toward C2+ hydrocarbons. Adv. Mater. 2018, 30, 1804867. [Google Scholar] [CrossRef] [PubMed]
- Liang, Z.-Q.; Zhuang, T.-T.; Seifitokaldani, A.; Li, J.; Huang, C.-W.; Tan, C.-S.; Li, Y.; De Luna, P.; Dinh, C.T.; Hu, Y.; et al. Copper-on-nitride enhances the stable electrosynthesis of multi-carbon products from CO2. Nat. Commun. 2018, 9, 3828. [Google Scholar] [CrossRef] [PubMed]
- Zhuang, T.-T.; Liang, Z.-Q.; Seifitokaldani, A.; Li, Y.; De Luna, P.; Burdyny, T.; Che, F.; Meng, F.; Min, Y.; Quintero-Bermudez, R.; et al. Steering post-C–C coupling selectivity enables high efficiency electroreduction of carbon dioxide to multi-carbon alcohols. Nat. Catal. 2018, 1, 421. [Google Scholar] [CrossRef]
- Braun, A.; Sivula, K.; Bora, D.K.; Zhu, J.; Zhang, L.; Gratzel, M.; Guo, J.; Constable, E.C. Direct observation of two electron holes in a hematite photoanode during photoelectrochemical water splitting. J. Phys. Chem. C 2012, 116, 16870–16875. [Google Scholar] [CrossRef]
- Hämäläinen, K.; Siddons, D.; Hastings, J.; Berman, L. Elimination of the inner-shell lifetime broadening in X-ray-absorption spectroscopy. Phys. Rev. Lett. 1991, 67, 2850. [Google Scholar] [CrossRef] [PubMed]
- Lelong, G.R.; Radtke, G.; Cormier, L.; Bricha, H.; Rueff, J.-P.; Ablett, J.M.; Cabaret, D.; Gélébart, F.D.R.; Shukla, A. Detecting non-bridging oxygens: Non-resonant inelastic X-ray scattering in crystalline lithium borates. Inorg. Chem. 2014, 53, 10903–10908. [Google Scholar] [CrossRef]
- Al Samarai, M.; Delgado-Jaime, M.U.; Ishii, H.; Hiraoka, N.; Tsuei, K.-D.; Rueff, J.P.; Lassale-Kaiser, B.; Weckhuysen, B.M.; De Groot, F.M. 1s3p resonant inelastic X-ray scattering of cobalt oxides and sulfides. J. Phys. Chem. C 2016, 120, 24063–24069. [Google Scholar] [CrossRef] [Green Version]
- Glatzel, P.; Singh, J.; Kvashnina, K.O.; van Bokhoven, J.A. In situ characterization of the 5d density of states of Pt nanoparticles upon adsorption of CO. J. Am. Chem. Soc. 2010, 132, 2555–2557. [Google Scholar] [CrossRef]
- Yan, Y.J.; Zhang, W.; Che, J. Time–frequency theory of pump-probe absorption spectroscopy. J. Chem. Phys. 1997, 106, 2212–2224. [Google Scholar] [CrossRef]
- Goulielmakis, E.; Loh, Z.-H.; Wirth, A.; Santra, R.; Rohringer, N.; Yakovlev, V.S.; Zherebtsov, S.; Pfeifer, T.; Azzeer, A.M.; Kling, M.F.; et al. Real-time observation of valence electron motion. Nature 2010, 466, 739. [Google Scholar] [CrossRef]
- Wang, M.; Árnadóttir, L.; Xu, Z.J.; Feng, Z. In situ X-ray absorption spectroscopy studies of nanoscale electrocatalysts. Nanomicro Lett. 2019, 11, 47. [Google Scholar] [CrossRef] [Green Version]
- Knop-Gericke, A.; Kleimenov, E.; Hävecker, M.; Blume, R.; Teschner, D.; Zafeiratos, S.; Schlögl, R.; Bukhtiyarov, V.I.; Kaichev, V.V.; Prosvirin, I.P. X-ray photoelectron spectroscopy for investigation of heterogeneous catalytic processes. Adv. Catal. 2009, 52, 213–272. [Google Scholar]
- Daulton, T.L.; Little, B.J.; Lowe, K.; Jones-Meehan, J. In situ environmental cell–transmission electron microscopy study of microbial reduction of chromium (VI) using electron energy loss spectroscopy. Microsc. Microanal. 2001, 7, 470–485. [Google Scholar] [PubMed]
- Nishijima, K.; Yamasaki, J.; Orihara, H.; Tanaka, N. Development of microcapsules for electron microscopy and their application to dynamical observation of liquid crystals in transmission electron microscopy. Nanotechnology 2004, 15, S329. [Google Scholar] [CrossRef]
- Mohanty, N.; Fahrenholtz, M.; Nagaraja, A.; Boyle, D.; Berry, V. Impermeable graphenic encasement of bacteria. Nano Lett. 2011, 11, 1270–1275. [Google Scholar] [CrossRef] [PubMed] [Green Version]
- Williamson, M.; Tromp, R.; Vereecken, P.; Hull, R.; Ross, F. Dynamic microscopy of nanoscale cluster growth at the solid–liquid interface. Nat. Mater. 2003, 2, 532. [Google Scholar] [CrossRef]
- Kolmakov, A.; Dikin, D.A.; Cote, L.J.; Huang, J.; Abyaneh, M.K.; Amati, M.; Gregoratti, L.; Günther, S.; Kiskinova, M. Graphene oxide windows for in situ environmental cell photoelectron spectroscopy. Nat. Nanotechnol. 2011, 6, 651. [Google Scholar] [CrossRef]
- Kraus, J.; Reichelt, R.; Günther, S.; Gregoratti, L.; Amati, M.; Kiskinova, M.; Yulaev, A.; Vlassiouk, I.; Kolmakov, A. Photoelectron spectroscopy of wet and gaseous samples through graphene membranes. Nanoscale 2014, 6, 14394–14403. [Google Scholar] [CrossRef]
- Kolmakov, A.; Gregoratti, L.; Kiskinova, M.; Günther, S. Recent approaches for bridging the pressure gap in photoelectron microspectroscopy. Top. Catal. 2016, 59, 448–468. [Google Scholar] [CrossRef] [Green Version]
- Velasco-Velez, J.J.; Pfeifer, V.; Hävecker, M.; Weatherup, R.S.; Arrigo, R.; Chuang, C.H.; Stotz, E.; Weinberg, G.; Salmeron, M.; Schlögl, R. Photoelectron spectroscopy at the graphene-liquid interface reveals the electronic structure of an electrodeposited cobalt/graphene electrocatalyst. Angew. Chem. Int. Ed. 2015, 54, 14554–14558. [Google Scholar] [CrossRef] [Green Version]
- Axnanda, S.; Crumlin, E.J.; Mao, B.; Rani, S.; Chang, R.; Karlsson, P.G.; Edwards, M.O.; Lundqvist, M.; Moberg, R.; Ross, P. Using “tender” X-ray ambient pressure X-ray photoelectron spectroscopy as a direct probe of solid-liquid interface. Sci. Rep. 2015, 5, 9788. [Google Scholar] [CrossRef] [PubMed]
- Favaro, M.; Xiao, H.; Cheng, T.; Goddard, W.A.; Yano, J.; Crumlin, E.J. Subsurface oxide plays a critical role in CO2 activation by Cu (111) surfaces to form chemisorbed CO2, the first step in reduction of CO2. Proc. Natl. Acad. Sci. USA 2017, 114, 6706–6711. [Google Scholar] [PubMed] [Green Version]
- Scholten, F.; Sinev, I.; Bernal, D.M.; Roldan Cuenya, B. Plasma-modified dendritic Cu catalyst for CO2 electroreduction. ACS Catal. 2019. [Google Scholar] [CrossRef] [PubMed] [Green Version]
- Reller, C.; Krause, R.; Volkova, E.; Schmid, B.; Neubauer, S.; Rucki, A.; Schuster, M.; Schmid, G. Selective electroreduction of CO2 toward ethylene on nano dendritic copper catalysts at high current density. Adv. Energy Mater. 2017, 7, 1602114. [Google Scholar] [CrossRef]
- Dutta, A.; Rahaman, M.; Luedi, N.C.; Mohos, M.; Broekmann, P. Morphology matters: Tuning the product distribution of CO2 electroreduction on oxide-derived Cu foam catalysts. ACS Catal. 2016, 6, 3804–3814. [Google Scholar] [CrossRef]
- Rosen, J.; Hutchings, G.S.; Lu, Q.; Forest, R.V.; Moore, A.; Jiao, F. Electrodeposited Zn dendrites with enhanced CO selectivity for electrocatalytic CO2 reduction. ACS Catal. 2015, 5, 4586–4591. [Google Scholar] [CrossRef]
- Ade, H.; Kirz, J.; Hulbert, S.; Johnson, E.; Anderson, E.; Kern, D. Scanning photoelectron microscope with a zone plate generated microprobe. Nucl. Instrum. Methods Phys. Res. Sec. A Acceler. Soectrom. Detectors Assoc. Equip. 1990, 291, 126–131. [Google Scholar] [CrossRef]
- Sezen, H.; Alemán, B.; Amati, M.; Dalmiglio, M.; Gregoratti, L. Spatially resolved chemical characterization with scanning photoemission spectromicroscopy: Towards near-ambient-pressure experiments. ChemCatChem 2015, 7, 3665–3673. [Google Scholar] [CrossRef]
- Amati, M.; Abyaneh, M.K.; Gregoratti, L. Dynamic High Pressure: A novel approach toward near ambient pressure photoemission spectroscopy and spectromicroscopy. J. Instrum. 2013, 8, T05001. [Google Scholar] [CrossRef]
- Roy, K.; Artiglia, L.; van Bokhoven, J.A. Ambient pressure photoelectron spectroscopy: Opportunities in catalysis from solids to liquids and introducing time resolution. ChemCatChem 2018, 10, 666–682. [Google Scholar] [CrossRef]
- Wolter, O.; Heitbaum, J. Differential electrochemical mass spectroscopy (DEMS)—A new method for the study of electrode processes. Berichte der Bunsengesellschaft für Physikalische Chemie 1984, 88, 2–6. [Google Scholar] [CrossRef]
- Clark, E.L.; Singh, M.R.; Kwon, Y.; Bell, A.T. Differential electrochemical mass spectrometer cell design for online quantification of products produced during electrochemical reduction of CO2. Anal. Chem. 2015, 87, 8013–8020. [Google Scholar] [CrossRef] [Green Version]
- Lobaccaro, P.; Mandal, L.; Motapothula, M.R.; Sherburne, M.; Martin, J.; Venkatesan, T.; Ager, J.W. Initial Application of Selected-Ion Flow-Tube Mass Spectrometry to Real-Time Product Detection in Electrochemical CO2 Reduction. Energy Technol. 2018, 6, 110–121. [Google Scholar] [CrossRef] [Green Version]
- Khanipour, P.; Löffler, M.; Reichert, A.M.; Haase, F.T.; Mayrhofer, K.J.; Katsounaros, I. Electrochemical Real-Time Mass Spectrometry (EC-RTMS): Monitoring Electrochemical Reaction Products in Real Time. Angew. Chem. Int. Ed. 2019, 131, 7351–7355. [Google Scholar]
- Wonders, A.H.; Housmans, T.H.; Rosca, V.; Koper, M.T. On-line mass spectrometry system for measurements at single-crystal electrodes in hanging meniscus configuration. J. Appl. Electrochem. 2006, 36, 1215–1221. [Google Scholar] [CrossRef]
- Grote, J.-P.; Zeradjanin, A.R.; Cherevko, S.; Mayrhofer, K.J. Coupling of a scanning flow cell with online electrochemical mass spectrometry for screening of reaction selectivity. Rev. Sci. Instrum. 2014, 85, 104101. [Google Scholar] [CrossRef] [PubMed]
- Karabinas, P.; Wolter, O.; Heitbaum, J. Mechanistic studies with mass spectroscopic cyclic voltammetry: Anodic oxidation of hydroxylamine on Pt. Berichte der Bunsengesellschaft für Physikalische Chemie 1984, 88, 1191–1196. [Google Scholar] [CrossRef]
- Baltruschat, H. Differential electrochemical mass spectrometry. J. Am. Soc. Mass Spectrom. 2004, 15, 1693–1706. [Google Scholar] [CrossRef] [Green Version]
- Trimarco, D.B.; Pedersen, T.; Hansen, O.; Chorkendorff, I.; Vesborg, P.C. Fast and sensitive method for detecting volatile species in liquids. Rev. Sci. Instrum. 2015, 86, 075006. [Google Scholar] [CrossRef]
- Annesley, T.M. Ion suppression in mass spectrometry. Clin. Chem. 2003, 49, 1041–1044. [Google Scholar] [CrossRef] [Green Version]
- Oberacher, H.; Pitterl, F.; Erb, R.; Plattner, S. Mass spectrometric methods for monitoring redox processes in electrochemical cells. Mass Spectrom. Rev. 2015, 34, 64–92. [Google Scholar] [CrossRef] [PubMed] [Green Version]
- Brown, T.A.; Chen, H.; Zare, R.N. Identification of fleeting electrochemical reaction intermediates using desorption electrospray ionization mass spectrometry. J. Am. Chem. Soc. 2015, 137, 7274–7277. [Google Scholar] [CrossRef] [PubMed] [Green Version]
- Jusys, Z.; Massong, H.; Baltruschat, H. A New Approach for Simultaneous DEMS, and EQCM: Electro-oxidation of Adsorbed CO on Pt and Pt-Ru. J. Electrochem. Soc. 1999, 146, 1093–1098. [Google Scholar] [CrossRef]
- Schuppert, A.K.; Topalov, A.A.; Katsounaros, I.; Klemm, S.O.; Mayrhofer, K.J. A scanning flow cell system for fully automated screening of electrocatalyst materials. J. Electrochem. Soc. 2012, 159, F670–F675. [Google Scholar] [CrossRef]
- Clark, E.L.; Bell, A.T. Direct observation of the local reaction environment during the electrochemical reduction of CO2. J. Am. Chem. Soc. 2018, 140, 7012–7020. [Google Scholar] [CrossRef] [PubMed] [Green Version]
- Ashton, S.J. Design, Construction and Research Application of a Differential Electrochemical Mass Spectrometer (DEMS); Springer Science & Business Media: Berlin, Germany, 2012. [Google Scholar]
- Bravo-Suárez, J.J.; Srinivasan, P.D. Design characteristics of in situ and operando ultraviolet-visible and vibrational spectroscopic reaction cells for heterogeneous catalysis. Catal. Rev. 2017, 59, 1–151. [Google Scholar] [CrossRef]
- McNeil, B.W.; Thompson, N.R. X-ray free-electron lasers. Nat. Photonics 2010, 4, 814. [Google Scholar] [CrossRef]
Figure 1.
(a) Possible CO2RR pathways. (b) Representative in situ characterization illustrated here to gain insight on reaction intermediates, active sites, preferred reaction pathways, the effect of the reaction environment on reaction pathways, and changes that a catalyst undergoes under reaction conditions. Dark circles represent powdered catalysts. The isolated molecule is a representative intermediate/production.

Figure 2.
Schematic presentation of in situ infrared (IR) cell with (a) external reflection-absorption (RAS) and (b) internal attenuated total reflection (ATR) configurations.
Figure 2.
Schematic presentation of in situ infrared (IR) cell with (a) external reflection-absorption (RAS) and (b) internal attenuated total reflection (ATR) configurations.

Figure 3.
(a) Real-time ATR-SEIRAS spectra recorded on Cu thin film. Reprinted with permission from Ref. [65]. Copyright 2017 American Chemical Society. (b) ATR-IR traces at −1.4 V vs. Ag/AgCl under various chemical conditions and acid treatments. Reprinted with permission from Reference [67]. Copyright 2015 American Chemical Society. (c) ATR spectra and (d) proposed reaction mechanisms on the Ag thin film; (c,d) are reprinted with permission from Reference [56]. Copyright 2016 American Chemical Society. (e–g) In situ SEIRAS study of CO produced in the 13CO2 purged 0.5 M NaH12CO3 electrolyte in real-time. Reprinted with permission from Reference [26]. Copyright 2017 American Chemical Society.

Figure 4.
Schematic diagram of modern in situ (a) electrochemical–Raman spectroscopy (EC-RS) and (b) surface-enhanced RS (SERS) setups. (a) is reprinted with permission from Reference [79]. Copyright 2016 American Chemical Society. (c) In situ RS allows for probing solvent, intermediate, and catalyst state.

Figure 5.
(a) In situ Raman spectra of rough Cu surface in CO2-saturated in 0.1 M NaHCO3 (pH = 6.8). Reprinted with permission from Reference [89]. Copyright 2018 the National Academy of Sciences of the United States of America (NAS). (b) In situ RS spectra during cathodic polarization without and with DAT. Reprinted with permission from Reference [90]. Copyright 2014 American Chemical Society. (c) The overall shape of Raman spectra on SnO2 surfaces. Reprinted with permission from Reference [30]. Copyright 2015 American Chemical Society. (d) In situ RS of Cu4Zn catalysts during the electrochemical reduction of CO2 at −0.85 V in 0.1 M KHCO3 (inserts show the simultaneously acquired chronoamperograms). Reprinted with permission from Reference [95]. Copyright 2016 American Chemical Society.

Figure 6.
(a) Schematic of XAS, including the pre-edge, X-ray absorption near edge structure (XANES), and X-ray absorption fine structure (EXAFS) regions. (b) The spectrum that XAS probes. (c) Three different XAS detection modes: transmission mode, fluorescence mode, and electron yield mode.
Figure 6.
(a) Schematic of XAS, including the pre-edge, X-ray absorption near edge structure (XANES), and X-ray absorption fine structure (EXAFS) regions. (b) The spectrum that XAS probes. (c) Three different XAS detection modes: transmission mode, fluorescence mode, and electron yield mode.

Figure 7.
(a) Ni K-edge XANES, (b) Ni K-edge Fourier transformed EXAFS spectra and (c) different atomic configurations in a graphene matrix for Ni–NG catalyst; (a–c) are reprinted with permission from Reference [112]. Copyright 2018 Royal Society of Chemistry. (d) Photo of a real electrochemical cell for in situ XAS experiment setup. Reprinted with permission from Reference [129]. Copyright 2019 Springer. (e) A five-shell cuboctahedral Cu nanocrystal model and (f) its size-dependent Cu–Cu CNs for the first three shells of nearest neighbors. (g) In situ Cu K-edge XANES spectra and (h) Fourier-transformed Cu K-edge EXAFS spectra for CuPc; (i) Atomic structures of CuPc; (e–i) are reprinted with permission from Reference [115]. Copyright 2018 Royal Society of Chemistry.

Figure 8.
(a) Schematic illustration of X-ray photoelectron (XPS). (b) Representative setups of the differentially pumped analyzer (up) and a membrane-covered cell (down). Reprinted with permission from Reference [148]. Copyright 2018 Wiley-VCH. (c) Schematic of three-electrode electrochemistry setups in the XPS chamber. Reprinted with permission from Reference [139]. Copyright 2015 SNL. (d) Left: an overview of surface reactions of CO2 on Cu(111) under various in situ conditions. Right: C 1s and O 1s photoelectron peaks and multi-peak fitting results obtained for the various experimental conditions and investigated surfaces (at r.t., 298 K). Reprinted with permission from Reference [140]. Copyright 2017 PNAS. (e) Quasi in-situ Cu LMM XPS spectra acquired on Ag-supported Cu dendrites before (left) and after 1 h of CO2RR at an applied potential of −0.9V vs. RHE (right). Reprinted with permission from Reference [141]. Copyright 2019 American Chemical Society.

Figure 9.
(a) MS flow chart. (b) Schematic of the different sections of a selected-ion flow-tube (SIFT) based MS. Reprinted with permission from Reference [151]. Copyright 2018 Wiley. (c) Schematic of differential electrochemical mass spectroscopy (DEMS) cell. Reprinted with permission from Reference [150] Copyright 2015 American Chemical Society. (d) Basic components of electrochemical real-time mass spectrometry (EC-RTMS). A: scanning flow cell; B: gas-liquid separation; C: gas analyzer; D: nebulizer; E: spray chamber; F ion source. (e) The EC-RTMS method used for the determination of products. A: hydrogen; B: methane, C: methanol; D: ethylene; E: acetaldehyde; F: ethanol; G: allyl alcohol; H: propionaldehyde or acetone, I: propanol. (f) CO2RR of pristine (in blue) and anodized copper (in red). The applied potential sweep (A), measured current (B) and resulting mass signals for different compounds are shown versus time: C: hydrogen; D: methane; E: methanol; F: formic acid; G: ethylene; H: acetaldehyde; I: ethanol; J: acetate; K: glyoxal; L: allyl alcohol; M: propionaldehyde or acetone; N: propanol. Q: denotes gaseous products; TOF+ or TOF-: liquid products determined with a time-of-flight-MS direct analysis in real-time in positive or negative mode; (d–f) are reprinted with permission from Reference [152]. Copyright 2019 Wiley.


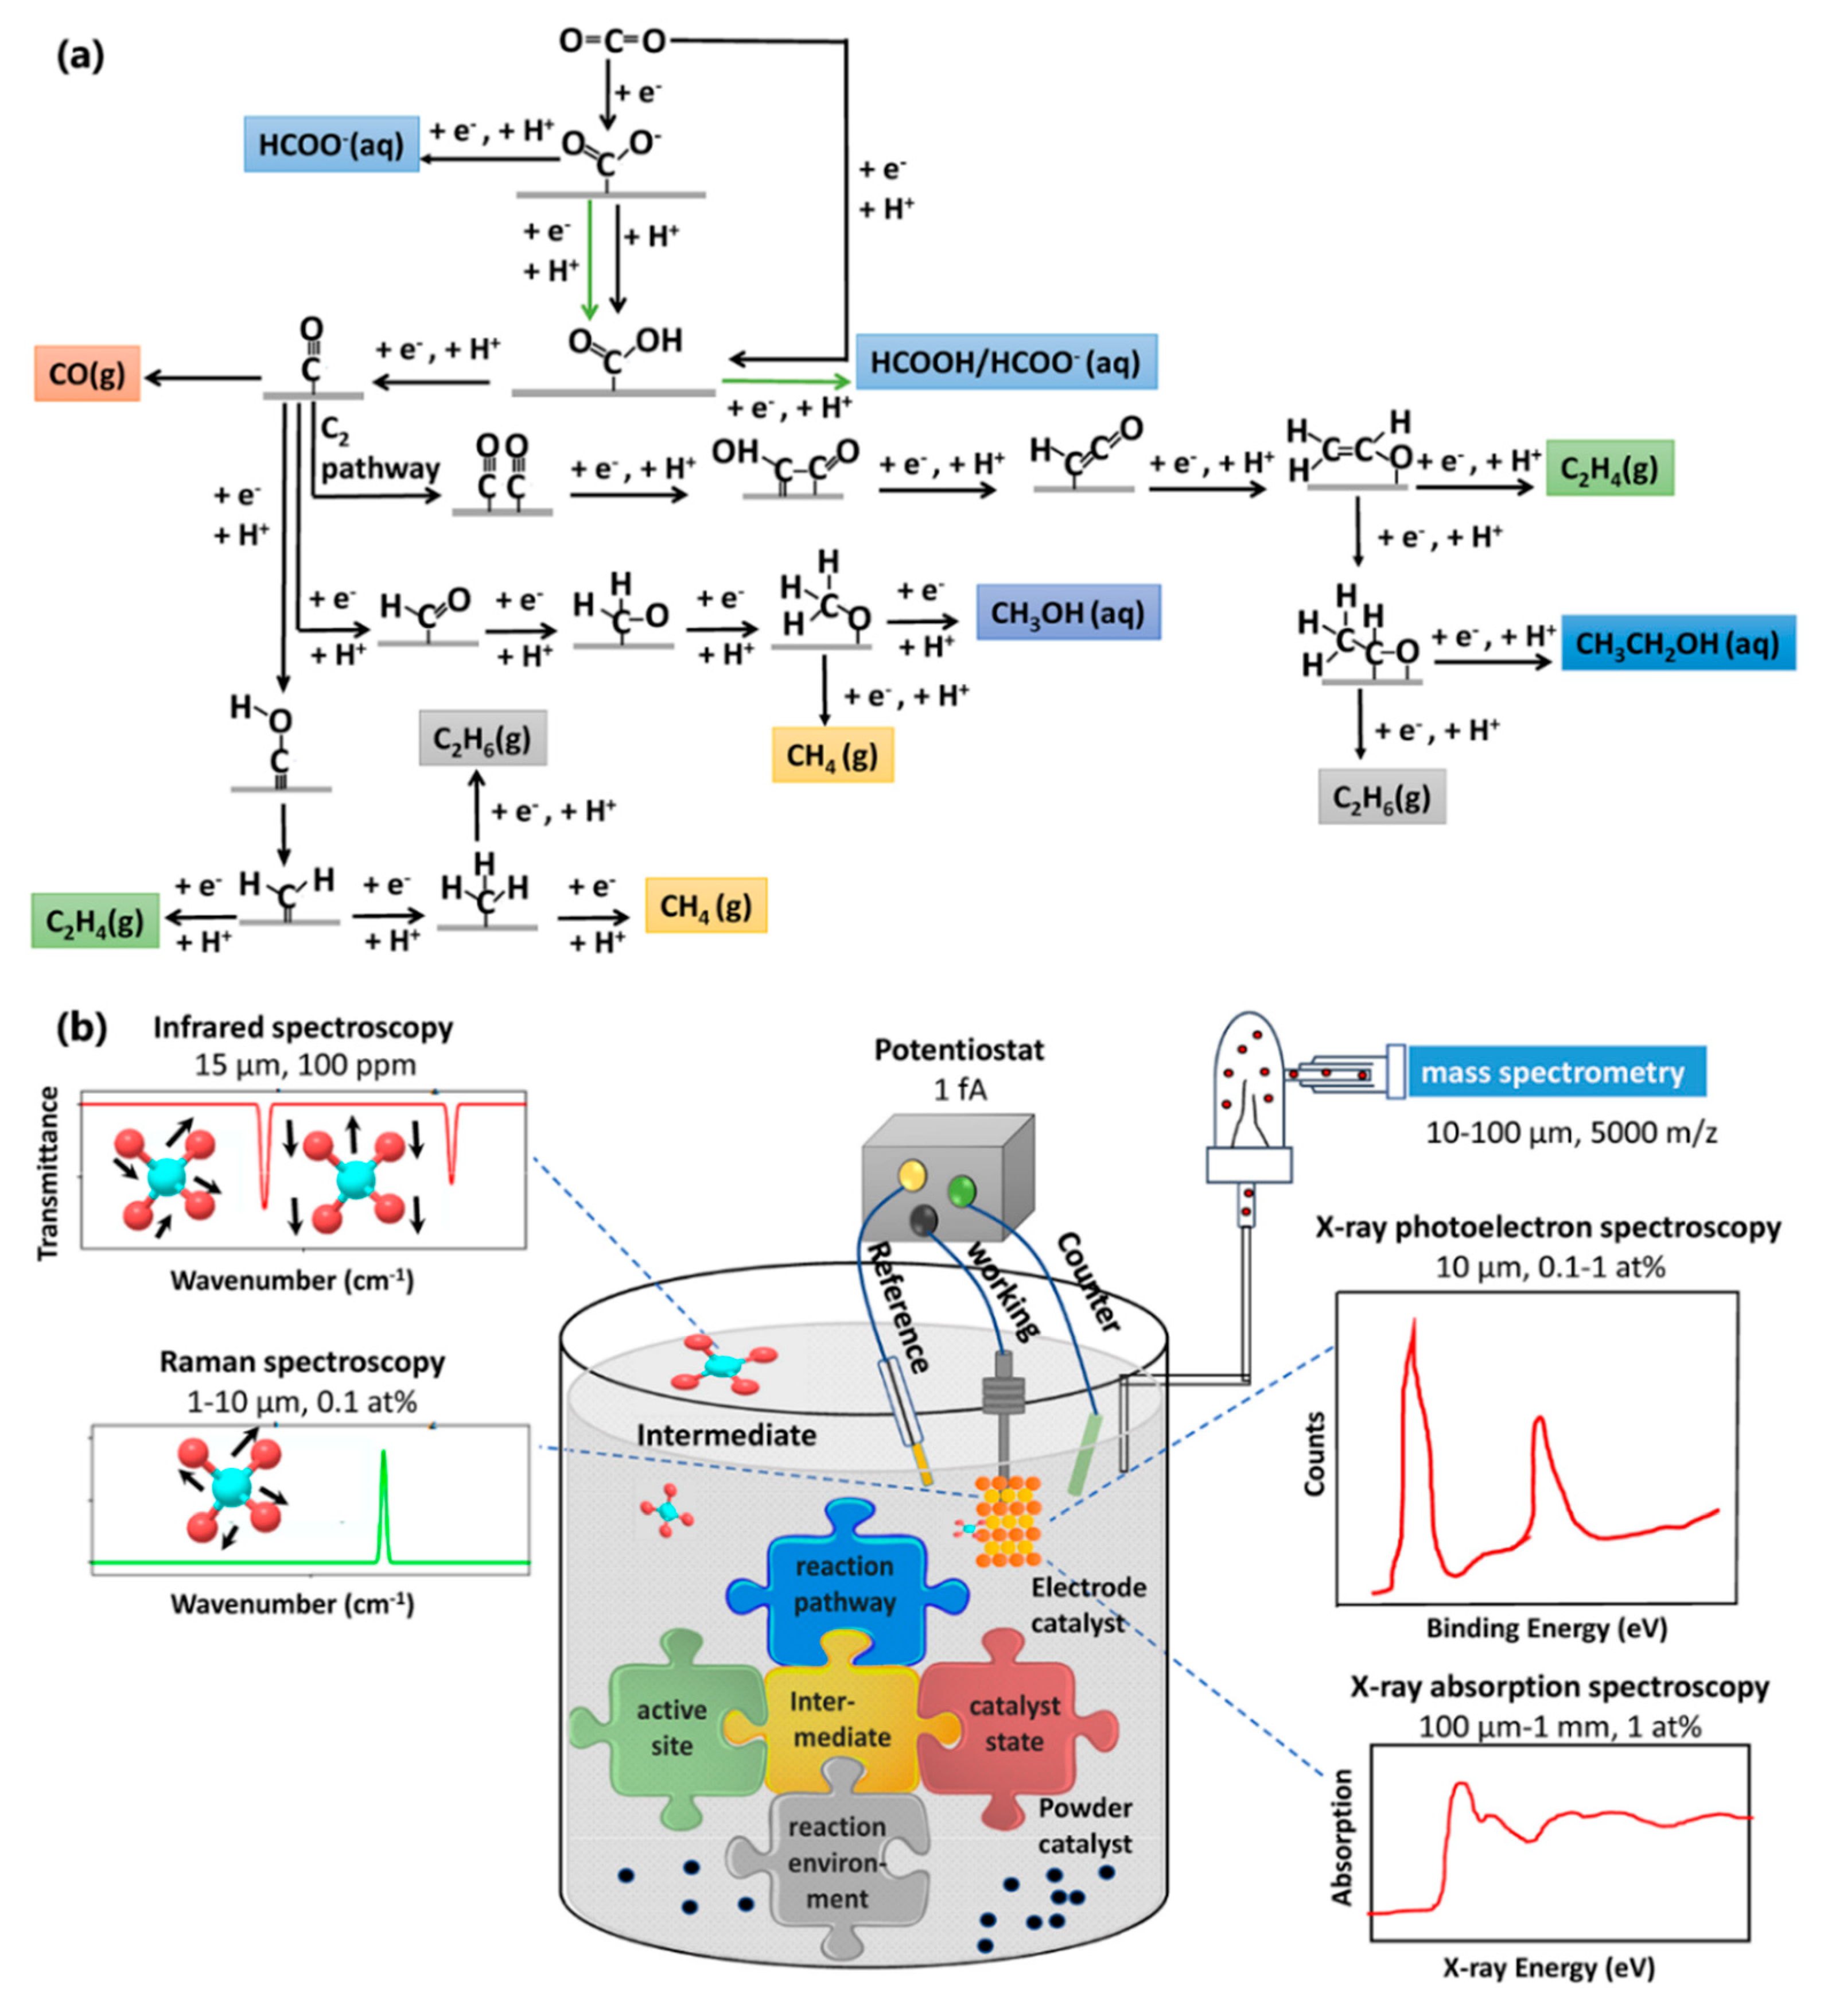
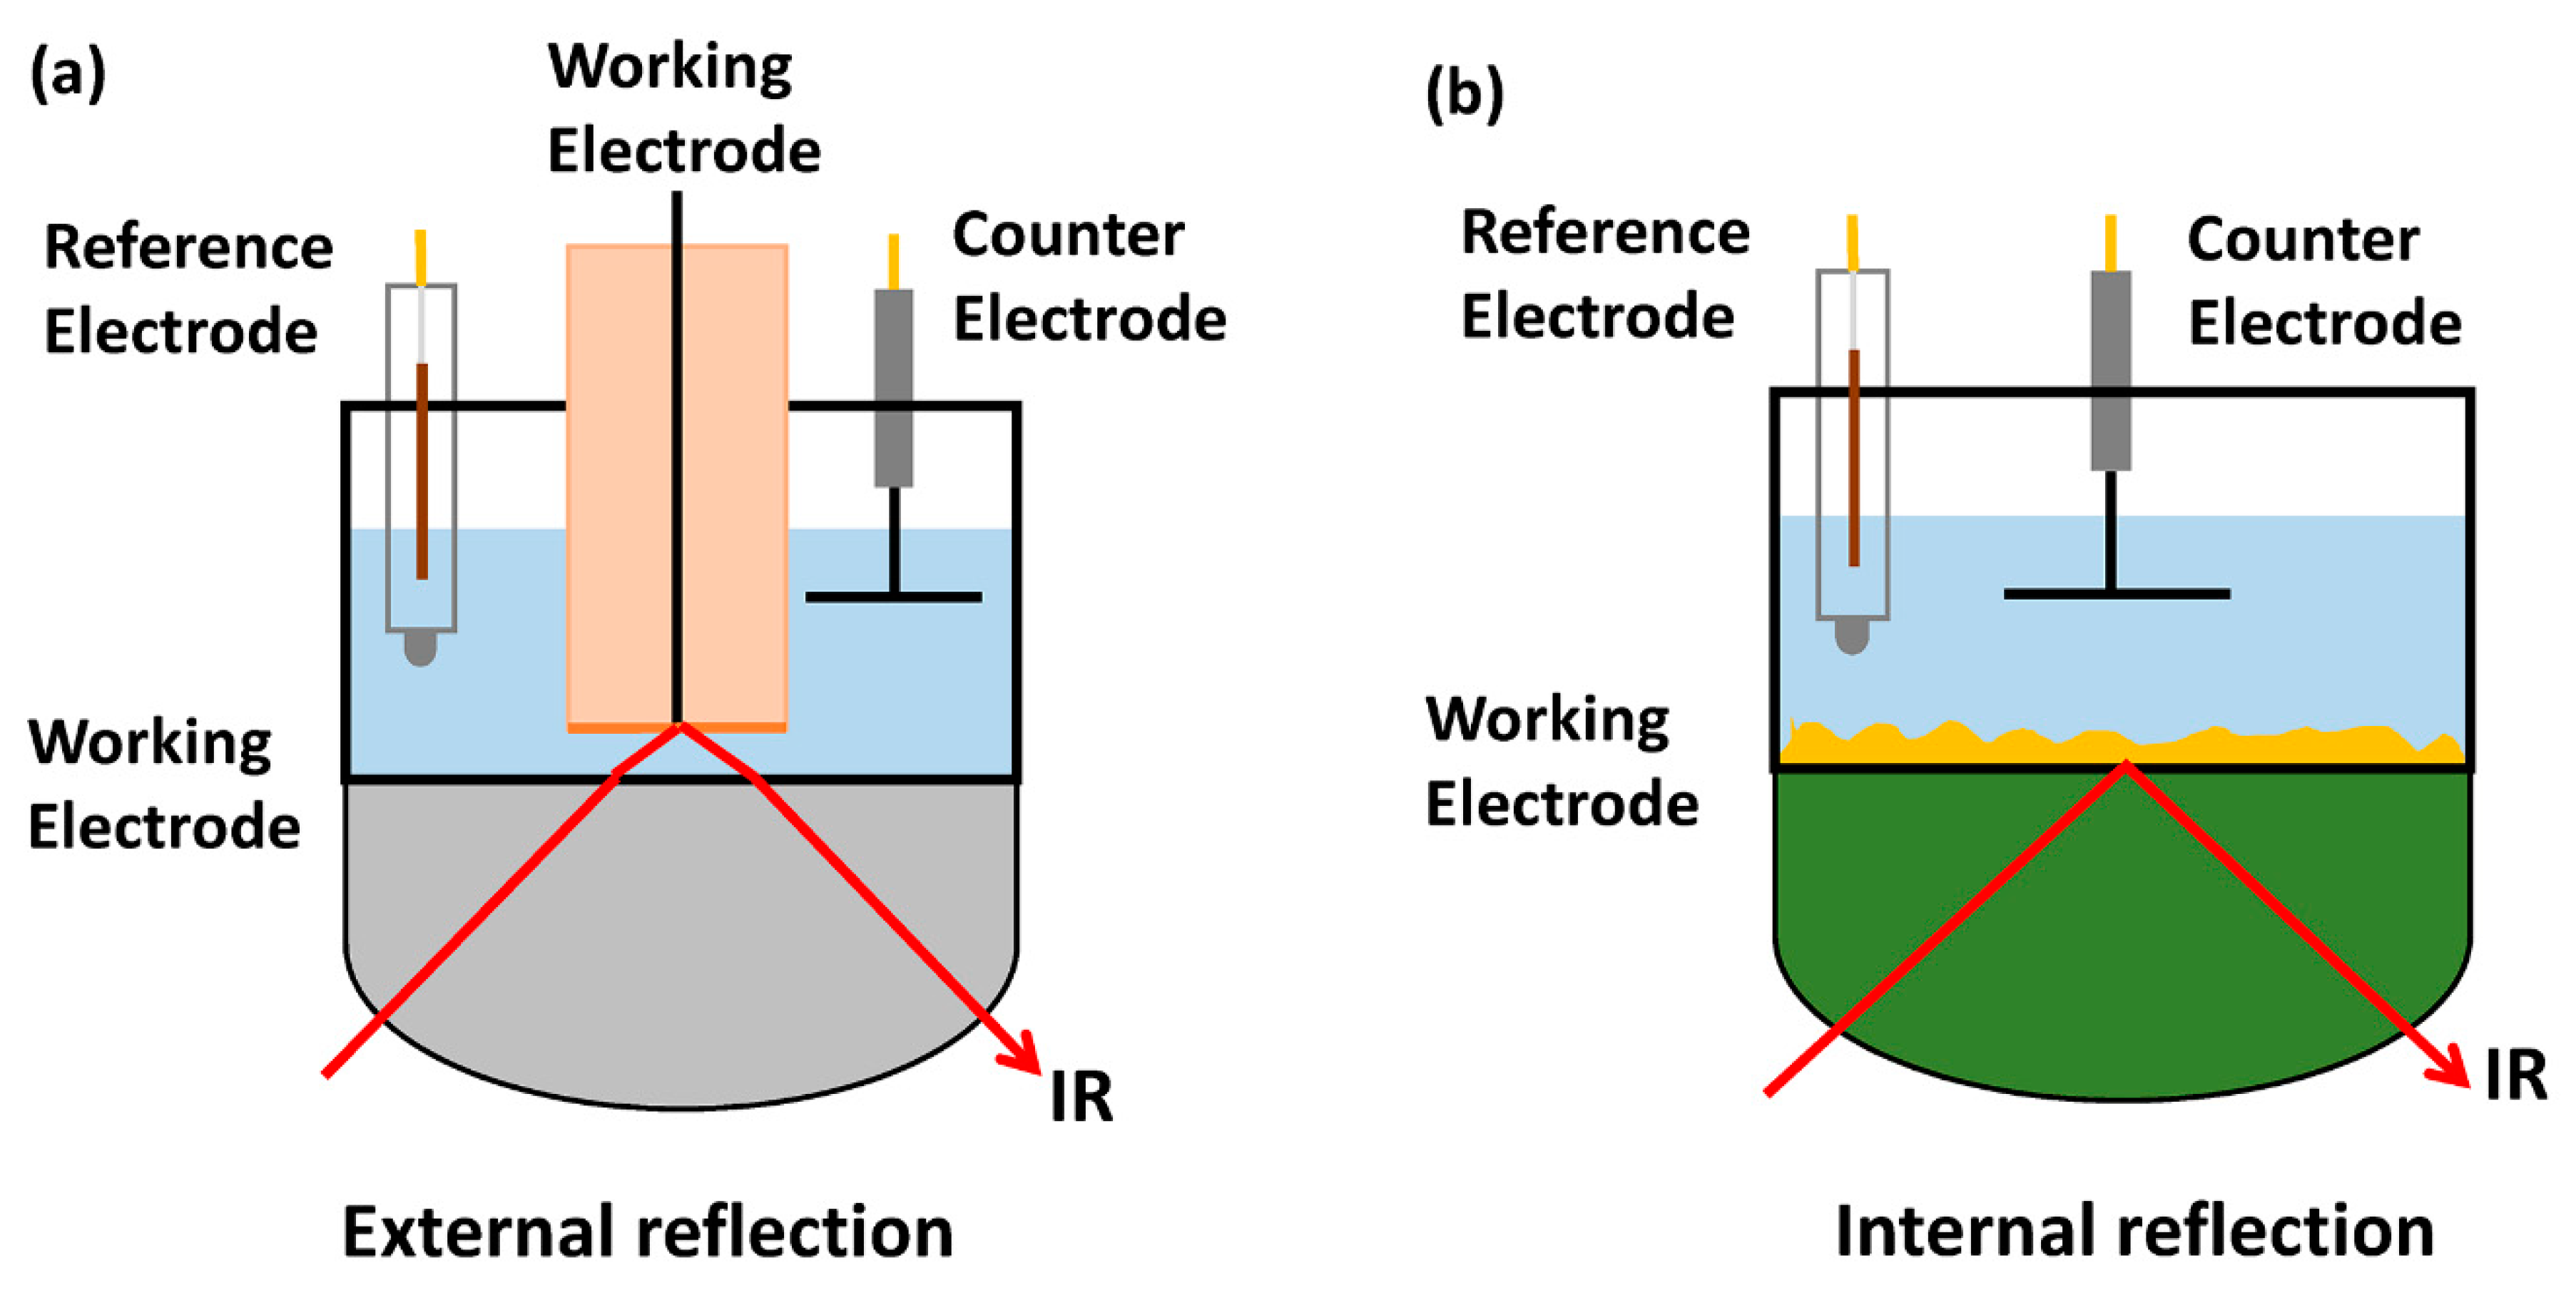
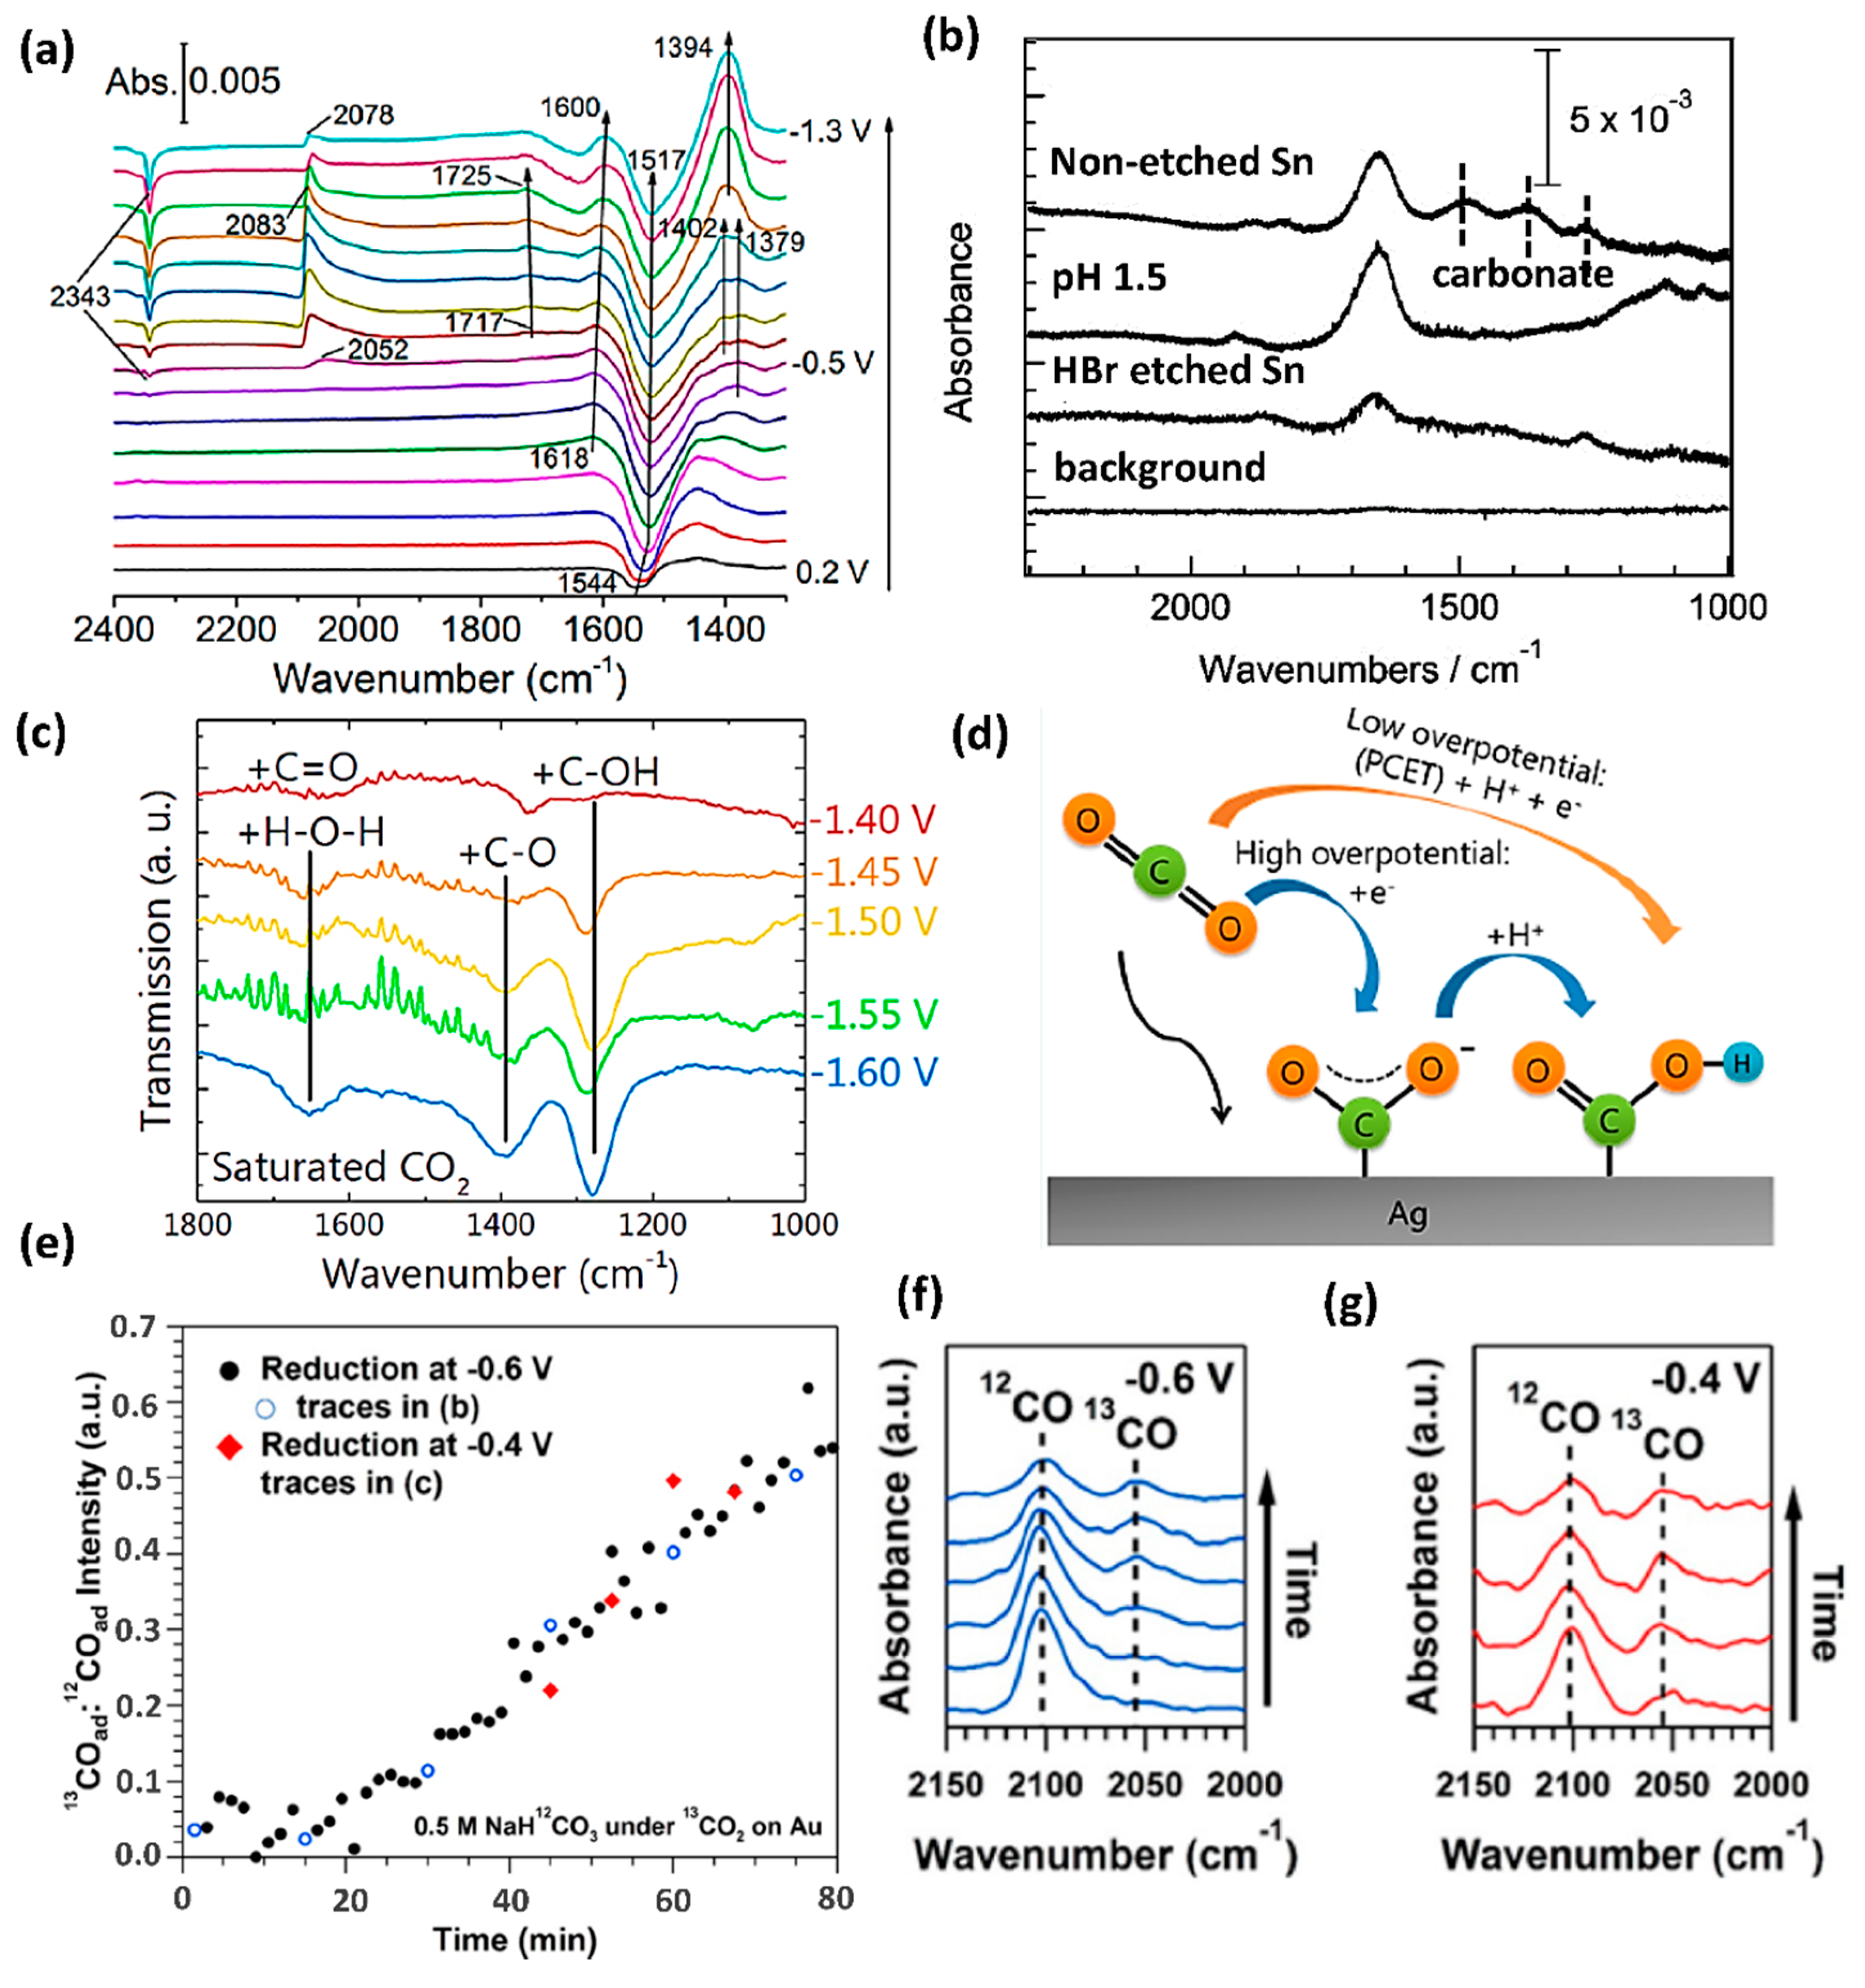
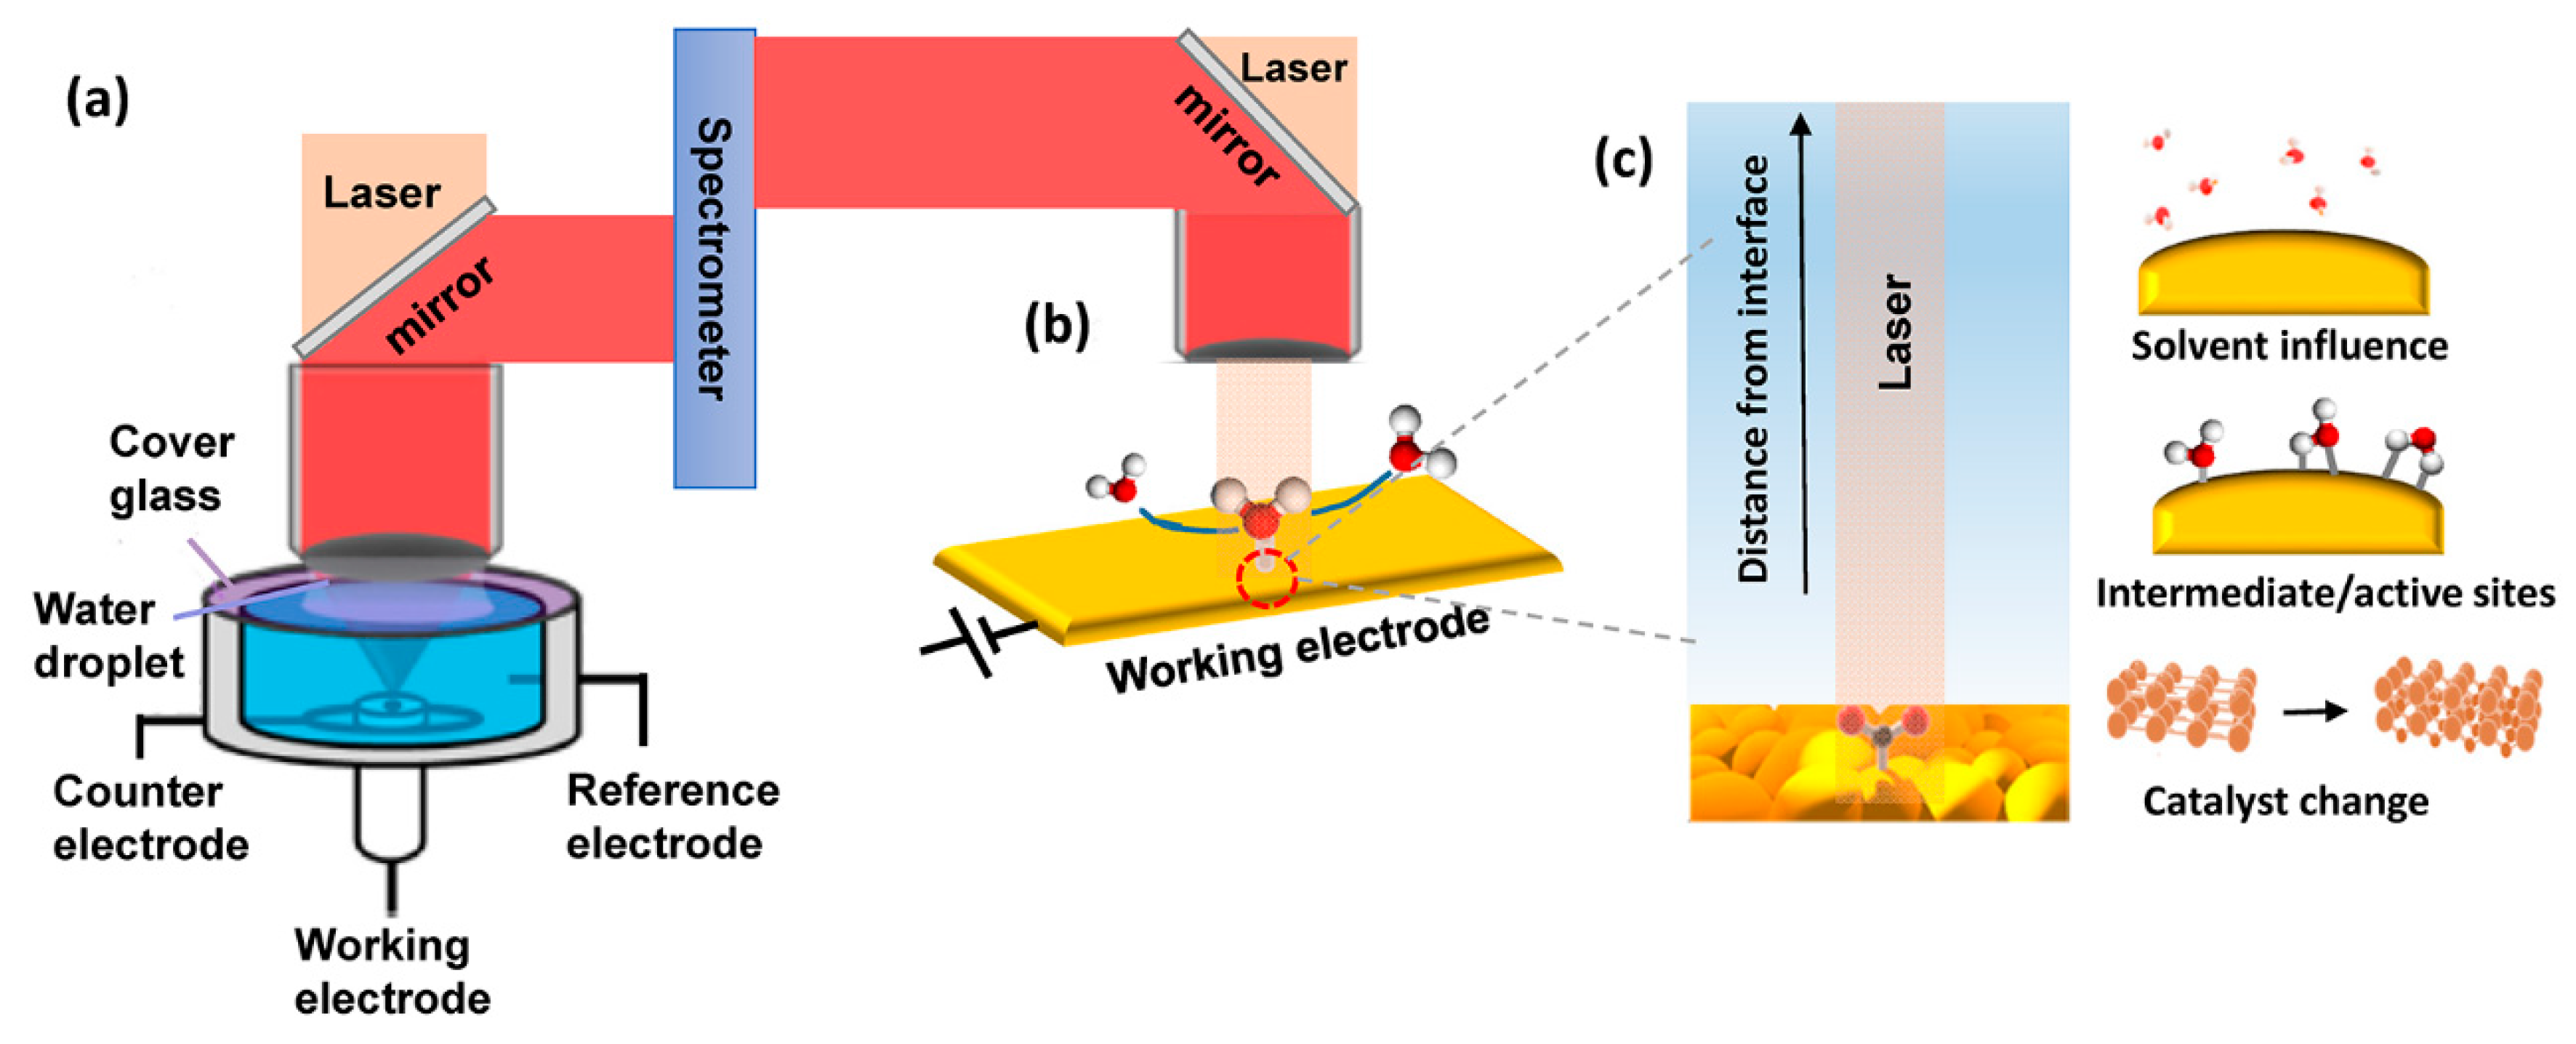
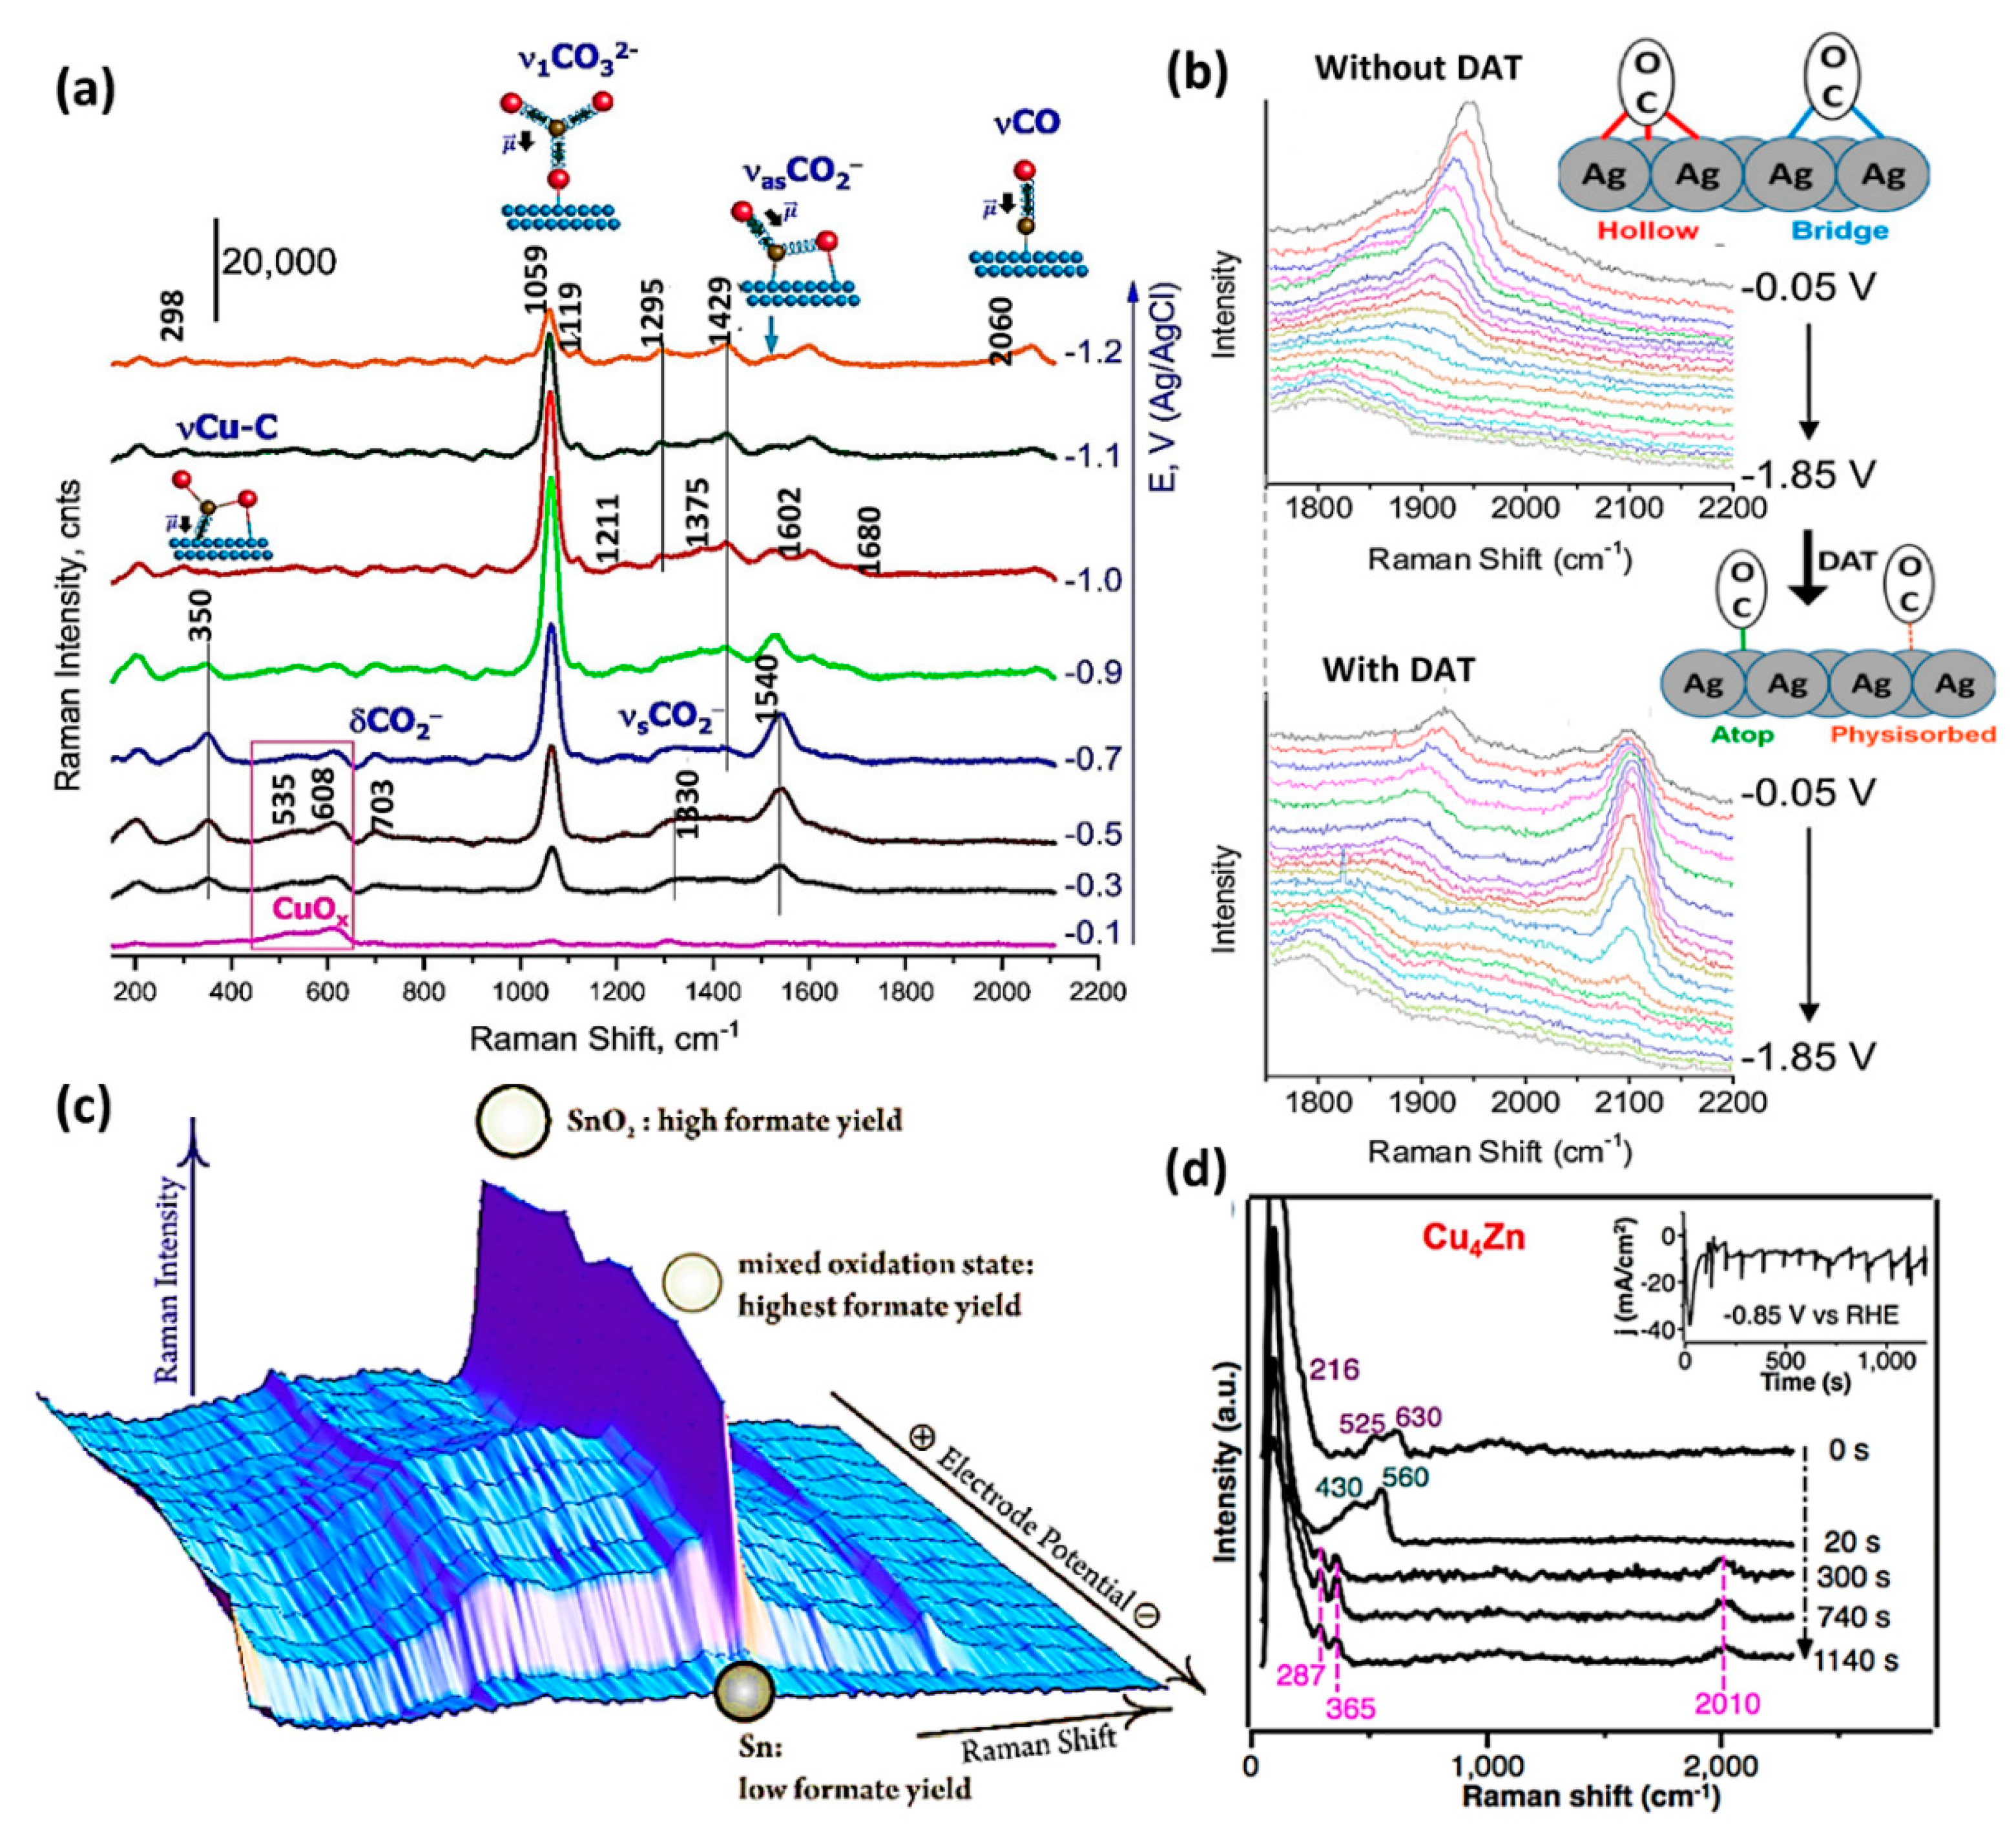
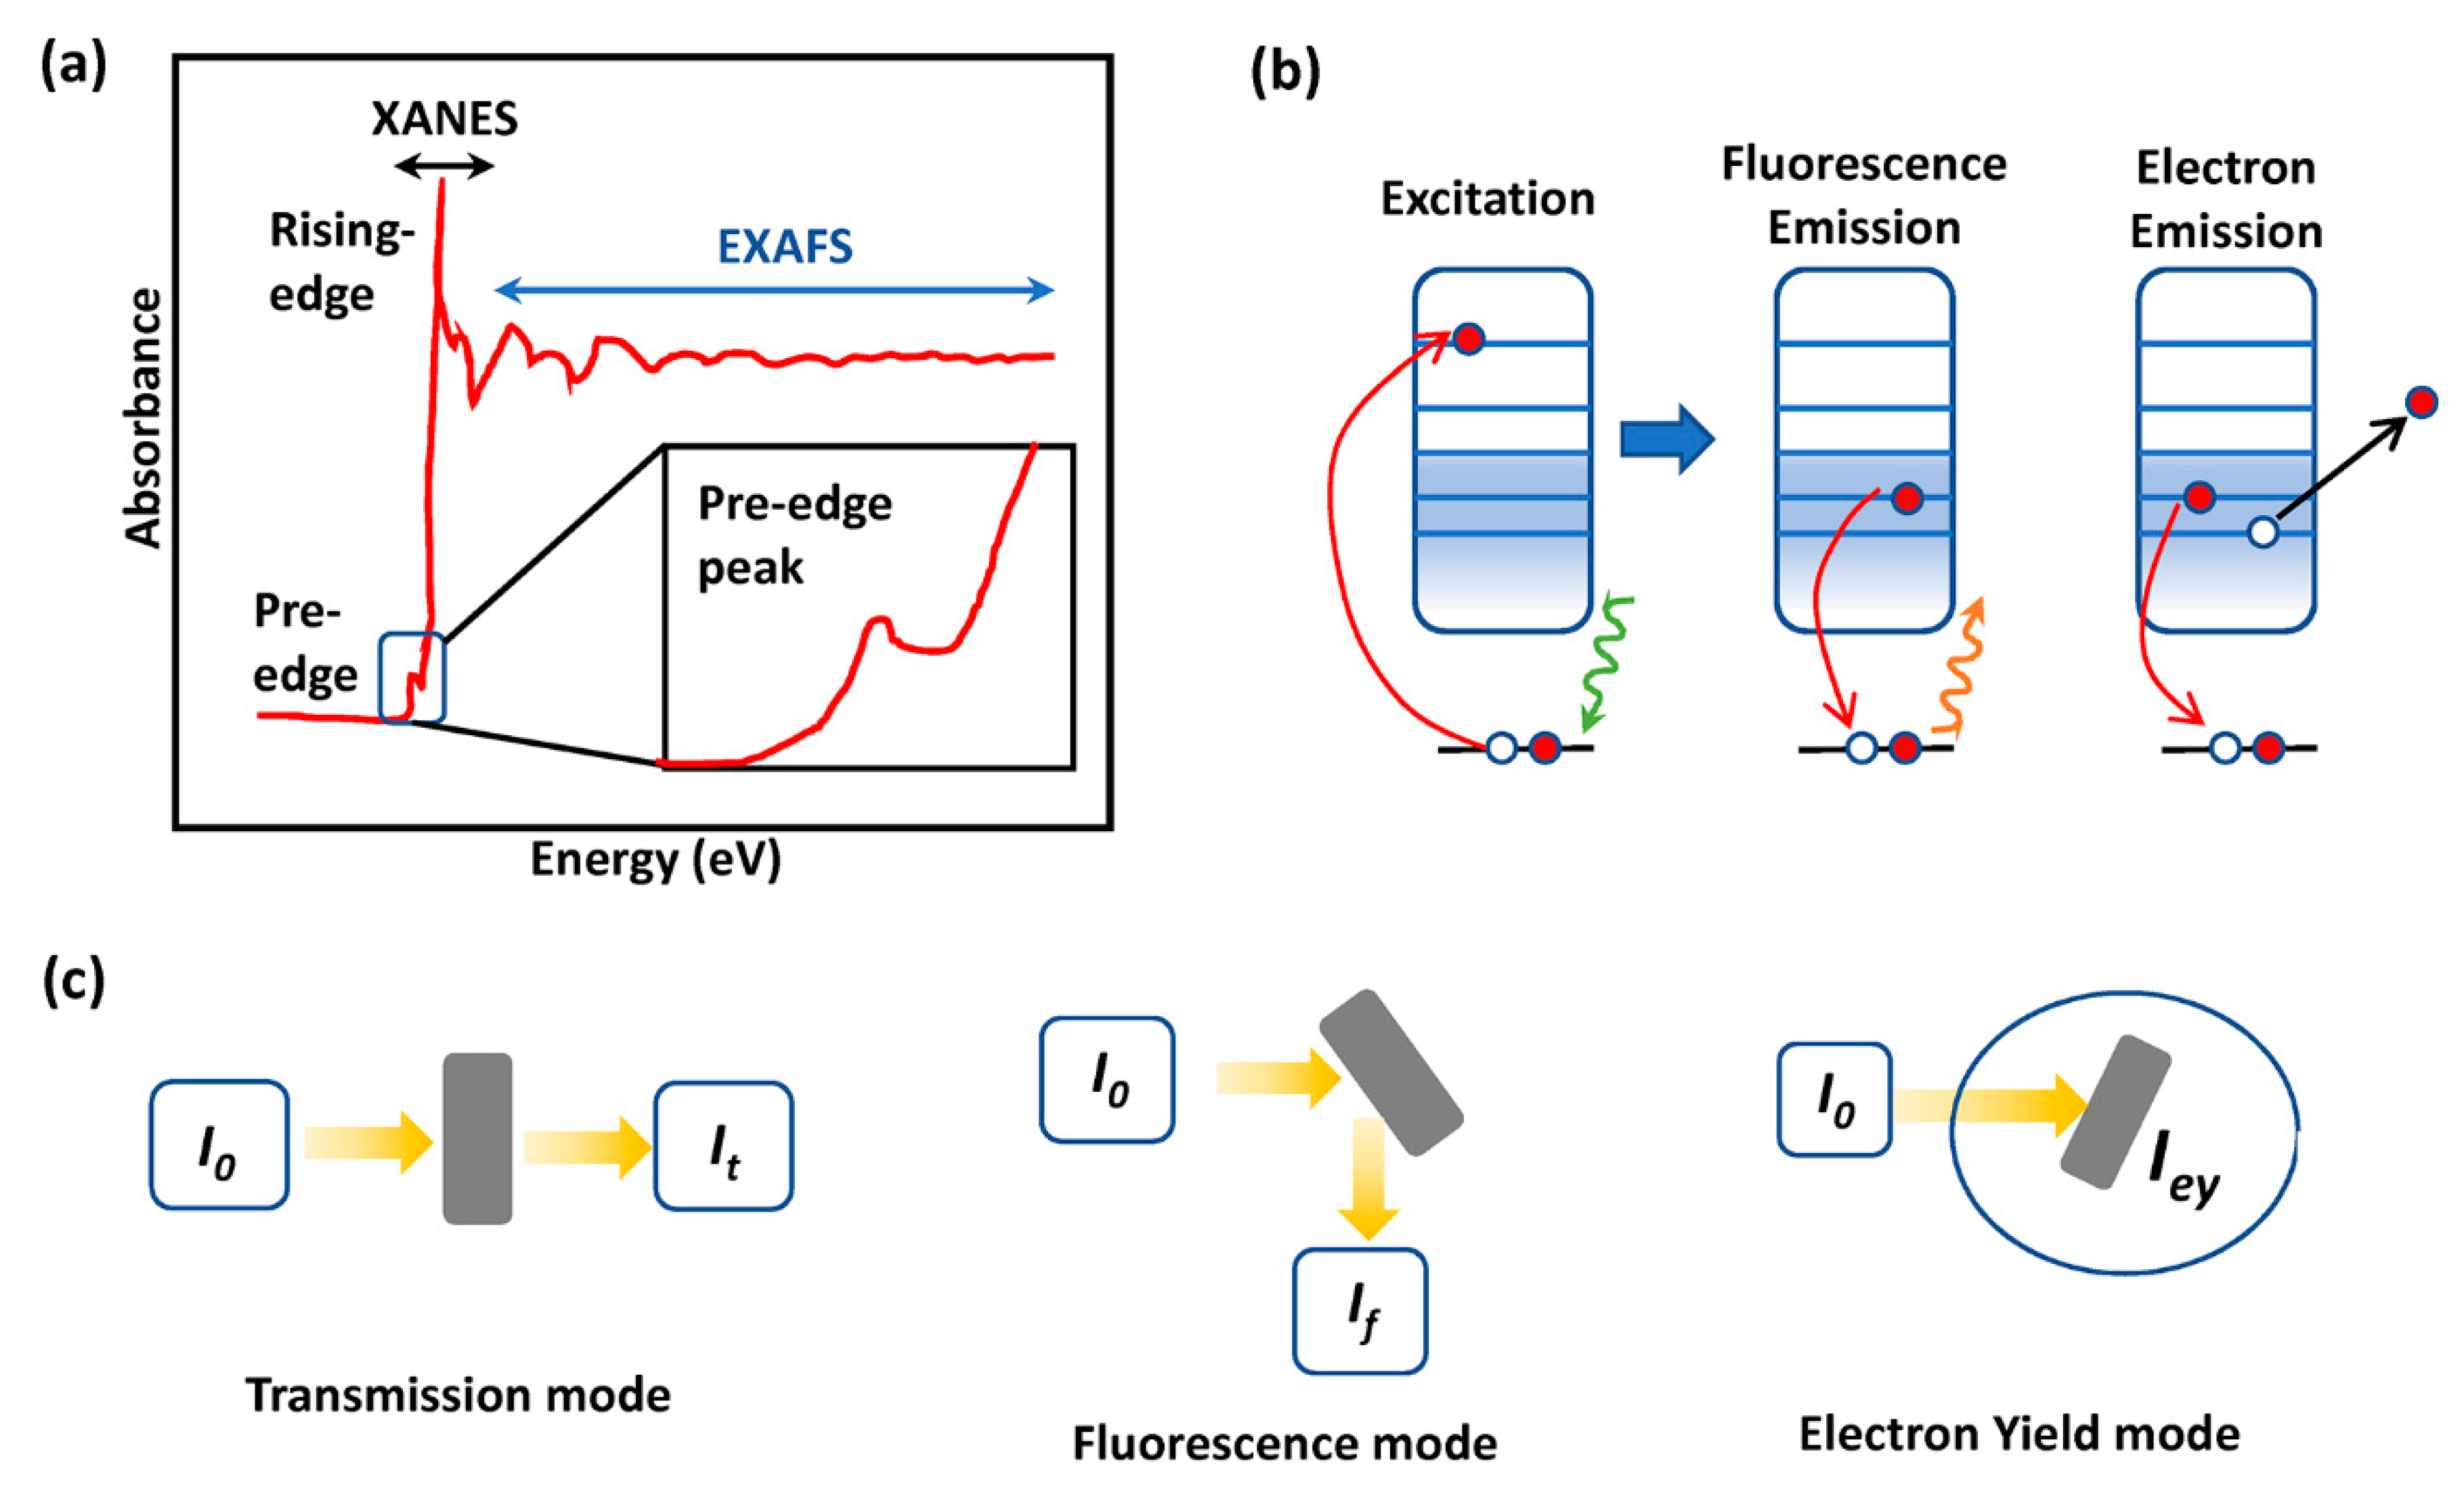
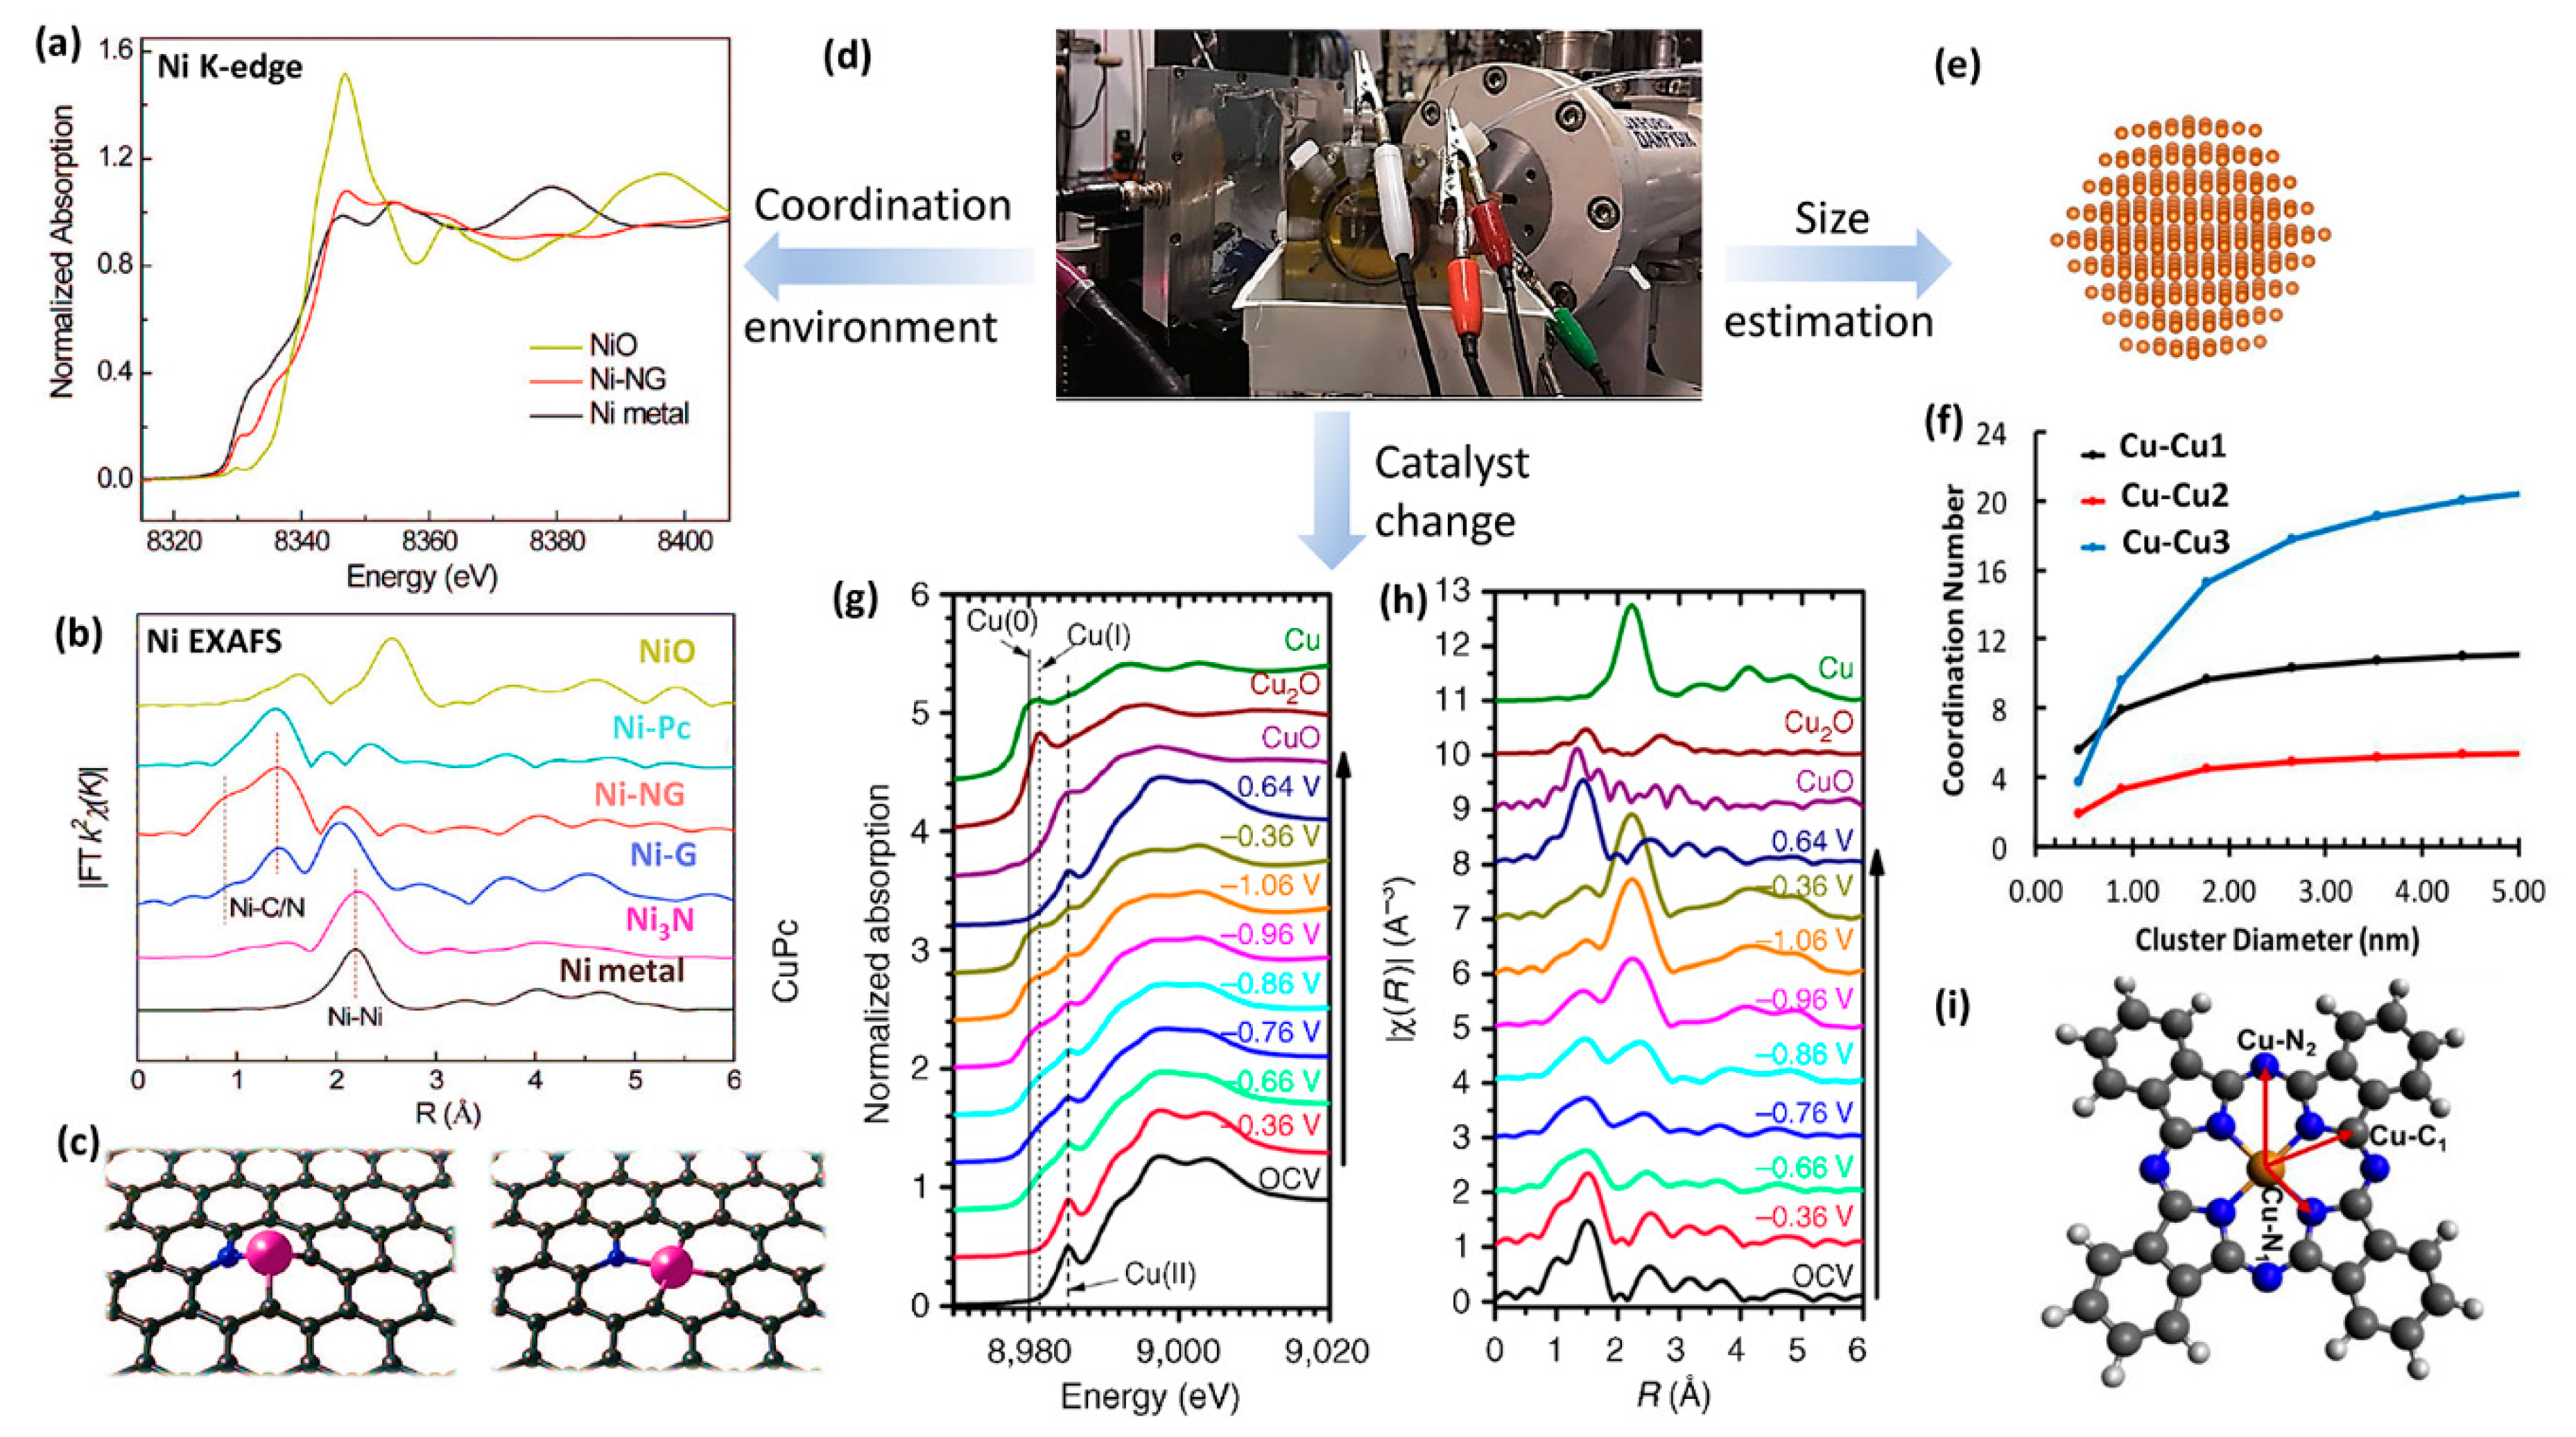
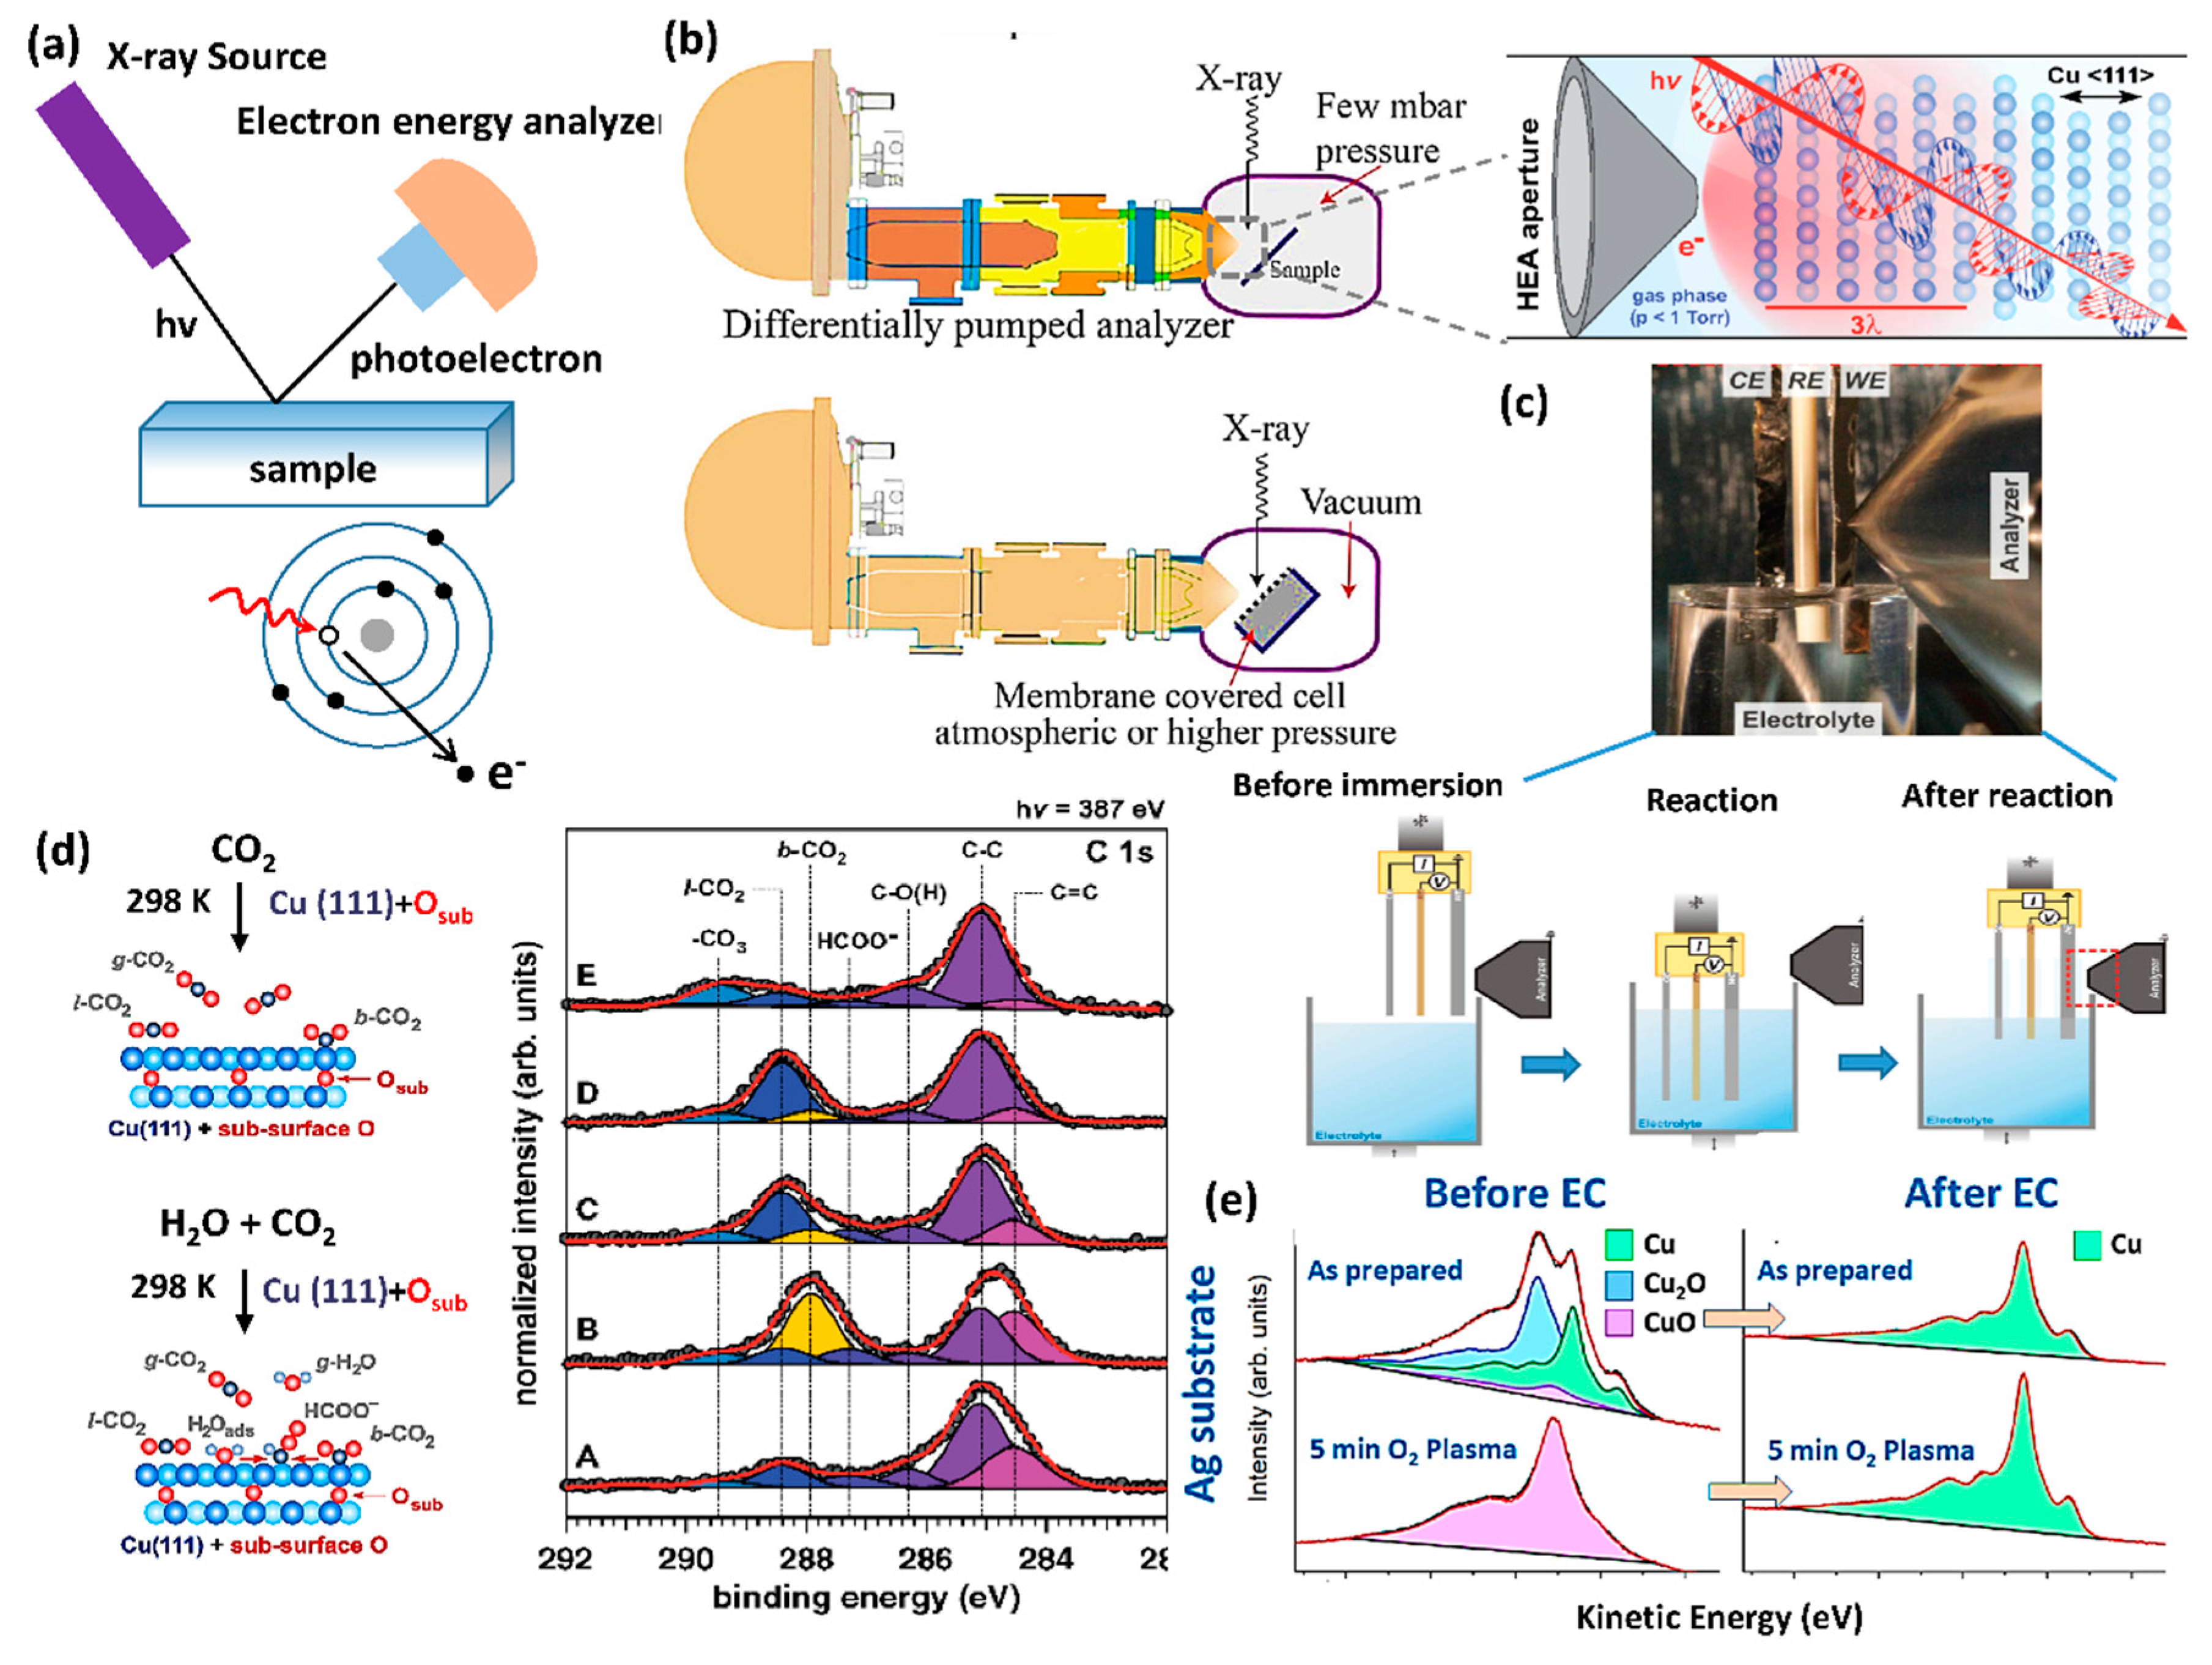
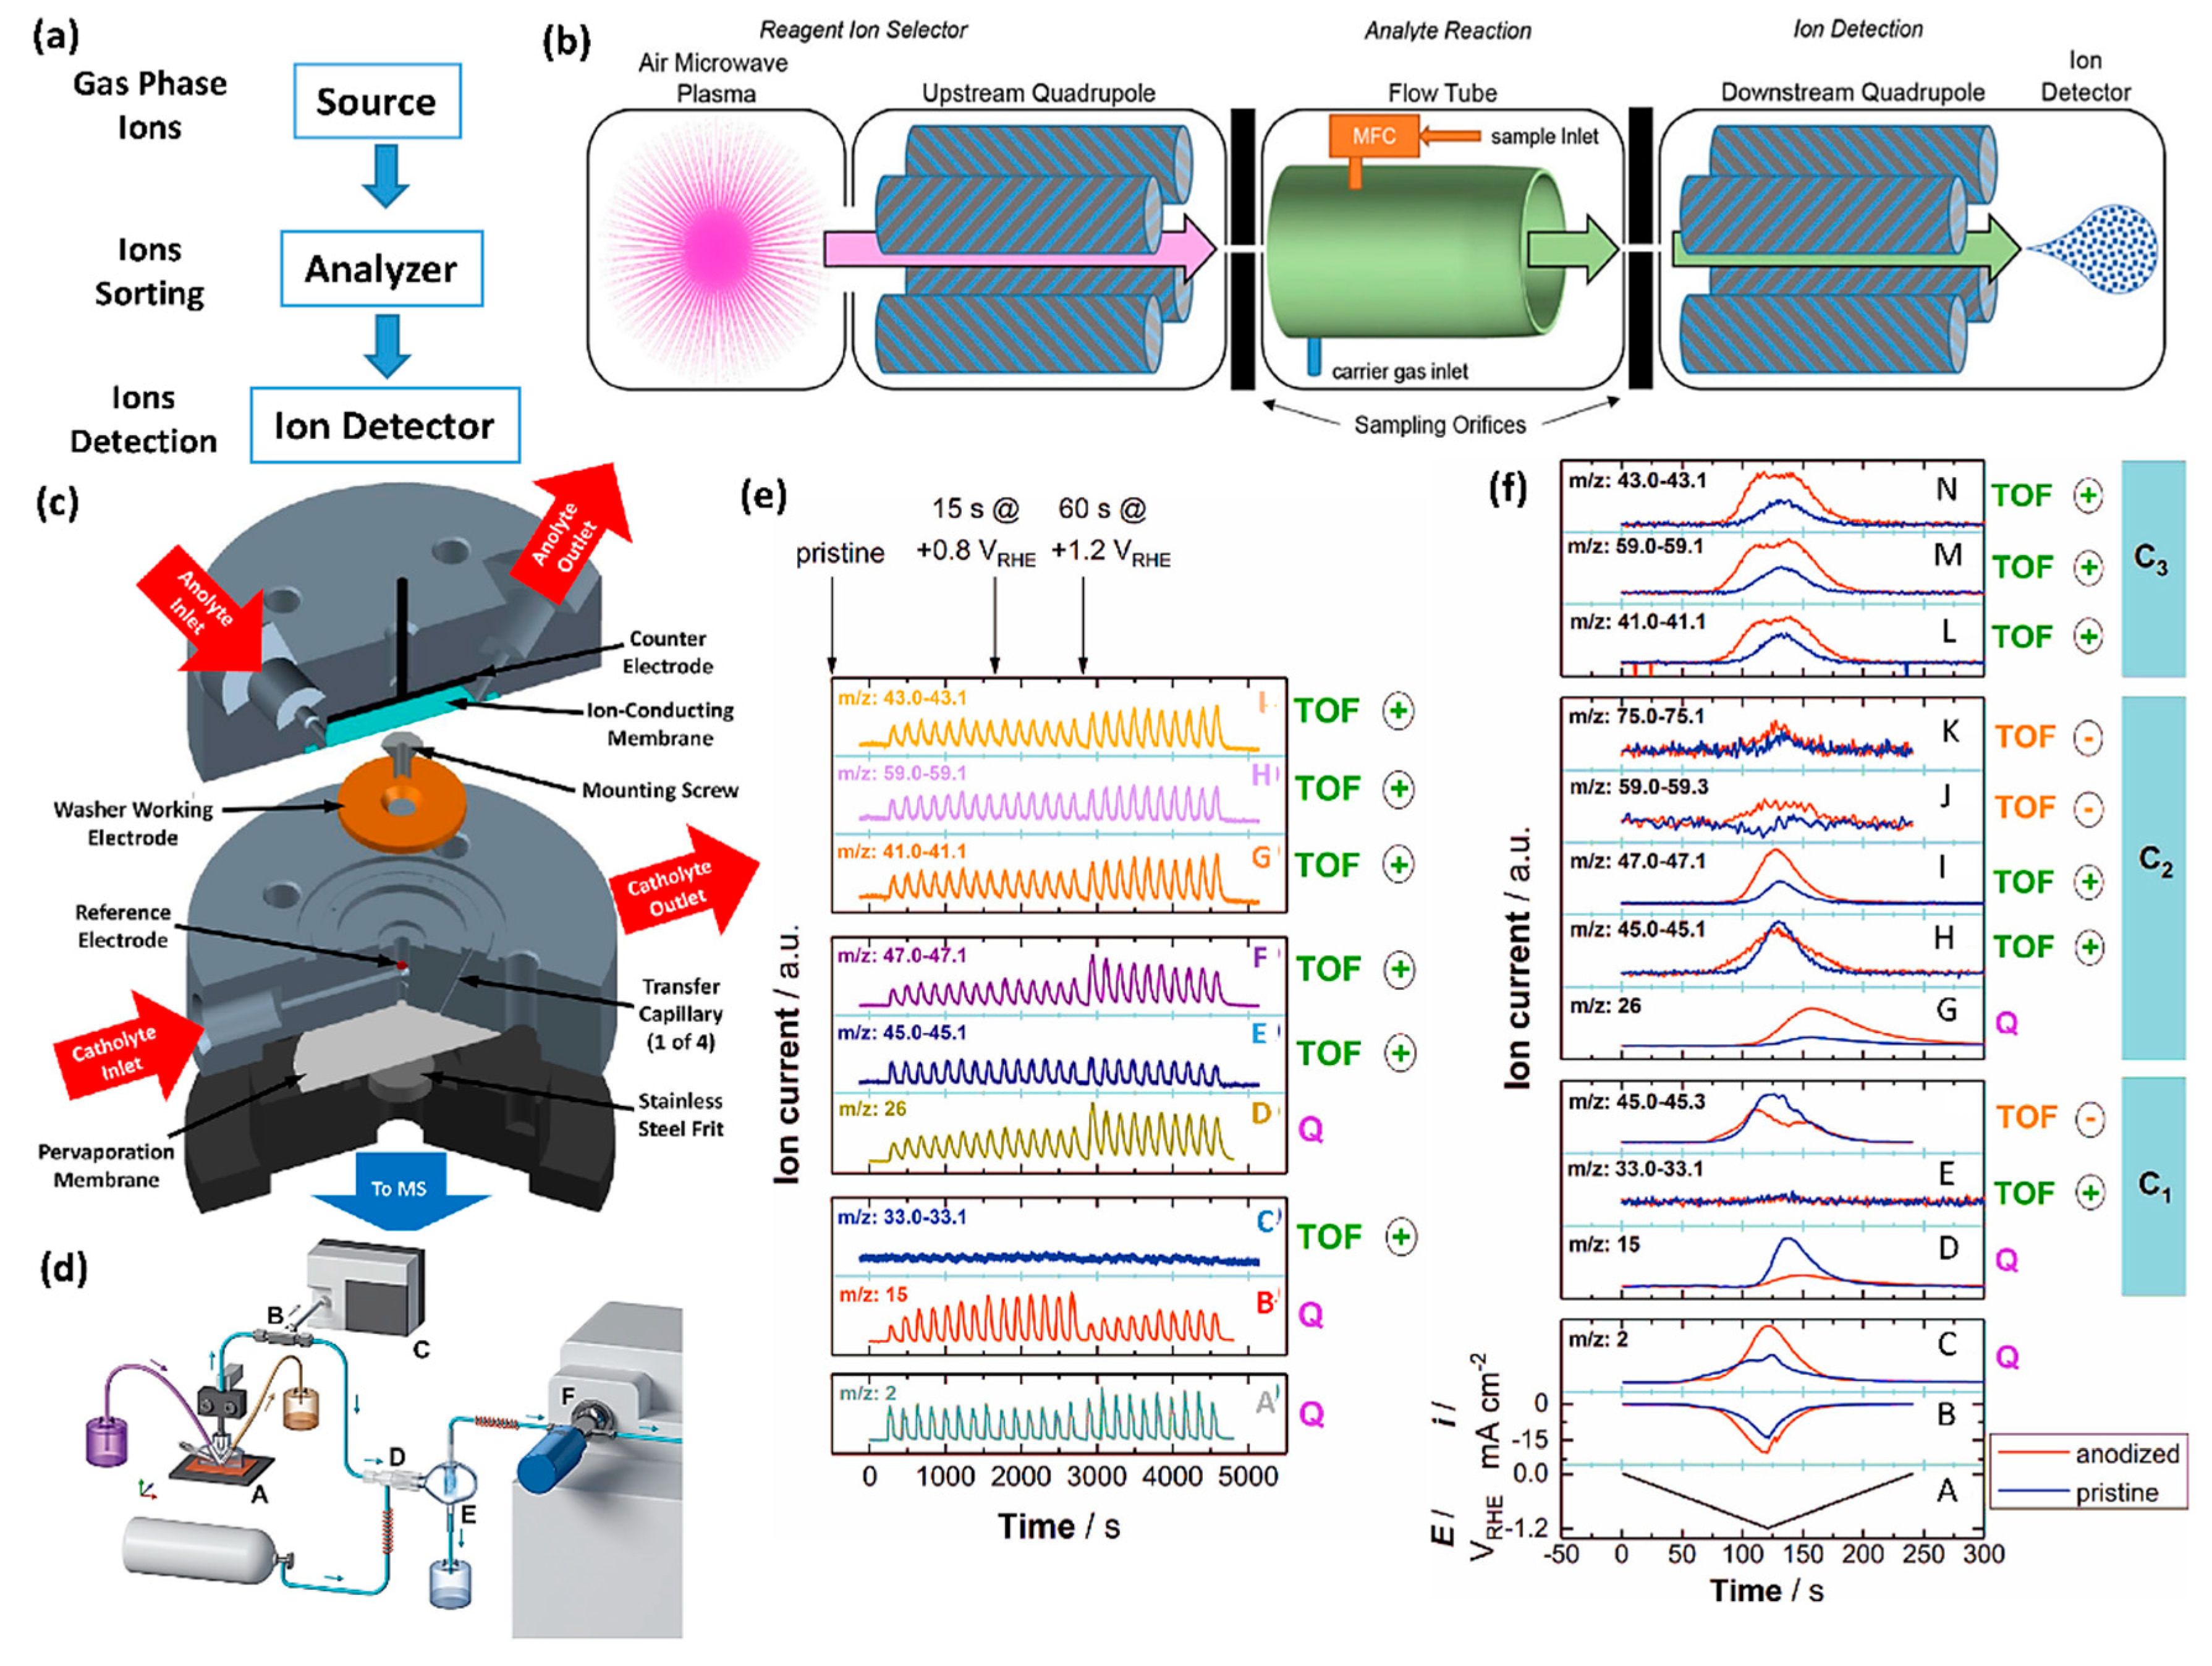
Table 1.
Summary of selected in situ spectroscopies for CO2RR.
| Technique | Probed Information | Merits | Limitation |
|---|---|---|---|
| IR | Absorption of molecular vibrations | Non-destructive sampling Useable from ultrahigh vacuum to atmospheric pressures Useable in vacuum, gaseous, liquid and even solid phases | Limited IR transmission Indirect information Macroscopic information |
| RS | Inelastically scattered light | Non-destructive sampling Easy sample preparation Fast spectra acquisition within seconds Not interfered by water Wide spectra region (4000–50 cm−1) | Low spatial resolution Macroscopic information Fluorescence interference Unable to detect the intermediates with low scattering cross-sections |
| XAS | Absorption coefficient | Element specific Metal site sensitive Not limited by the sample state (powder, solution, frozen solution) | Average information Hard to detect light elements |
| XPS | Kinetic energy and number of electrons that escape from the material | Nondestructive Surface sensitive (10–200 Å) Almost all elements (except H, He) High information content | Low atomic resolution Pressure gap Limited time resolution Limited spatial resolution |
| MS | Mass-to-charge ratio of ions | High accuracy (<1 ppm) Consume little sample | Limited product collection |
© 2020 by the authors. Licensee MDPI, Basel, Switzerland. This article is an open access article distributed under the terms and conditions of the Creative Commons Attribution (CC BY) license (http://creativecommons.org/licenses/by/4.0/).
Share and Cite
MDPI and ACS Style
Jin, L.; Seifitokaldani, A. In Situ Spectroscopic Methods for Electrocatalytic CO2 Reduction. Catalysts 2020, 10, 481. https://0-doi-org.brum.beds.ac.uk/10.3390/catal10050481
AMA Style
Jin L, Seifitokaldani A. In Situ Spectroscopic Methods for Electrocatalytic CO2 Reduction. Catalysts. 2020; 10(5):481. https://0-doi-org.brum.beds.ac.uk/10.3390/catal10050481
Chicago/Turabian StyleJin, Lei, and Ali Seifitokaldani. 2020. "In Situ Spectroscopic Methods for Electrocatalytic CO2 Reduction" Catalysts 10, no. 5: 481. https://0-doi-org.brum.beds.ac.uk/10.3390/catal10050481
Note that from the first issue of 2016, this journal uses article numbers instead of page numbers. See further details here.