Particle Number Emissions of a Diesel Vehicle during and between Regeneration Events

European Commission–Joint Research Centre, 21027 Ispra, Italy
Catalysts 2020, 10(5), 587; https://0-doi-org.brum.beds.ac.uk/10.3390/catal10050587
Submission received: 25 April 2020
/
Revised: 16 May 2020
/
Accepted: 21 May 2020
/
Published: 23 May 2020
(This article belongs to the Special Issue Catalytic Treatment of Air Pollutants (VOCs, PACs, PCDDs/PCDFs, Soot, NOx, CO))
Abstract
:All modern diesel vehicles in Europe are equipped with diesel particulate filters (DPFs) and their particle number (PN) emissions at the tailpipe are close to ambient air levels. After the Dieselgate scandal for high NOx emissions of diesel vehicles on the road, the high PN emissions during regeneration events are on the focus. The PN emissions of a diesel vehicle on the road and in the laboratory with or without regeneration events were measured using systems with evaporation tubes and catalytic strippers and counters with lower sizes of 23, 10 and 4 nm. The tests showed significant PN levels only during engine cold starts with a big fraction of sub-23 nm particles during the first minute. After the first seconds the sub-23 nm fraction was negligible. Urea injection at the selective catalytic reduction (SCR) for NOx system did not affect the PN levels and the sub-23 nm fraction. The emissions during regeneration events were higher than the PN limit, but rapidly decreased 2-3 orders of magnitude below the limit after the regeneration. Artificially high sub-10 nm levels were seen during the regeneration (volatile artifact) at the system with the evaporation tube. The regenerations were forced every 100–350 km and the overall emissions including the regeneration events were two to four times lower than the current laboratory PN limit. The results of this study confirmed the efficiency of DPFs under laboratory and on-road driving conditions.
1. Introduction
Dieselgate brought NOx emissions of diesel vehicles in the center of attention [1]. Since then, changes in the regulation with the introduction of the real-driving emissions (RDE) and the worldwide harmonized light vehicle test procedure (WLTP) have led to low NOx emissions of modern diesel vehicles [2]. All diesel vehicles are equipped with diesel particulate filters (DPFs) in order to fulfill the nonvolatile particle number (PN) limits in Europe [3,4]. The PN levels at the tailpipe are at ambient air levels, making diesel vehicles one of the cleanest technologies, with low fuel consumption. However, soot is accumulated in DPFs and in order to avoid high increases of the backpressure and fuel penalties, this soot needs to be periodically regenerated. The emissions during regeneration were the subject of many studies in the past [5,6,7]. The studies showed that emission levels are high, sometimes exceeding the PN limit of the regulation [8]. Very often volatile nucleation mode appeared [9]. The regeneration emissions are in the focus again as a recent report showed that PN spikes 1000 times more than the non-regenerating levels can be produced [10]. In the European Union (EU), the emissions of gaseous pollutants and particulate matter (PM) mass during regenerations are not restricted by any limit, but only the weighted emissions over the regeneration distance. However, this does not apply to PN emissions. This means that up to 99% of emitted particles could be ignored [10]. A study that summarized data from regenerations showed that the weighted emissions are still below the PN limit even though the emissions during regeneration can exceed ten times the PN limit of 6 × 10¹¹ p/km [11]. The frequency of regeneration events varies from 250 to 800 km [11,12,13]. Assuming that a diesel vehicle is driven 20,000 km per year, a regeneration would be expected every 4–14 days.
The nonvolatile PN regulation was introduced in 2011 in order to force DPFs at diesel fueled vehicles [3]. A lower size of 23 nm was selected in order to avoid the high variability from volatile particles typically residing at sizes <20 nm. As the typical size distributions had median sizes of >50 nm, the majority of the emitted particles were covered by the regulation. Recent testing with heavy-duty diesel engines showed that particles below 23 nm could be 2–3 times higher than the >23 nm concentrations [11,14]. This was mainly attributed to urea particles [15]. However, also studies with light-duty vehicles have shown sub-23 nm fractions of >50%, not only for gasoline fueled vehicles [16], but also for diesel ones [11]. It was not clear though whether these particles are urea particles or artifacts from the measurement systems [17].
Objective of this paper is to assess the PN emissions of a diesel vehicle including regeneration events. The contribution of urea injection and cold start is also discussed. On-road and laboratory tests using systems with lower sizes of 4 nm, 10 nm and 23 nm are conducted. Furthermore, catalytic stripper based systems are compared with evaporation tube systems to assess the accuracy of the sub-23 nm measurements, especially during regenerations and cold starts.
2. Results
2.1. Emissions Over Distance
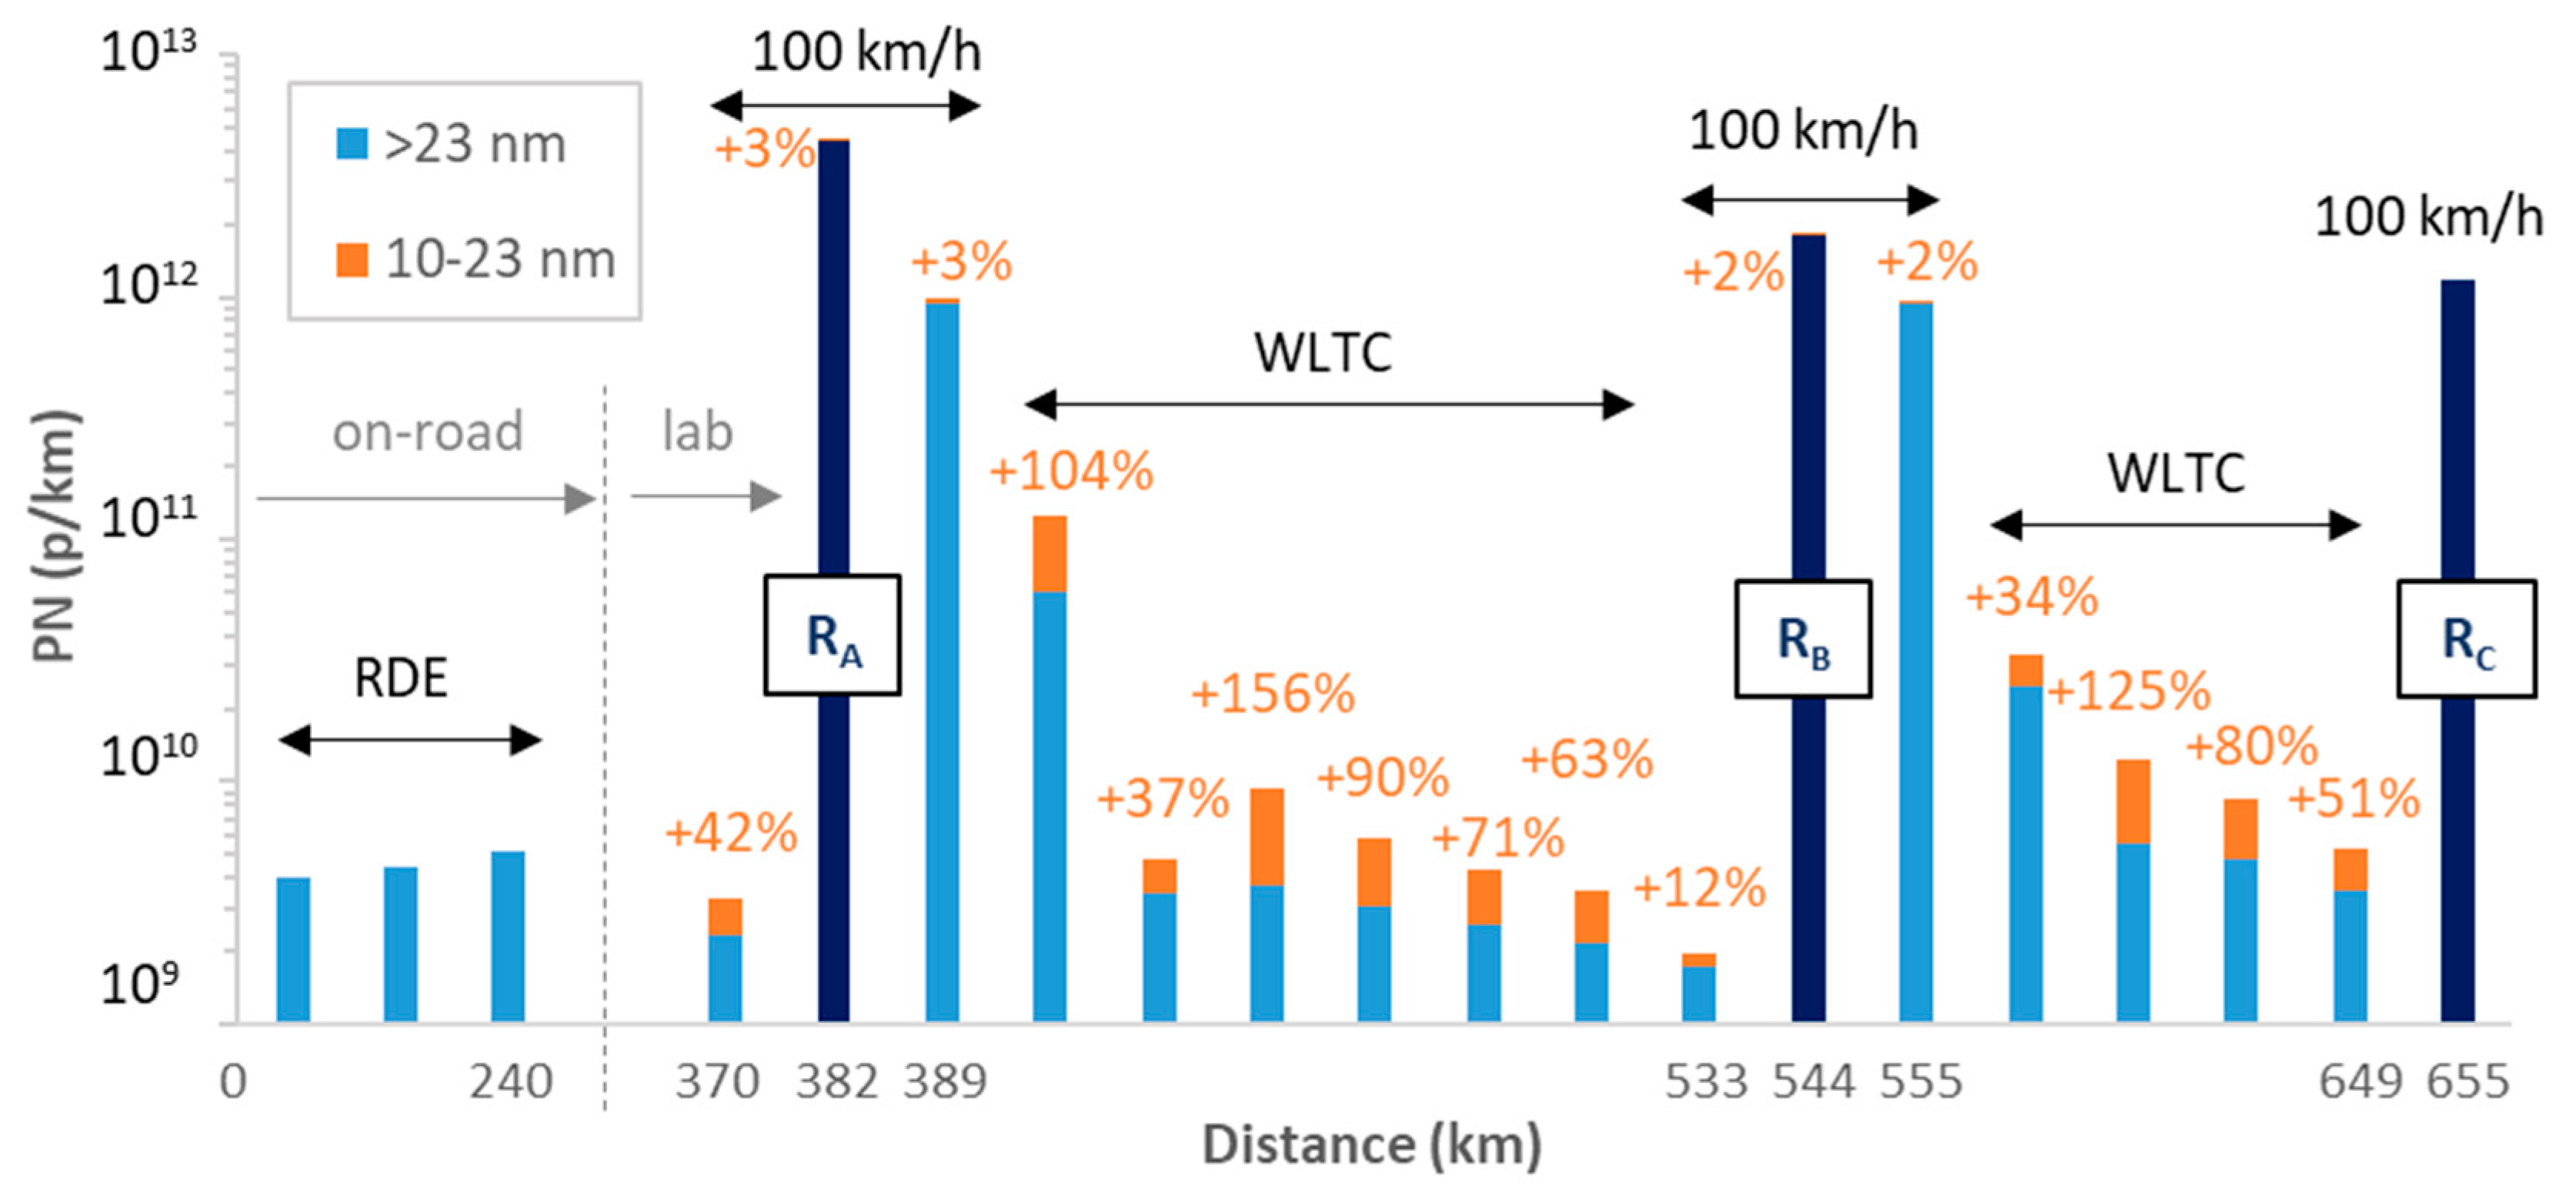
Figure 1 summarizes the nonvolatile PN emissions of the tests conducted on the road (RDE, first three) and in the laboratory (rest). The laboratory equipment could measure both >23 nm and >10 nm PN emissions, while the on-road portable emissions measurement system (PEMS) only >23 nm.
The emissions of the three on-road trips were approximately 5 × 10⁹ p/km. The DPF was regenerated in the laboratory driving at 100 km/h. Before the trigger of the regeneration, the emissions were 3 × 10⁹ p/km at 100 km/h, which is almost the background level of the facility. The regeneration lasted approximately 7 min (12 km) and the emissions were 4.4 × 10¹² p/km at 100 km/h. Immediately after the regeneration the emissions at 100 km/h were still elevated around 1 × 10¹² p/km. The first cold worldwide harmonized light-duty vehicles test cycle (WLTC), without any other preconditioning before, had emissions around 6 × 10¹⁰ p/km and the next five WLTCs around 3 × 10⁹ p/km. This behavior of DPFs is well known [12,18]. The next forced regeneration at 100 km/h lasted less than 7 minutes (11 km) and the emissions were 1.7 × 10¹² p/km. For the next 11 km the emissions were elevated. Similarly, the first cold WLTC had relatively higher emissions than the subsequent three. A final regeneration after the four WLTCs gave emissions 1.2 × 10¹² p/km and lasted only 3.5 minutes.
The concentration of particles between 10 and 23 nm were 2%–3% of the >23 nm concentration levels during or immediately after regeneration events, but 80% on average for the WLTCs. Their origin will be analyzed separately in the next sections.
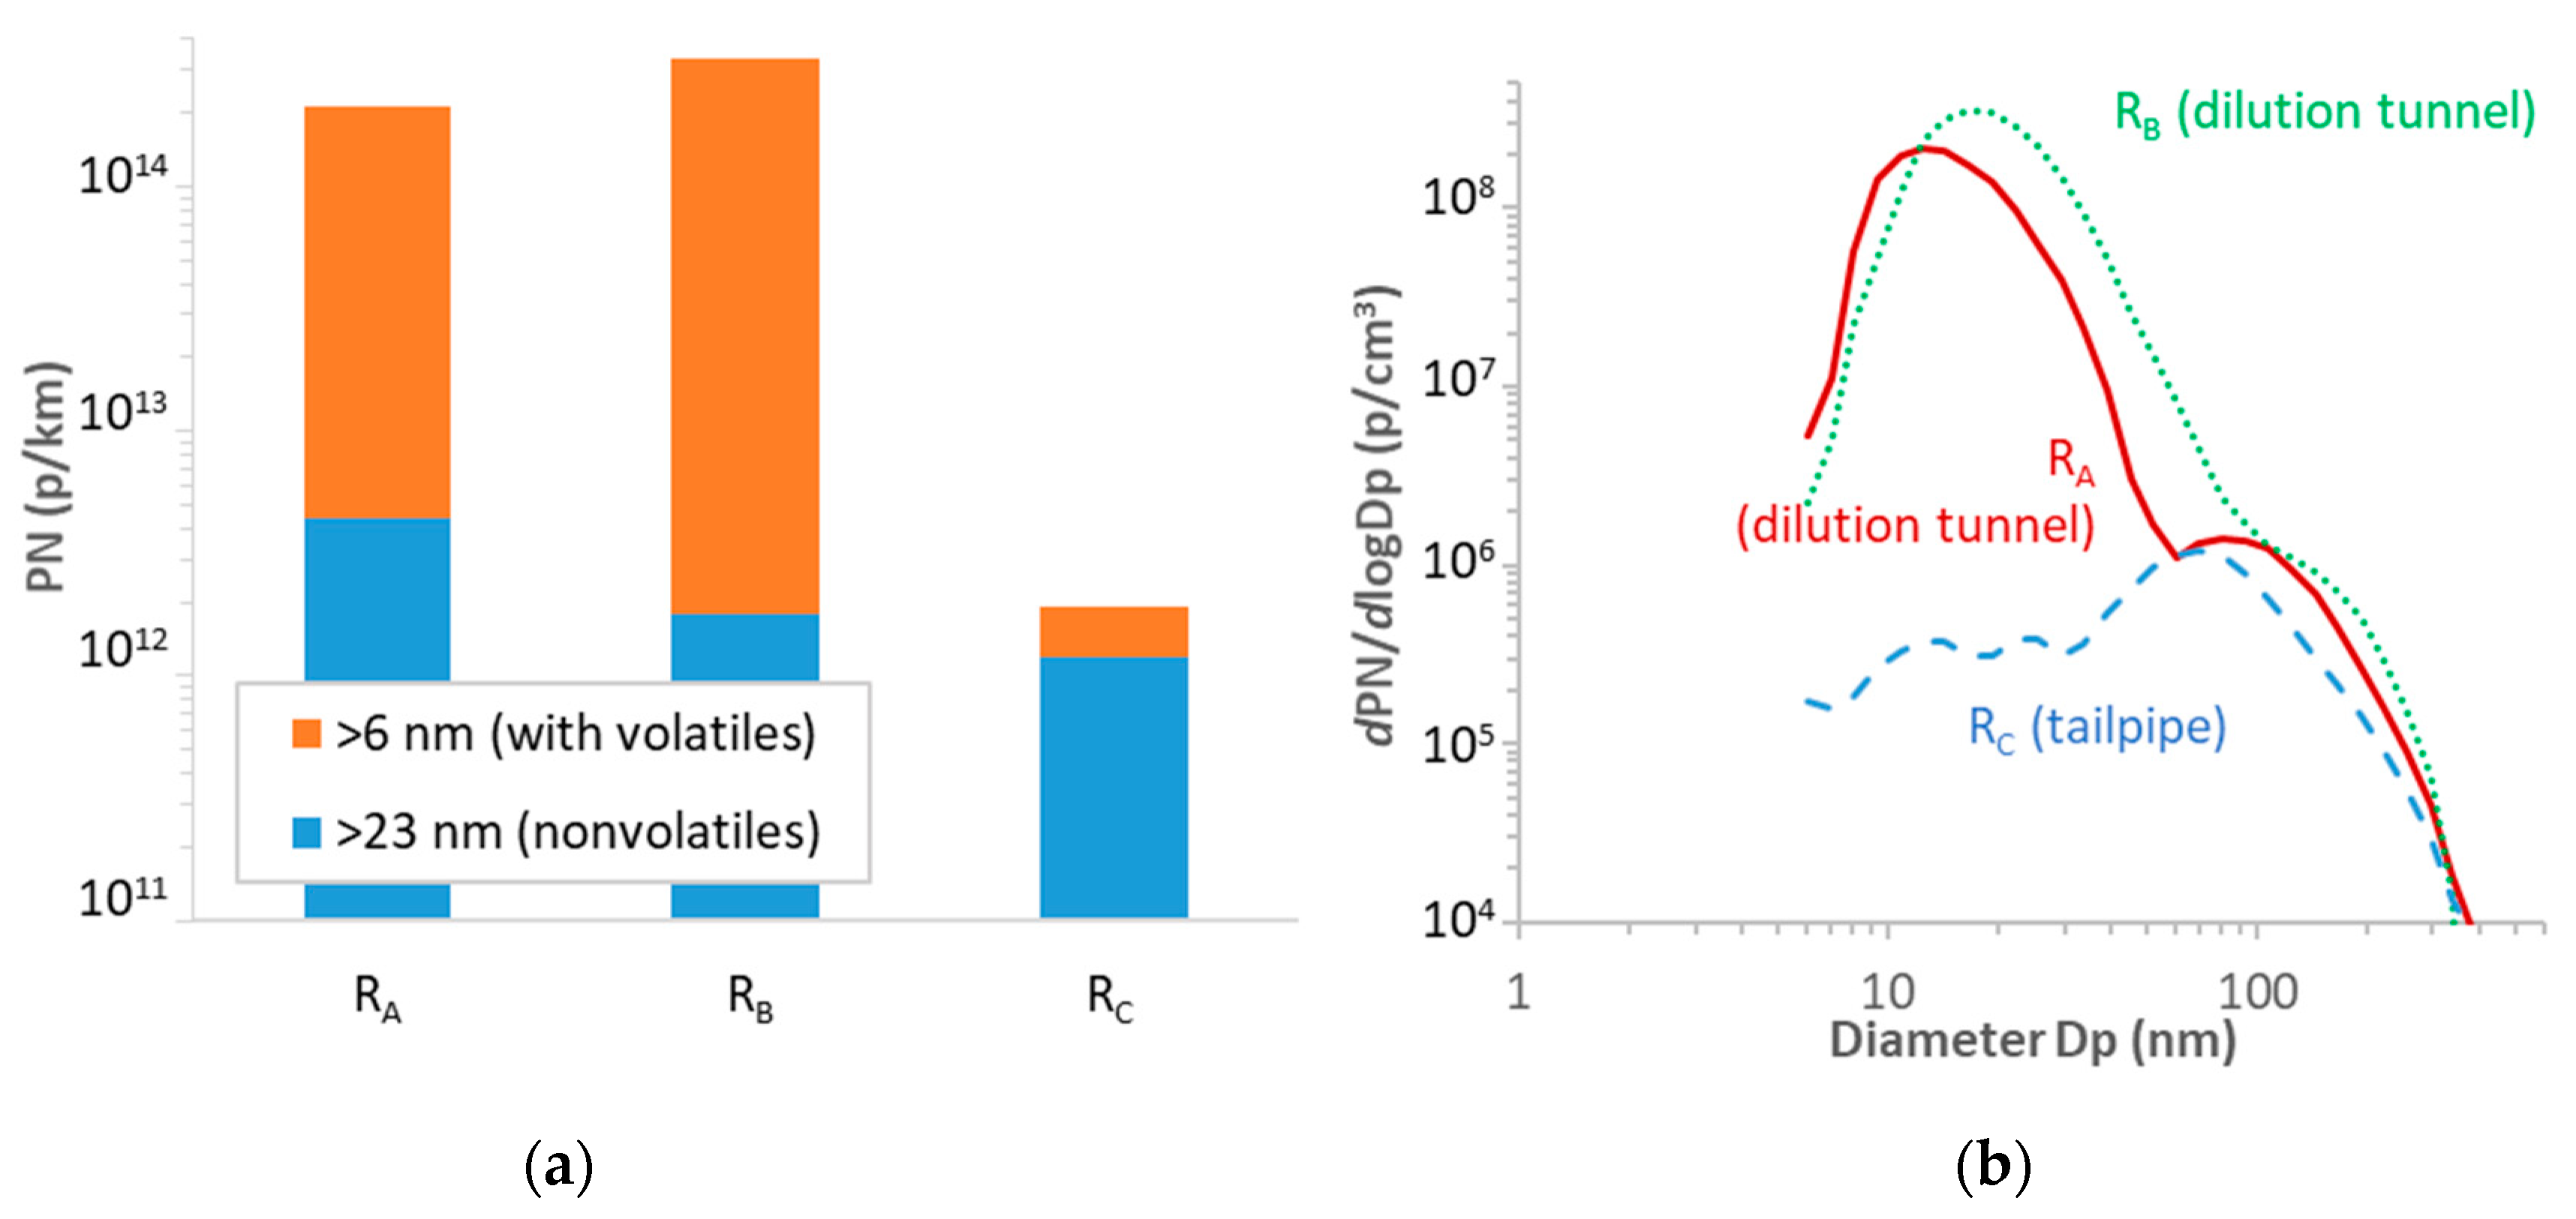
The emissions of all particles (including volatiles) were not plotted because the instrument, an engine exhaust particle sizer (EEPS), was measuring downstream of a diluter at ambient temperature and was at its noise levels with the exception of the cold start peaks. For all non-regenerating cycles there was no evidence of additional particles. During two regenerations the emissions reached 2–3 × 10¹⁴ p/km with a nucleation mode peaking at 20 nm (Figure 2). However, when the size distributions instrument EEPS was placed at the tailpipe with a diluter at ambient temperature, the concentration of volatiles was very low. The size distributions showed that during tailpipe sampling the nucleation mode was absent or at sizes <6 nm (the lower cut off size of the instrument used).
2.2. Urea Particles
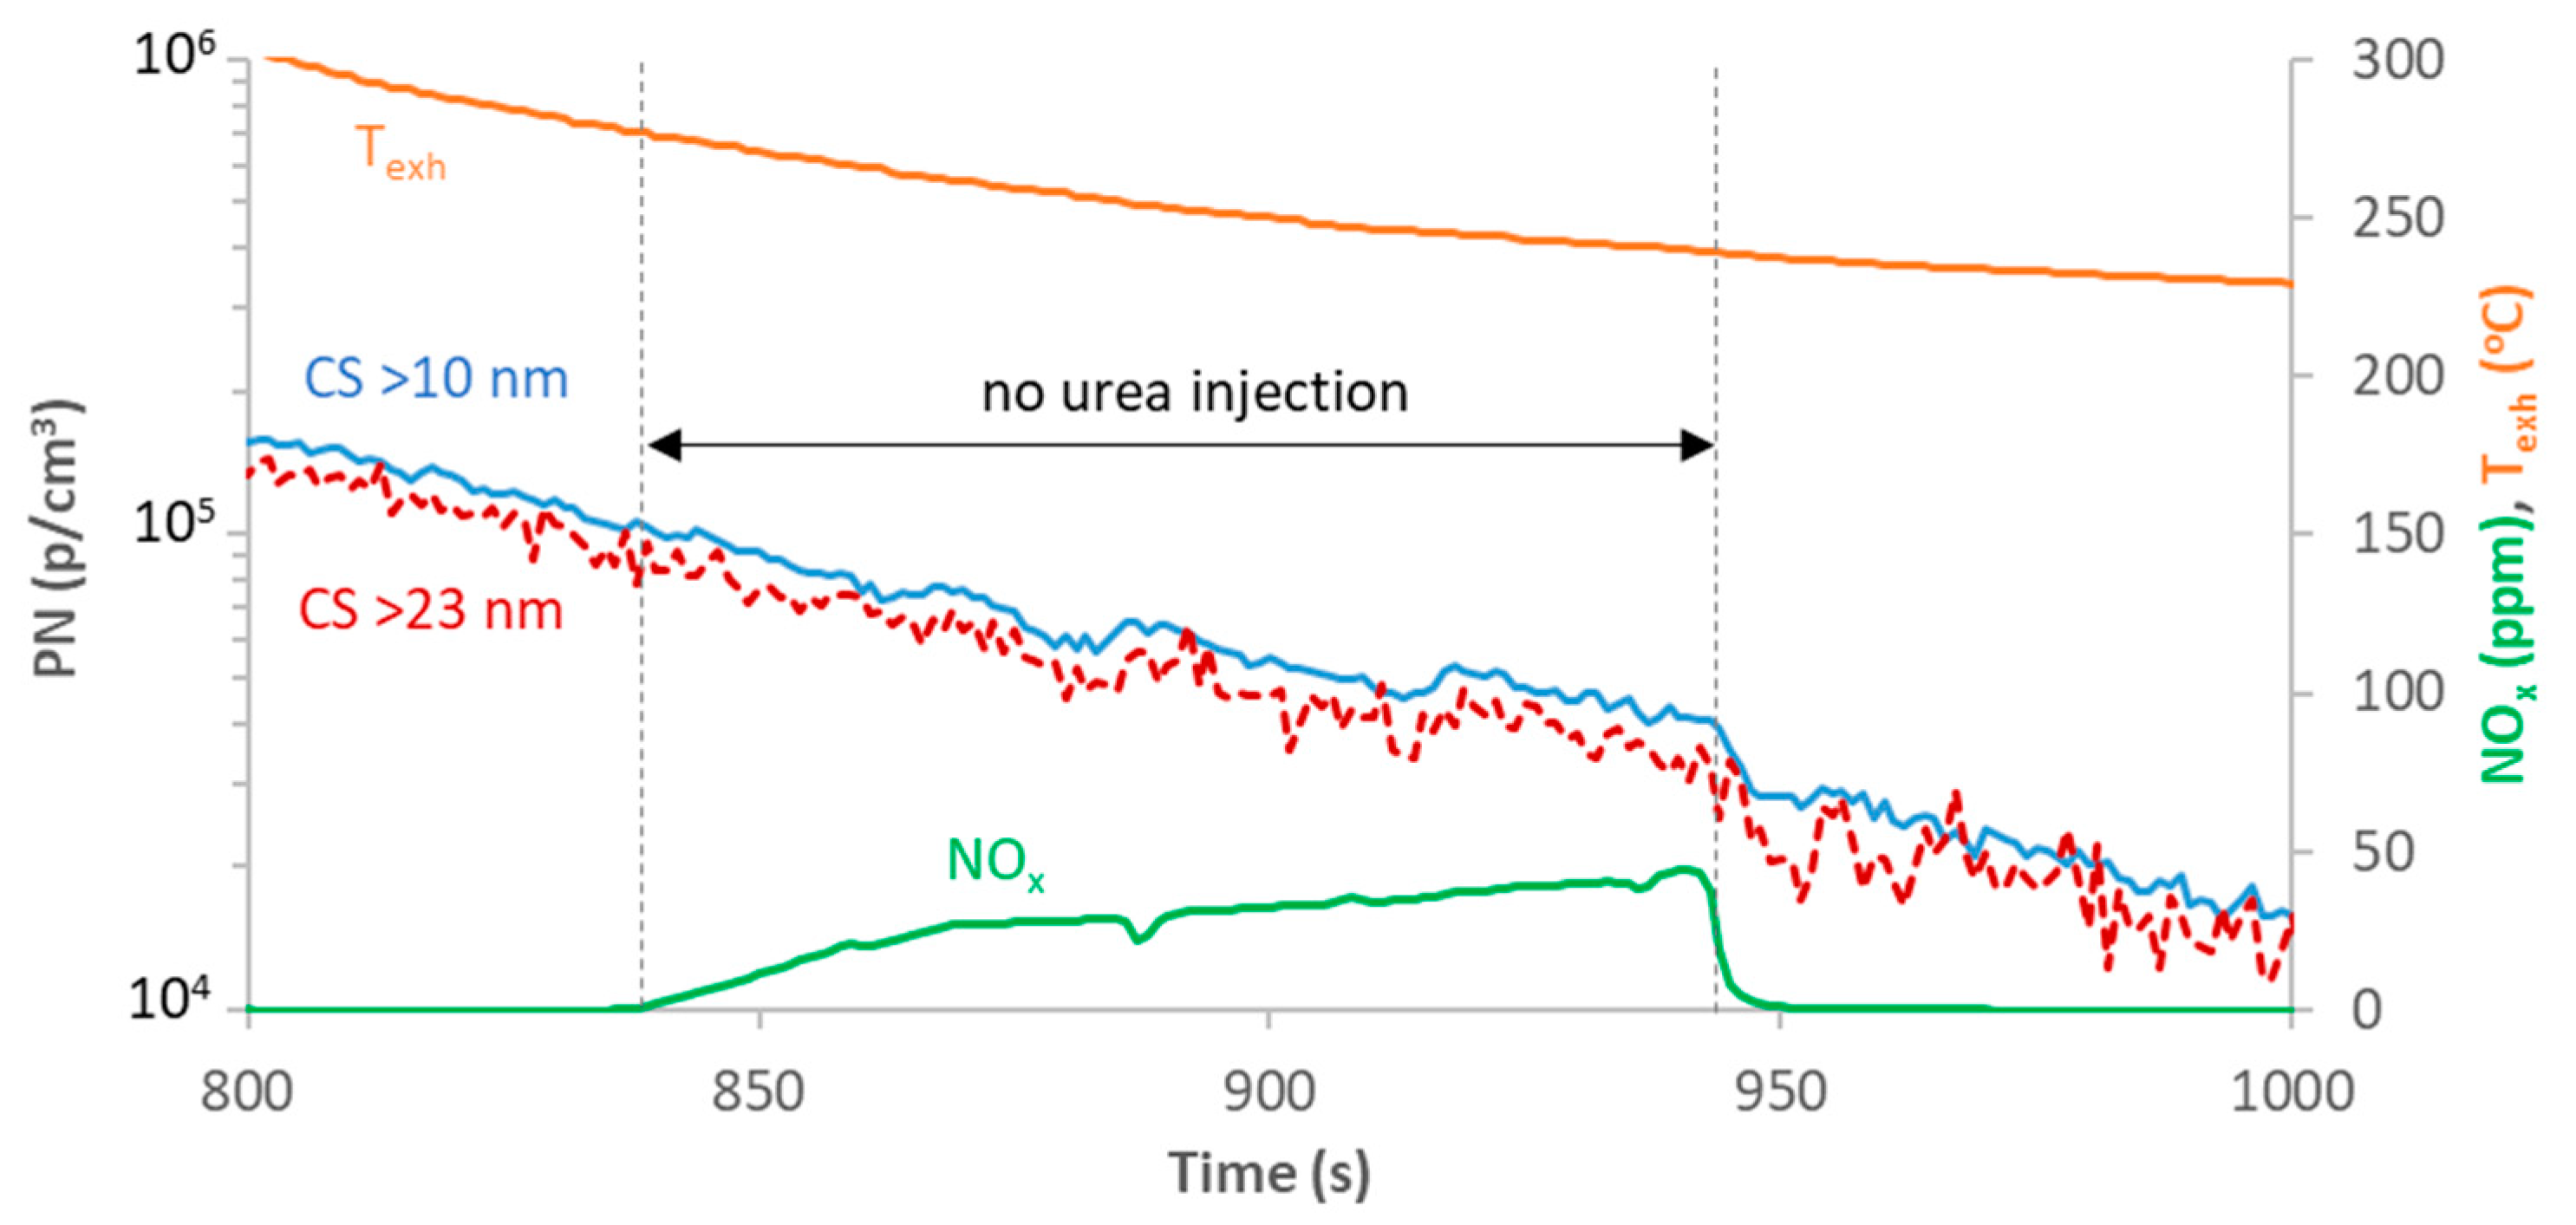
Figure 3 plots the nonvolatile PN concentrations > 23 nm and > 10 nm with the catalytic stripper system (CS1) over time. The test was done at constant speed at 100 km/h immediately after a regeneration event in order to have measurable PN concentrations. Both > 23 nm and > 10 nm concentrations were gradually decreasing. Urea was not injected between 830 and 945 s, as the relatively high NOx levels show. The ratio of > 23 nm and > 10 nm did not change indicating no contribution of nanoparticles from urea injection. The selective catalytic reduction (SCR) catalyst was coated on the DPF, thus it is very likely that any formed particles were efficiently trapped in the DPF.
2.3. Cold Start
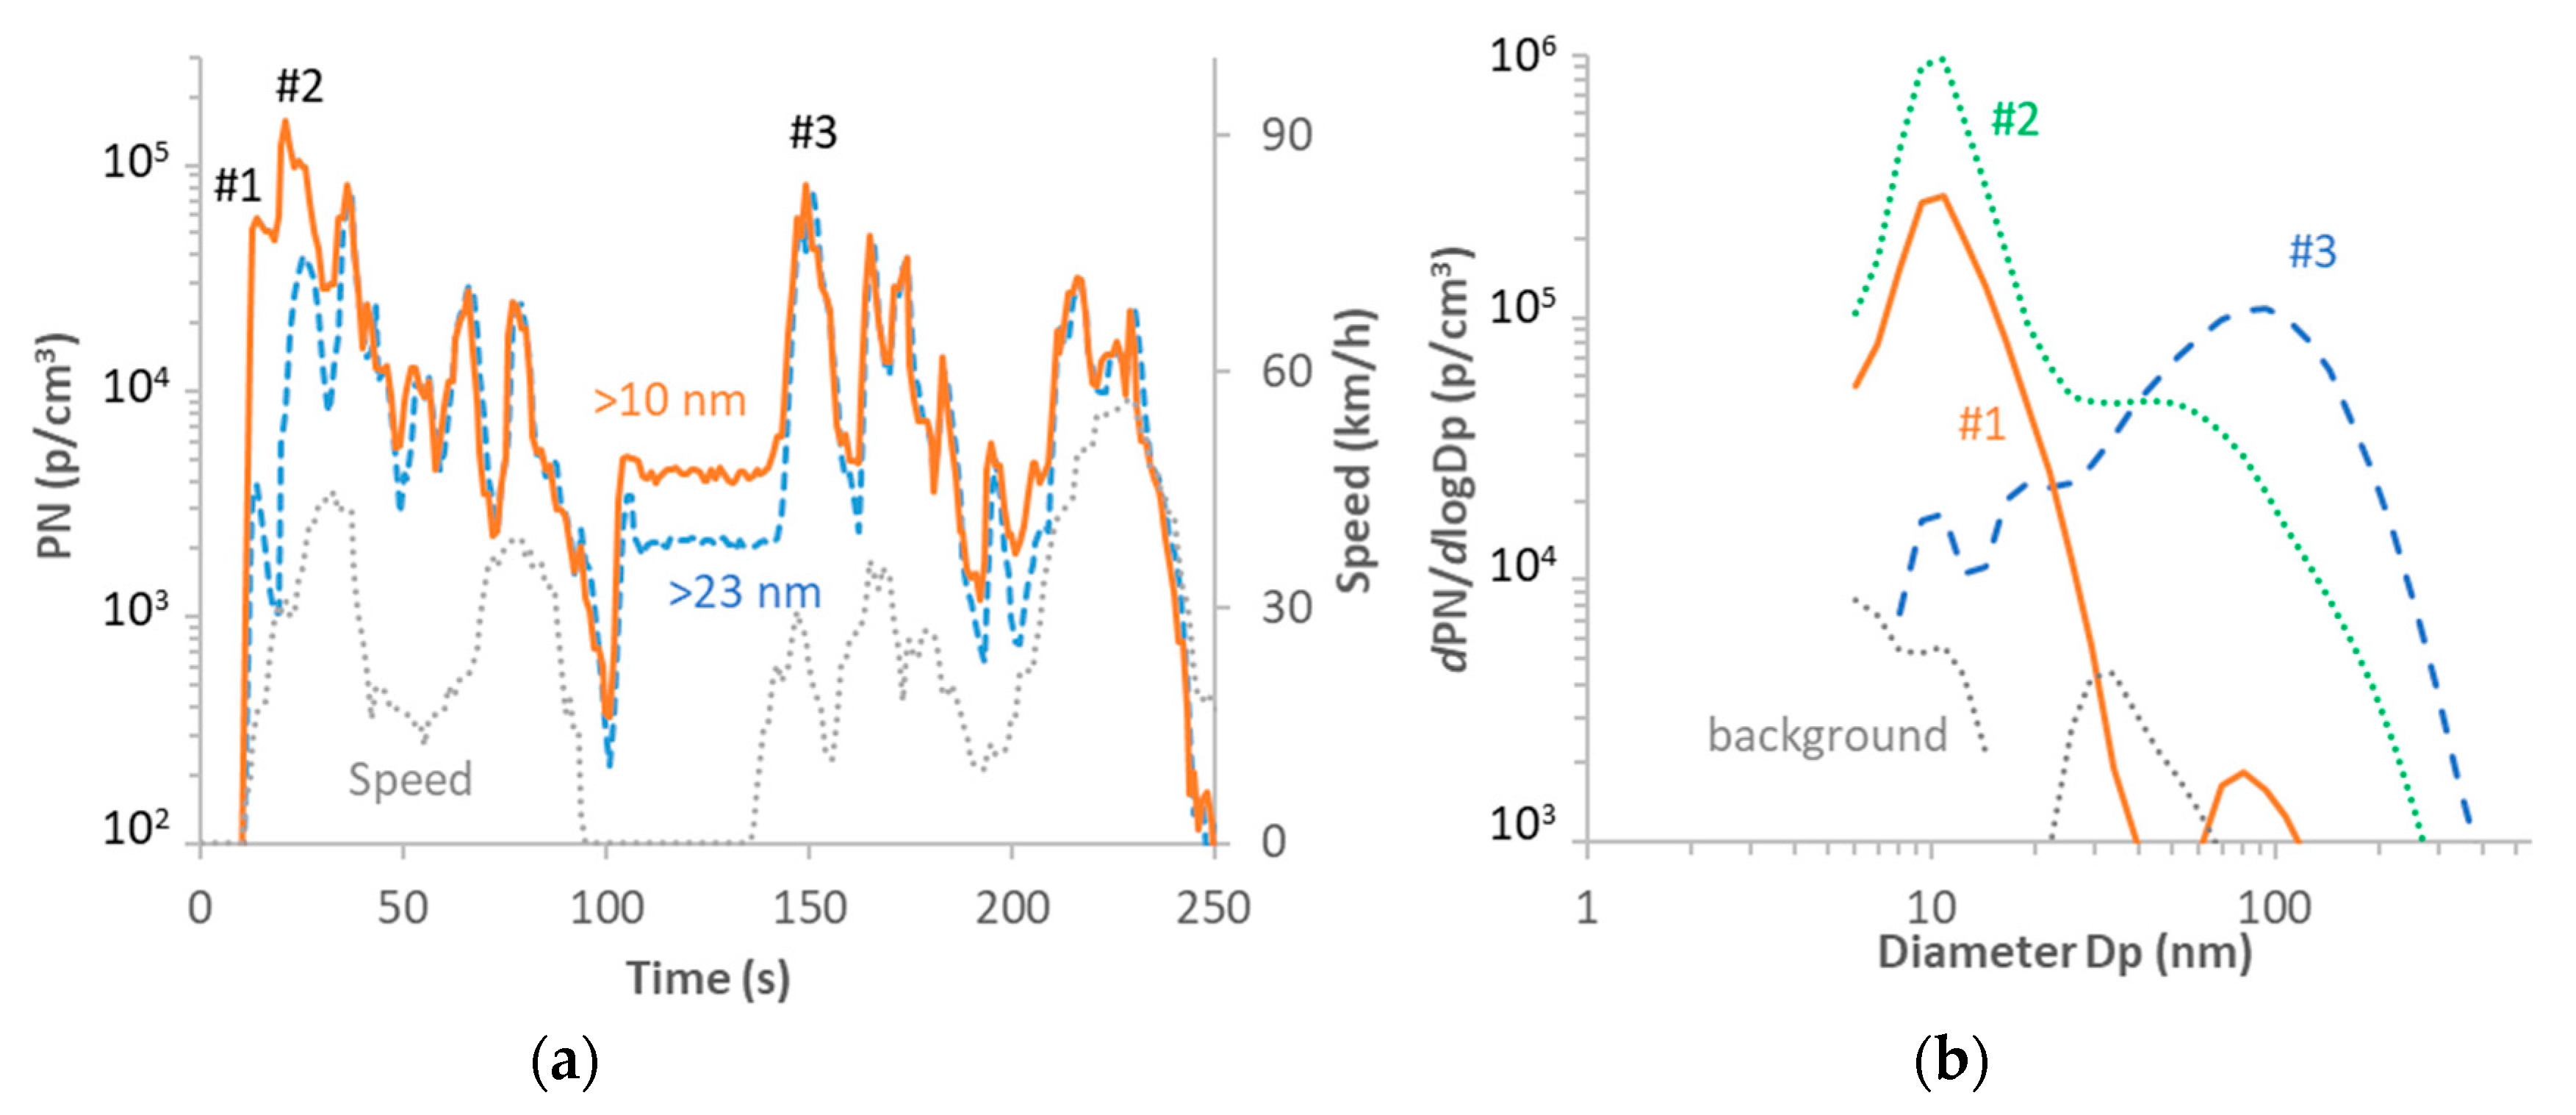
The first 250 s of a cold engine start WLTC are plotted in Figure 4a, along with the nonvolatile particle number distributions at three specific time points (Figure 4b). The first size distribution (#1, t = 15 s) corresponded to the engine start and it consisted mainly of a nonvolatile nucleation mode peaking at around 11 nm. The short delay had to do with the residence time in the transfer tube from the vehicle tailpipe to the dilution tunnel [19]. As the vehicle accelerated, in addition to the nonvolatile nucleation mode, an accumulation mode appeared (#2, t = 24 s). For the first 40 s the differences of the >23 nm and >10 nm CPCs were large. After that point they coincided with the exception of idle (around 120 s). At time 155 s the size distribution consisted only of an accumulation mode (#3).
2.4. Comparison of Intstruments
The instruments could be compared in two occasions with high particle concentrations: cold start and regeneration events.
2.4.1. Cold Start
During cold starts a high sub-23 nm fraction was measured. All instruments, with the evaporation tube or catalytic strippers were very close (max difference 30%) in almost all cases, for both > 23 nm and > 10 nm (an example is given in Figure 5a). Examples of the size distribution were given in Figure 4b. In one other case though one of the systems with catalytic stripper (CS2) was higher than the evaporation tube system (50% higher); for this test the other system with the catalytic stripper (CS1) was not available (Figure 5b). For the specific test an active preheating of the vehicle oxidation catalyst (DOC) was applied that probably shifted the size of the particles to smaller diameters. It is possible that the higher penetration of the specific CS2 system resulted in the higher concentrations at the beginning of the cycle (+20% compared to the rest cycles). The specific system was optimized for 10 nm measurements in the PEMs4Nano project [20].
2.4.2. Regeneration
Figure 6a plots the PN concentrations of various instruments during the second regeneration (also presented in Figure 2a). All instruments were connected to the dilution tunnel. With the exception of EEPS, which measured total particles (i.e., including volatiles), all other instruments measured nonvolatile particles. The size distributions as measured by EEPS are given in Figure 6b, and were used to estimate the mass of volatiles at the inlet of the rest instrumentation that had to be removed in order to measure solid particles.
At the beginning of the regeneration there was a nucleation mode peaking at 15 nm (#1). This nucleation mode was mainly consisting of volatiles because the instruments with evaporation tubes (ET) and catalytic strippers (CS) even from 4 nm were measuring at background levels. Later, in addition to the nucleation mode, an additional accumulation mode appeared (#2) as the filtration efficiency dropped. All instruments were in good agreement and close to each other with the exception of the 4 nm counter from the evaporation tube system. The high difference can be attributed to the volatile artifact, i.e., re-nucleation of volatiles downstream of the evaporation tube, which were counted as solids. The deviation started when the mass of volatile particles was around 1 mg/m3 as calculated from the EEPS size distributions. For this test the evaporation tube system was used with a particle concentration reduction factor (PCRF) 100 (i.e., dilution that includes particle losses). Small differences between the 10 nm counters can be attributed to the penetration curves and counting efficiencies of the 10 nm counters. Later, when the regeneration was over, the volatiles concentration remained at high levels and the size distribution consisted of both nucleation and accumulation modes (#3).
The 23 nm counters followed the 10 nm counters, but were not plotted for better visualization of the figure.
3. Discussion
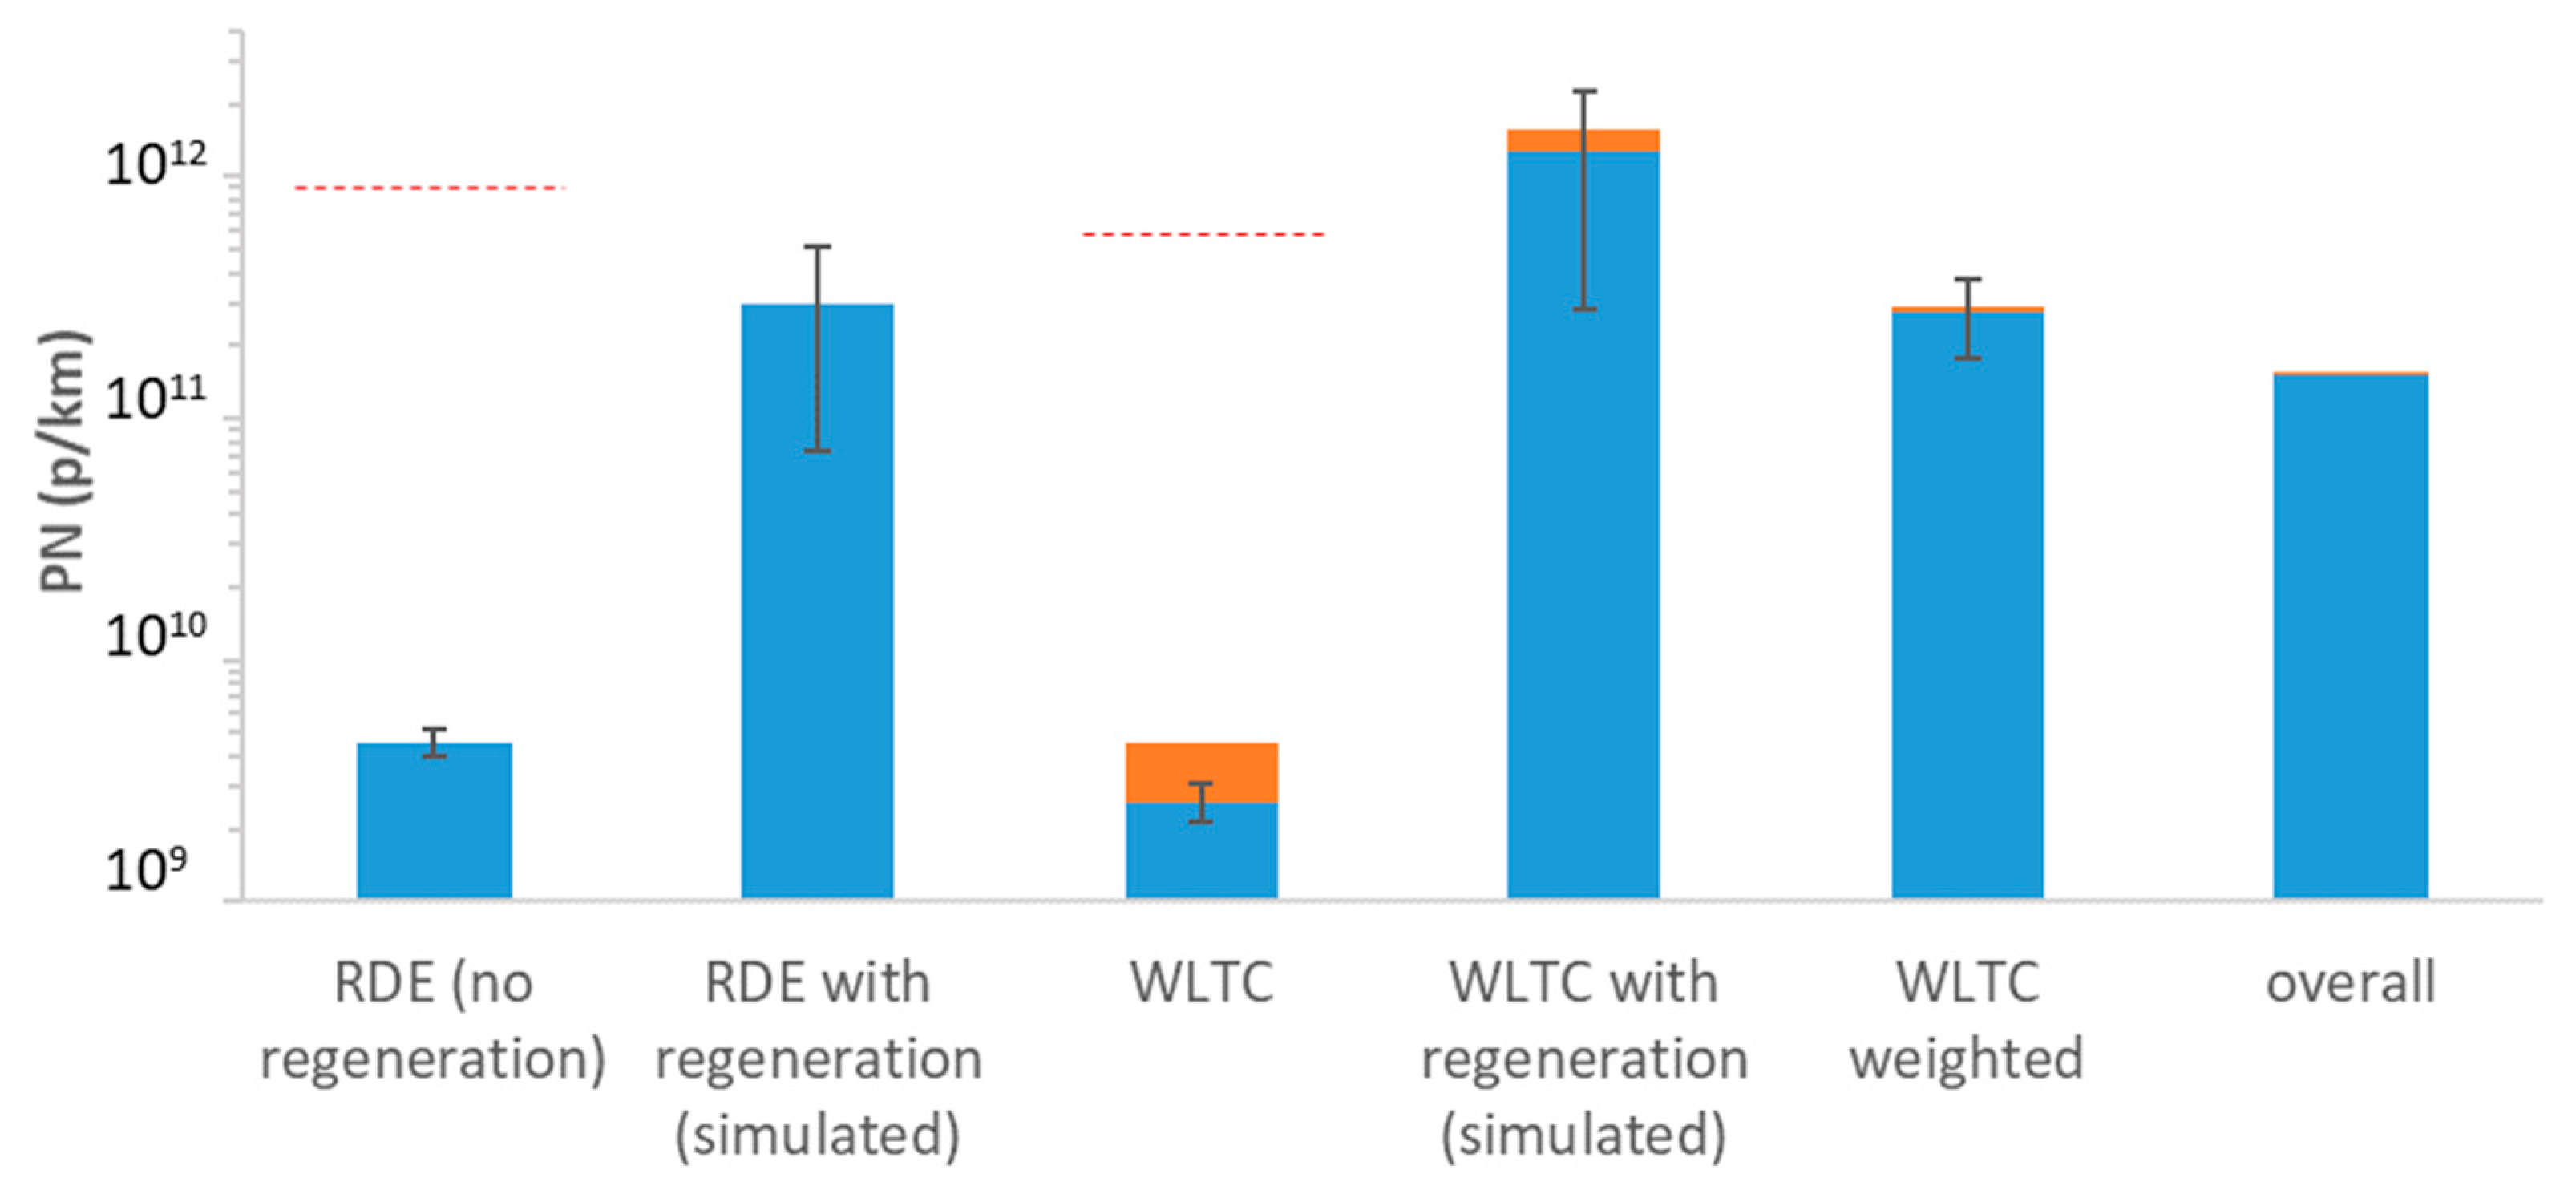
In this study the nonvolatile PN emissions of a vehicle during and between regeneration events with different instruments fulfilling current regulation (evaporation tube with counter measuring >23 nm), and future regulation (catalytic stripper with counter measuring >10 nm) were measured. Furthermore, total particles (i.e., including volatiles) >6 nm were measured. Figure 7 summarizes the (nonvolatile) PN results >23 nm with the respective emission limits. The emissions without regeneration events are very low, close to the facility background levels (5 × 10⁹ p/km), in agreement with others [21,22,23]. The effectiveness of DPFs is well known since the ‘90s [24]. In order to simulate cycles with regeneration, the maximum and minimum PN concentrations emitted during the three regenerations were added to non-regenerating cycles. Tests without regeneration events have very low emissions, two orders of magnitude below the PN limit. Tests with regeneration events are close to the limit (RDE with regeneration simulated) or can be above it (WLTC with regeneration simulated). The weighted for the regeneration WLTC emissions are half of the PN limit (WLTC weighted). The weighted emissions were calculated by adding the PN emissions during a regeneration event (in particles) to the total PN emissions of the tests without regeneration events and then dividing with the total distance driven between two regeneration events; an approach similar to the one required in the regulation for the rest pollutants (correction with ki factor). The actual overall emissions of all our testing including the three regeneration events were 4 times below the limit (1.5 × 10¹¹ p/km). The actual emissions were calculated by summing the emissions of all our tests and dividing with the total distance travelled. These results show that this vehicle fulfilled current regulations without including the regeneration emissions (without the ki factor), but also with application of the ki factor (which is applicable for the regulated gaseous pollutants). Similar results and conclusions have been reported by others [11,13].
The vehicle would also fulfill the RDE limit, which is the laboratory PN limit with a conformity factor that takes into account the PEMS measurement uncertainty (for details see [25]). The only case that the PN limit could be exceeded is the simulated laboratory cycle with a regeneration event (Figure 7). The reason is that the relatively high emissions during regeneration and the duration of the regeneration, which can cover a big part of the cycle. The regeneration events lasted 4–7 minutes (6–12 km) and the total particles that were emitted were 0.7–5 × 10¹³ particles (1.2–4.4 × 10¹² p/km). Exceedance of the PN limit during regeneration cycles have been reported many times in the literature [8,10,11,13]. In this study, the higher values were measured when more soot was accumulated in the DPF due to the longer distance driven indicating that the absolute regeneration levels depend also on the deposited soot, in agreement with others [26]. Studies that compared regeneration emissions with empty and loaded DPF found that the emissions do not originate only from the burnt soot, but also due to the reduced filtration efficiency during regeneration [6,27,28]. For this reason, there are always some particle emissions even with empty DPF. Thus, application of the PN limit to each laboratory test cycle including regeneration events needs attention and research [11]. Fulfilling the PN limits also during regeneration events would need different regeneration concepts (e.g., regenerating more often at shorter intervals, etc.), but this needs to be tested in the future, in order to optimize the regeneration process that depends on the soot load and the regeneration temperature [29] and to assess the associated uncertainties [30,31,32]. It should be added that the emissions are elevated also immediately after a regeneration event until a soot cake is formed. This is well known and it was shown in the laboratory tests [9,18]. The same behavior is also seen on the road [10].
The results of this study are in line with the literature: The duration (4–7 min) and the distance (6–12 km) of the regeneration are in line with other studies where the regenerations lasted 5–15 min [10,13,26] and a distance of 10–15 km was covered. The nonvolatile emission levels with regeneration taking place (1–4.4 × 10¹² p/km) were also at the same levels with those reported by others 0.8–4 × 10¹² p/km [8,10].
The sub-23 nm emissions were practically negligible. During the regeneration and immediately after, the sub-23 nm percentage was <3%, indicating that the majority of the particles were large with soot origin. The percentage was considerable (80%) only during the WLTCs, but the absolute levels were very low; two orders of magnitude below the PN limit. Such high percentages have been reported in a few other studies [17,33]. The prevailing explanation was urea particles, based on heavy-duty vehicles studies [15]. However, this could not explain the emissions of the light-duty vehicles without SCR. For these cases it was suspected that it was a measurement artifact due to the low concentrations measured [17]. Here it was confirmed that the sub-23 nm particles are true by using many instruments. It was proven that these particles do not originate from urea because the emissions and the sub-23 nm fraction remained the same with and without urea injection. The reason is that the SCR was coated on the DPF, and any formed particles were efficiently trapped in the DPF. It was shown that the sub-23 nm particles were produced mainly at the cold start and in particular during idling. They peaked at approximately 10 nm. A few other investigators have also measured a nucleation mode during the cold start [34,35,36,37]. The origin of these particles was not investigated. Based on the literature they are fuel heavy hydrocarbons and lubricant ash [37,38].
The volatile particles where negligible during the WLTCs. Extremely high concentrations (1–3 × 10¹⁴ p/km) were measured during the regeneration events. In addition to the soot (accumulation) mode, a nucleation mode peaking at 10–20 nm was evident. Nucleation mode particles during regeneration have been measured by others as well (2 × 10¹³ p/km to 2 × 10¹⁴ p/km) [8,9,13,26]. However, the tests directly from the tailpipe did not see this nucleation mode, which means that either it did not appear at the direct tailpipe sampling or it remained at sizes below the lower size of the instruments used (6 nm). There is one study that did not find nucleation mode particles during a regeneration of an empty or loaded DPF, also measuring directly from the tailpipe [27]. Most studies find high amounts of sulfates during regeneration events [6,10,39] indicating that formation of volatile sulfuric acid particles is possible. These particles have sizes of 1-1.5 nm and can grow to bigger sizes only with the presence of hydrocarbons. During the first two regenerations, due to the high exhaust gas temperatures, the desorbed material from the transfer tube to the dilution tunnel might have grown the nuclei to the measurement range of the instrument (EEPS) [40]. It should be noted that, because the tailpipe measurement did not detect a high amount of volatile particles >6 nm, the origin of the hydrocarbons is not the vehicle tailpipe, but the transfer tube to the dilution tunnel. This can also explain why our emission levels were at the high end of the reported emissions. Thus, regeneration measurements of total particles from the dilution tunnel need attention as they might overestimate the true vehicle emissions. More studies in that direction are necessary in order to better characterize total particles from diesel vehicles during regeneration events.
The measurements with different instruments confirmed that regeneration events can be accurately measured with current instrumentation (lower size 23 nm) and thus can be included in the future regulation. Furthermore, tests with counters with lower sizes at 10 nm confirmed that extension of the future legislation to 10 nm is still possible without any indications of artifacts. However, some differences at the absolute levels were found, probably due to the different penetration curves of the systems and the counting efficiencies of their counters. Tests below 10 nm were accompanied with a volatile artifact in the case of the evaporation tube system with relatively low dilution (100). This was also recently shown in the 10–23 nm range with heavy-duty engines regenerations [14]. In general, the comparisons in this study support the current suggestions for the future PN regulation.
4. Materials and Methods
The tests were conducted at the one axle chassis dynamometer of the Joint Research Centre (JRC) in Italy. The vehicle was a prototype developed in the THOMSON project funded by Horizon 2020 EU Research and Innovation program, under Grant Agreement no. 724037. JRC was tasked to assess the emissions of the vehicle as an independent organization, not participating in the project. The objective of the project was to demonstrate the efficiency of mild hybrid systems using a certain number of engine technologies that are enabled by the 48 Volt architecture: eBoosting, electrically heated catalyst and electrically driven auxiliaries (such as cooling and oil pump) [41].
The 1.6 L diesel-fueled engine was combined with a closed-coupled diesel oxidation catalyst (DOC), and a diesel particulate filter (DPF) with selective catalytic reduction (SCR) for NOx coating (SCRF). The vehicle could electrically heat the DOC with the 48 V battery. This was applied only for one cycle though. The vehicle could easily fulfill the Euro 6d limits both in the laboratory and on the road (Appendix A). The tests consisted of two on-road routes (one route was repeated twice) compliant to the real-driving emissions (RDE) Commission Regulation (EU) 2017/1151. Furthermore, worldwide harmonized light-duty vehicles test cycle (WLTCs) were conducted in the laboratory and three active regeneration events at 100 km/h. The regenerations were activated by post-injection in the engine’s cylinders during the late expansion stroke to generate exothermic energy across the DOC to increase the exhaust gas temperature at the inlet of the DPF [42]. The first regeneration was after the RDE tests, after approximately 370 km of driving because the DPF was close to its soot capacity (for acceptable backpressure levels). The second one was after 150 km and the last one after 100 km in order to evaluate the regeneration emissions at different soot load levels. During a constant speed test, the urea injection was switched on and off in order to evaluate the contribution of urea on particle formation. During the on-road tests the ambient temperature ranged between 10 and 20 °C and in the laboratory the temperature was set at 23 °C.
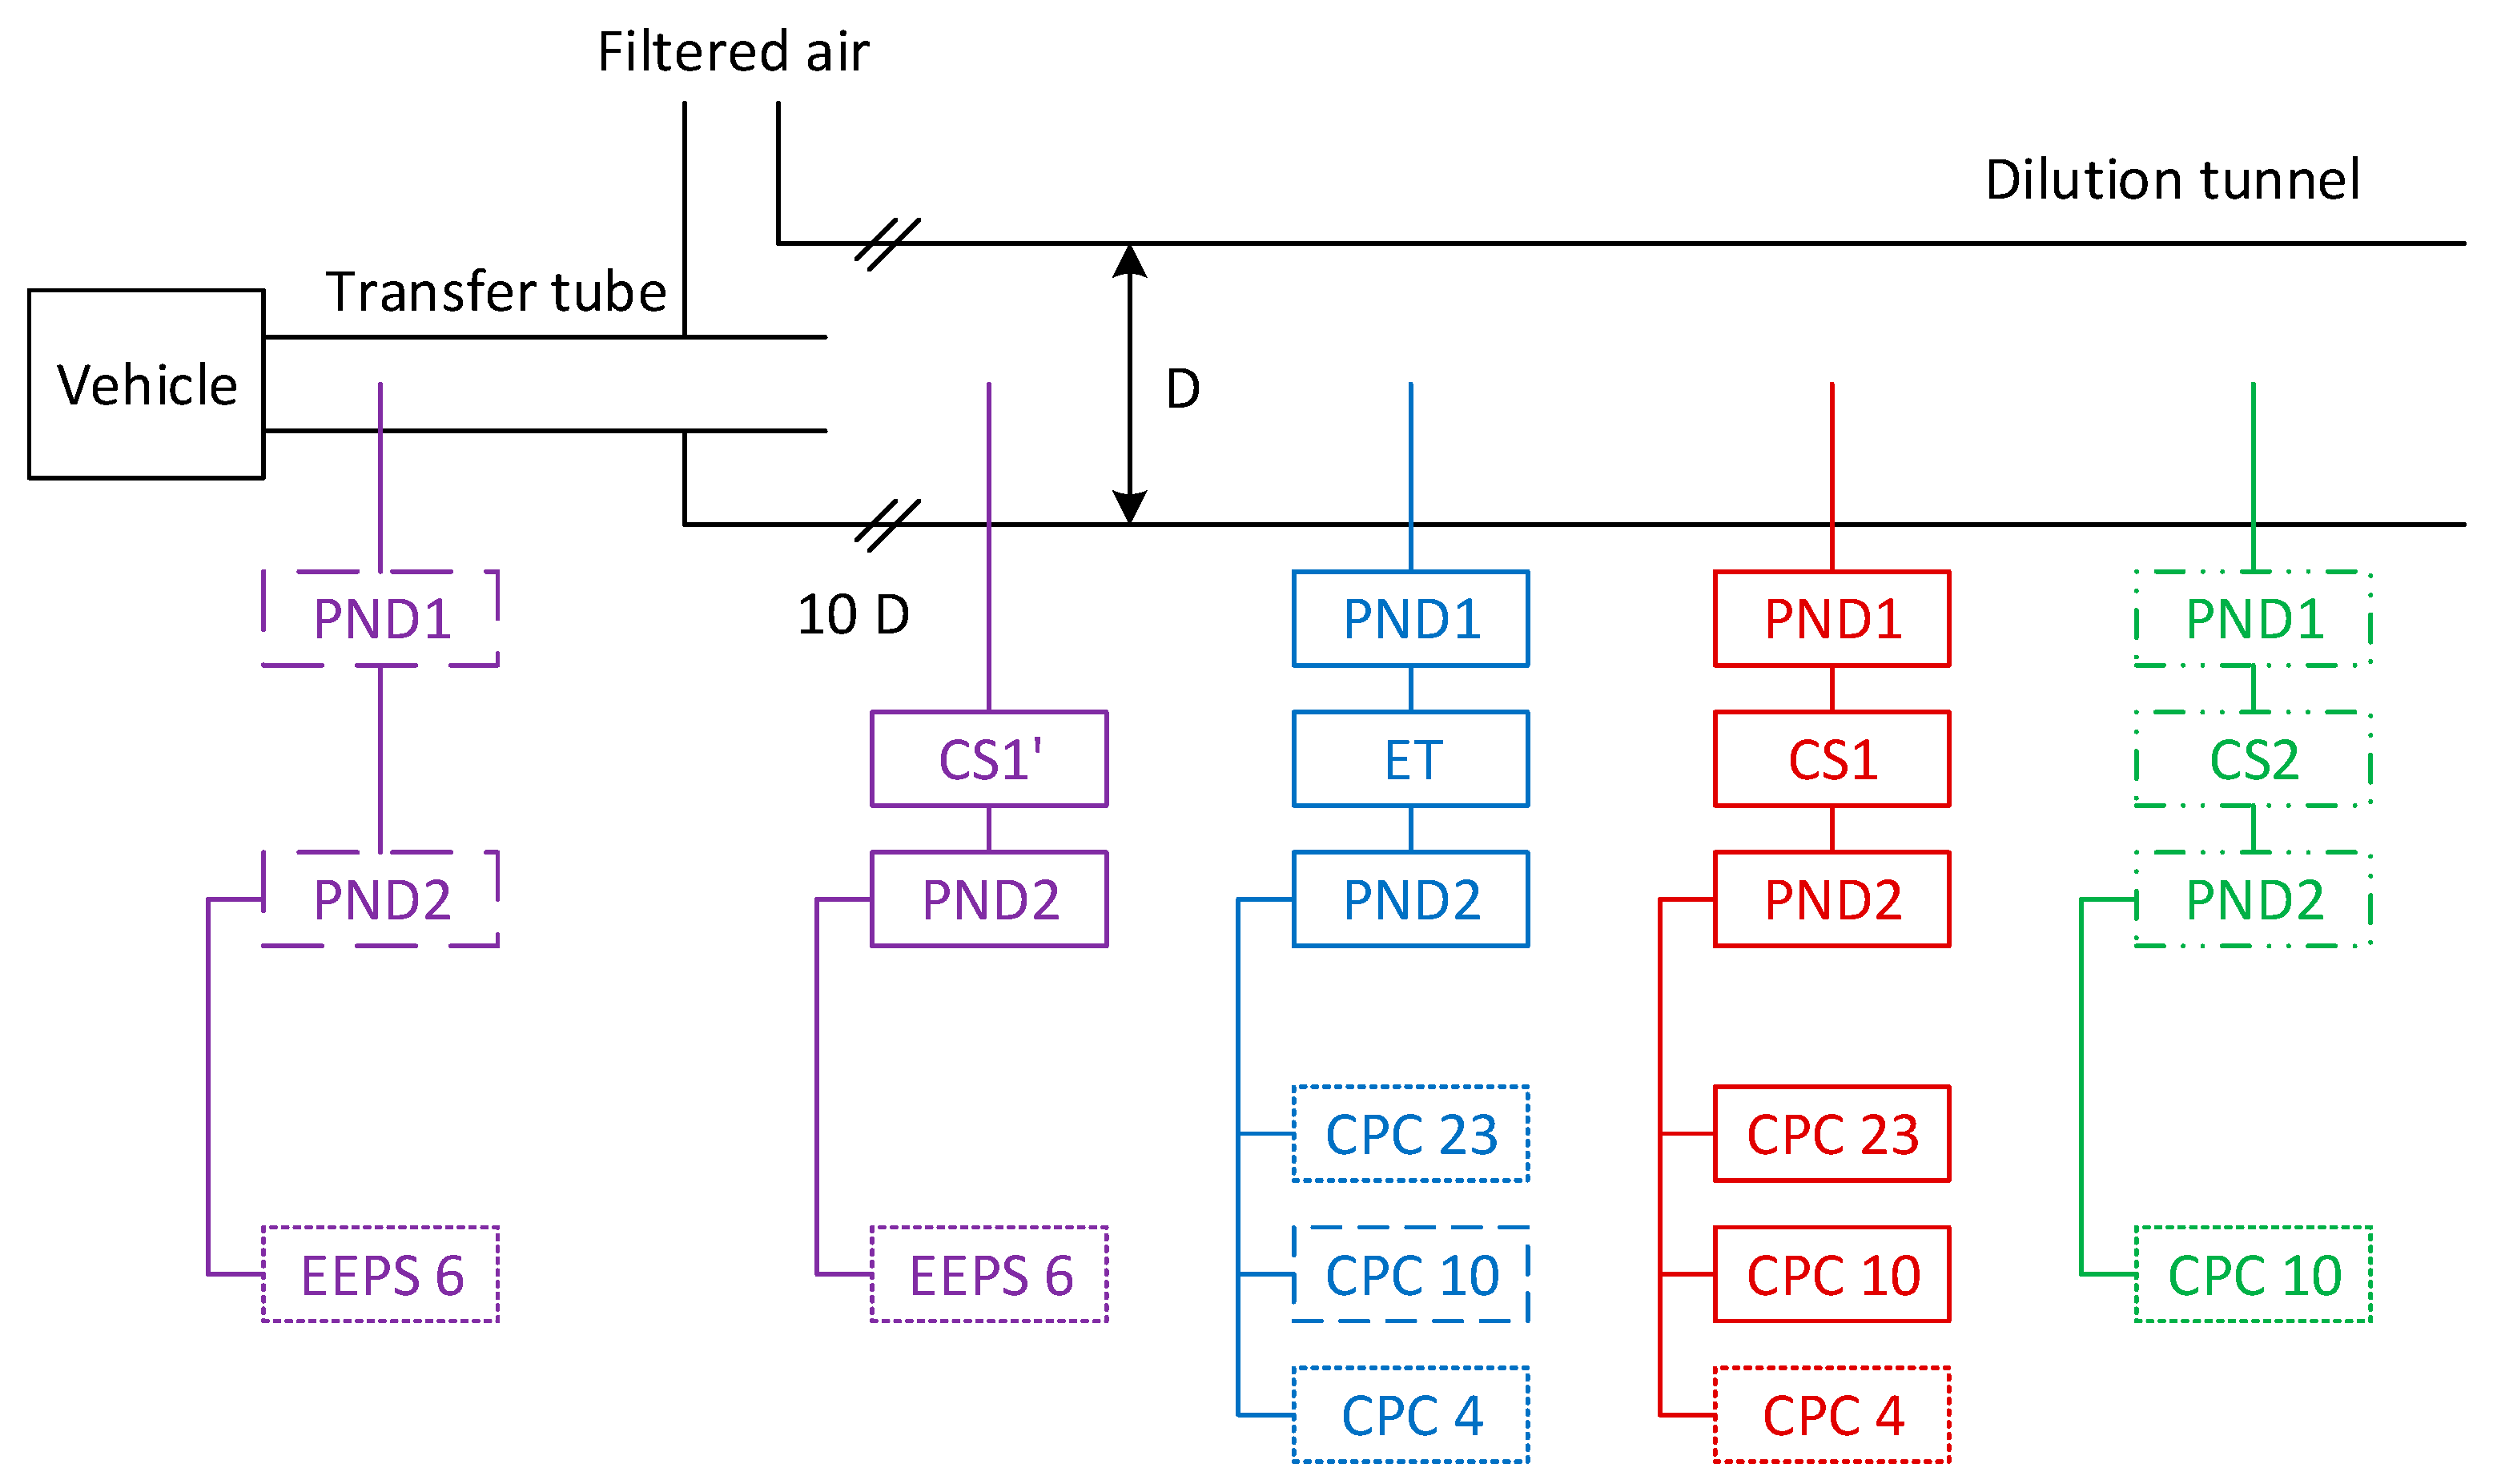
The particle number instruments were connected to the dilution tunnel, ten dilution tunnel diameters after the mixing of the exhaust gas with the dilution air in order to have homogeneous samples (Figure 8). Four sample probes, placed at the same cross-section of the tunnel and facing upstream the flow with a 2.5 μm separator (hat) were used for the instruments. The instrument fulfilling the current PN regulation was an AVL (Graz, Austria) particle counter (APC 489) [43] consisting of a hot diluter (PND1) at 150 °C, an evaporation tube (ET) at 350 °C and a condensation particle counter (CPC) from TSI (Shoreview, MN, USA) with 50% efficiency at 23 nm [44]. In parallel a 10 nm CPC modified model A20 from Airmodus (Helsinki, Finland) and a 4 nm CPC model 3775 from TSI were connected to measure particles below 23 nm. A second APC with a catalytic stripper (CS1) [45] instead of an evaporation tube, and with 23 nm and 10 nm CPCs from AVL and a 4 nm CPC model 3775 from TSI was also connected to the dilution tunnel. A modified solid particle counting system (SPCS 2100) from Horiba with a catalytic stripper (CS2) and a 10 nm CPC from TSI was also measuring in parallel with the rest of the systems. The system was developed in the PEMs4Nano project [20]. Finally, an engine exhaust particle sizer (EEPS) [46] downstream of a catalytic stripper (CS1’) from AVL was used to measure size distributions of non-volatile particles. For some measurements the CS1’ was switched off in order to measure the total particles, i.e., including volatile particles. For the third regeneration test the EEPS was connected directly to the vehicle’s tailpipe downstream of a rotating disk diluter from Testo (Lenzkirch, Germany) at ambient temperatures (not heated; for details regarding the instruments see [47]). The transfer tube from the tailpipe until the dilution tunnel was a 6 m stainless steel tube heated at 70 °C. For modern vehicles the nonvolatile PN emissions at the tailpipe and the dilution tunnel have small differences (<20%), seen only sometimes during a cold start when the concentrations are high [48]. Agglomeration of particles reduces their concentration until the dilution tunnel. The total PN (including volatiles) can have orders of magnitude difference depending on the sampling parameters (e.g., dilution ratios and dilution air temperatures) [49,50], but also on desorption and release of material stored in the transfer tube to the dilution tunnel [51].
For the on-road tests the AVL MOVE was used (version of year 2016). The PN module has a 2:1 hot dilution at > 150 °C, followed by an evaporation tube in series with a catalytic stripper (both set at 300 °C) and a secondary dilution 5:1 at 60 °C. After a 1.3 m heated line at 60 °C, the detector (Automotive Partector, from Naneos, Windisch, Switzerland) counts the particles based on the aerosol measurement with induced currents [25]. The system has 40% efficiency at 23 nm.
5. Conclusions
Nonvolatile and volatile particle number (PN) emissions of a prototype diesel vehicle, optimized for low CO2 and rest regulated pollutants at the Thomson project were investigated. Over the 650 km driven distance, three regenerations were forced after 370 km, 150 km and 100 km.
The nonvolatile PN levels were close to the background levels (5 × 10⁹ p/km), but during regenerations reached 1–4 × 10¹² p/km. The higher emissions were emitted with the higher soot deposited in the DPF. Even though the regeneration emissions exceeded the nonvolatile PN limit for non-regenerating cycles, the weighted emissions over the distance between regenerations were four times lower than the PN limit. Fulfillment of the PN limits during regeneration under all conditions needs further research.
The sub-23 nm fraction was negligible (<3%) during regenerations, but high in relative terms (80%) during WLTCs, where the emissions were two orders of magnitude below the nonvolatile PN limit. Thus the sub-23 nm emissions were low in absolute levels. It was confirmed that they were true particles during cold start, and not due to urea injection or an artifact of the sampling systems.
Comparison of different systems with evaporation tubes or catalytic strippers and counters measuring from 10 nm and 23 nm gave comparable results, even during regenerations. These results confirmed that the systems are reliable and the regeneration emissions could be included in the next revision of the regulation. Higher differences (+20%) were noticed at cold start, when small particles were emitted, due to the relatively big differences at the penetration curves of the systems. At one case during a regeneration event, when the volatile mass reached 1 mg/m3, the system with an evaporation tube and a 4 nm counter showed one order of magnitude higher PN emissions compared to the system with a catalytic stripper. Thus, sub-10 nm measurements need more attention, and a catalytic stripper is necessary. Finally, the total PN emissions (including volatiles) >6 nm measured from the dilution tunnel or the tailpipe had two orders of magnitude difference, indicating that more research is needed in this direction of total PN is going to be regulated in the future.
Funding
This research received no external funding.
Acknowledgments
The author would like to acknowledge the technical support from L. Bigozzi, A. Bonamin., P. Canevari, M. Carriero, F. Forloni, F. Forni, P. Le Lijour, D. Leseuer, A. Migneco. Special acknowledgements go to F. Ammirante and A. Martoglio for the control of the prototype vehicle.
Conflicts of Interest
The author declares no conflict of interest.
Disclaimer
The opinions expressed in this manuscript are those of the author and should in no way be considered to represent an official opinion of the European Commission. Mention of trade names or commercial products does not constitute endorsement or recommendation by the European Commission or the author.
Appendix A
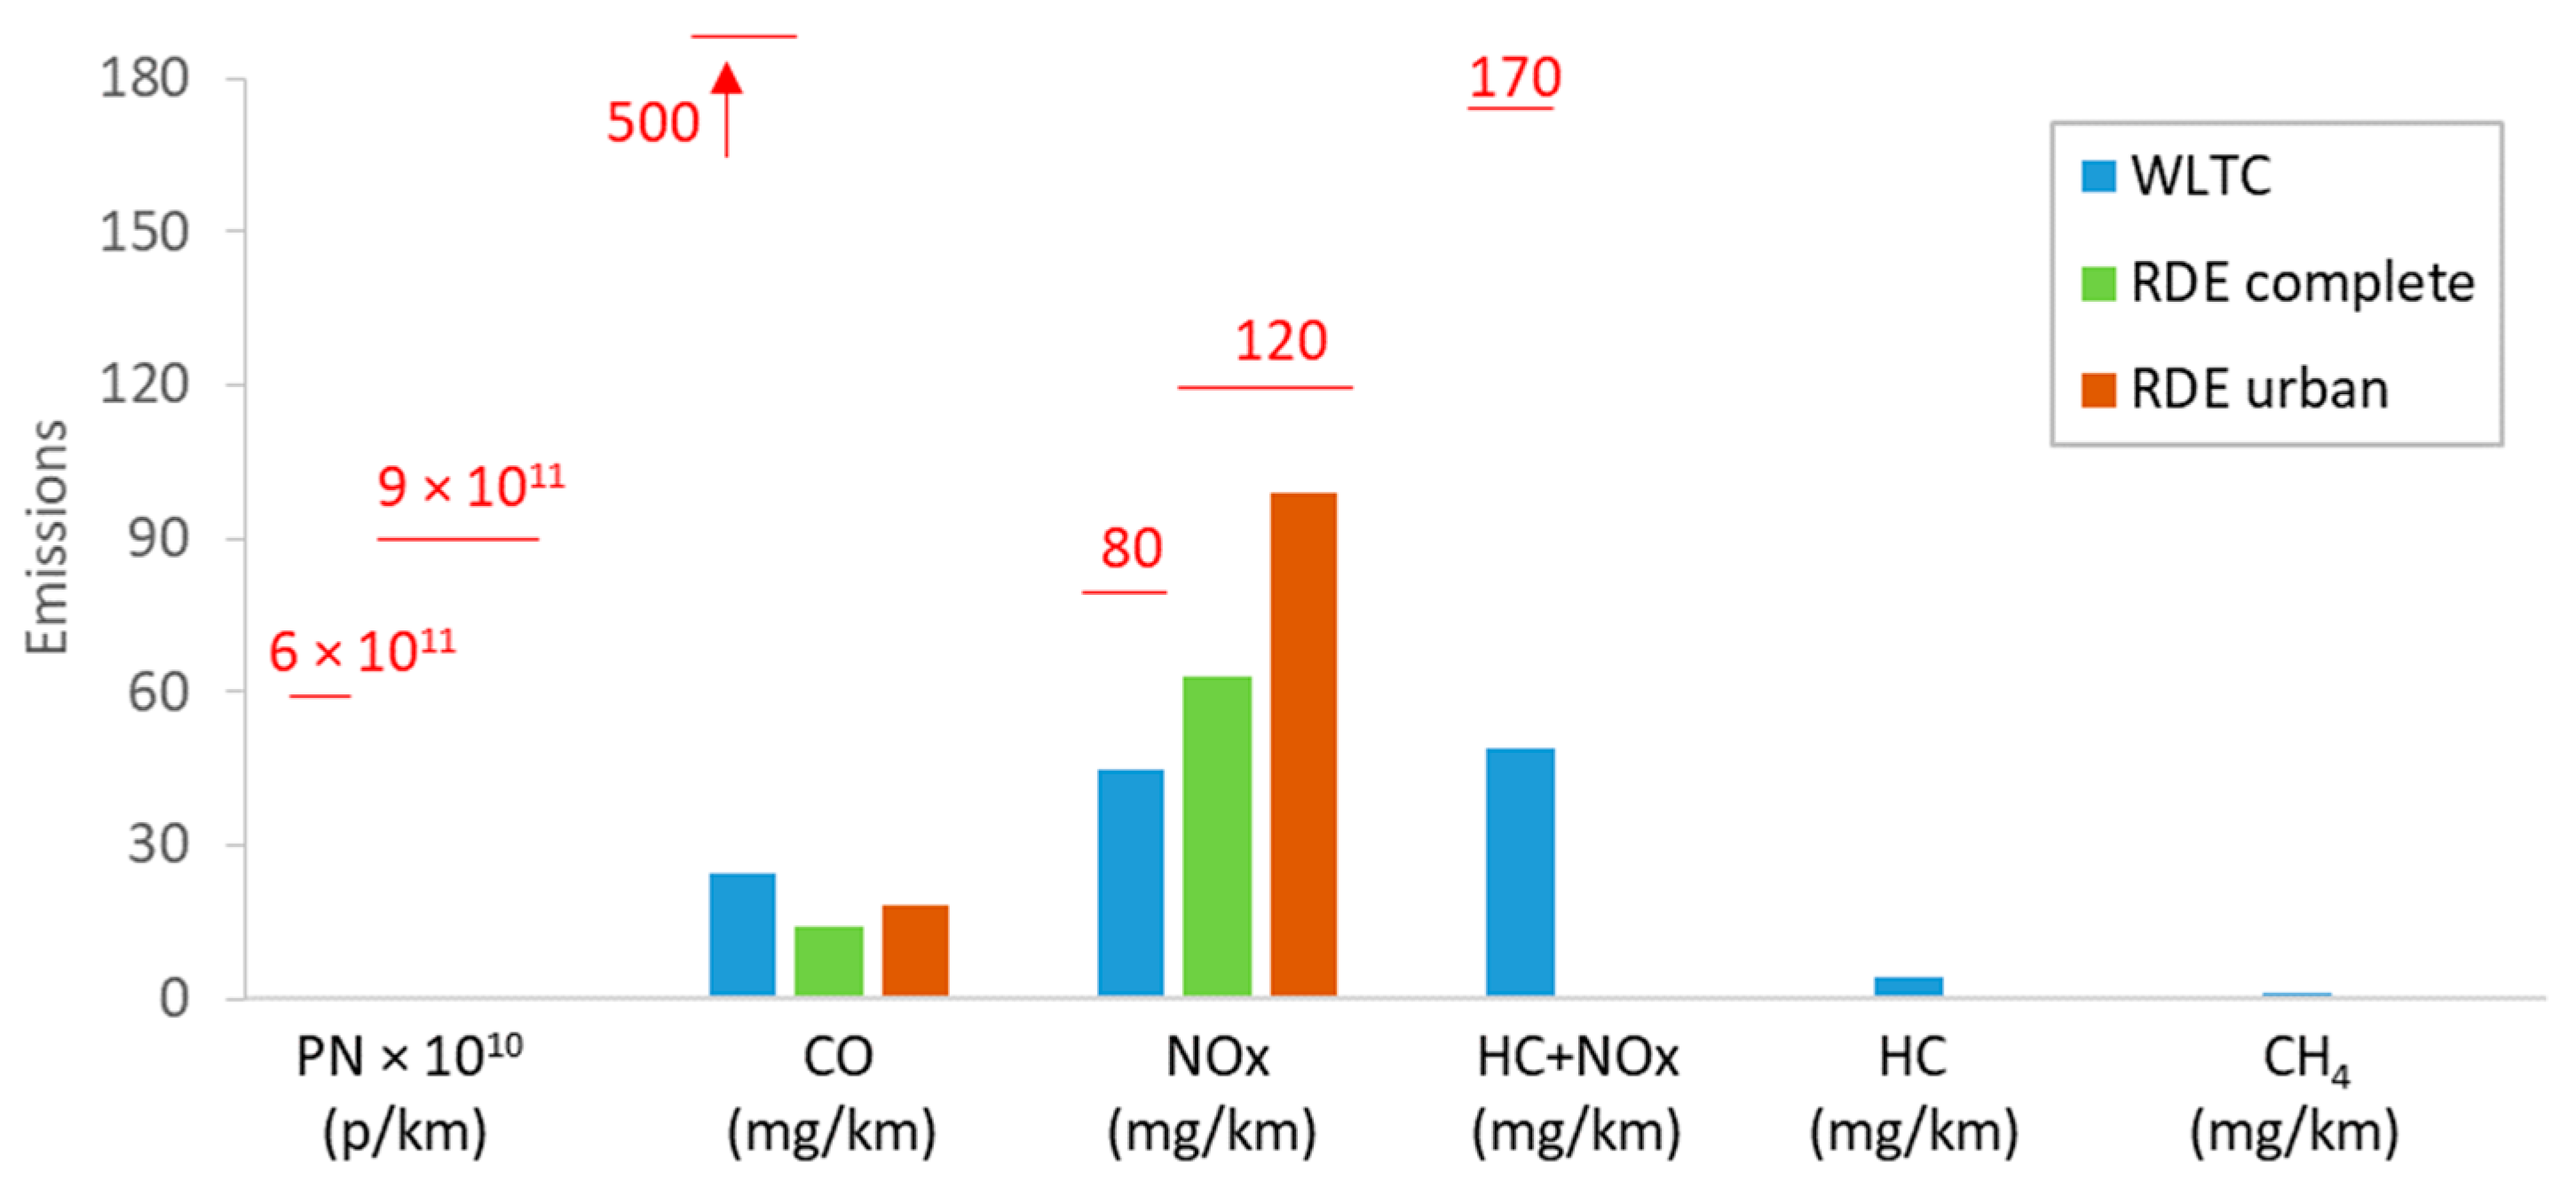
The emission levels of the regulated pollutants are summarized in Figure A1.
Figure A1.
Regulated pollutants emissions for the laboratory worldwide harmonized light-duty vehicles test cycle (WLTC) and the on-road real-driving emissions (RDE) tests. Red lines give the limits in the laboratory and on the road.
Figure A1.
Regulated pollutants emissions for the laboratory worldwide harmonized light-duty vehicles test cycle (WLTC) and the on-road real-driving emissions (RDE) tests. Red lines give the limits in the laboratory and on the road.

References
- Tanaka, K.; Lund, M.T.; Aamaas, B.; Berntsen, T. Climate effects of non-compliant Volkswagen diesel cars. Environ. Res. Lett. 2018, 13, 044020. [Google Scholar] [CrossRef]
- Valverde, V.; Clairotte, M.; Bonnel, P.; Giechaskiel, P.; Carriero, M.; Otura, M.; Gruening, C.; Fontaras, G.; Pavlovic, J.; Martini, G.; et al. Joint Research Centre 2018 Light-Duty Vehicles Emissions Testing: Contribution to the EU Market Surveillance: Testing Protocols and Vehicle Emissions Performance; Publications Office of the European Union: Luxembourg, 2019; ISBN 978-92-76-12333-0. [Google Scholar]
- Giechaskiel, B.; Mamakos, A.; Andersson, J.; Dilara, P.; Martini, G.; Schindler, W.; Bergmann, A. Measurement of automotive nonvolatile particle number emissions within the European legislative framework: A review. Aerosol Sci. Technol. 2012, 46, 719–749. [Google Scholar] [CrossRef]
- Fiebig, M.; Wiartalla, A.; Holderbaum, B.; Kiesow, S. Particulate emissions from diesel engines: Correlation between engine technology and emissions. J. Occup. Med. Toxicol. 2014, 9, 6. [Google Scholar] [CrossRef] [Green Version]
- Dwyer, H.; Ayala, A.; Zhang, S.; Collins, J.; Huai, T.; Herner, J.; Chau, W. Emissions from a diesel car during regeneration of an active diesel particulate filter. J. Aerosol Sci. 2010, 41, 541–552. [Google Scholar] [CrossRef]
- R’Mili, B.; Boréave, A.; Meme, A.; Vernoux, P.; Leblanc, M.; Noël, L.; Raux, S.; D’Anna, B. Physico-chemical characterization of fine and ultrafine particles emitted during diesel particulate filter active regeneration of Euro 5 diesel vehicles. Environ. Sci. Technol. 2018, 52, 3312–3319. [Google Scholar] [CrossRef]
- Doozandegan, M.; Hosseini, V.; Ehteram, M.A. Solid nanoparticle and gaseous emissions of a diesel engine with a diesel particulate filter and use of a high-sulphur diesel fuel and a medium-sulphur diesel fuel. Proc. Inst. Mech. Eng. Part D J. Automob. Eng. 2017, 231, 941–951. [Google Scholar] [CrossRef]
- Mamakos, A.; Martini, G.; Manfredi, U. Assessment of the legislated particle number measurement procedure for a Euro 5 and a Euro 6 compliant diesel passenger cars under regulated and unregulated conditions. J. Aerosol Sci. 2013, 55, 31–47. [Google Scholar] [CrossRef]
- Giechaskiel, B.; Munoz-Bueno, R.; Rubino, L.; Manfredi, U.; Dilara, P.; De Santi, G.; Andersson, J. Particle measurement programme (PMP): Particle size and number emissions before, during and after regeneration events of a Euro 4 DPF equipped light-duty diesel vehicle. SAE paper 2007-01-1944. In Proceedings of the JSAE/SAE International Fuels & Lubricants Meeting, Beijing, China, 16–19 October 2007. [Google Scholar] [CrossRef]
- Transport & Environment New diesels, New Problems 2020. Available online: https://www.transportenvironment.org/publications/new-diesels-new-problems (accessed on 23 May 2020).
- Giechaskiel, B.; Lähde, T.; Suarez-Bertoa, R.; Clairotte, M.; Grigoratos, T.; Zardini, A.; Perujo, A.; Martini, G. Particle number measurements in the European legislation and future JRC activities. Combust. Engines 2018, 174, 3–16. [Google Scholar] [CrossRef]
- Giechaskiel, B.; Riccobono, F.; Vlachos, T.; Mendoza-Villafuerte, P.; Suarez-Bertoa, R.; Fontaras, G.; Bonnel, P.; Weiss, M. Vehicle emission factors of solid nanoparticles in the laboratory and on the road using portable emission measurement systems (PEMS). Front. Environ. Sci. 2015, 3. [Google Scholar] [CrossRef] [Green Version]
- Beatrice, C.; Costagliola, M.A.; Guido, C.; Napolitano, P.; Prati, M.V. How much regeneration events influence particle emissions of DPF-equipped vehicles? SAE paper 2017-24-0144. In Proceedings of the 13th International Conference on Engines & Vehicles, Capri, Napoli, 10–14 September 2017. [Google Scholar] [CrossRef]
- Giechaskiel, B.; Lähde, T.; Schwelberger, M.; Kleinbach, T.; Roske, H.; Teti, E.; van den Bos, T.; Neils, P.; Delacroix, C.; Jakobsson, T.; et al. Particle number measurements directly from the tailpipe for type approval of heavy-duty engines. Appl. Sci. 2019, 9, 4418. [Google Scholar] [CrossRef] [Green Version]
- Mamakos, A.; Schwelberger, M.; Fierz, M.; Giechaskiel, B. Effect of selective catalytic reduction on exhaust nonvolatile particle emissions of Euro VI heavy-duty compression ignition vehicles. Aerosol Sci. Technol. 2019, 53, 898–910. [Google Scholar] [CrossRef] [Green Version]
- Giechaskiel, B.; Joshi, A.; Ntziachristos, L.; Dilara, P. European regulatory framework and particulate matter emissions of gasoline light-duty vehicles: A review. Catalysts 2019, 9, 586. [Google Scholar] [CrossRef] [Green Version]
- Giechaskiel, B.; Manfredi, U.; Martini, G. Engine exhaust solid sub-23 nm particles: I. literature survey. SAE Int. J. Fuels Lubr. 2014, 7, 950–964. [Google Scholar] [CrossRef]
- Yamada, H. PN emissions from heavy-duty diesel engine with periodic regenerating DPF. SAE Int. J. Engines 2013, 6, 1178–1189. [Google Scholar] [CrossRef]
- Giechaskiel, B.; Zardini; Lahde, T.; Clairotte, M.; Forloni, F.; Drossinos, Y. Identification and quantification of uncertainty components in gaseous and particle emission measurements of a moped. Energies 2019, 12, 4343. [Google Scholar] [CrossRef] [Green Version]
- PEMs4Nano. Available online: https://pems4nano.eu/ (accessed on 23 May 2020).
- Costagliola, M.A.; Prati, M.V.; Mariani, A.; Unich, A.; Morrone, B. Gaseous and particulate exhaust emissions of hybrid and conventional cars over legislative and real driving cycles. Energy Power Eng. 2015, 07, 181–192. [Google Scholar] [CrossRef] [Green Version]
- Valverde, V.; Mora, B.A.; Clairotte, M.; Pavlovic, J.; Suarez-Bertoa, R.; Giechaskiel, B.; Astorga-LLorens, C.; Fontaras, G. Emission factors derived from 13 Euro 6b light-duty vehicles based on laboratory and on-road measurements. Atmosphere 2019, 10, 243. [Google Scholar] [CrossRef] [Green Version]
- Giechaskiel, B.; Suarez-Bertoa, R.; Lahde, T.; Clairotte, M.; Carriero, M.; Bonnel, P.; Maggiore, M. Emissions of a Euro 6b diesel passenger car retrofitted with a solid ammonia reduction system. Atmosphere 2019, 10, 180. [Google Scholar] [CrossRef] [Green Version]
- Mayer, A.; Czerwinski, J.; Matter, U.; Wyser, M.; Scheidegger; Kieser, D.; Weidhofer. VERT: Diesel nano-particulate emissions: Properties and reduction strategies. SAE paper 980539. In Proceedings of the SAE Internaltional Congress and Exhibition, Detroit, MI, USA, 23–26 February 1998. [Google Scholar] [CrossRef]
- Giechaskiel, B.; Bonnel, P.; Perujo, A.; Dilara, P. Solid particle number (SPN) portable emissions measurement systems (PEMS) in the European legislation: A review. Int. J. Environ. Res. Public Health 2019, 16, 4819. [Google Scholar] [CrossRef] [Green Version]
- Zinola, S.; Raux, S.; Leblanc, M. Persistent particle number emissions sources at the tailpipe of combustion engines. SAE paper 2016-01-2283. In Proceedings of the SAE 2016 International Powertrains, Fuels & Lubricants Meeting, Baltimore, MD, USA, 24–26 October 2016. [Google Scholar] [CrossRef]
- Rothe, D.; Knauer, M.; Emmerling, G.; Deyerling, D.; Niessner, R. Emissions during active regeneration of a diesel particulate filter on a heavy duty diesel engine: Stationary tests. J. Aerosol Sci. 2015, 90, 14–25. [Google Scholar] [CrossRef]
- Berthelin, R.; Girot, P. The legislative impact of new particle number standards on the DPF operational efficiency. SAE Int. J. Fuels Lubr. 2010, 3, 165–176. [Google Scholar] [CrossRef]
- Singh, P.; Thalagavara, A.M.; Naber, J.; Johnson, J.H.; Bagley, S.T. An experimental study of active regeneration of an advanced catalyzed particulate filter by diesel fuel injection upstream of an oxidation catalyst. SAE paper 2006-01-0879. In Proceedings of the SAE 2006 World Congress & Exhibition, Detroit, MI, USA, 3–6 April 2006. [Google Scholar] [CrossRef]
- Chiavola, O.; Chiatti, G.; Sirhan, N. Impact of particulate size during deep loading on DPF management. Appl. Sci. 2019, 9, 3075. [Google Scholar] [CrossRef] [Green Version]
- Di Sarli, V.; Di Benedetto, A. Using CFD simulation as a tool to identify optimal operating conditions for regeneration of a catalytic diesel particulate filter. Appl. Sci. 2019, 9, 3453. [Google Scholar] [CrossRef] [Green Version]
- Kontses, D.; Geivanidis, S.; Fragkiadoulakis, P.; Samaras, Z. Uncertainties in model-based diesel particulate filter diagnostics using a soot sensor. Sensors 2019, 19, 3141. [Google Scholar] [CrossRef] [Green Version]
- Giechaskiel, B.; Vanhanen, J.; Väkevä, M.; Martini, G. Investigation of vehicle exhaust sub-23 nm particle emissions. Aerosol Sci. Technol. 2017, 51, 626–641. [Google Scholar] [CrossRef] [Green Version]
- Chiatti, G.; Chiavola, O.; Recco, E.; Palmieri, F. Soot particles experimental characterization during cold start of a micro car engine. Energy Procedia 2016, 101, 662–669. [Google Scholar] [CrossRef]
- Badshah, H.; Khalek, I.A. Solid particle emissions from vehicle exhaust during engine start-up. SAE Int. J. Engines 2015, 8. [Google Scholar] [CrossRef]
- Otsuki, Y.; Tochino, S.; Kondo, K.; Haruta, K. Portable emissions measurement system for solid particle number including nanoparticles smaller than 23 nm. SAE paper 2017-01-2402. In Proceedings of the International Powertrains, Fuels & Lubricants Meeting, Beijing, China, 16–19 October 2017. [Google Scholar] [CrossRef]
- Filippo, A.D.; Maricq, M.M. Diesel nucleation mode particles: Semivolatile or solid? Environ. Sci. Technol. 2008, 42, 7957–7962. [Google Scholar] [CrossRef]
- Arumugam, R.; Xu, H.; Liu, D.; Tian, M.J. Key factors affecting the cold start of diesel engines. Int. J. Green Energy 2015, 150106085722005. [Google Scholar] [CrossRef]
- Bergmann, M.; Kirchner, U.; Vogt, R.; Benter, T. On-road and laboratory investigation of low-level PM emissions of a modern diesel particulate filter equipped diesel passenger car. Atmos. Environ. 2009, 43, 1908–1916. [Google Scholar] [CrossRef]
- Yang, J.; Pham, L.; Johnson, K.C.; Durbin, T.D.; Karavalakis, G.; Kittelson, D.; Jung, H. Impacts of exhaust transfer system contamination on particulate matter measurements. Emiss. Control Sci. Technol. 2020. [Google Scholar] [CrossRef] [Green Version]
- Thomson Horizon 2020 EU Research and Innovation Programme, under Grant Agreement no. 724037. Available online: http://www.thomson-project.eu/ (accessed on 23 May 2020).
- Serrano, J.R.; Piqueras, P.; de la Morena, J.; Sanchis, E.J. Late fuel post-injection influence on the dynamics and efficiency of wall-flow particulate filters regeneration. Appl. Sci. 2019, 9, 5384. [Google Scholar] [CrossRef] [Green Version]
- Giechaskiel, B.; Cresnoverh, M.; Jörgl, H.; Bergmann, A. Calibration and accuracy of a particle number measurement system. Meas. Sci. Technol. 2010, 21, 045102. [Google Scholar] [CrossRef]
- Giechaskiel, B.; Wang, X.; Horn, H.-G.; Spielvogel, J.; Gerhart, C.; Southgate, J.; Jing, L.; Kasper, M.; Drossinos, Y.; Krasenbrink, A. Calibration of condensation particle counters for legislated vehicle number emission measurements. Aerosol Sci. Technol. 2009, 43, 1164–1173. [Google Scholar] [CrossRef]
- Amanatidis, S.; Ntziachristos, L.; Giechaskiel, B.; Katsaounis, D.; Samaras, Z.; Bergmann, A. Evaluation of an oxidation catalyst (“catalytic stripper”) in eliminating volatile material from combustion aerosol. J. Aerosol Sci. 2013, 57, 144–155. [Google Scholar] [CrossRef]
- Xue, J.; Li, Y.; Wang, X.; Durbin, T.D.; Johnson, K.C.; Karavalakis, G.; Asa-Awuku, A.; Villela, M.; Quiros, D.; Hu, S.; et al. Comparison of vehicle exhaust particle size distributions measured by SMPS and EEPS during steady-state conditions. Aerosol Sci. Technol. 2015, 49, 984–996. [Google Scholar] [CrossRef] [Green Version]
- Giechaskiel, B.; Mamakos, A.; Woodburn, J.; Szczotka, A.; Bielaczyc, P. Evaluation of a 10 nm particle number portable emissions measurement system (PEMS). Sensors 2019, 19, 5531. [Google Scholar] [CrossRef] [Green Version]
- Giechaskiel, B.; Lähde, T.; Drossinos, Y. Regulating particle number measurements from the tailpipe of light-duty vehicles: The next step? Environ. Res. 2019, 172, 1–9. [Google Scholar] [CrossRef]
- Abdul-Khalek, I.; Kittelson, D.; Brear, F. The influence of dilution conditions on diesel exhaust particle size distribution measurements. SAE paper 1999-01-1142. In Proceedings of the SAE International Congress and Exposition, Detroit, MI, USA, 1–4 March 1999. [Google Scholar] [CrossRef]
- Mathis, U.; Ristimäki, J.; Mohr, M.; Keskinen, J.; Ntziachristos, L.; Samaras, Z.; Mikkanen, P. Sampling conditions for the measurement of nucleation mode particles in the exhaust of a diesel vehicle. Aerosol Sci. Technol. 2004, 38, 1149–1160. [Google Scholar] [CrossRef]
- Maricq, M.M.; Chase, R.E.; Podsiadlik, D.H.; Vogt, R. Vehicle exhaust particle size distributions: A comparison of tailpipe and dilution tunnel measurements. SAE paper 1999-01-1461. In Proceedings of the International Fuels & Lubricants Meeting & Exposition, Dearborn, MI, USA, 3–6 May 1999. [Google Scholar] [CrossRef] [Green Version]
Figure 1.
Nonvolatile particle number (PN) emissions > 23 nm and > 10 nm of all tests conducted in this study (on the road and in the laboratory) in the function of the distance driven. Numbers give the distance at the beginning of the respective route or cycle. The percentages give the ratios of the 10–23 nm to the 23 nm concentrations. In dark color with R the regeneration events. Nonvolatile PN laboratory limit for the worldwide harmonized light-duty vehicles test cycle (WLTC) 6 × 10¹¹ p/km and 1.5 times higher on the road. RDE = real-driving emissions; WLTC = worldwide harmonized light-duty vehicles test cycle.

Figure 2.
Particle number (PN) emissions during three regeneration events at 100 km/h (RA, RB and RC of Figure 1): (a) nonvolatile PN > 23 nm and total PN > 6 nm (i.e., including volatiles) and (b) typical size distributions of total PN during the three regeneration events. In one case the sampling was conducted from the tailpipe (RC), while at the other two (RA, RB) from the dilution tunnel; all three with cold dilution.

Figure 3.
Nonvolatile particle number (PN) emissions > 23 nm and > 10 nm with and without urea injection as measured with the system with catalytic stripper (CS1). PN instruments measuring from the dilution tunnel, while NOx from the tailpipe.
Figure 3.
Nonvolatile particle number (PN) emissions > 23 nm and > 10 nm with and without urea injection as measured with the system with catalytic stripper (CS1). PN instruments measuring from the dilution tunnel, while NOx from the tailpipe.

Figure 4.
Nonvolatile particle number (PN) emissions during a cold start: (a) nonvolatile PN > 23 nm and > 10 nm and (b) size distributions of nonvolatile PN during the three points given in panel (a). All instruments measuring from the dilution tunnel.
Figure 4.
Nonvolatile particle number (PN) emissions during a cold start: (a) nonvolatile PN > 23 nm and > 10 nm and (b) size distributions of nonvolatile PN during the three points given in panel (a). All instruments measuring from the dilution tunnel.

Figure 5.
Nonvolatile particle number (PN) emissions during a cold start: (a) PN > 23 nm and > 10 nm with instruments with evaporation tube (ET) or catalytic stripper (CS) and (b) as panel (a) for a different cold start with preheating of the diesel oxidation catalyst (DOC). All instruments measuring from the dilution tunnel.

Figure 6.
Particle number (PN) emissions during the second regeneration event at 100 km/h: (a) Total (i.e., including volatiles) measured with the EEPS and nonvolatile particles with the rest instruments using evaporation tube (ET) or catalytic strippers (CS). The estimated mass from EEPS is also plotted; (b) size distributions of total PN for the times indicated in panel (a).

Figure 7.
Nonvolatile particle number (PN) emissions >23 nm and >10 nm for the on-road real-driving emissions (RDE) and laboratory worldwide harmonized light-duty vehicles test cycle (WLTC) tests. Dotted lines give the PN limit in the laboratory and on the road.
Figure 7.
Nonvolatile particle number (PN) emissions >23 nm and >10 nm for the on-road real-driving emissions (RDE) and laboratory worldwide harmonized light-duty vehicles test cycle (WLTC) tests. Dotted lines give the PN limit in the laboratory and on the road.

Figure 8.
Experimental setup (not in scale). The four tunnel probes in the dilution tunnel were at the same cross-section. CS = catalytic stripper; CPC = condensation particle counter; EEPS = engine exhaust particle sizer; ET = evaporation tube; D = diameter; PND = particle number diluter. Continuous lines: AVL; dotted lines: TSI; double dotted lines: Horiba; dashed lines: Airmodus: large dashed lines: Testo.

© 2020 by the author. Licensee MDPI, Basel, Switzerland. This article is an open access article distributed under the terms and conditions of the Creative Commons Attribution (CC BY) license (http://creativecommons.org/licenses/by/4.0/).
Share and Cite
MDPI and ACS Style
Giechaskiel, B. Particle Number Emissions of a Diesel Vehicle during and between Regeneration Events. Catalysts 2020, 10, 587. https://0-doi-org.brum.beds.ac.uk/10.3390/catal10050587
AMA Style
Giechaskiel B. Particle Number Emissions of a Diesel Vehicle during and between Regeneration Events. Catalysts. 2020; 10(5):587. https://0-doi-org.brum.beds.ac.uk/10.3390/catal10050587
Chicago/Turabian StyleGiechaskiel, Barouch. 2020. "Particle Number Emissions of a Diesel Vehicle during and between Regeneration Events" Catalysts 10, no. 5: 587. https://0-doi-org.brum.beds.ac.uk/10.3390/catal10050587
Note that from the first issue of 2016, this journal uses article numbers instead of page numbers. See further details here.