Effect of Synthesis Conditions of Nitrogen and Platinum Co-Doped Titania Films on the Photocatalytic Performance under Simulated Solar Light


Abstract
:1. Introduction
2. Results
3. Discussion
4. Materials and Methods
Supplementary Materials
Author Contributions
Funding
Acknowledgments
Conflicts of Interest
References
- Kutsenko, V.Y.; Lopatina, Y.Y.; Bossard-Giannesini, L.; Marchenko, O.A.; Pluchery, O.; Snegir, S.V. Alkylthiol self-assembled monolayers on Au(111) with tailored tail groups for attaching gold nanoparticles. Nanotechnology 2017, 28, 1–8. [Google Scholar] [CrossRef] [PubMed] [Green Version]
- Ischenko, E.V.; Yatsimirsky, V.K.; Dyachenko, A.G.; Borysenko, M.V. Cu-Co-Fe oxide catalysts supported on carbon nanotubes in the reaction of CO oxidation. Pol. J. Chem. 2008, 82, 291–297. [Google Scholar]
- Laguta, I.; Stavinskaya, O.; Kazakova, O.; Fesenko, T.; Brychka, S. Green synthesis of silver nanoparticles using Stevia leaves extracts. Appl. Nanosci. 2019, 9, 755–765. [Google Scholar] [CrossRef]
- Vareda, J.P.; Valente, A.J.M.; Duraes, L. Assessment of heavy metal pollution from anthropogenic activities and remediation strategies: A review. J. Environ. Manag. 2019, 246, 101–118. [Google Scholar] [CrossRef]
- Etacheri, V.; Di Valentin, C.; Schneider, J.; Bahnemann, D.; Pillai, S.C. Visible-light activation of TiO2 photocatalysts: Advances in theory and experiments. J. Photochem. Photobiol. C 2015, 25, 1–29. [Google Scholar] [CrossRef] [Green Version]
- Mitoraj, D.; Kisch, H. The nature of nitrogen-modified titanium dioxide Photocatalysts active in visible light. Angew. Chem. Int. Ed. 2008, 47, 9975–9978. [Google Scholar] [CrossRef]
- Surówka, M.; Kobielusz, M.; Trochowski, M.; Buchalska, M.; Kruczała, K.; Broś, P.; Macyk, W. Iron and other metal species as phase-composition controllers influencing the photocatalytic activity of TiO2 materials. Appl. Catal. B: Environ. 2019, 247, 173–181. [Google Scholar] [CrossRef]
- Linnik, O.; Chorna, N.; Smirnova, N. Nonporous iron titanate thin films doped with nitrogen: Optical, structural and photocatalytic properties. Nanoscale Res. Lett. 2017, 12, 249–258. [Google Scholar] [CrossRef] [Green Version]
- Dolat, D.; Mozia, S.; Ohtani, B.; Morawski, A.W. Nitrogen, iron-single modified (N-TiO2, Fe-TiO2) and co-modified (Fe,N-TiO2) rutile titanium dioxide as visible-light active photocatalysts. Chem. Eng. J. 2013, 225, 358–364. [Google Scholar] [CrossRef]
- Chorna, N.; Smirnova, N.; Vorobets, V.; Kolbasov, G.; Linnik, O. Nitrogen doped iron titanate films: Photoelectrochemical, electrocatalytic, photocatalytic and structural features. Appl. Surf. Sci. 2019, 473, 343–351. [Google Scholar] [CrossRef]
- Kisch, H. Semiconductor Photocatalysis Principles and Application; Wiley-VCH Verlag GmbH&Co: Weinheim, Germany, 2015; pp. 55–68. [Google Scholar] [CrossRef]
- Sato, S. Photocatalytic activity of NOx-doped in the visible light region. Chem. Phys. Lett. 1986, 123, 126–128. [Google Scholar] [CrossRef]
- Asahi, R.; Morikawa, T.; Ohwaki, T.; Aoki, K.; Taga, Y. Visible-light photocatalysis in nitrogen-doped titanium oxides. Science 2001, 293, 269–271. [Google Scholar] [CrossRef] [PubMed]
- Socol, G.; Gnatyuk, Y.; Stefan, N.; Smirnova, N.; Djokić, V.; Sutan, C.; Malinovschi, V.; Stanculescu, A.; Korduban, O.; Mihailescu, I.N. Photocatalytic activity of pulsed laser deposited TiO2 thin films in N2, O2 and CH4. Thin Solid Films 2010, 518, 4648–4653. [Google Scholar] [CrossRef]
- Sakthivel, S.; Janczarek, M.; Kisch, H. Visible light activity and photoelectrochemical properties of nitrogen-doped TiO2. J. Phys. Chem. B 2004, 108, 19384–19387. [Google Scholar] [CrossRef]
- Tryba, B.; Wozniak, M.; Zolnierkiewicz, G.; Guskos, N.; Morawski, M.; Colbeau-Justin, C.; Wrobel, R.; Nitta, A.; Ohtani, B. Influence of an electronic structure of N-TiO2 on its photocatalytic activity towards decomposition of acetaldehyde under UV and fluorescent lamps irradiation. Catalysts 2018, 8, 85. [Google Scholar] [CrossRef] [Green Version]
- Sirivallop, A.; Areerob, T.; Chiarakorn, S. Enhanced visible light photocatalytic activity of N and Ag doped and co-doped TiO2 synthesized by using an in-situ solvothermal method for gas phase ammonia removal. Catalysts 2020, 10, 251. [Google Scholar] [CrossRef] [Green Version]
- Somekawa, S.; Kusumoto, Y.; Ikeda, M.; Ahmmad, B.; Horie, Y. Fabrication of N-doped TiO2 thin films by laser ablation method: Mechanism of N-doping and evaluation of the thin films. Catal. Commun. 2008, 9, 437–440. [Google Scholar] [CrossRef]
- Pandian, R.; Natarajan, G.; Dhaipule, K.N.G.; Prasad, A.K.; Kamruddin, M.; Tyagi, A.K. Types of nitrogen incorporation in reactively sputtered titania thin films: Influence on UV–visible, photocatalytic and photoconduction properties. Thin Solid Films 2016, 616, 466–476. [Google Scholar] [CrossRef]
- Saha, N.C.; Tompkins, H.G. Titanium nitride oxidation chemistry: An x-ray photoelectron spectroscopy study. J. Appl. Phys. 1992, 72, 3072–3079. [Google Scholar] [CrossRef]
- Asahi, R.; Morikawa, T. Nitrogen complex species and its chemical nature in TiO2 for visible-light sensitized photocatalysis. Chem. Phys. 2007, 339, 57–63. [Google Scholar] [CrossRef]
- Di Valentin, C.; Pacchioni, G.; Selloni, A.; Livraghi, S.; Giamello, E. Characterization of paramagnetic species in N-doped TiO2 powders by EPR spectroscopy and DFT calculations. J. Phys. Chem. B 2005, 109, 11414–11419. [Google Scholar] [CrossRef] [PubMed]
- Napoli, F.; Chiesa, M.; Livraghi, S.; Giamello, E.; Agnoli, S.; Granozzi, G.; Pacchioni, G.; Di Valentin, C. The nitrogen photoactive centre in N-doped titanium dioxide formed via interaction of N atoms with the solid. Nature and energy level of the species. Chem. Phys. Lett. 2009, 477, 135–138. [Google Scholar] [CrossRef]
- Wu, M.; Hiltunen, J.; Sápi, A.; Avila, A.; Larsson, W.; Liao, H.; Huuhtanen, M.; Tóth, G.; Shchukarev, A.; Laufer, N.; et al. Nitrogen-doped anatase nanofibers decorated with noble metal nanoparticles for photocatalytic production of hydrogen. ACS Nano 2011, 5, 5025–5030. [Google Scholar] [CrossRef]
- Wang, S.; Ding, Z.; Chang, X.; Xu, J.; Wang, D.-H. Modified nano-TiO2 based composites for environmental photocatalytic applications. Catalysts 2020, 10, 759. [Google Scholar] [CrossRef]
- Linnik, O.; Smirnova, N.; Korduban, O.; Eremenko, A. Gold nanoparticles into Ti1-xZnxO2 films: Synthesis, structure and application. Mater. Chem. Phys. 2013, 142, 318–324. [Google Scholar] [CrossRef]
- Ahmed, L.M.; Ivanova, I.; Hussein, F.H.; Bahnemann, D.W. Role of platinum deposited on TiO2 in photocatalytic methanol oxidation and dehydrogenation reactions. Int. J. Photoenergy 2014, 2014, 1–9. [Google Scholar] [CrossRef] [Green Version]
- Kim, S.; Hwang, S.-J.; Choi, W. Visible light active platinum-ion-doped TiO2 photocatalyst. J. Phys. Chem. B 2005, 109, 24260–24267. [Google Scholar] [CrossRef]
- Guayaquil-Sosa, J.F.; Calzada, A.; Serrano, B.; Escobedo, S.; de Lasa, H. Hydrogen production via water dissociation using Pt–TiO2 photocatalysts: An oxidation–reduction network. Catalysts 2017, 7, 324. [Google Scholar] [CrossRef] [Green Version]
- Higashimoto, S.; Katsuura, K.; Yamamoto, M.; Takahashi, M. Photocatalytic activity for decomposition of volatile organic compound on Pt-WO3 enhanced by simple physical mixing with TiO2. Catal. Commun. 2020, 133, 105831. [Google Scholar] [CrossRef]
- Tossi, C.; Hällström, L.; Selin, J.; Vaelma, M.; See, E.; Lahtinen, J.; Tittonen, I. Size- and density-controlled photodeposition of metallic platinum nanoparticles on titanium dioxide for photocatalytic applications. J. Mater. Chem. A 2019, 7, 14519–14525. [Google Scholar] [CrossRef] [Green Version]
- See, E.M.; Tossi, C.; Hällström, L.; Tittonen, I. Photodeposition of RuOx nanostructures on TiO2 films with a controllable morphology. ACS Omega 2020, 5, 10671–10679. [Google Scholar] [CrossRef] [PubMed]
- Lee, J.; Choi, W. Photocatalytic reactivity of surface platinized TiO2: Substrate specificity and the effect of Pt oxidation state. J. Phys. Chem. B 2005, 109, 7399–7406. [Google Scholar] [CrossRef] [PubMed]
- Sun, H.; Zhou, G.; Liu, S.; Ang, H.M.; Tadé, M.O.; Wang, S. Visible light responsive titania photocatalysts codoped by nitrogen and metal (Fe, Ni, Ag, or Pt) for remediation of aqueous pollutants. Chem. Eng. J. 2013, 231, 18–25. [Google Scholar] [CrossRef]
- Gaponenko, N.V.; Kortov, V.S.; Smirnova, N.P.; Orekhovskaya, T.I.; Nikolaenko, I.A.; Pustovarov, V.A.; Zvonarev, S.V.; Slesarev, A.I.; Linnik, O.P.; Zhukovskii, M.A.; et al. Sol–gel derived structures for optical design and photocatalytic application. Microelectron. Eng. 2012, 90, 131–137. [Google Scholar] [CrossRef]
- Kang, T.D.; Yoon, J.-G. Optical characterization of surface plasmon resonance of Pt nanoparticles in TiO2-SiO2 nanocomposite films. J. Appl. Phys. 2017, 122, 134302. [Google Scholar] [CrossRef]
- Beranek, R.; Kisch, H. Tuning the optical and photoelectrochemical properties of surface-modified TiO2. Photochem. Photobiol. Sci. 2008, 7, 40–48. [Google Scholar] [CrossRef]
- Mitoraj, D.; Kisch, H. On the mechanism of urea-induced titania modification. Chem. A Eur. J. 2010, 16, 261–269. [Google Scholar] [CrossRef]
- Linnik, O.; Khoroshko, L. Non-porous nitrogen and ruthenium co-doped titania films for photocatalysis. Int. J. Nanosci. 2019, 18, 1940043. [Google Scholar] [CrossRef]
- Zhang, Z.; Wang, X.; Long, J.; Gu, Q.; Ding, Z.; Fu, X. Nitrogen-doped titanium dioxide visible light photocatalyst: Spectroscopic identification of photoactive centers. J. Catal. 2010, 276, 201–214. [Google Scholar] [CrossRef]
- Linnik, O.; Petrik, I.; Smirnova, N.; Kandyba, V.; Korduban, O.; Eremenko, A.; Socol, G.; Stefan, N.; Ristoscu, C.; Mihailescu, I.N.; et al. TiO2/ZrO2 thin films synthesized by PLD in low pressure N-, C- and/or O-containing gases: Structural, optical and photocatalytic properties. Dig. J. Nanomater. Biostruct. 2012, 7, 1343–1352. [Google Scholar]
- Linnik, O.; Popescu-Pelin, G.; Stefan, N.; Chorna, N.; Smirnova, N.; Mihailescu, C.N.; Ristoscu, C.; Mihailescu, I.N. Investigation of iron doped TiO2 films synthesized in N2/CH4 via pulsed laser deposition technique. Appl. Nanosci. 2020. [Google Scholar] [CrossRef]
- Sakatani, Y.; Ando, H.; Okusako, K.; Koike, H. Metal ion and N co-doped TiO2 as a visible-light photocatalyst. J. Mater. Res. 2004, 19, 2100–2108. [Google Scholar] [CrossRef]
- Hao, H.; Zhang, J. The study of Iron (III) and Nitrogen co-doped mesoporous TiO2 photocatalysts: Synthesis, characterization and activity. Microporous Mesoporous Mater. 2009, 121, 52–57. [Google Scholar] [CrossRef]
- Bear, J.C.; Gomez, V.; Kefallinos, N.S.; Mcgettrick, J.D.; Barron, A.R.; Dunnill, C.W. Anatase/rutile bi-phasic titanium dioxide nanoparticles for photocatalytic applications enhanced by nitrogen doping and platinum. J. Colloid Interface Sci. 2015, 460, 29–35. [Google Scholar] [CrossRef] [PubMed]
- Batalovic, K.; Bundaleski, N.; Radaković, J.; Abazović, N.; Mitrić, M.; Silva, R.A.; Savić, M.; Belošević-Čavor, J.; Rakočević, Z.; Rangel, C.M. Modification of N-doped TiO2 photocatalysts using noble Metals (Pt, Pd )—A combined XPS and DFT study. Phys. Chem. Chem. Phys. 2017, 19, 7062–7071. [Google Scholar] [CrossRef]
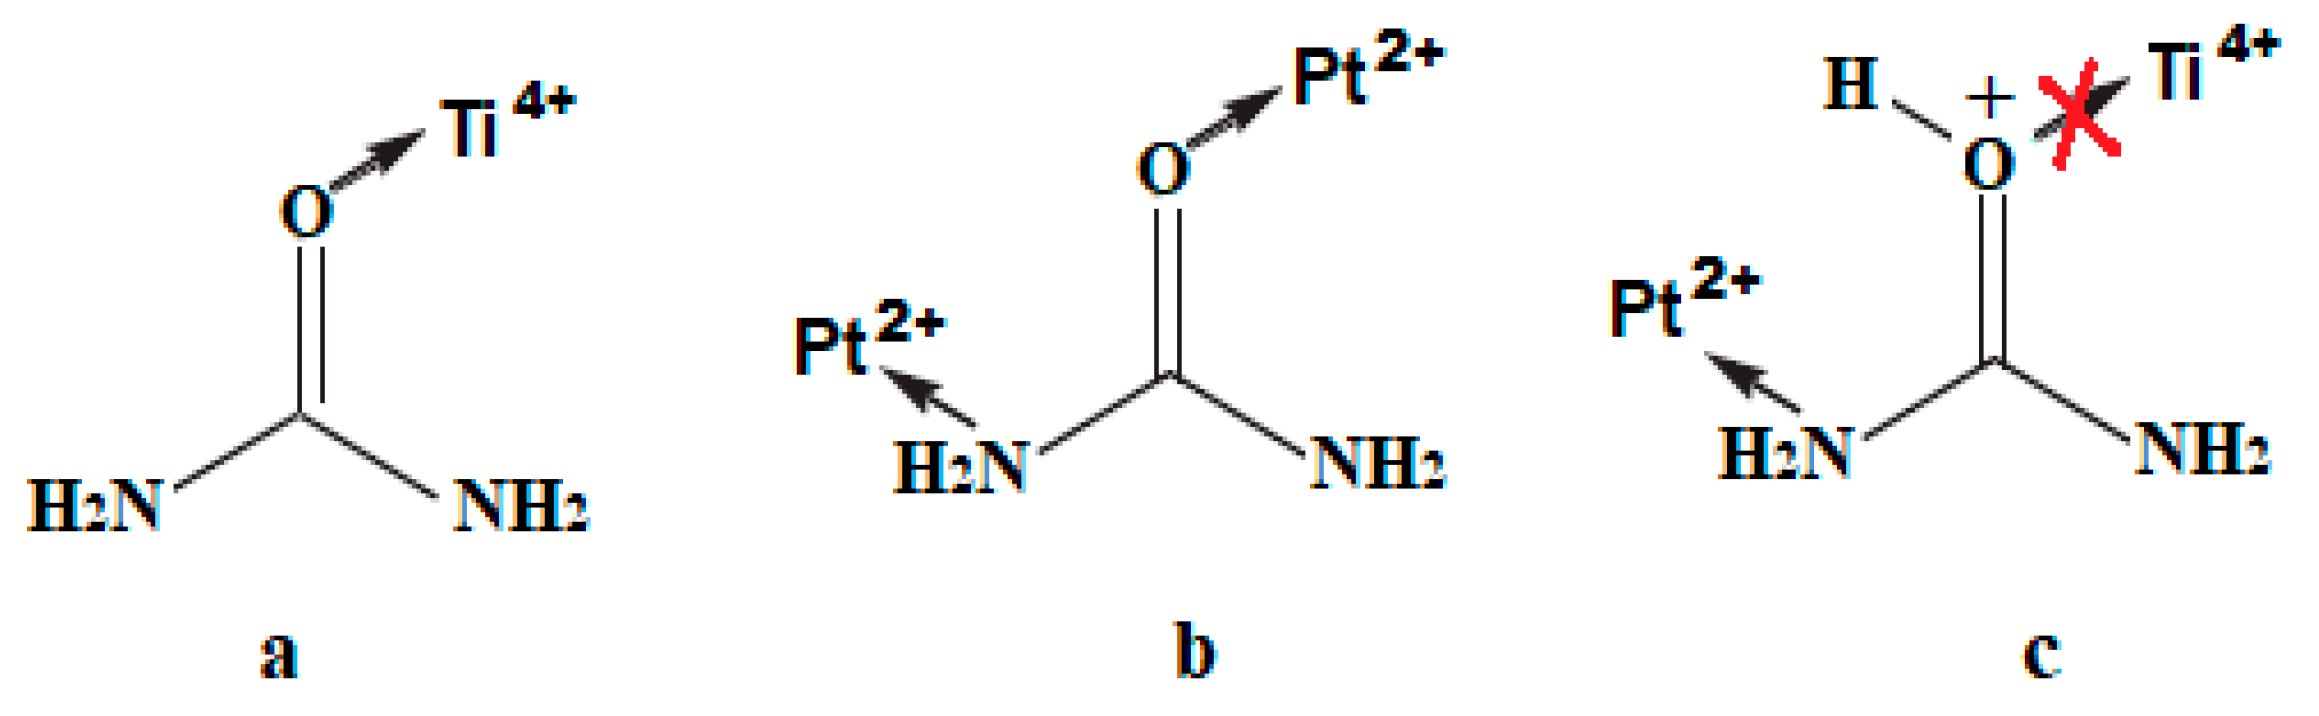
- Theophanides, T.; Harvey, P.D. Structural and spectroscopic of metal-urea complexes. Coord. Chem. Rev. 1987, 76, 237–264. [Google Scholar] [CrossRef]
- Woon, T.C.; Wickramasinghe, W.A.; Fairlie, D.P. Oxygen versus nitrogen coordination of a urea to (diethylenetriamine)platinum(II). Inorg. Chem. 1993, 32, 2190–2194. [Google Scholar] [CrossRef]
- Li, J.; Yang, X.; Ishigaki, T. Urea coordinated titanium trichloride Ti III [OC(NH)2]6Cl3: A single molecular precursor yielding highly visible light responsive TiO2 nanocrystallites. J. Phys. Chem. B 2006, 110, 14611–14618. [Google Scholar] [CrossRef]
- Schaber, P.M.; Colson, J.; Higgins, S.; Thielen, D.; Anspach, B.; Brauer, J. Thermal decomposition (pyrolysis) of urea in an open reaction vessel. Thermochim. Acta 2004, 424, 131–142. [Google Scholar] [CrossRef]
- Saeid, S.; Kråkström, M.; Tolvanen, P.; Kumar, N.; Eränen, K.; Mikkola, J.-P.; Kronberg, L.; Eklund, P.; Peurla, M.; Aho, A.; et al. Advanced oxidation process for degradation of carbamazepine from aqueous solution: Influence of metal modified microporous, mesoporous catalysts on the ozonation process. Catalysts 2020, 10, 90. [Google Scholar] [CrossRef] [Green Version]
- Garbarino, S.; Pereira, A.; Hamel, C.; Irissou, E.; Chaker, M.; Guay, D. Effect of size on the electrochemical stability of Pt nanoparticles deposited on gold substrate. J. Phys. Chem. C 2010, 114, 2980–2988. [Google Scholar] [CrossRef]
- Mosquera, A.; Horwat, D.; Vazquez, L.; Gutiérrez, A. Thermal decomposition and fractal properties of sputter-deposited platinum oxide thin films. J. Mater. Res. 2012, 27, 829–836. [Google Scholar] [CrossRef]
- Womes, M.; Lynch, J.; Bazin, D.; Le Peltier, F.; Morin, S.; Didillon, B. Interaction between Pt(acac)2 and alumina surfaces studied by XAS. Catal. Lett. 2003, 85, 25–31. [Google Scholar] [CrossRef]
- Filez, M.; Redekop, E.A.; Poelman, H.; Galvita, V.V.; Ramachandran, R.K.; Dendooven, J.; Detavernier, C.; Marin, G.B. Unravelling the formation of Pt−Ga alloyed nanoparticles on calcined Ga-modified hydrotalcites by in situ XAS. Chem. Mater. 2014, 26, 5936–5949. [Google Scholar] [CrossRef]
- Makuła, P.; Pacia, M.; Macyk, W. How to correctly determine the band gap energy of modified semiconductor photocatalysts based on UV−Vis spectra. J. Phys. Chem. Lett. 2018, 9, 6814–6817. [Google Scholar] [CrossRef] [Green Version]


| Film | Method 1 | Method 2 |
|---|---|---|
| Ebg, eV | ||
| TiO2 | 3.7 | 3.6 |
| N-TiO2 | 3.8 | 3.6 |
| 0.5Pt-TiO2 | 3.5 | 3.6 |
| 0.5Pt-TiO2UV | 3.7 | 3.4 |
| 0.5Pt,N-TiO2 | 3.5 | 3.4 |
| 0.5Pt,N-TiO2UV | 3.5 | 3.4 |
| 1Pt-TiO2 | 3.5 | 3.5 |
| 1Pt-TiO2UV | 3.5 | 3.3 |
| 1Pt,N-TiO2 | 3.6 | 3.3 |
| 1Pt,N-TiO2UV | 3.6 | 3.2 |
| Film | Pt | N | Ti: | O | Pt | N | Ti | O |
|---|---|---|---|---|---|---|---|---|
| Method 1 | Method 2 | |||||||
| 0.5Pt-TiO2 | 0.004 | - | 1.000 | 2.285 | 0.006 | - | 1.000 | 2.248 |
| 0.5Pt,N-TiO2 | 0.004 | 0.017 | 1.000 | 2.288 | 0.004 | 0.032 | 1.000 | 2.163 |
| 0.5Pt-TiO2UV | 0.003 | - | 1.000 | 2.868 | 0.006 | - | 1.000 | 2.463 |
| 0.5Pt,N-TiO2UV | 0.001 | 0.004 | 1.000 | 3.264 | 0.006 | 0.028 | 1.000 | 2.207 |
| 1Pt-TiO2 (EDS) | 0.004 (0.016) | - - | 1.000 (1.000) | 2.401 (1.645) | 0.013 (0.011) | - - | 1.000 (1.000) | 2.149 (2.116) |
| 1Pt,N-TiO2 (EDS) | 0.005 (0.011) | 0.009 - | 1.000 (1.000) | 2.357 (1.932) | 0.011 (0.014) | 0.043 - | 1.000 (1.000) | 2.085 (1.871) |
| 1Pt-TiO2UV | 0.010 | - | 1.000 | 2.321 | 0.015 | - | 1.000 | 2.230 |
| 1Pt,N-TiO2UV | 0.005 | 0.027 | 1.000 | 3.239 | 0.010 | 0.12 | 1.000 | 2.680 |
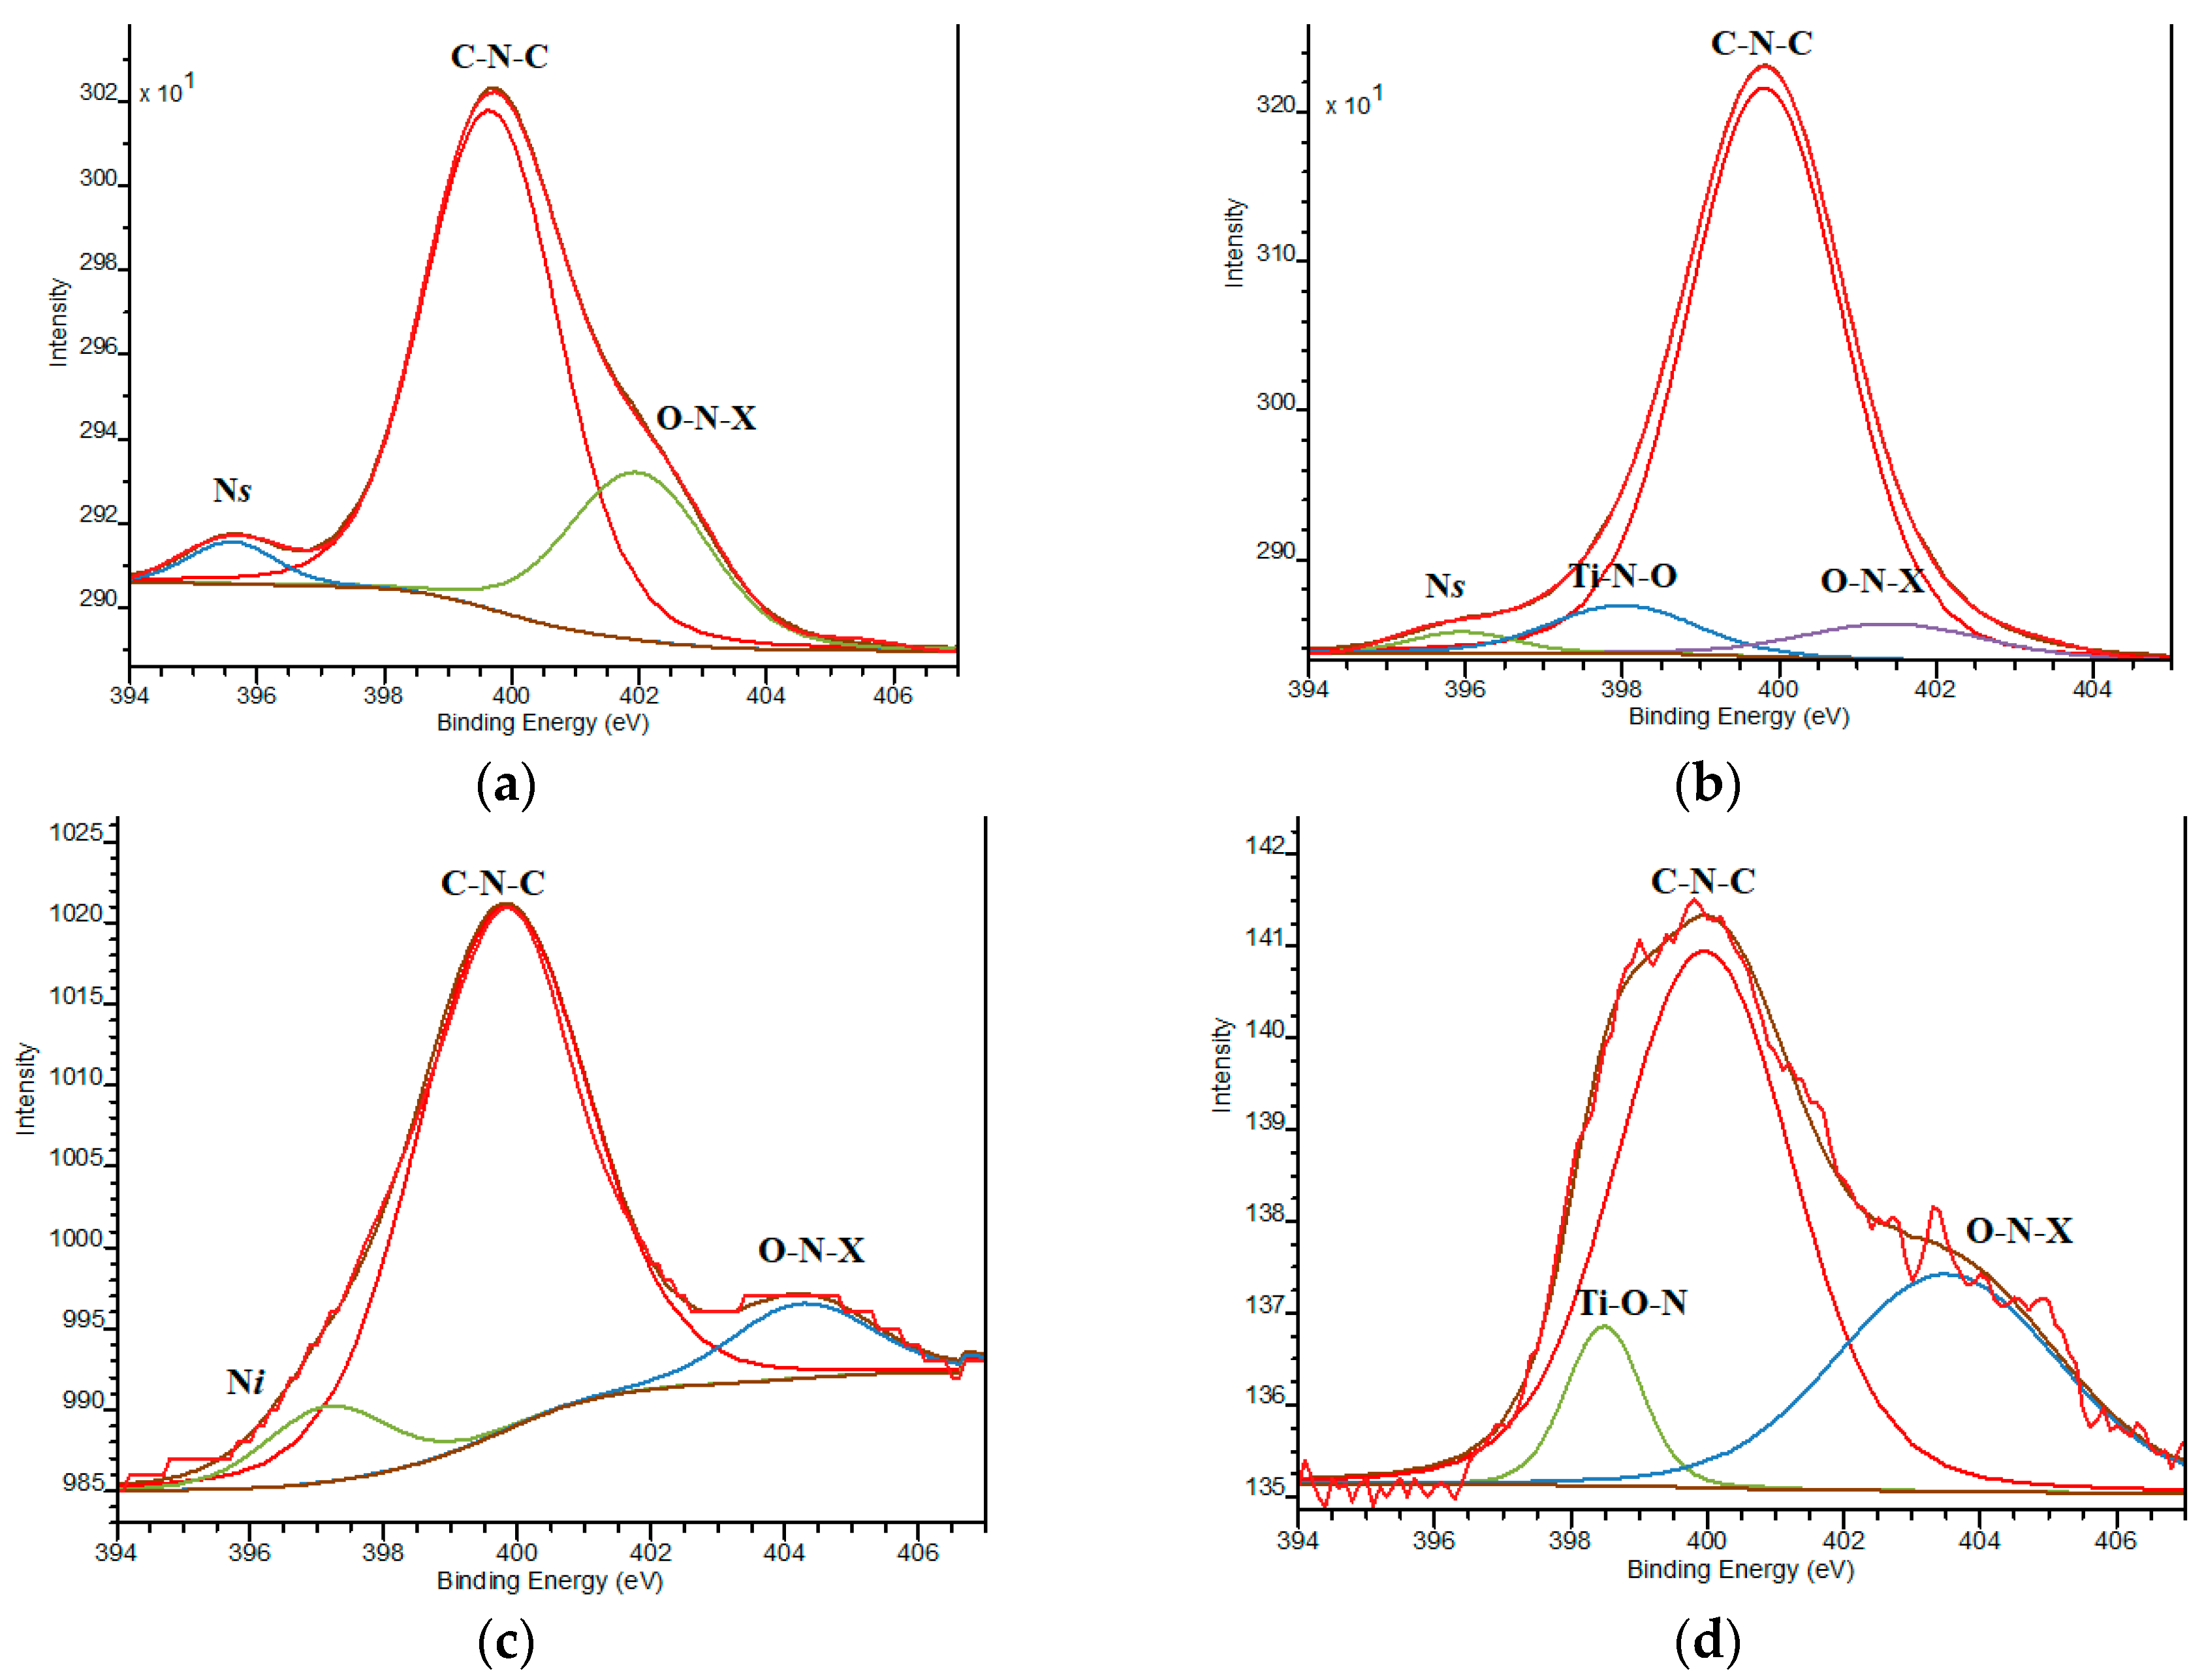
| BE, eV Film | 395.8 ± 0.2 | 397.1 | 398.0 ± 0.3 | 399.8 ± 0.2 | 400.5–404.1 |
|---|---|---|---|---|---|
| Irel, % | |||||
| 0.5Pt,N-TiO2M1 | - | - | 4.8 | 81.7 | 13.5 |
| 0.5Pt,N-TiO2M1UV | - | - | - | 85.3 | 14.7 |
| 1Pt,N-TiO2M1 | 3.5 | - | - | 74.2 | 22.3 |
| 1Pt,N-TiO2M1UV | - | 8.1 | - | 81.8 | 9.4 |
| 0.5Pt,N-TiO2M2 | - | - | 3.5 | 76.8 | 19.7 |
| 0.5Pt,N-TiO2M2UV | - | - | - | 67.6 | 32.4 |
| 1Pt,N-TiO2M2 | 1.9 | - | 6.1 | 84.9 | 7.0 |
| 1Pt,N-TiO2M2UV | - | - | 8.3 | 66.2 | 25.5 |
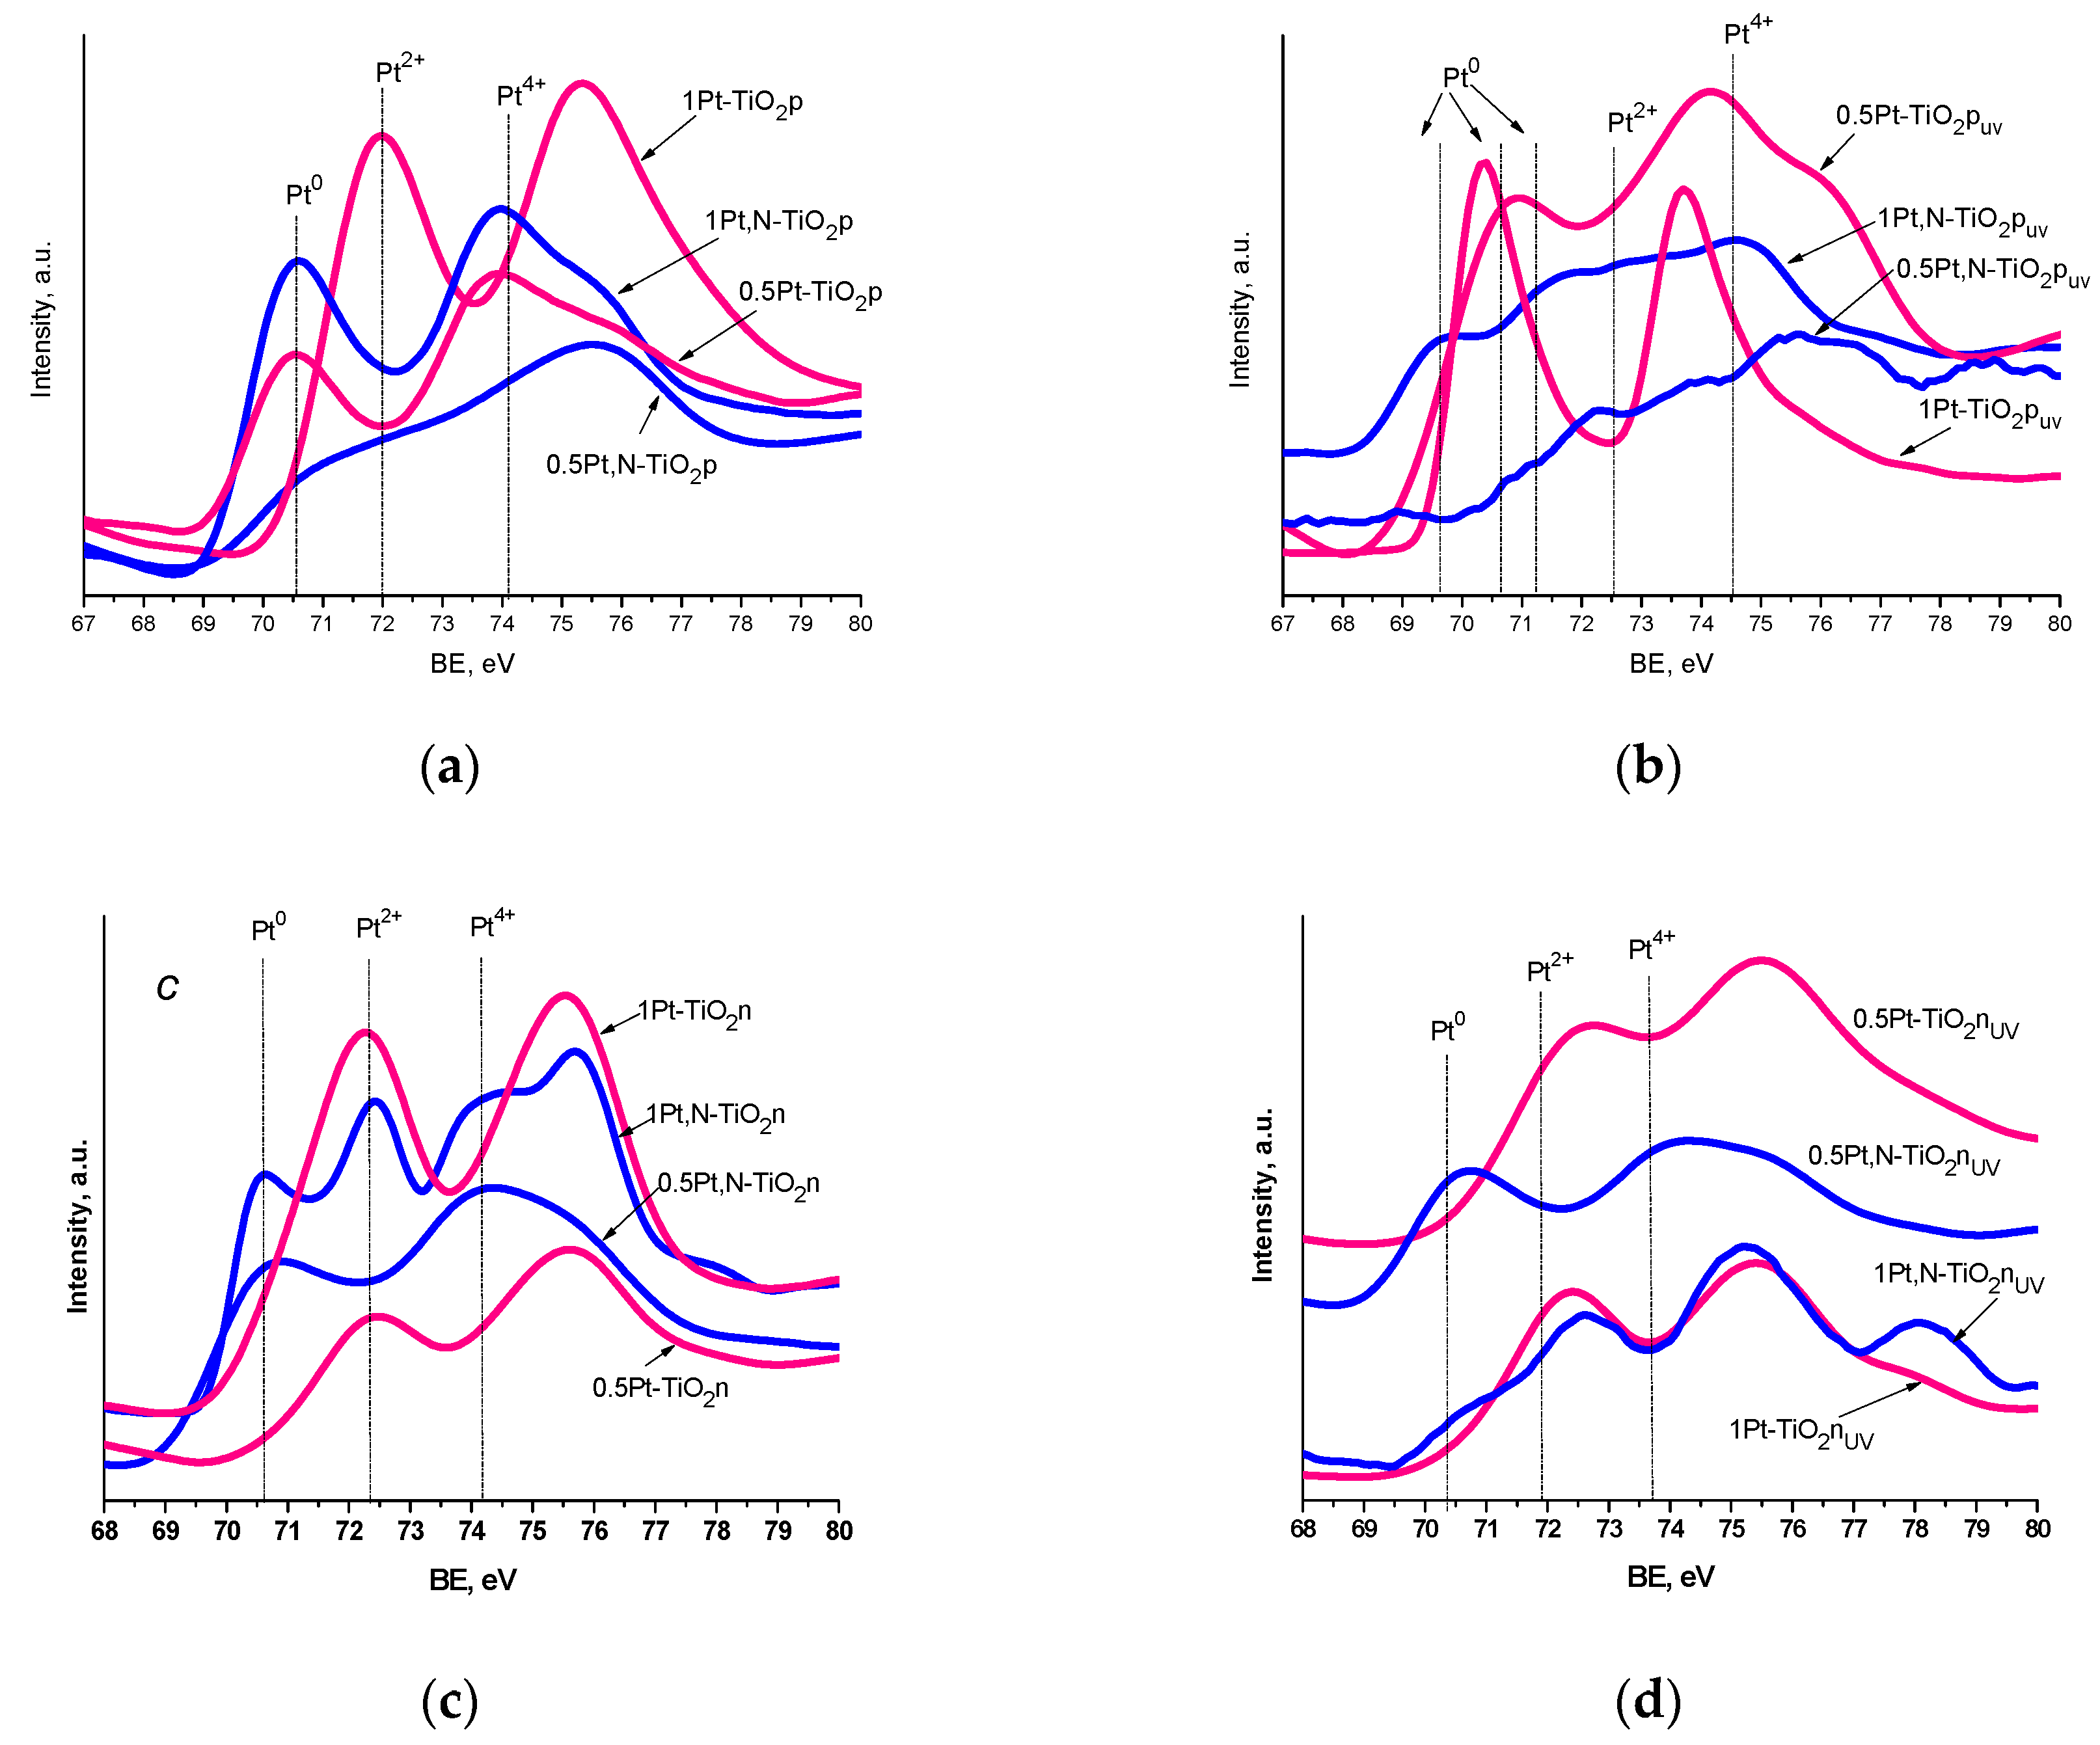
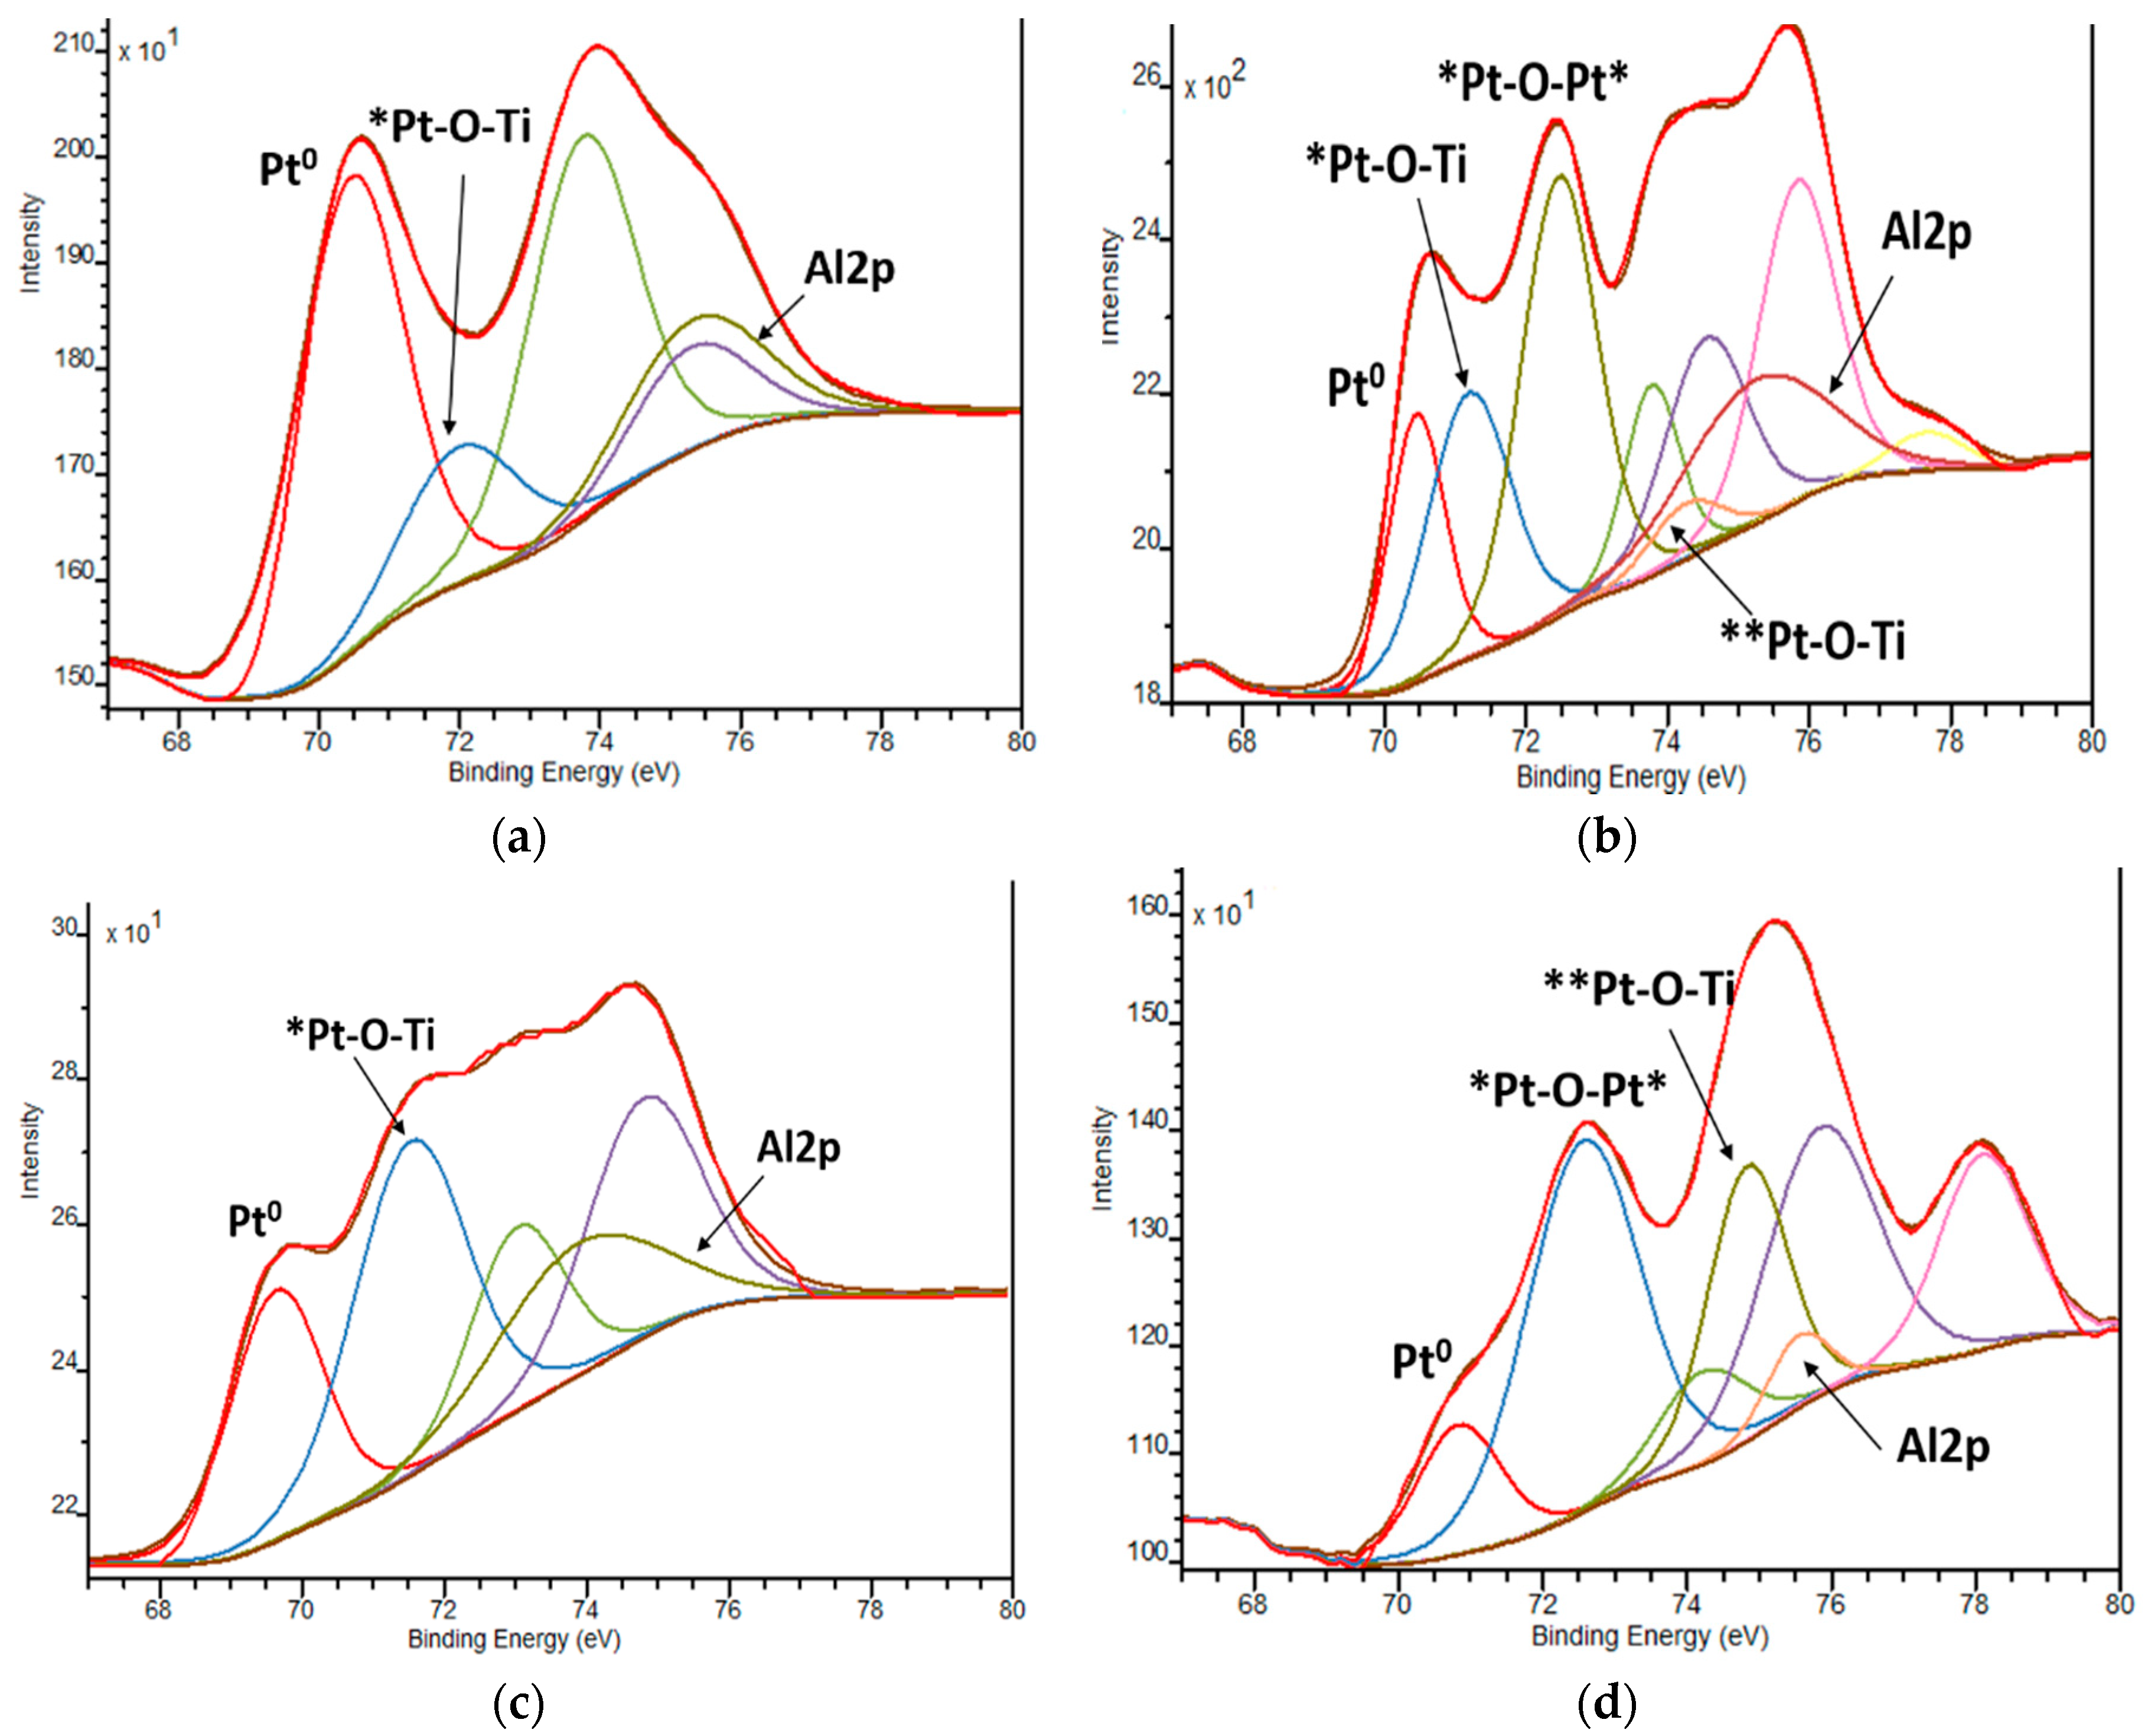
| BE, еV | Pt0 | Pt2+ | Pt0 | Pt2+ | Pt4+ | |||||
|---|---|---|---|---|---|---|---|---|---|---|
| Pt4f7/2 | Іrel | Pt4f7/2 | Іrel | Pt4f7/2 | Іrel | Pt4f7/2 | Іrel | Pt4f7/2 | Іrel | |
| Film | Method 1 | Method 2 | ||||||||
| 0.5Pt-TiO2 | 70.2 | 51.2 | 71.0 72.4 | 36.3 12.5 | - | - | 72.3 | 100.0 | ||
| 0.5Pt,N-TiO2 | 70.8 | 48.3 | 72.4 | 51.7 | 70.6 | 56.3 | 72.3 | 43.7 | - | - |
| 0.5Pt-TiO2UV | 70.7 | 62.3 | 72.5 | 37.7 | - | - | 72.4 | 85.3 | 74.2 | 14.7 |
| 0.5Pt,N-TiO2UV | 71.0 | 32.5 | 72.1 | 67.5 | 70.6 | 69.5 | 72.3 | 30.5 | - | - |
| 1Pt-TiO2 | 71.4 | 11.6 | 72.1 | 88.4 | - | - | 72.0 | 100.0 | - | - |
| 1Pt,N-TiO2 | 70.4 | 76.6 | 72.0 | 23.4 | 70.5 | 19.5 | 71.2 72.5 | 29.2 45.5 | 74.3 | 5.8 |
| 1Pt-TiO2UV | 70.3 | 55.5 | 71.1 | 44.5 | - | - | 72.3 | 83.8 | 74.3 | 16.2 |
| 1Pt,N-TiO2UV | 69.6 | 40.2 | 71.4 | 59.8 | 70.8 | 15.2 | 72.5 | 55.9 | 74.6 | 28.9 |
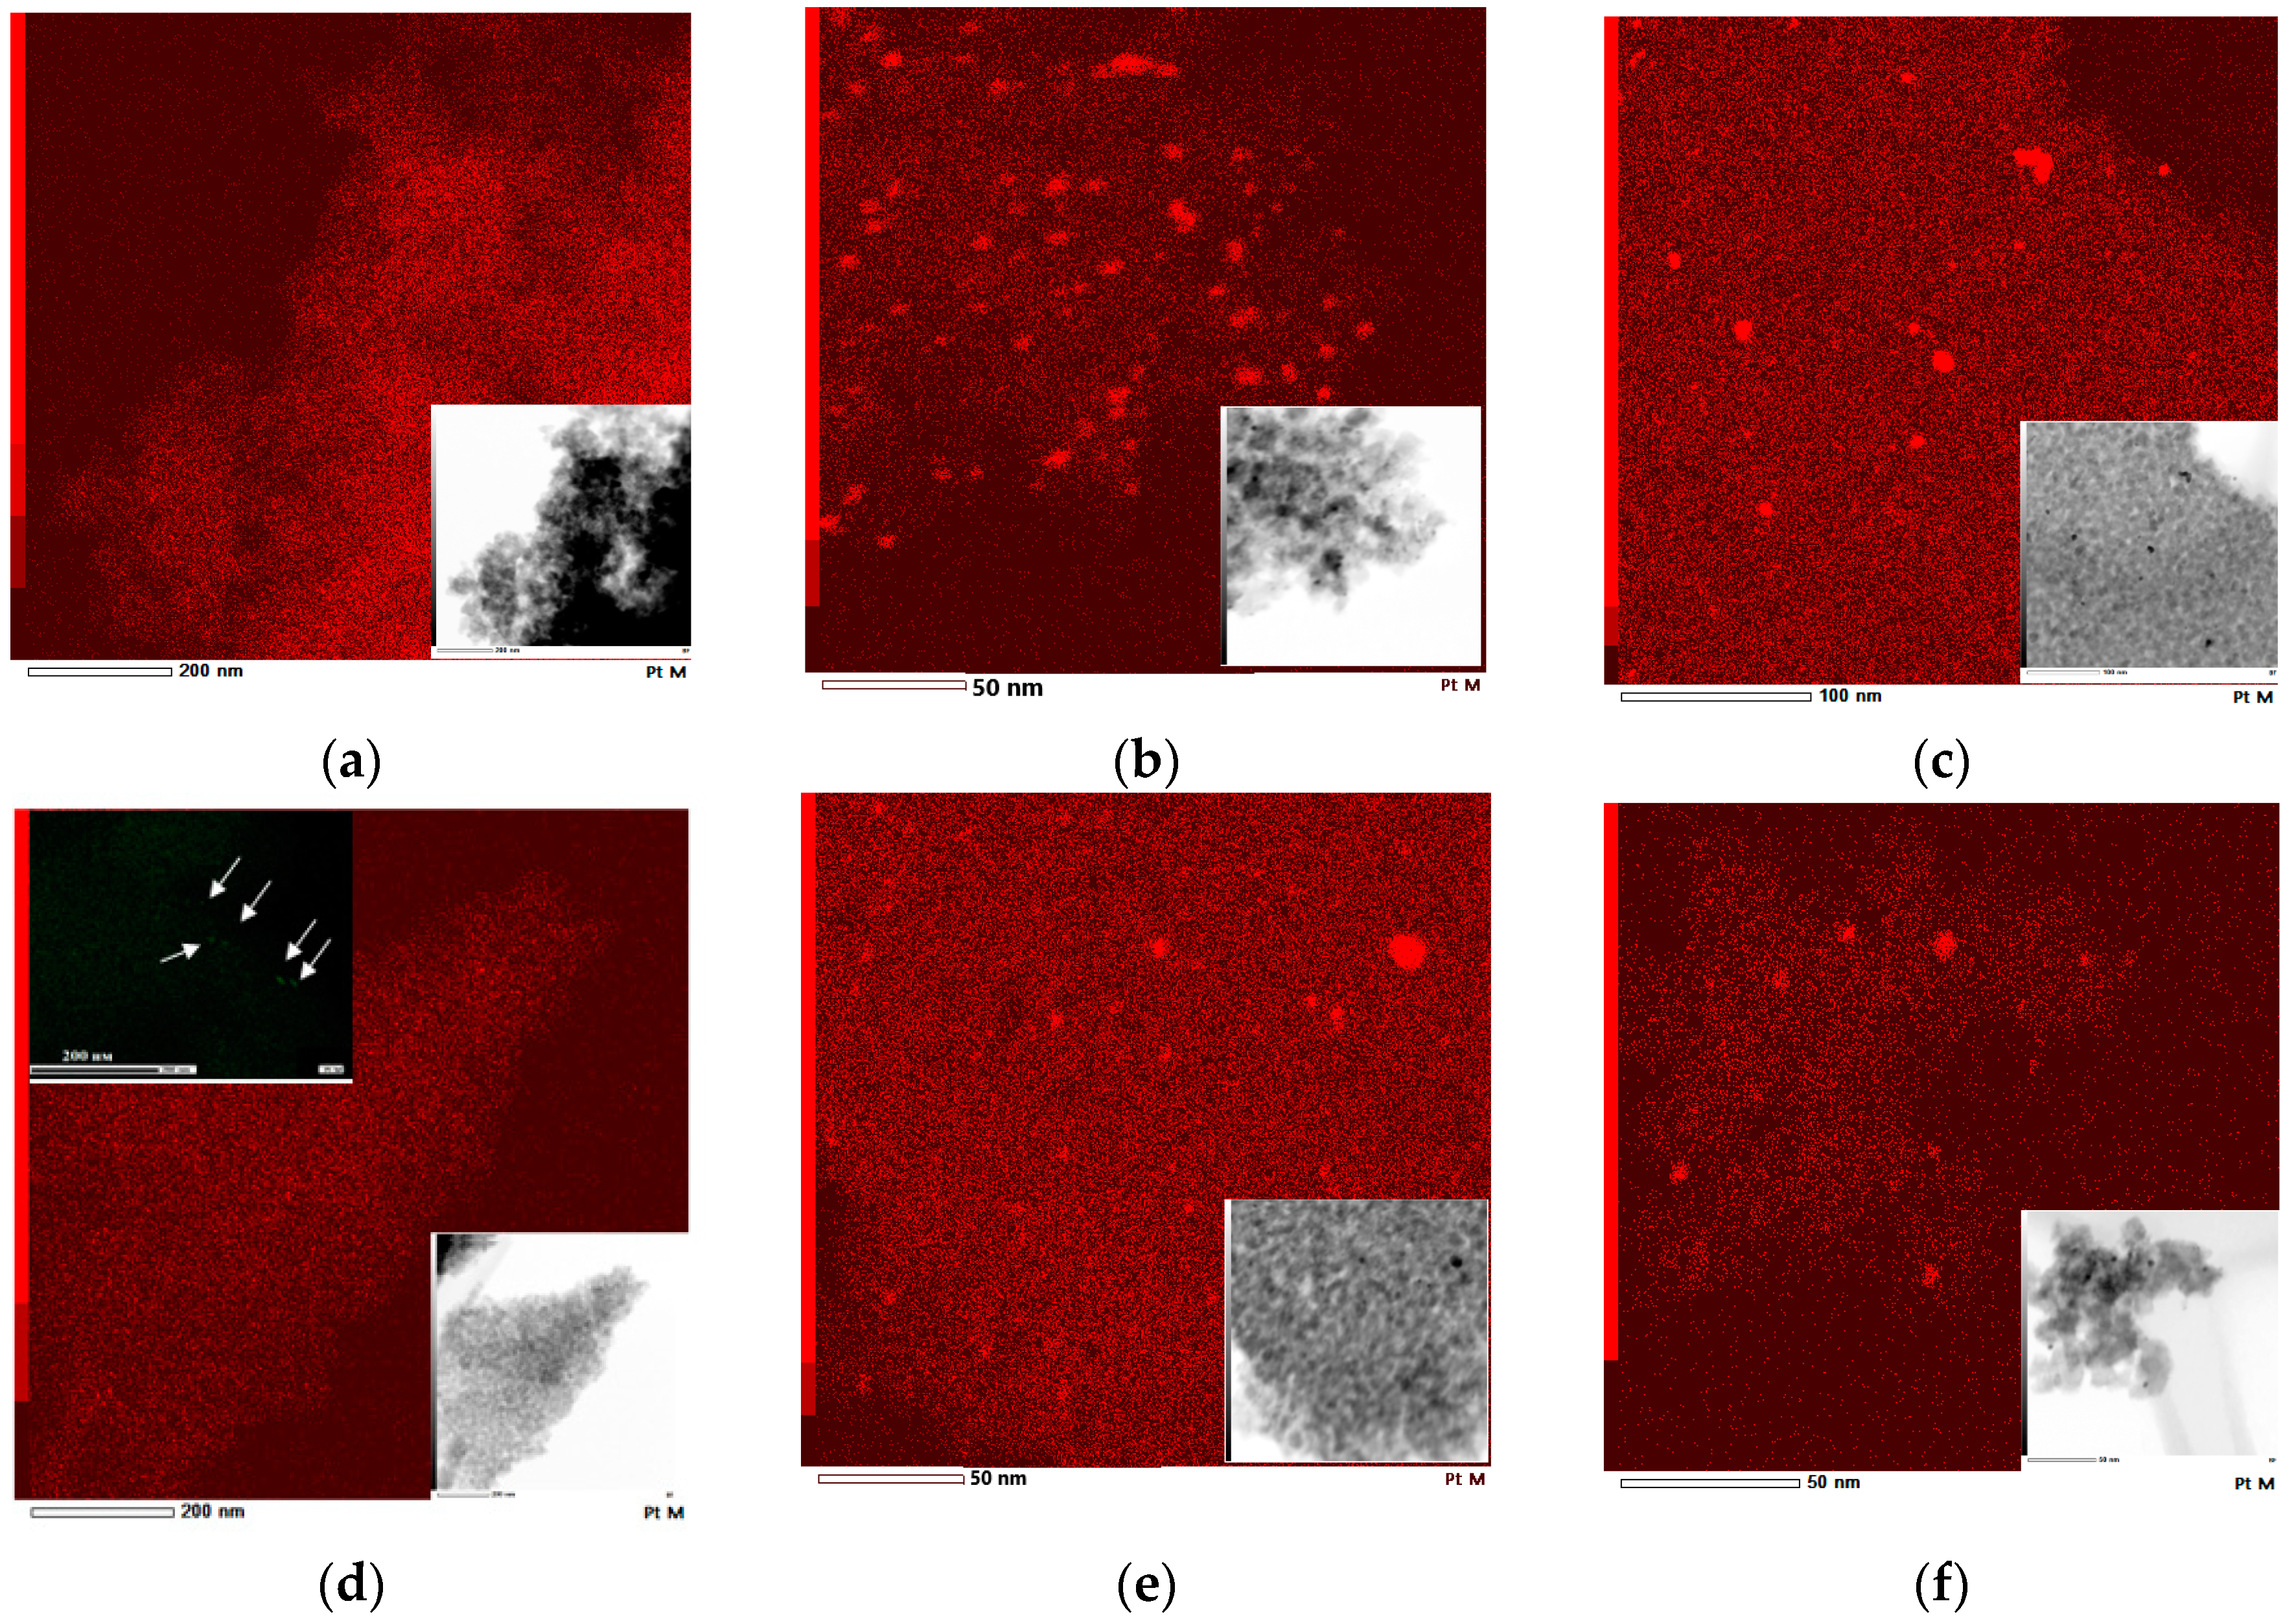
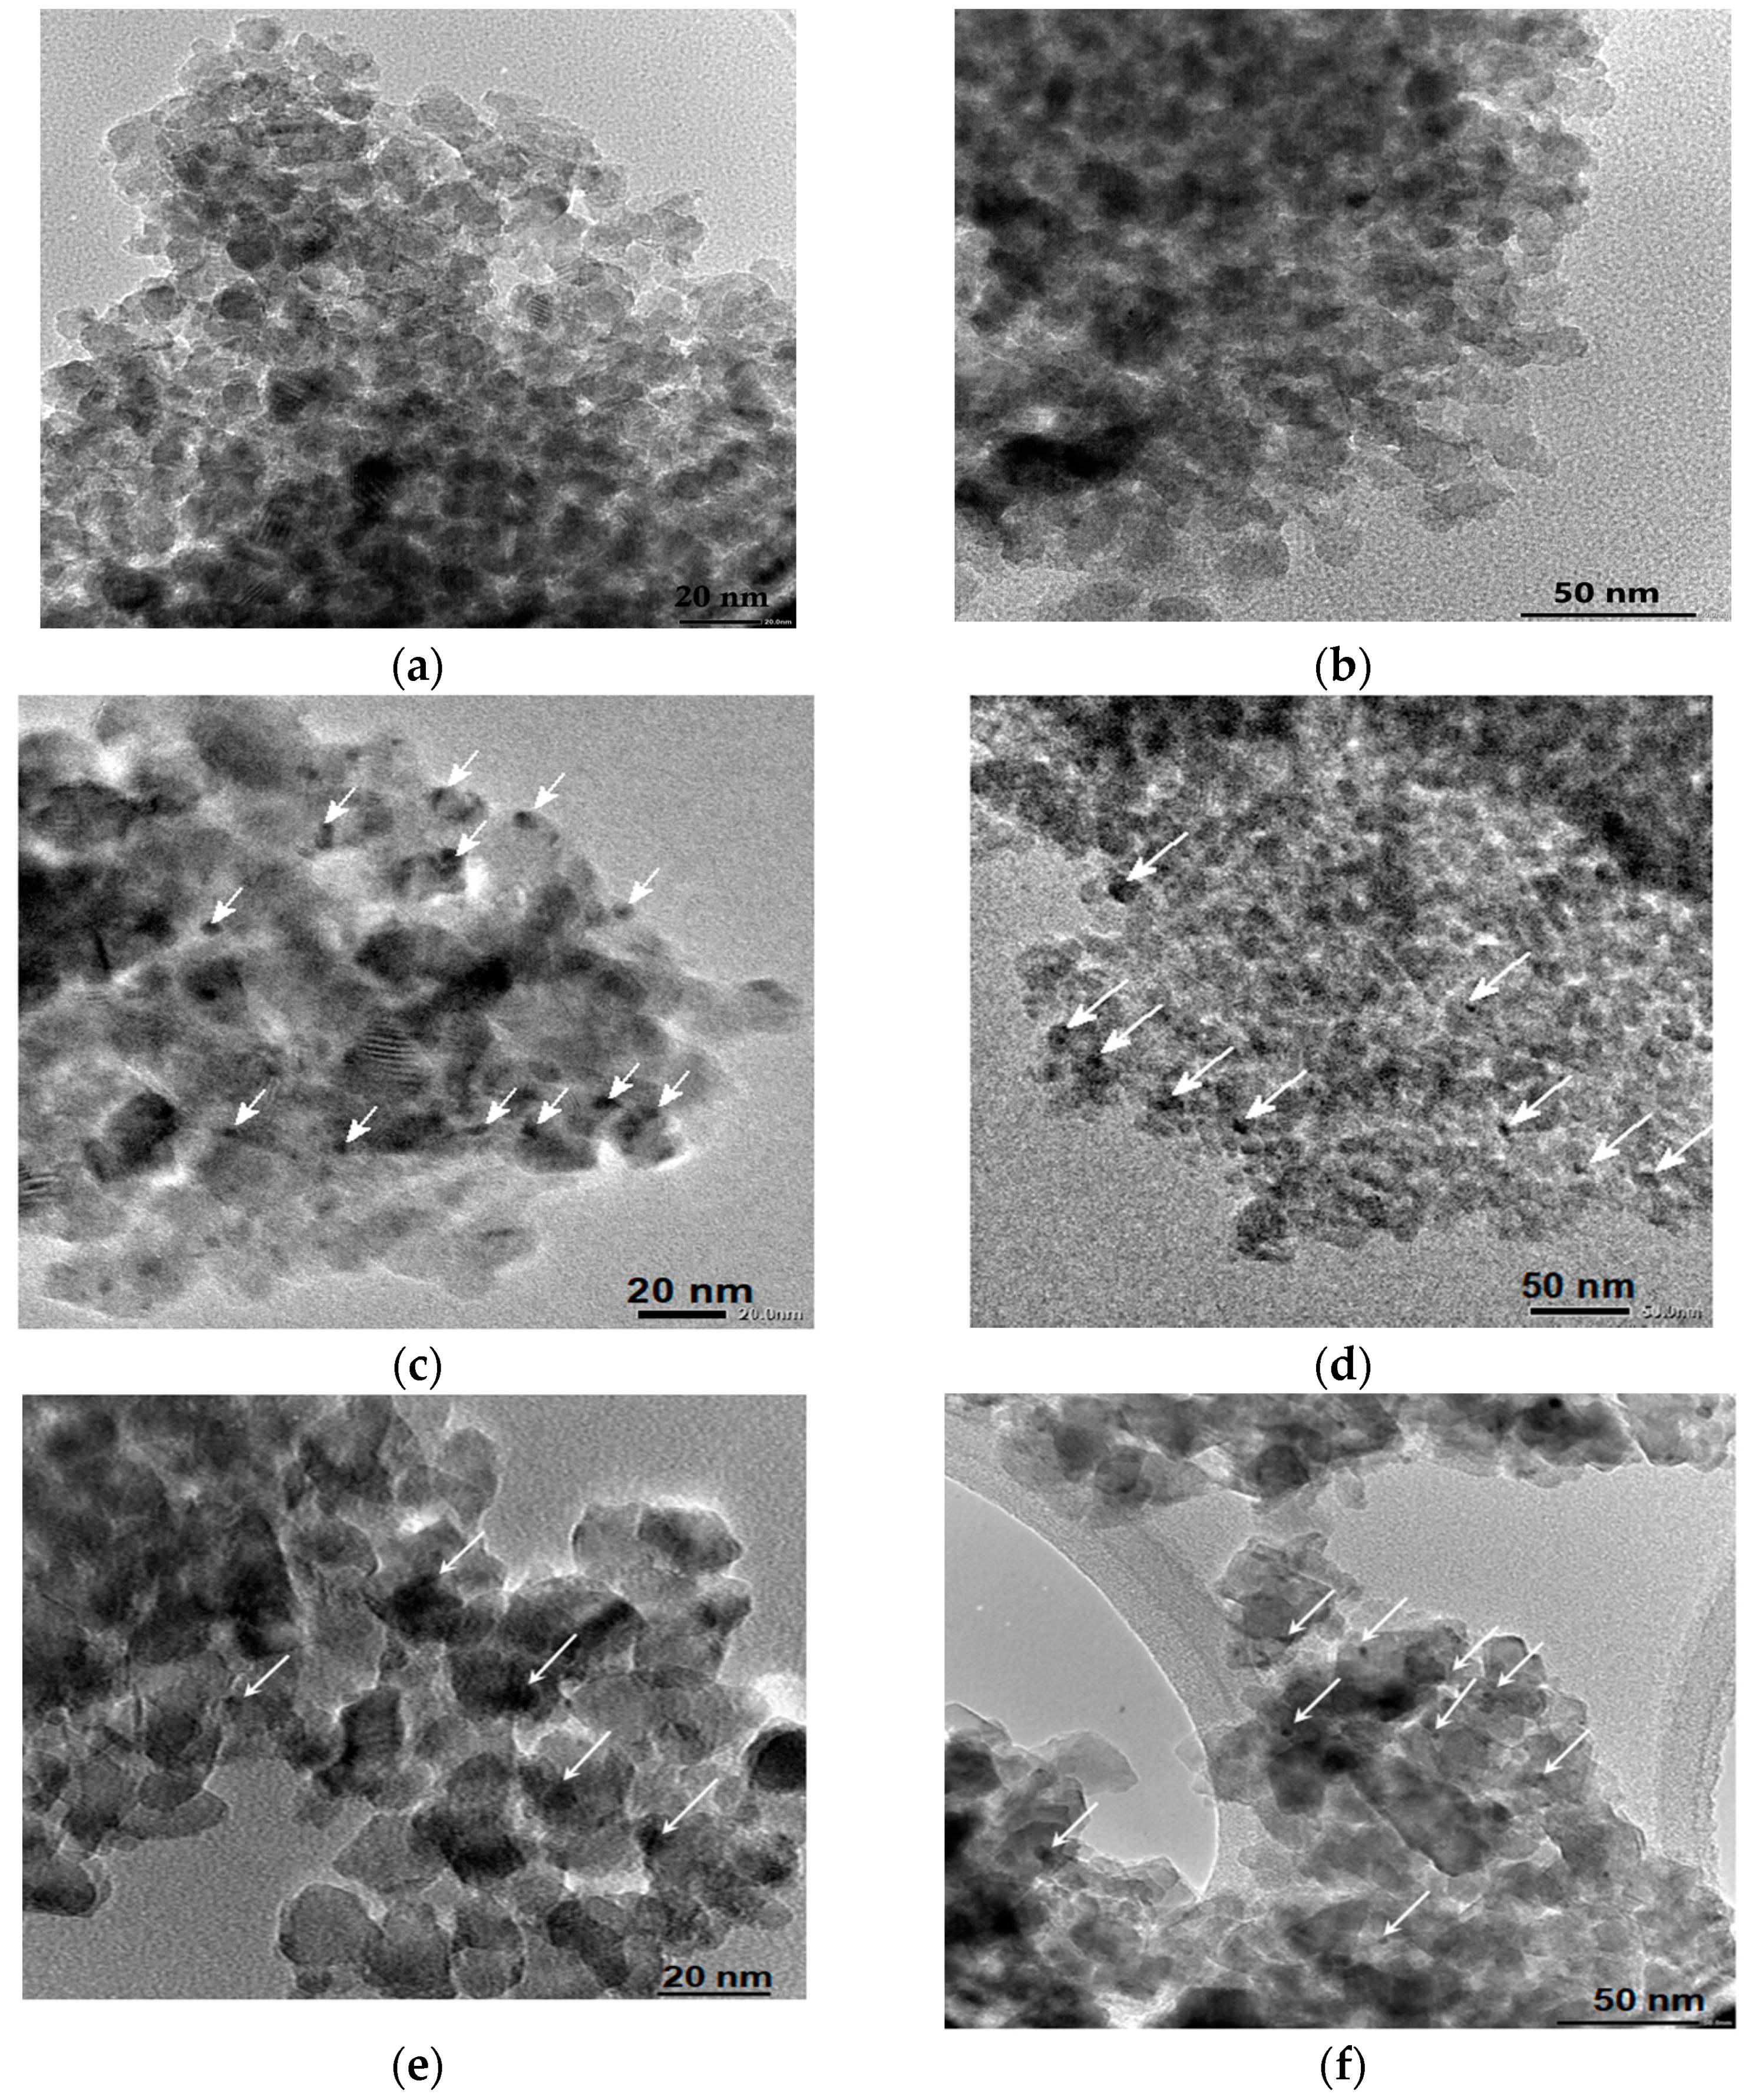
| Sample | Mean Particle Size, nm | d-Spacing, nm | |
|---|---|---|---|
| Pt | TiO2 | ||
| 1% Pt-TiO2M2 | - | 8.7 ± 2.6 | 0.347 |
| 1% Pt,N-TiO2M2 | 3.2 ± 1.5 | 11.6 ± 1.4 | 0.351 |
| 1% Pt-TiO2M1 | 3.2 ± 0.8 | 12.6 ± 1.9 | 0.350 |
| 1% Pt,N-TiO2M1 | 3.3 ± 0.4 | 8.7 ± 1.2 | 0.350 |
| 1% Pt-TiO2M1UV | 3.2 ± 1.7 | 11.5 ± 2.1 | 0.361 |
| 1% Pt,N-TiO2M1UV | 4.1 ± 2.7 | 14.1 ± 3.1 | 0.357 |
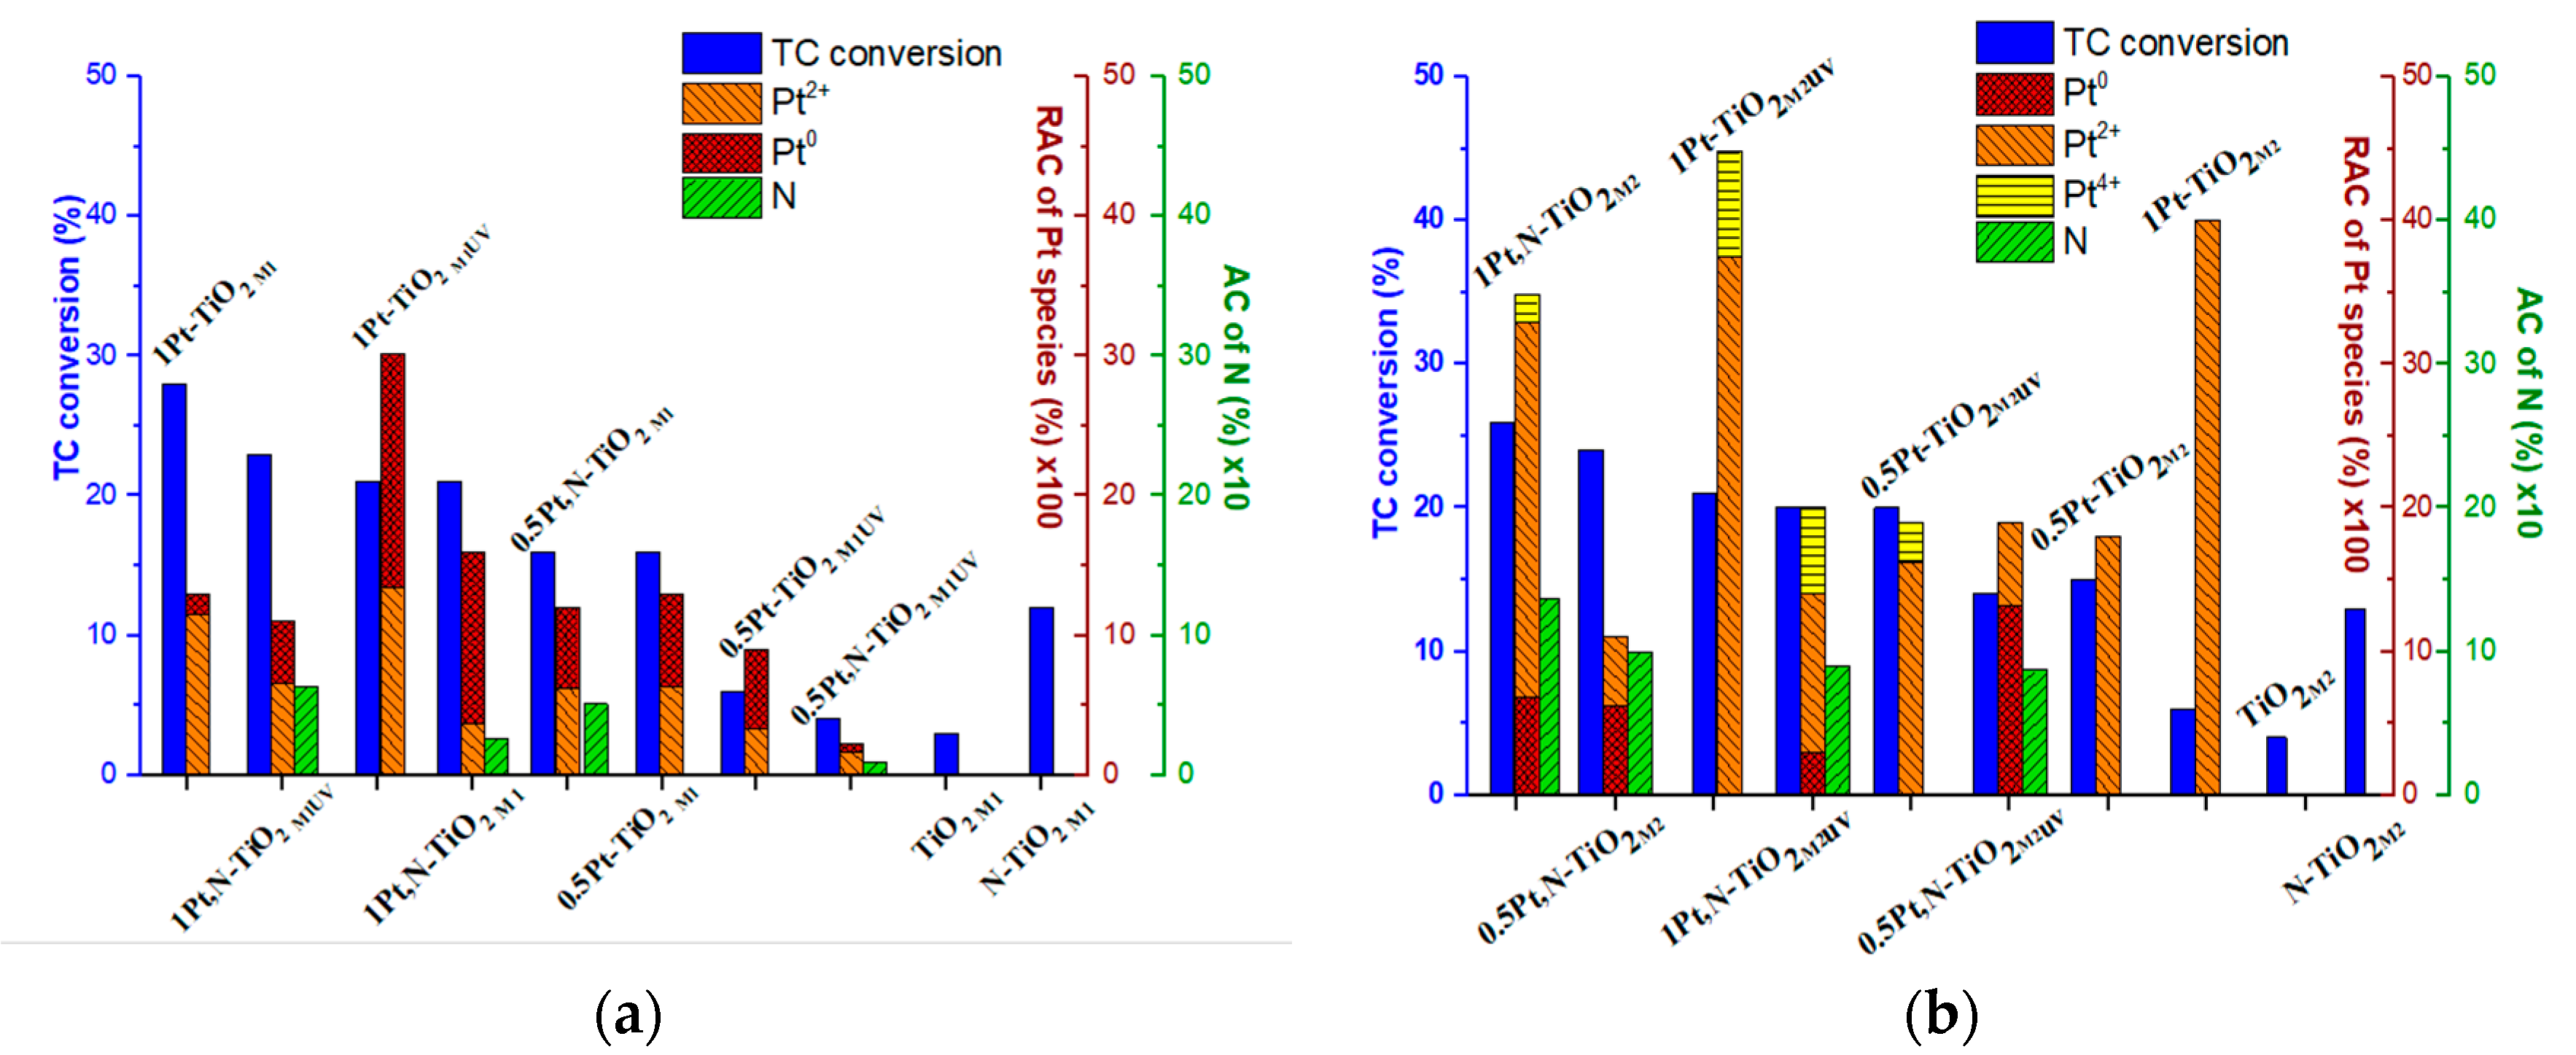
| Film | N | Pt | Pt0 | Pt2+ | N | Pt | Pt0 | Pt2+ | Pt4+ |
|---|---|---|---|---|---|---|---|---|---|
| AC, % | RAC⋅102, % | AC, % | RAC⋅102, % | ||||||
| Method 1 | Method 2 | ||||||||
| 0.5Pt-TiO2 | - | 0.13 | 6.7 | 6.3 | - | 0.18 | - | 18.0 | - |
| 0.5Pt,N-TiO2 | 0.51 | 0.12 | 5.8 | 6.2 | 1.00 | 0.11 | 6.2 | 4.8 | - |
| 0.5Pt-TiO2UV | - | 0.09 | 5.6 | 3.4 | - | 0.19 | - | 16.2 | 2.8 |
| 0.5Pt,N-TiO2UV | 0.09 | 0.02 | 0.7 | 1.6 | 0.87 | 0.19 | 13.2 | 5.8 | - |
| 1Pt-TiO2 | - | 0.13 | 1.5 | 11.5 | - | 0.40 | - | 40.0 | - |
| 1Pt,N-TiO2 | 0.26 | 0.16 | 12.3 | 3.7 | 1.37 | 0.35 | 6.8 | 26.1 | 2.0 |
| 1Pt-TiO2UV | - | 0.30 | 16.7 | 13.4 | - | 0.45 | - | 37.5 | 7.3 |
| 1Pt,N-TiO2UV | 0.64 | 0.11 | 4.4 | 6.6 | 0.90 | 0.20 | 3.0 | 11.0 | 6.0 |
© 2020 by the authors. Licensee MDPI, Basel, Switzerland. This article is an open access article distributed under the terms and conditions of the Creative Commons Attribution (CC BY) license (http://creativecommons.org/licenses/by/4.0/).
Share and Cite
Ihnatiuk, D.; Tossi, C.; Tittonen, I.; Linnik, O. Effect of Synthesis Conditions of Nitrogen and Platinum Co-Doped Titania Films on the Photocatalytic Performance under Simulated Solar Light. Catalysts 2020, 10, 1074. https://0-doi-org.brum.beds.ac.uk/10.3390/catal10091074
Ihnatiuk D, Tossi C, Tittonen I, Linnik O. Effect of Synthesis Conditions of Nitrogen and Platinum Co-Doped Titania Films on the Photocatalytic Performance under Simulated Solar Light. Catalysts. 2020; 10(9):1074. https://0-doi-org.brum.beds.ac.uk/10.3390/catal10091074
Chicago/Turabian StyleIhnatiuk, Daryna, Camilla Tossi, Ilkka Tittonen, and Oksana Linnik. 2020. "Effect of Synthesis Conditions of Nitrogen and Platinum Co-Doped Titania Films on the Photocatalytic Performance under Simulated Solar Light" Catalysts 10, no. 9: 1074. https://0-doi-org.brum.beds.ac.uk/10.3390/catal10091074