Molybdenum and Nickel Nanoparticles Synthesis by Laser Ablation towards the Preparation of a Hydrodesulfurization Catalyst

 , ,
, ,
Abstract
: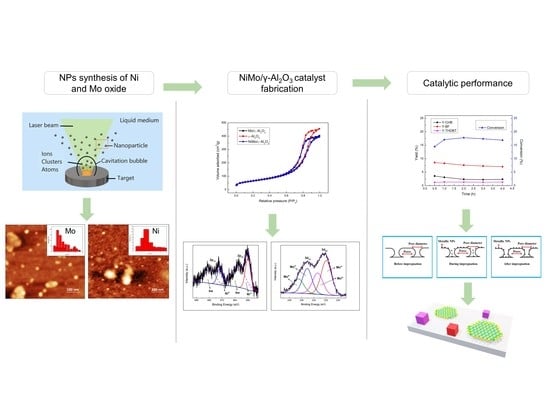
1. Introduction
2. Results
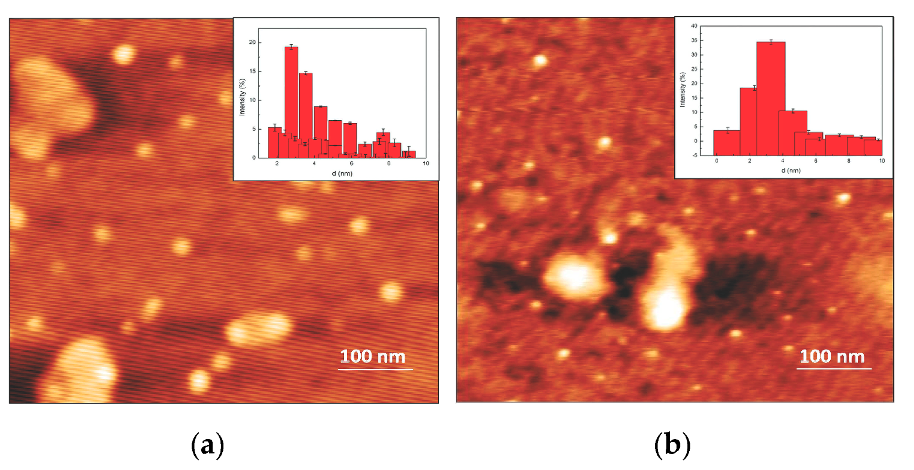
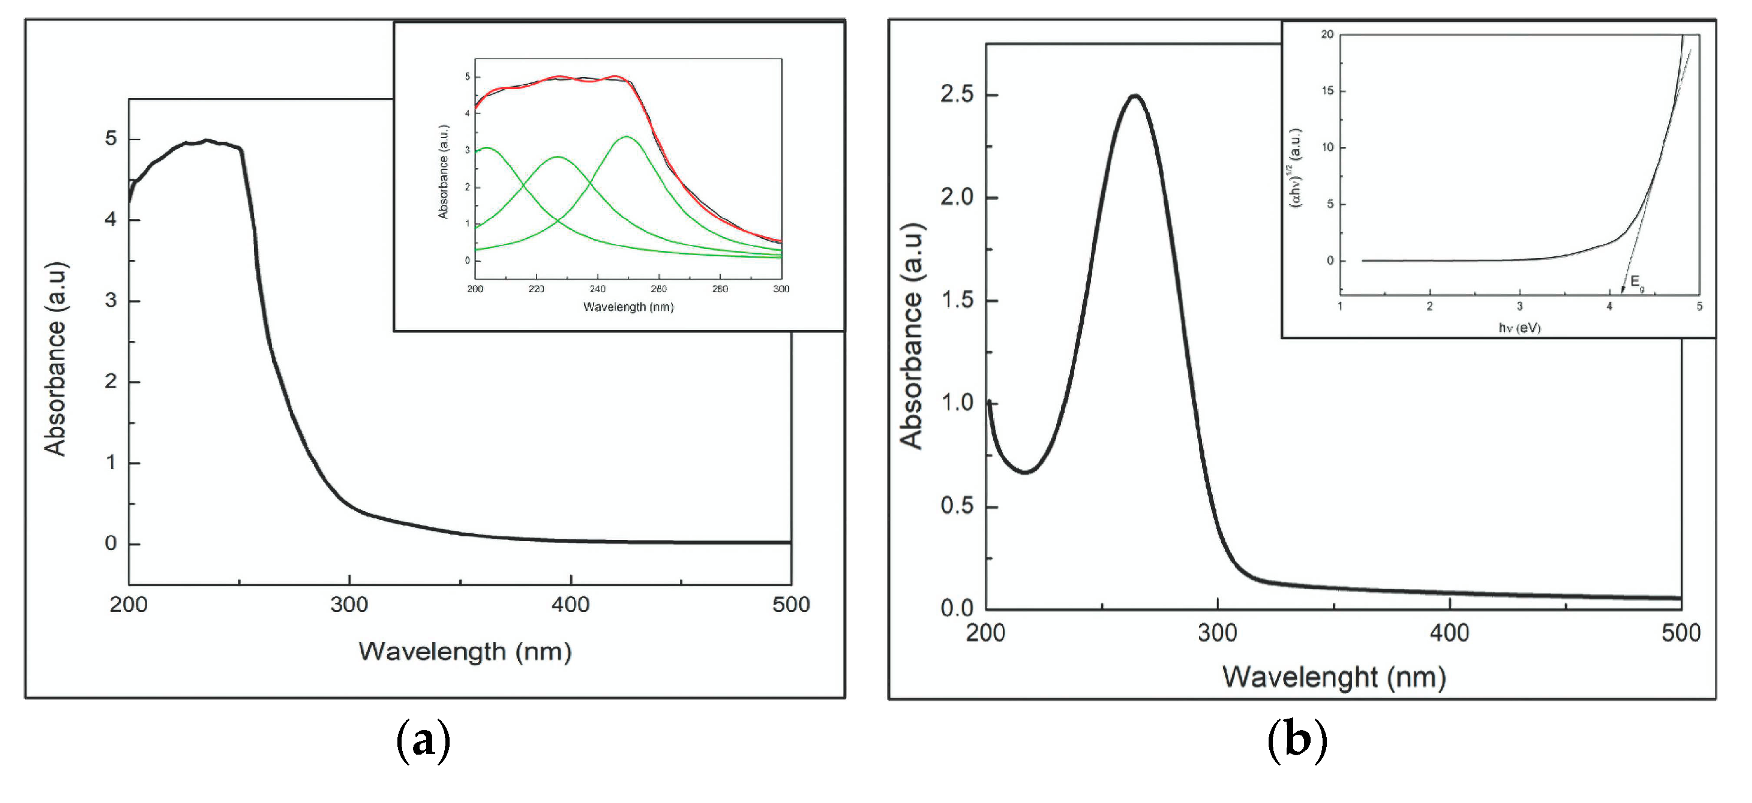
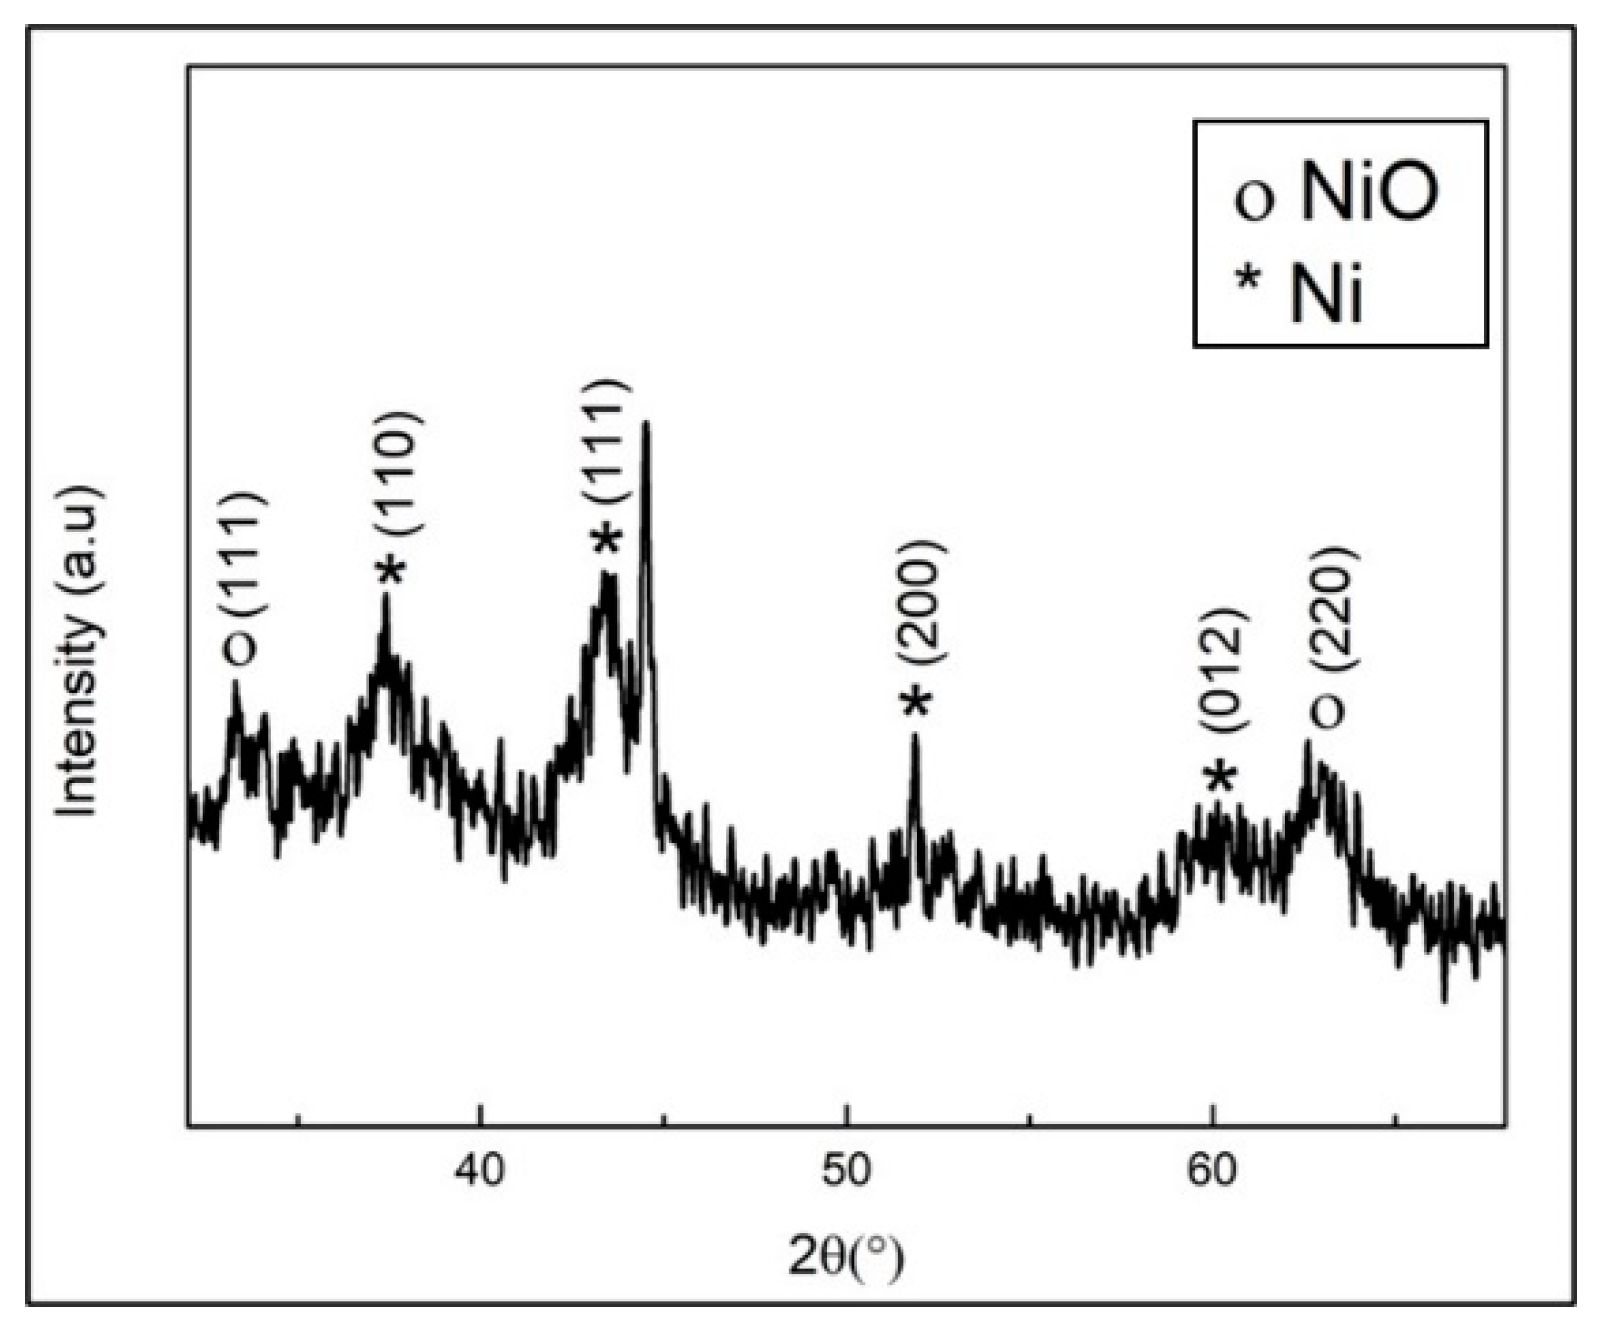
2.1. Nanoparticles
2.2. NiMo/γ-Al2O3 Catalyst
3. Discussion
4. Materials and Methods
4.1. Nanoparticles
4.2. NiMo/γ-Al2O3 Catalyst
4.3. Catalytic Tests
5. Conclusions
Author Contributions
Funding
Conflicts of Interest
References
- Sekoai, P.T.; Ouma, C.N.M.; Du Preez, S.P.; Modisha, P.; Engelbrecht, N.; Bessarabov, D.; Ghimire, A. Application of nanoparticles in biofuels: An overview. Fuel 2019, 237, 380–397. [Google Scholar] [CrossRef]
- Hu, S.; Luo, G.; Shima, T.; Luo, Y.; Hou, Z. Hydrodenitrogenation of pyridines and quinolines at a multinuclear titanium hydride framework. Nat. Commun. 2017, 8, 1866. [Google Scholar] [CrossRef] [Green Version]
- Shi, Y.; Ye, G.; Yang, C.; Tang, Y.; Peng, C.; Qian, G.; Yuan, W.; Duan, X.; Zhou, X. Pore engineering of hierarchically structured hydrodemetallization catalyst pellets in a fixed bed reactor. Chem. Eng. Sci. 2019, 202, 336–346. [Google Scholar] [CrossRef]
- Li, X.; Luo, X.; Jin, Y.; Li, J.; Zhang, H.; Zhang, A.; Xie, J. Heterogeneous sulfur-free hydrodeoxygenation catalysts for selectively upgrading the renewable bio-oils to second generation biofuels. Renew. Sustain. Energy Rev. 2018, 82, 3762–3797. [Google Scholar] [CrossRef]
- Li, C.; Zhao, X.; Wang, A.; Huber, G.W.; Zhang, T. Catalytic Transformation of Lignin for the Production of Chemicals and Fuels. Chem. Rev. 2015, 115, 11559–11624. [Google Scholar] [CrossRef]
- Mora, D.A.P.; Labrador, H. Efecto de la inserción del Benzoato de cobalto en los asfaltenos. Rev. Fac. Cienc. 2020, 9, 55–71. [Google Scholar] [CrossRef]
- Duan, C.; Kee, R.J.; Zhu, H.; Karakaya, C.; Chen, Y.; Ricote, S.; Jarry, A.; Crumlin, E.J.; Hook, D.; Braun, R.; et al. Highly durable, coking and sulfur tolerant, fuel-flexible protonic ceramic fuel cells. Nature 2018, 557, 217–222. [Google Scholar] [CrossRef]
- Tanimu, A.; Alhooshani, K. Advanced Hydrodesulfurization Catalysts: A Review of Design and Synthesis. Energy Fuels 2019, 33, 2810–2838. [Google Scholar] [CrossRef]
- Liu, J.; Li, W.-Y.; Feng, J.; Gao, X.; Luo, Z.-Y. Promotional effect of TiO2 on quinoline hydrodenitrogenation activity over Pt/γ-Al2O3 catalysts. Chem. Eng. Sci. 2019, 207, 1085–1095. [Google Scholar] [CrossRef]
- Aldosari, O. Selective conversion of furfuryl alcohol to 2-methylfuran over nanosilica supported Au:Pd bimetallic catalysts at room temperature. J. Saudi Chem. Soc. 2019, 23, 938–946. [Google Scholar] [CrossRef]
- Liu, X.; Jiang, S.; Lai, W.; Yi, X.; Yang, L.; Fang, W. Quantitative relationship model between support properties and dibenzothiophene hydrodesulfurization conversion over NiMo/Al2O3. React. Kinet. Mech. Catal. 2017, 121, 673–687. [Google Scholar] [CrossRef]
- Bathla, A.; Pal, B. Catalytic Selective Hydrogenation and Cross Coupling Reaction Using Polyvinylpyrrolidone-Capped Nickel Nanoparticles. ChemistrySelect 2018, 3, 4738–4744. [Google Scholar] [CrossRef]
- Pattanaik, B.P.; Misra, R.D. Effect of reaction pathway and operating parameters on the deoxygenation of vegetable oils to produce diesel range hydrocarbon fuels: A review. Renew. Sustain. Energy Rev. 2017, 73, 545–557. [Google Scholar] [CrossRef]
- Zaera, F. Nanostructured materials for applications in heterogeneous catalysis. Chem. Soc. Rev. 2013, 42, 2746–2762. [Google Scholar] [CrossRef]
- Sorribes, I.; Liu, L.; Corma, A. Nanolayered Co–Mo–S Catalysts for the Chemoselective Hydrogenation of Nitroarenes. ACS Catal. 2017, 7, 2698–2708. [Google Scholar] [CrossRef]
- Liu, H.; Yin, C.; Li, X.; Chai, Y.; Li, Y.; Liu, C. Effect of NiMo phases on the hydrodesulfurization activities of dibenzothiophene. Catal. Today 2017, 282, 222–229. [Google Scholar] [CrossRef]
- Scott, C.E.; Pérez-Zurita, M.J.; Carbognani, L.A.; Molero, H.; Vitale, G.; Guzmán, H.J.; Pereira-Almao, P. Preparation of NiMoS nanoparticles for hydrotreating. Catal. Today 2015, 250, 21–27. [Google Scholar] [CrossRef]
- Parveen, K.; Banse, V.; Ledwani, L. Green synthesis of nanoparticles: Their advantages and disadvantages. AIP Conf. Proc. 2016, 1724. [Google Scholar] [CrossRef]
- Zhang, D.; Gökce, B.; Barcikowski, S. Laser Synthesis and Processing of Colloids: Fundamentals and Applications. Chem. Rev. 2017, 117, 3990–4103. [Google Scholar] [CrossRef]
- Ozeki, T.; Kihara, H.; Ikeda, S. Study of equilibria in 0.03 mM molybdate acidic aqueous solutions by factor analysis applied to ultraviolet spectra. Anal. Chem. 1988, 60, 2055–2059. [Google Scholar] [CrossRef]
- Burzlaff, A.; Beevers, C.; Pearce, H.; Lloyd, M.; Klipsch, K. New studies on the in vitro genotoxicity of sodium molybdate and their impact on the overall assessment of the genotoxicity of molybdenum substances. Regul. Toxicol. Pharmacol. 2017, 86, 279–291. [Google Scholar] [CrossRef]
- Siddique, M.N.; Ahmed, A.; Ali, T.; Tripathi, P. Investigation of optical properties of nickel oxide nanostructures using photoluminescence and diffuse reflectance spectroscopy. AIP Conf. Proc. 2018, 1953. [Google Scholar] [CrossRef]
- Rashad, M.; Amin, R.; Hafiz, M.M. Redshift in the optical band gap of amorphous nanostructure Se80Te20-xSnx films. Chalcogenide Lett. 2015, 12, 441–451. [Google Scholar]
- Ji, J.; Zhang, L.L.; Ji, H.; Li, Y.; Zhao, X.; Bai, X.; Fan, X.; Zhang, F.; Ruoff, R.S. Nanoporous Ni(OH)2 Thin Film on 3D Ultrathin-Graphite Foam for Asymmetric Supercapacitor. ACS Nano 2013, 7, 6237–6243. [Google Scholar] [CrossRef]
- Khashan, K.S.; Sulaiman, G.M.; Abdulameer, F.A. Synthesis and Antibacterial Activity of CuO Nanoparticles Suspension Induced by Laser Ablation in Liquid. Arab. J. Sci. Eng. 2015, 41, 301–310. [Google Scholar] [CrossRef]
- Bob, K.B. AM MINERAL. 1993, 78, pp. 1104–1107. Available online: http://rruff.geo.arizona.edu/AMS/xtal_data/DIFfiles/13348.txt (accessed on 5 July 2020).
- Powder Diffraction File. Joint Committee on Powder Diffraction Standards; ASTM: Philadelphia, PA, USA, 1996; pp. 47–1049. [Google Scholar]
- Srivastava, N.; Srivastava, P.C. Realizing NiO nanocrystals from a simple chemical method Realizing NiO nanocrystals from a simple chemical method. Bull. Mater. Sci. 2014, 33, 653–656. [Google Scholar] [CrossRef] [Green Version]
- Patterson, A.L. The Scherrer Formula for X-Ray Particle Size Determination. Phys. Rev. 1939, 56, 978–982. [Google Scholar] [CrossRef]
- Oyerinde, O.F.; Weeks, C.L.; Anbar, A.D.; Spiro, T.G. Solution structure of molybdic acid from Raman spectroscopy and DFT analysis. Inorganica Chim. Acta 2008, 361, 1000–1007. [Google Scholar] [CrossRef]
- Thommes, M.; Kaneko, K.; Neimark, A.V.; Olivier, J.P.; Rodríguez-Reinoso, F.; Rouquerol, J.; Sing, K.S. Physisorption of gases, with special reference to the evaluation of surface area and pore size distribution (IUPAC Technical Report). Pure Appl. Chem. 2015, 87, 1051–1069. [Google Scholar] [CrossRef] [Green Version]
- Downs, R.T. AM MINERAL78. 1993. Available online: http://rruff.geo.arizona.edu/AMS/xtal_data/DIFfiles/20292.txt (accessed on 9 July 2020).
- Abdelaziz, O.Y.; Meier, S.; Prothmann, J.; Turner, C.; Riisager, A.; Hulteberg, C. Oxidative Depolymerisation of Lignosulphonate Lignin into Low-Molecular-Weight Products with Cu–Mn/δ-Al2O3. Top. Catal. 2019, 62, 639–648. [Google Scholar] [CrossRef] [Green Version]
- Moulder, J.F. Handbook of X-ray Photoelectron Spectroscopy; Physical Electronics Inc.: Eden Prairie, MN, USA, 1995; pp. 230–232. [Google Scholar]
- Li, D.; Sato, T.; Imamura, M.; Shimada, H.; Nishijima, A. Spectroscopic Characterization of Ni-Mo/γ-Al2O3-B2O3 Catalysts for Hydrodesulfurization of Dibenzothiophene. J. Catal. 1997, 170, 357–365. [Google Scholar] [CrossRef]
- Kim, B.-Y.; Ahn, J.-H.; Yoon, J.-W.; Lee, C.-S.; Kang, Y.C.; Abdel-Hady, F.; Wazzan, A.A.; Lee, J.-H. Highly Selective Xylene Sensor Based on NiO/NiMoO4 Nanocomposite Hierarchical Spheres for Indoor Air Monitoring. ACS Appl. Mater. Interfaces 2016, 8, 34603–34611. [Google Scholar] [CrossRef] [PubMed]
- Leamon, D. Catalyst Production Method and System. Google Patents AU2010332042B2, 6 October 2015. [Google Scholar]
- Topsøie, H.; Candia, R.; Topsøe, N.; Clausen, B.S.; Topsøe, H. On the State of the Co-MO-S Model. Bull. Sociétés Chim. Belg. 1984, 93, 783–806. [Google Scholar] [CrossRef]
- Green, I.X.; Tang, W.; Neurock, M.; Yates, J.T. Spectroscopic Observation of Dual Catalytic Sites During Oxidation of CO on a Au/TiO2 Catalyst. Sci. Mag. 2011, 333, 736–739. [Google Scholar] [CrossRef] [PubMed]
- Rouquerol, J.; Llewellyn, P.; Rouquérol, F. Is the bet equation applicable to microporous adsorbents? DNA Topoisomerases Biochem. Mol. Biol. 2007, 160, 49–56. [Google Scholar] [CrossRef]
- Barrett, E.P.; Joyner, L.G.; Halenda, P.P. The Determination of Pore Volume and Area Distributions in Porous Substances. I. Computations from Nitrogen Isotherms. J. Am. Chem. Soc. 1951, 73, 373–380. [Google Scholar] [CrossRef]
- Rouxhet, P.G.; Genet, M.J. XPS analysis of bio-organic systems. Surf. Interface Anal. 2011, 43, 1453–1470. [Google Scholar] [CrossRef]


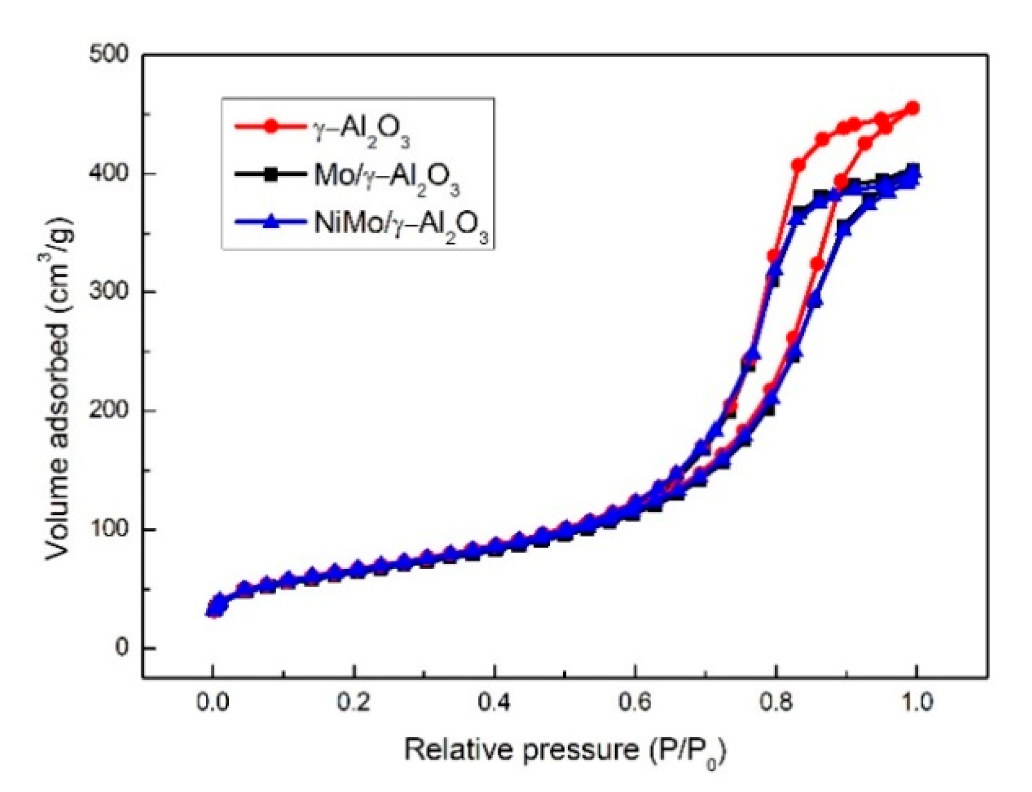
| SBET (m2/g) | VP (cm3/g) | DP (nm) | |
|---|---|---|---|
| γ-Al2O3 | 236.79 | 0.70 | 8.98 |
| Mo/γ-Al2O3 | 227.04 | 0.62 | 8.57 |
| NiMo/γ-Al2O3 | 235.55 | 0.61 | 8.51 |
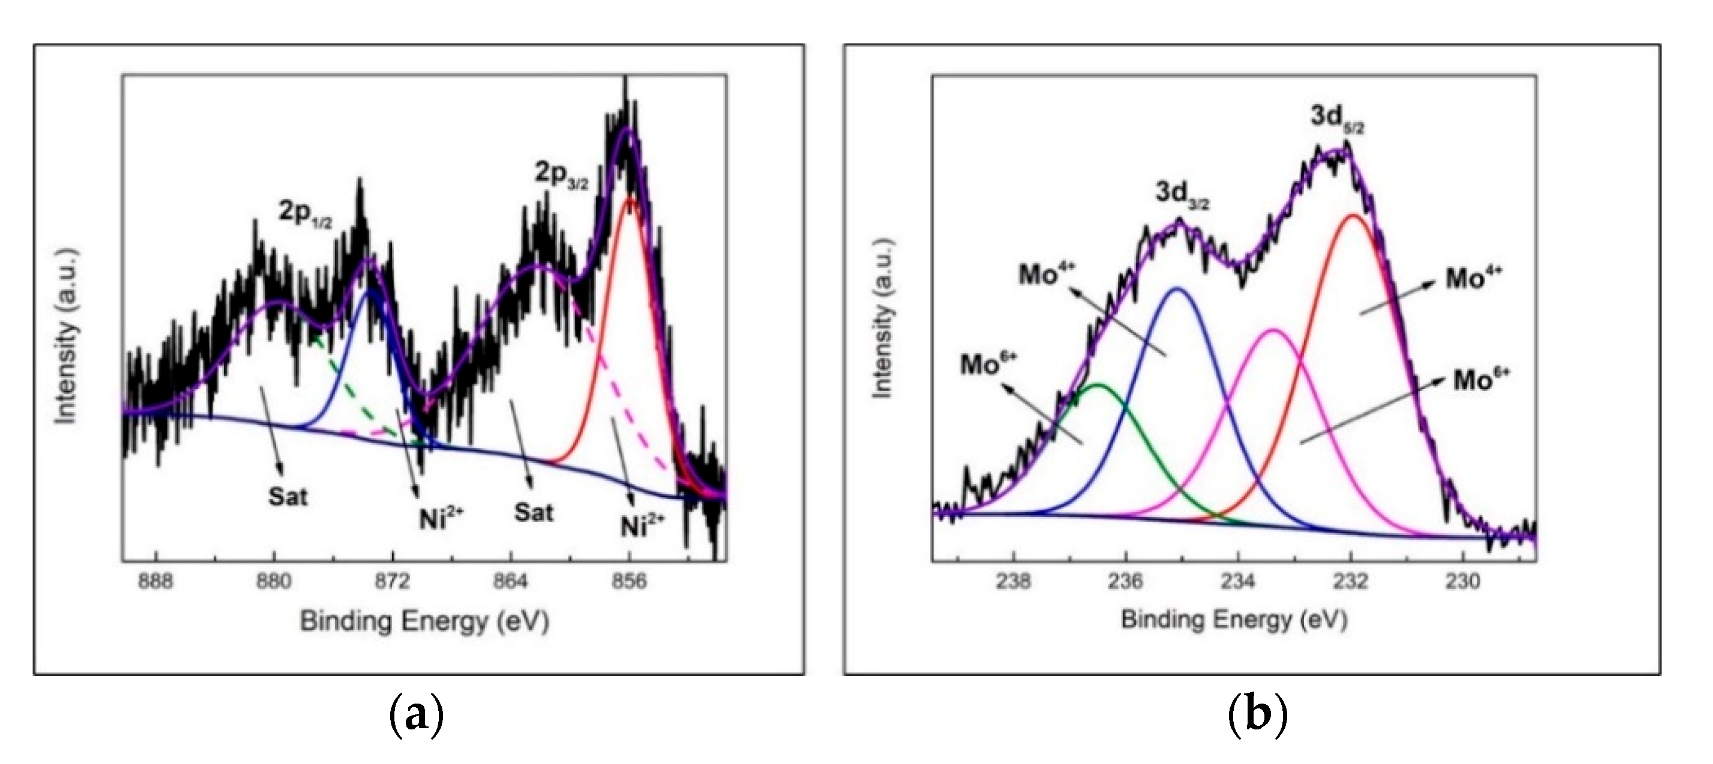
| Surface Composition | |||
|---|---|---|---|
| Ni/Mo | Ni/Al | Mo/Al | |
| NiMo/γ-Al2O3 | 1.34 | 0.11 | 0.08 |
© 2020 by the authors. Licensee MDPI, Basel, Switzerland. This article is an open access article distributed under the terms and conditions of the Creative Commons Attribution (CC BY) license (http://creativecommons.org/licenses/by/4.0/).
Share and Cite
Londoño-Calderón, V.; Ospina, R.; Rodriguez-Pereira, J.; Rincón-Ortiz, S.A.; Restrepo-Parra, E. Molybdenum and Nickel Nanoparticles Synthesis by Laser Ablation towards the Preparation of a Hydrodesulfurization Catalyst. Catalysts 2020, 10, 1076. https://0-doi-org.brum.beds.ac.uk/10.3390/catal10091076
Londoño-Calderón V, Ospina R, Rodriguez-Pereira J, Rincón-Ortiz SA, Restrepo-Parra E. Molybdenum and Nickel Nanoparticles Synthesis by Laser Ablation towards the Preparation of a Hydrodesulfurization Catalyst. Catalysts. 2020; 10(9):1076. https://0-doi-org.brum.beds.ac.uk/10.3390/catal10091076
Chicago/Turabian StyleLondoño-Calderón, Viviana, Rogelio Ospina, Jhonatan Rodriguez-Pereira, Sergio A. Rincón-Ortiz, and Elisabeth Restrepo-Parra. 2020. "Molybdenum and Nickel Nanoparticles Synthesis by Laser Ablation towards the Preparation of a Hydrodesulfurization Catalyst" Catalysts 10, no. 9: 1076. https://0-doi-org.brum.beds.ac.uk/10.3390/catal10091076