Copper-Containing Mixed Metal Oxides (Al, Fe, Mn) for Application in Three-Way Catalysis

 ,
,  , and
, and
Abstract
:
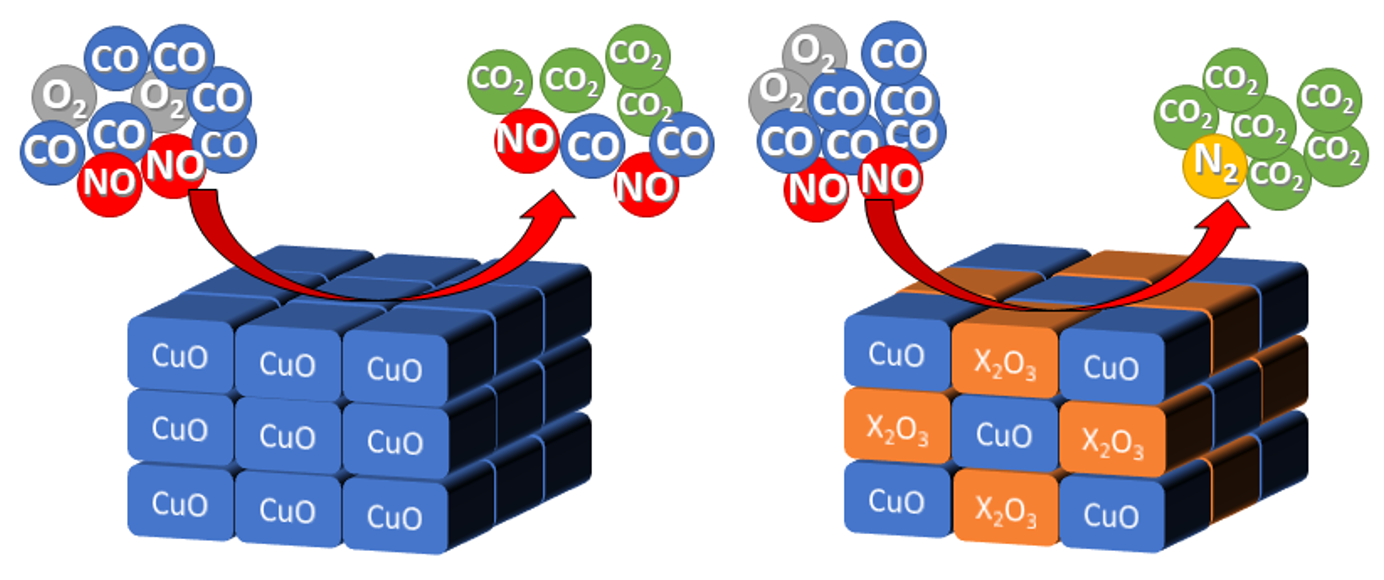
1. Introduction
2. Results
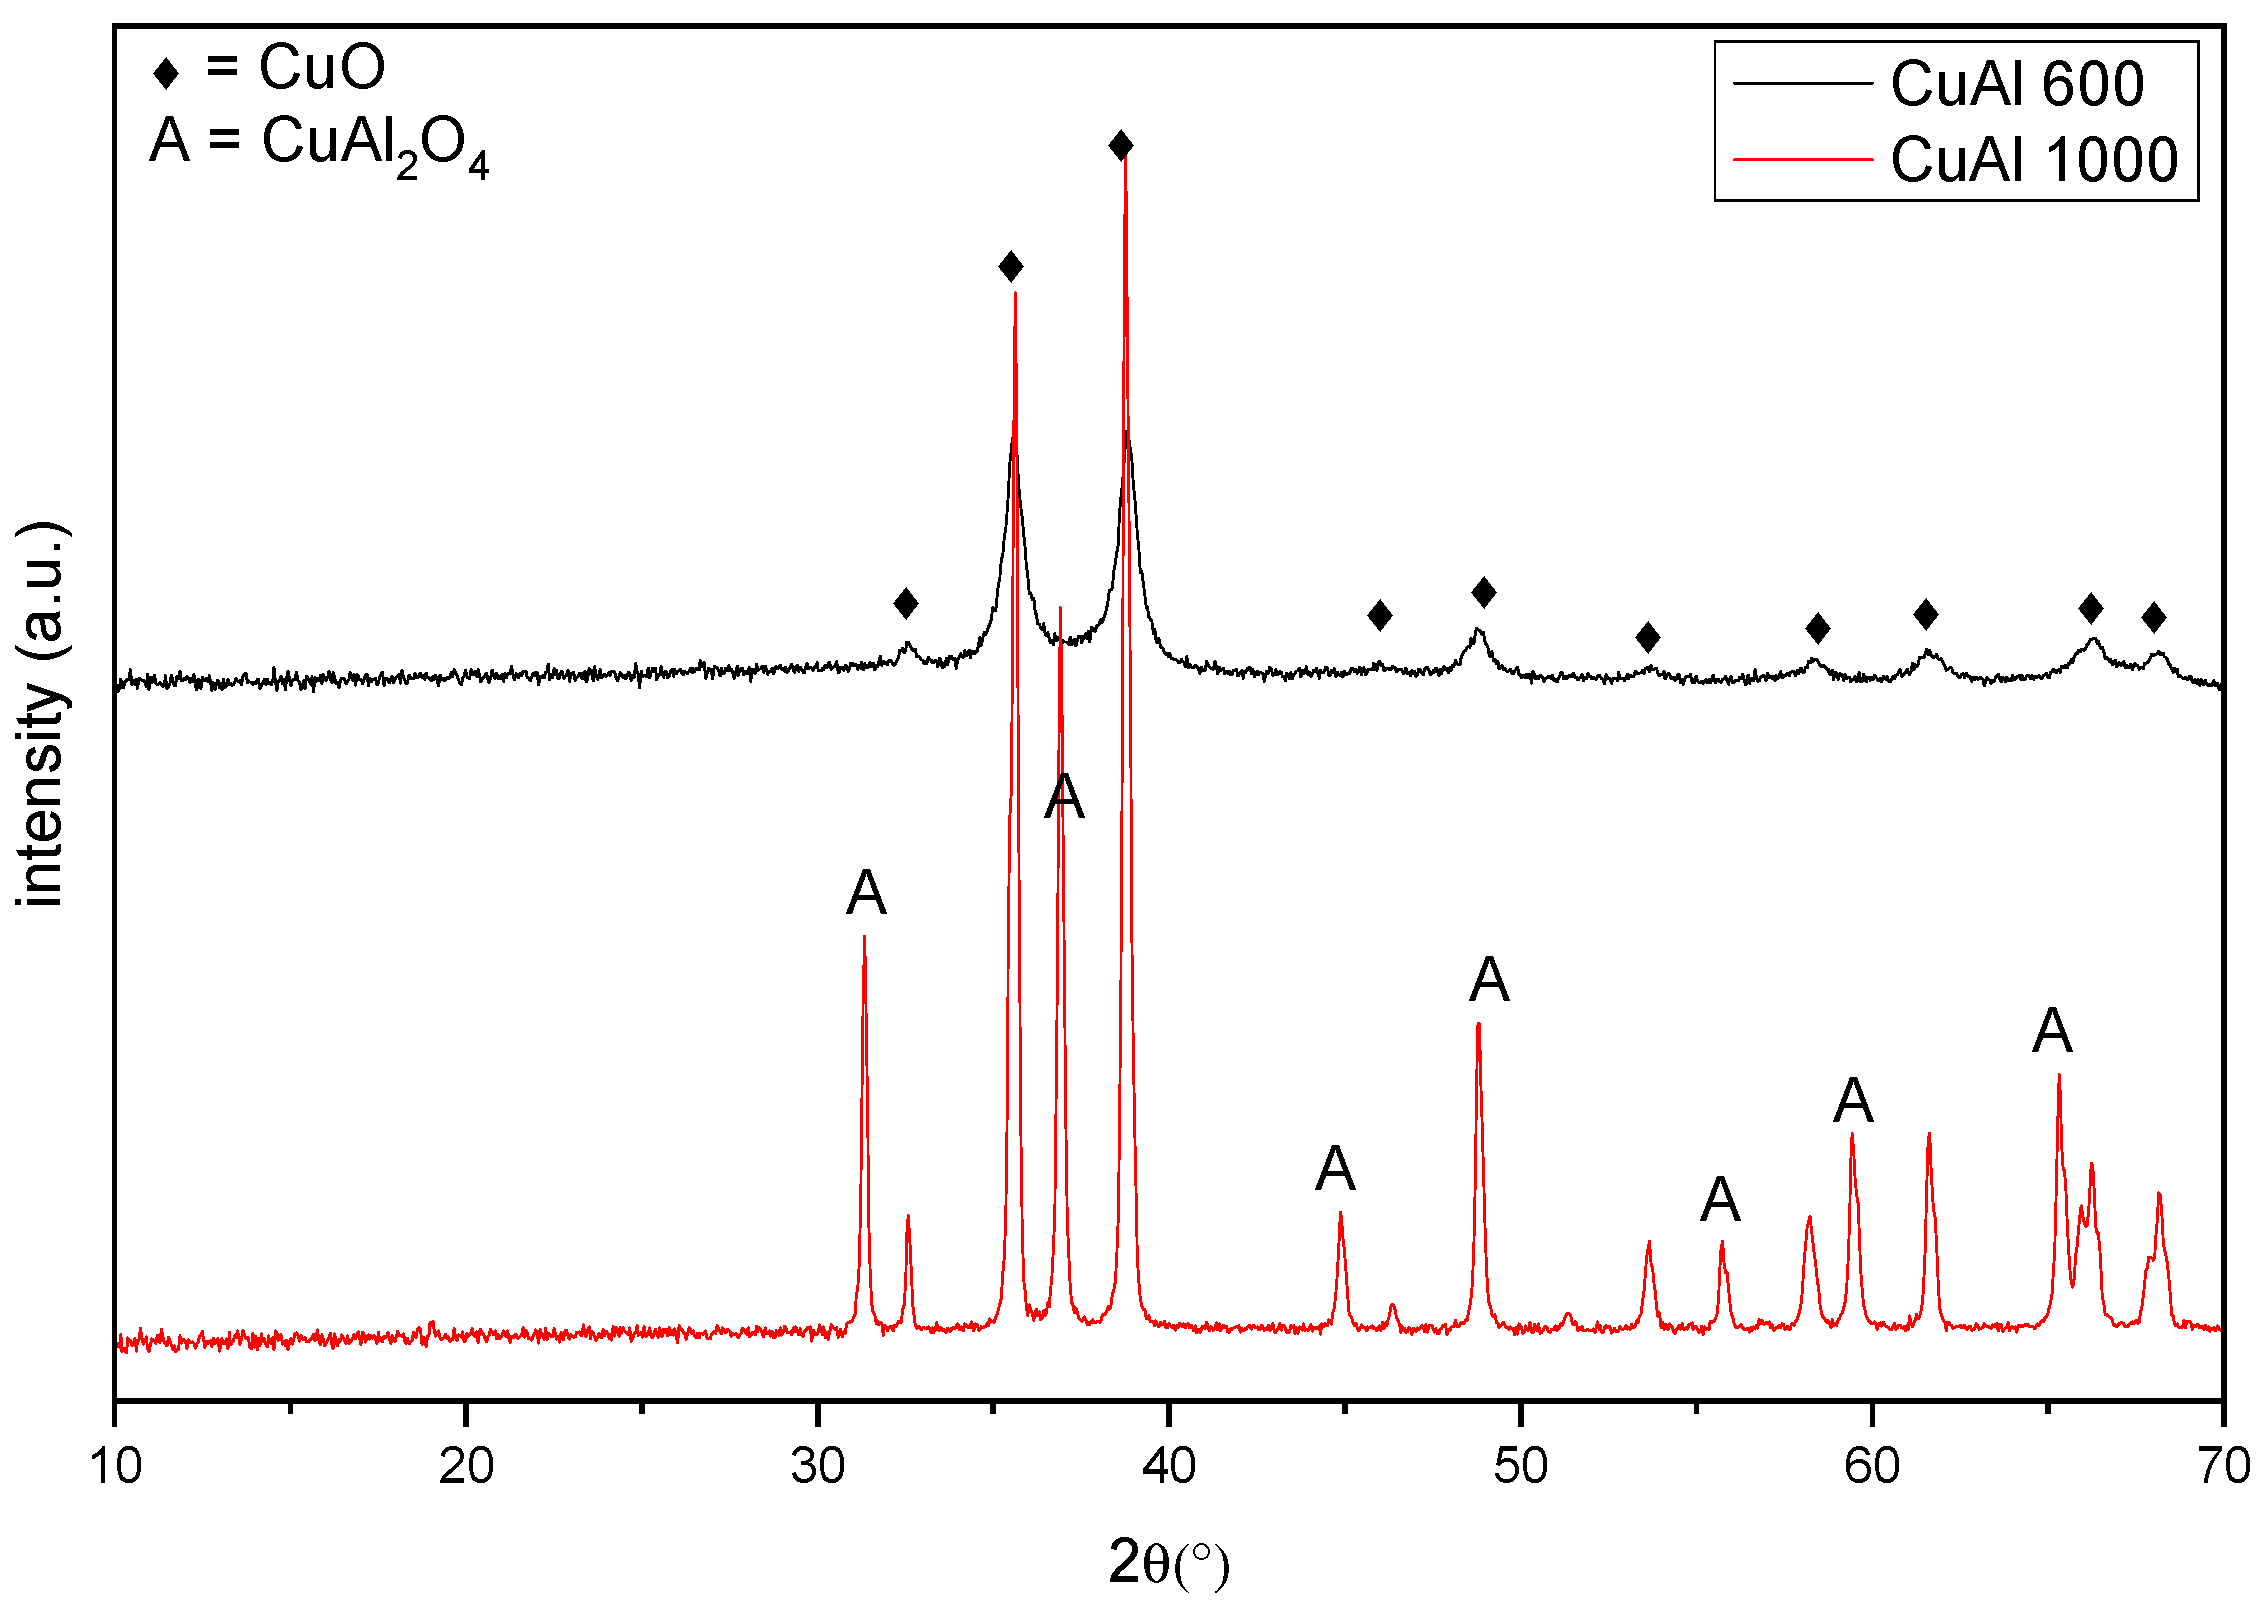
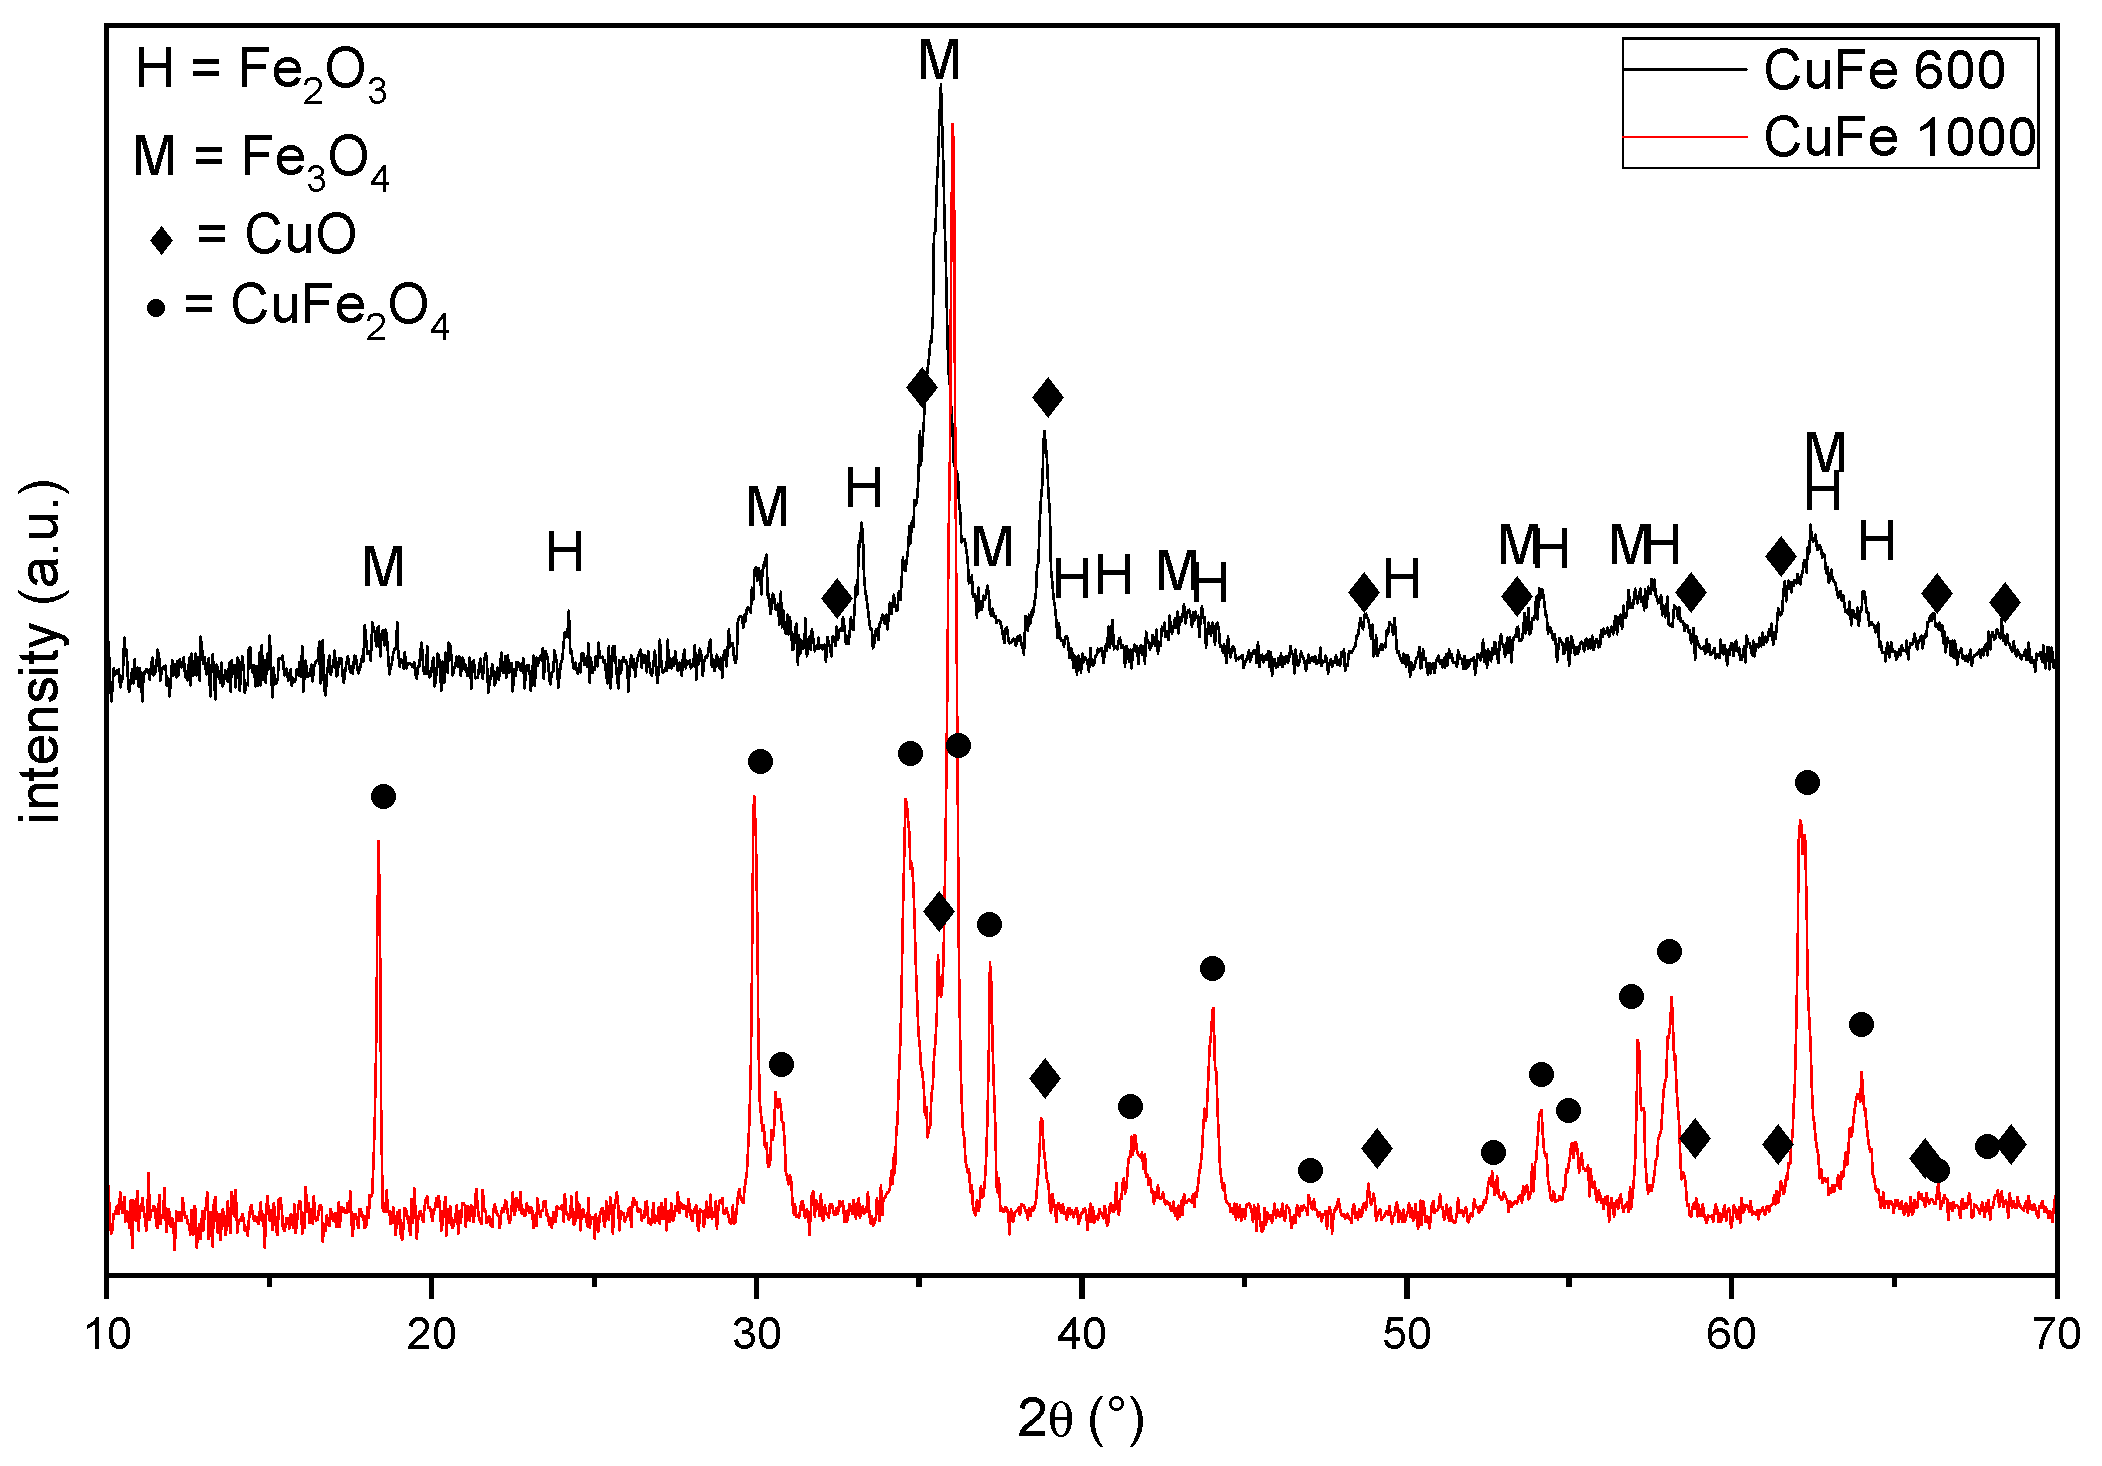
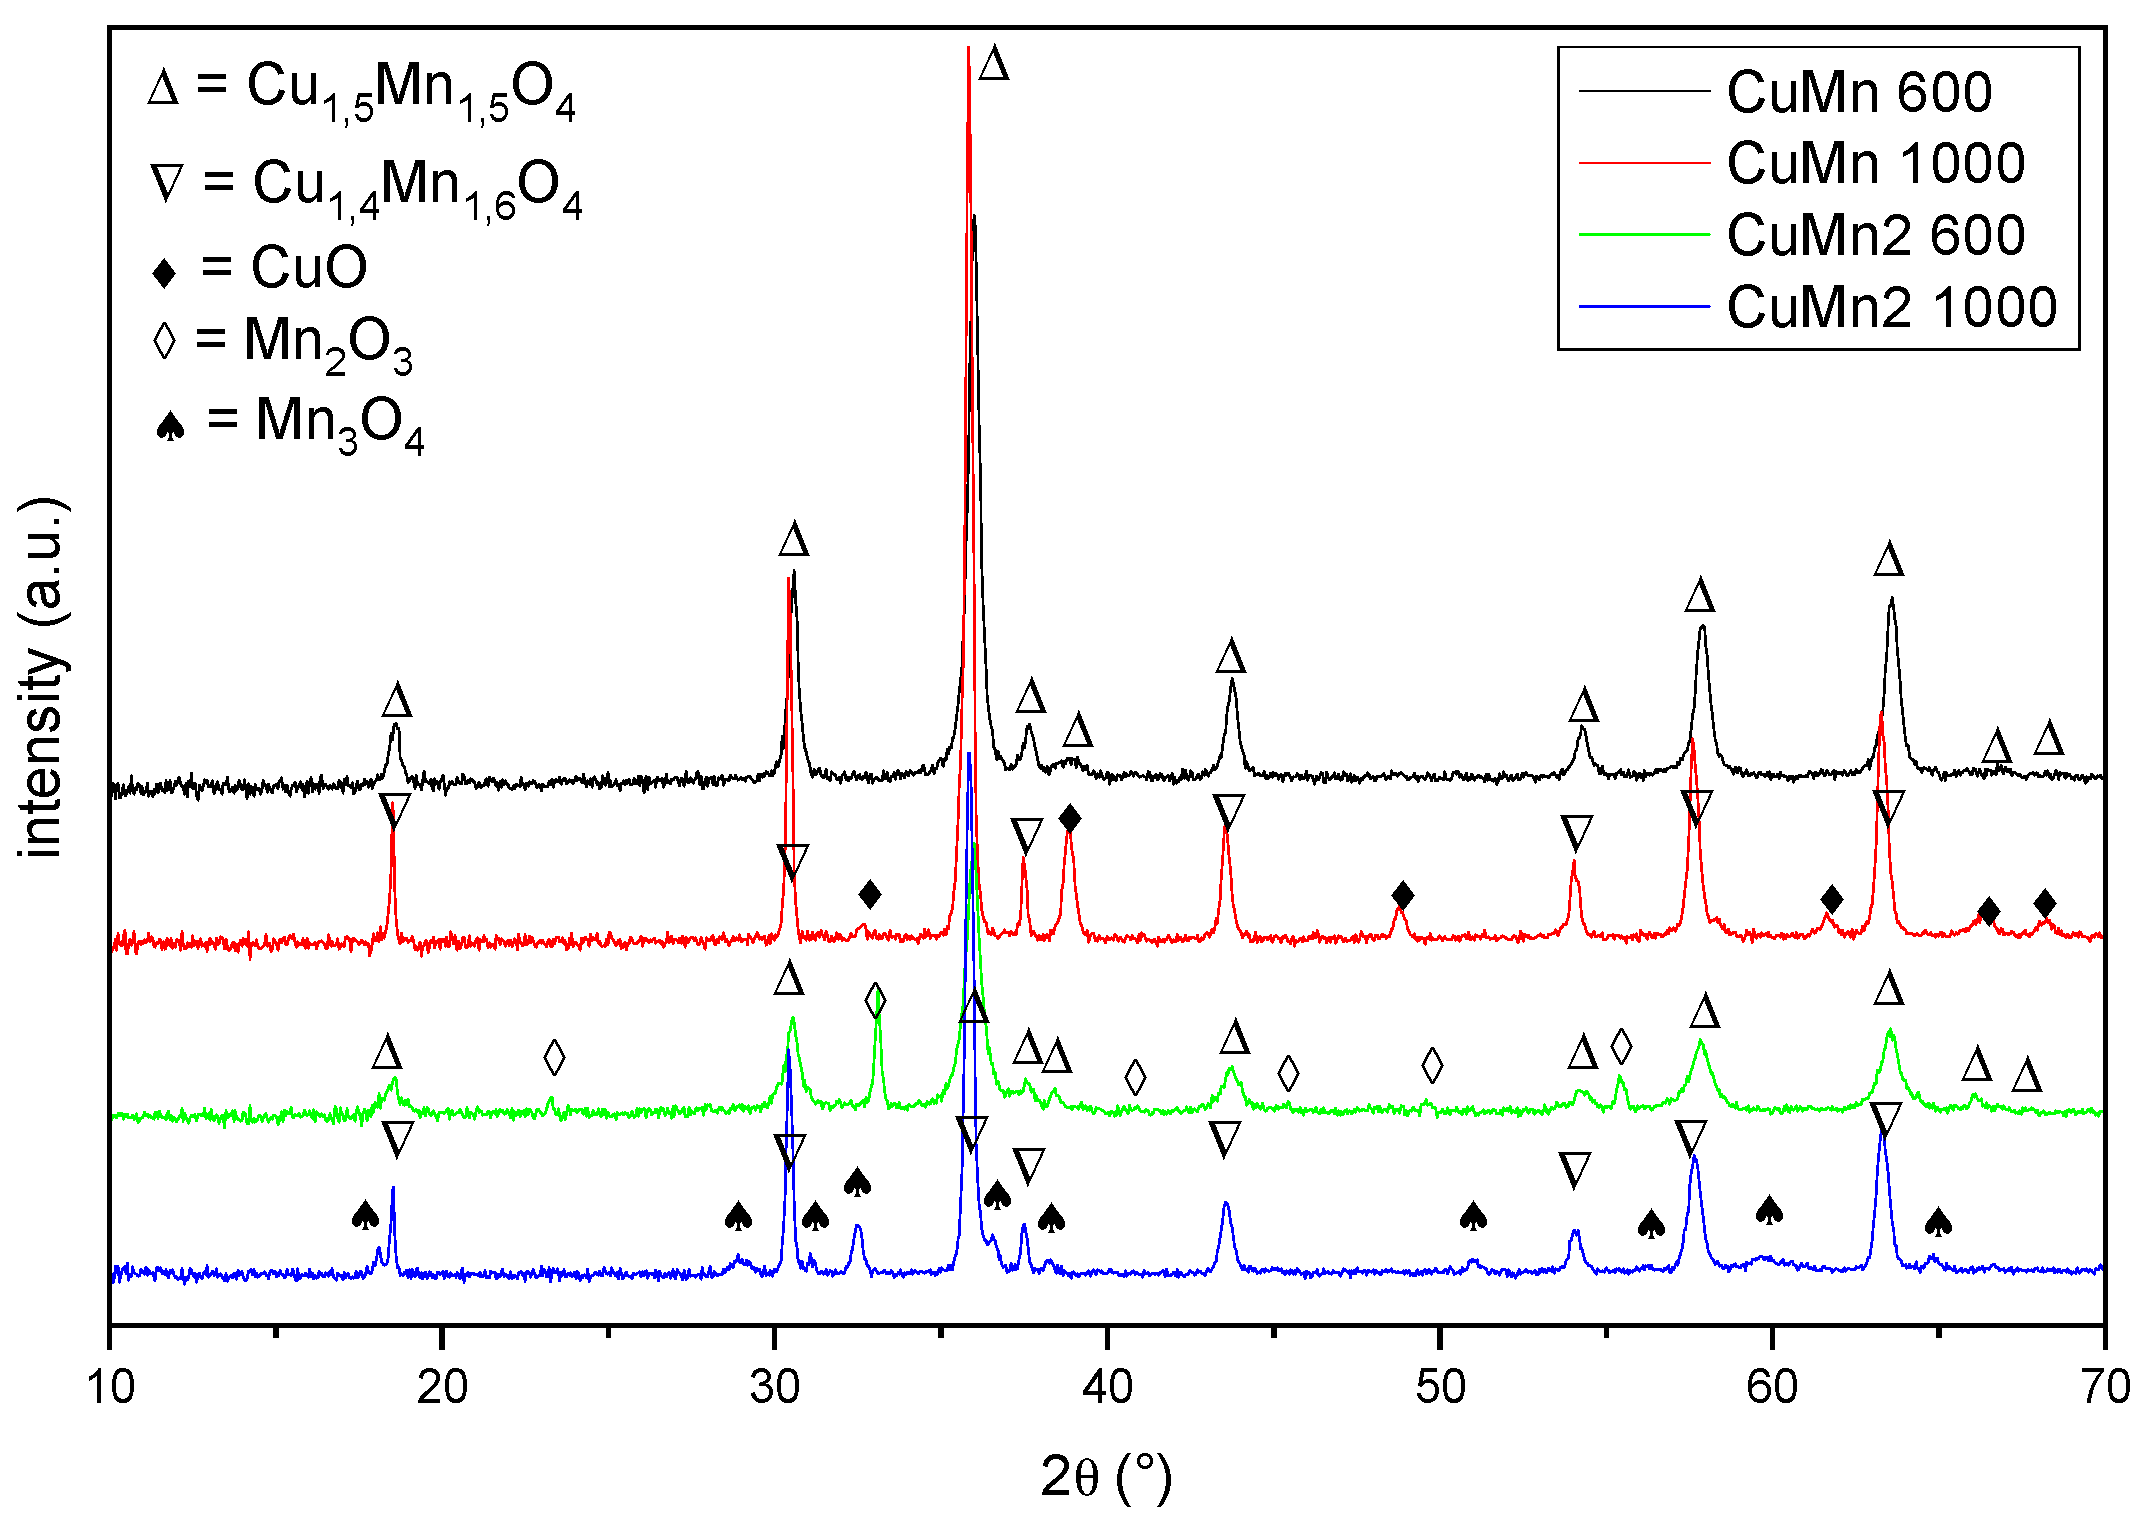
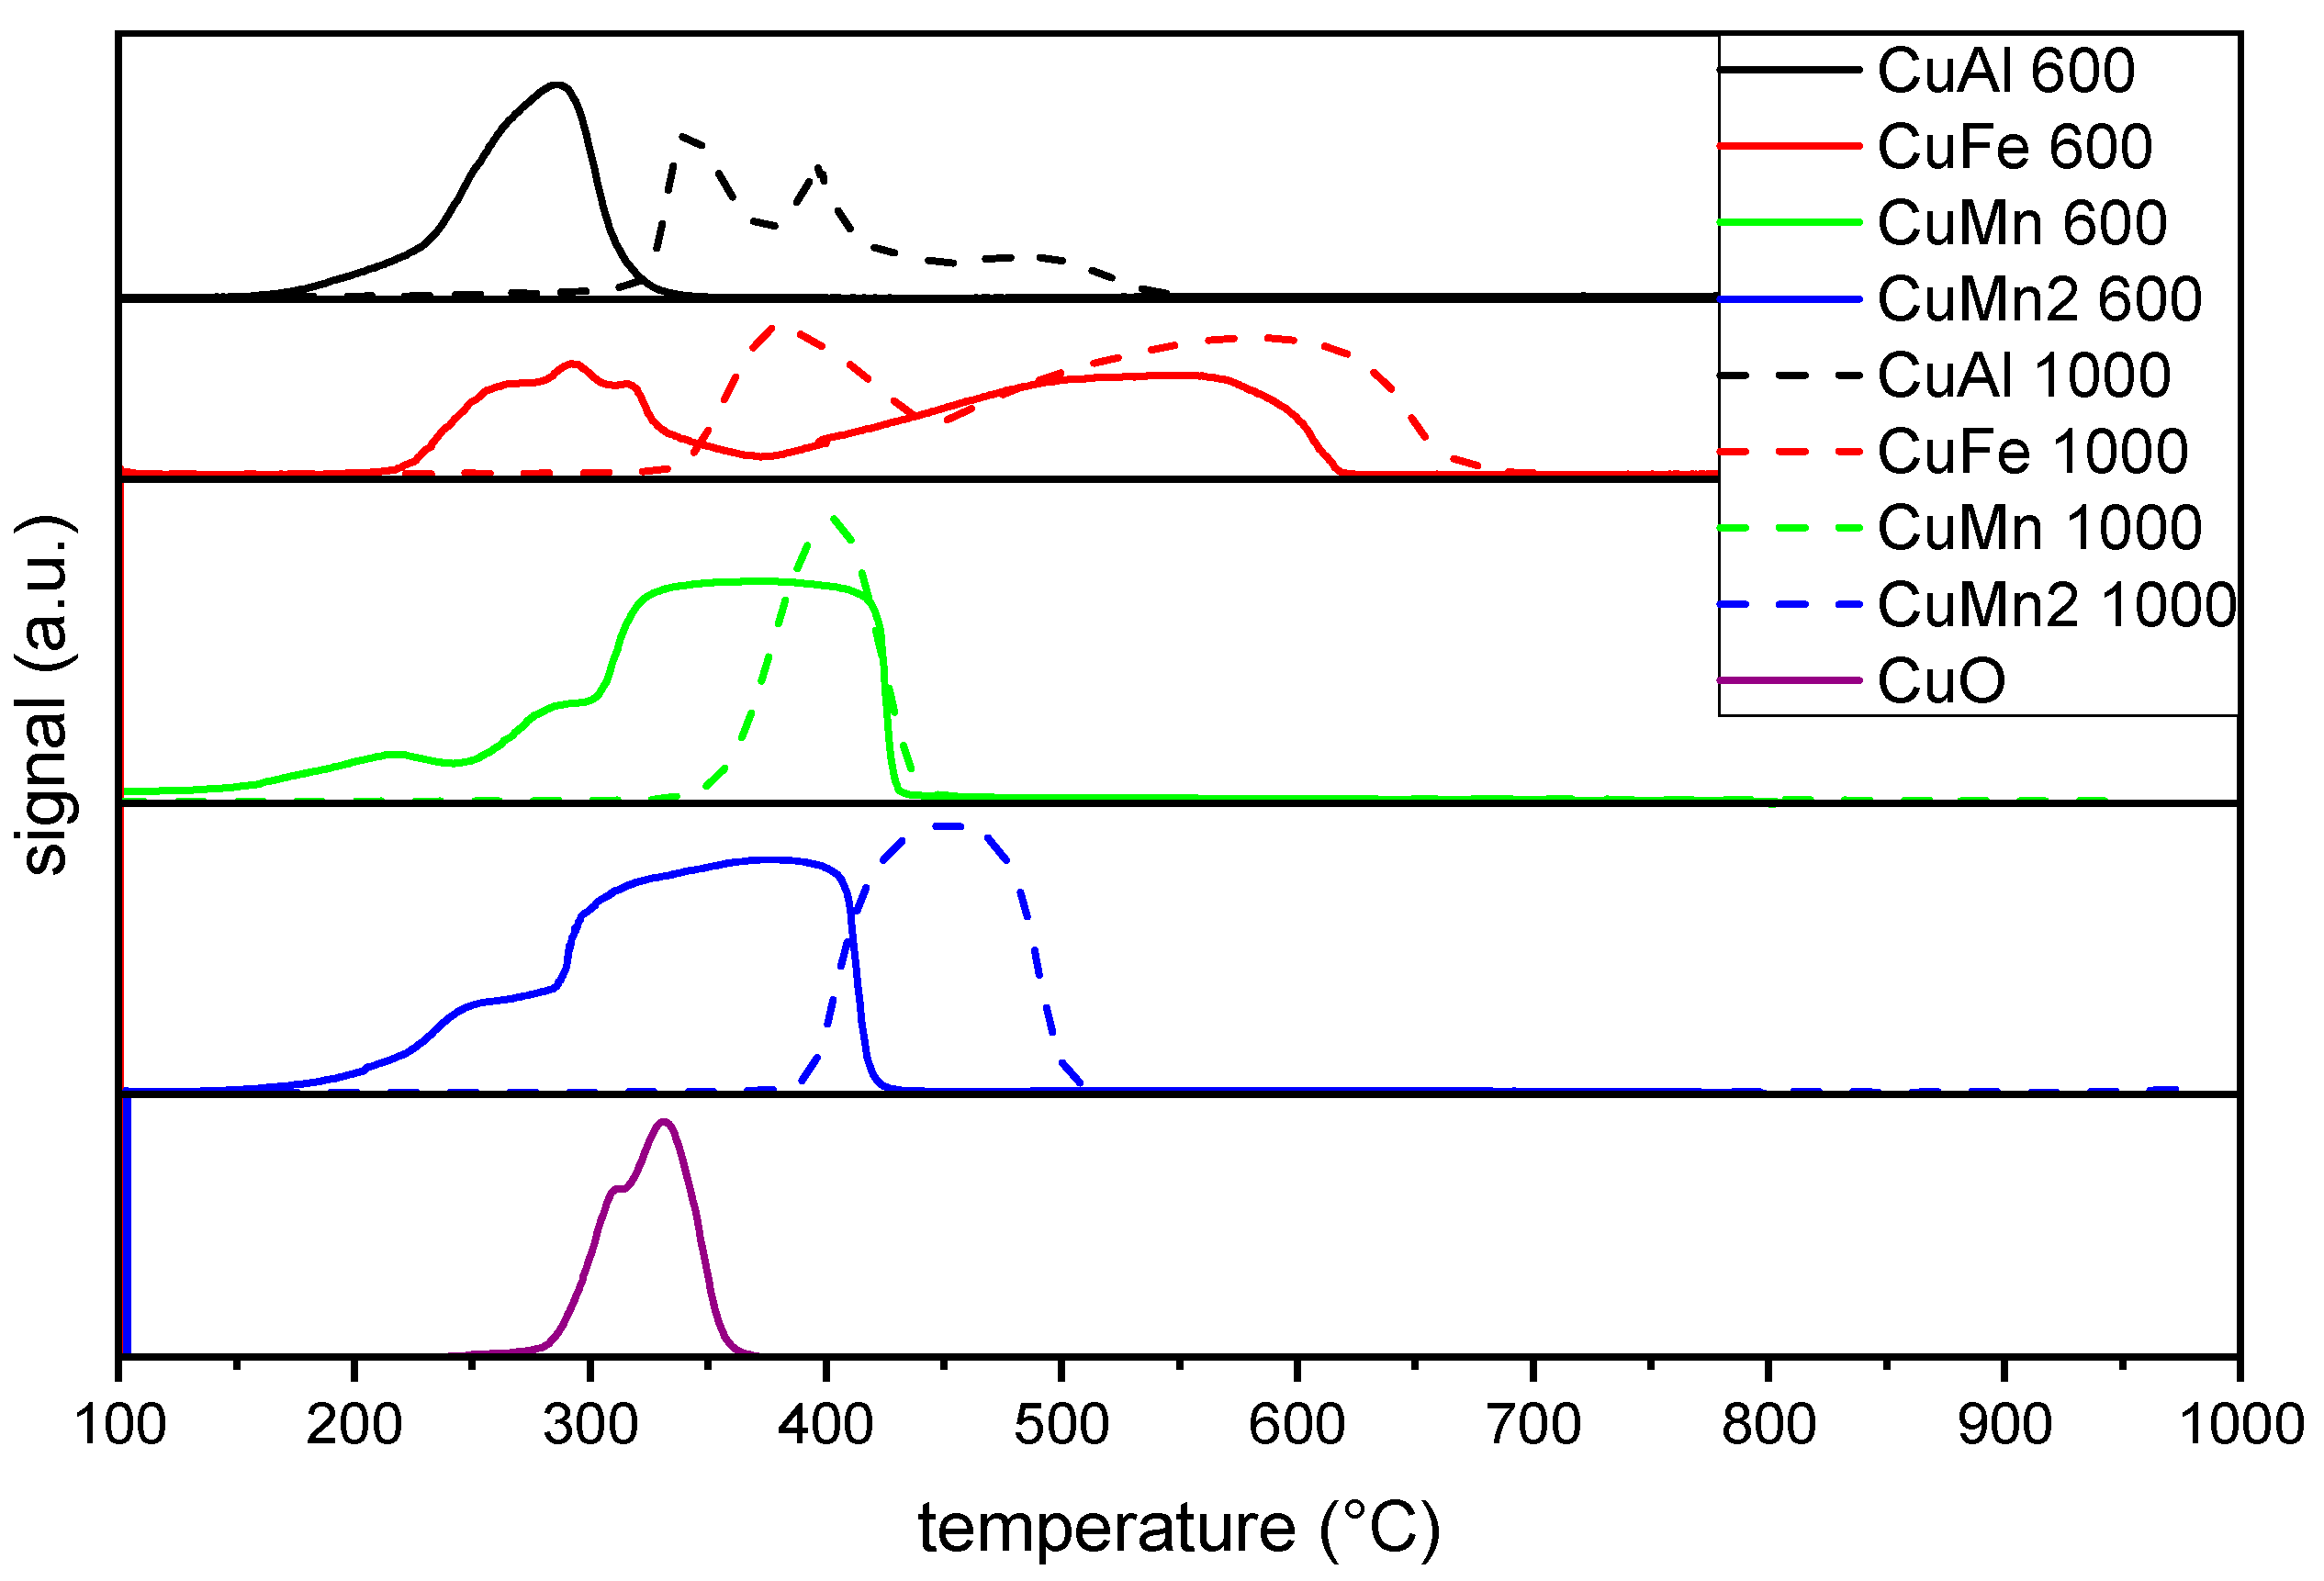
2.1. Physicochemical Properties of the Catalysts
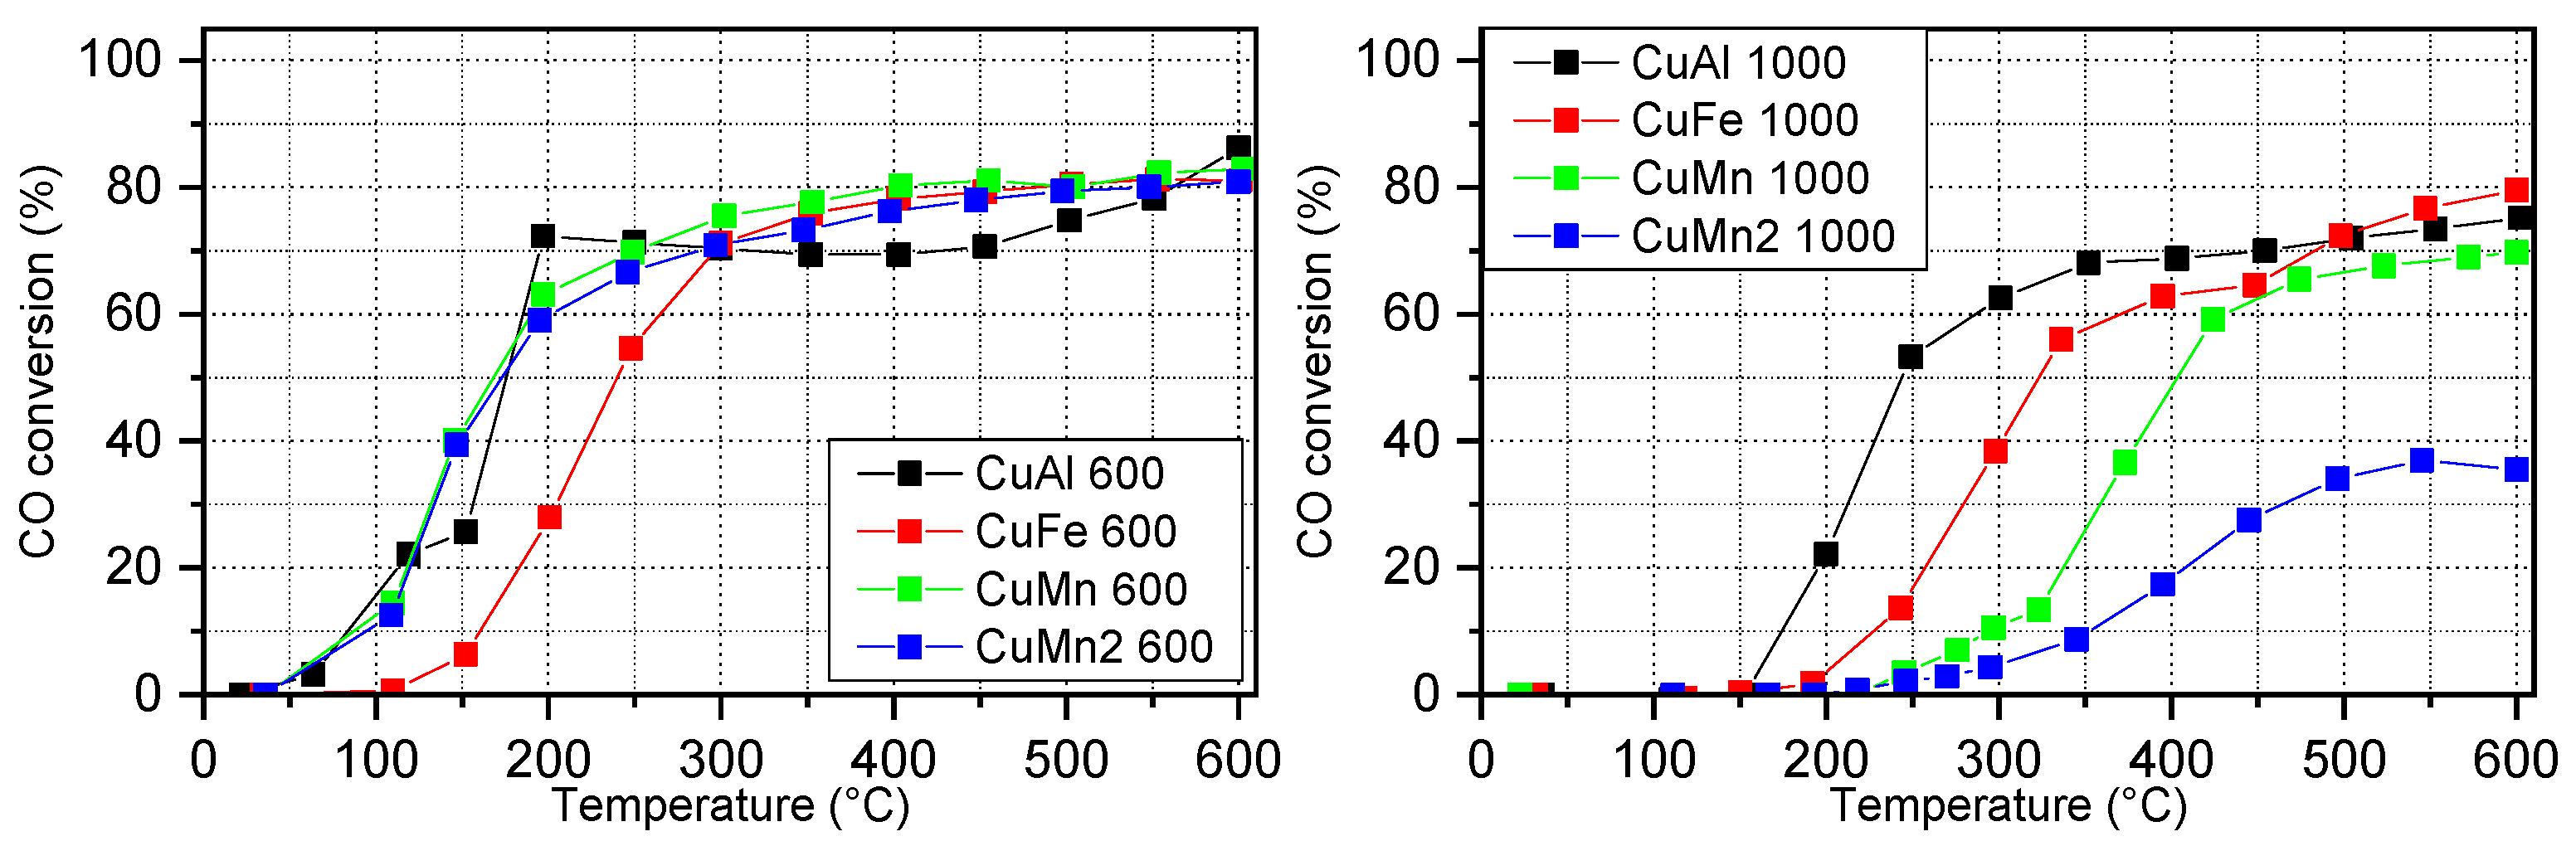
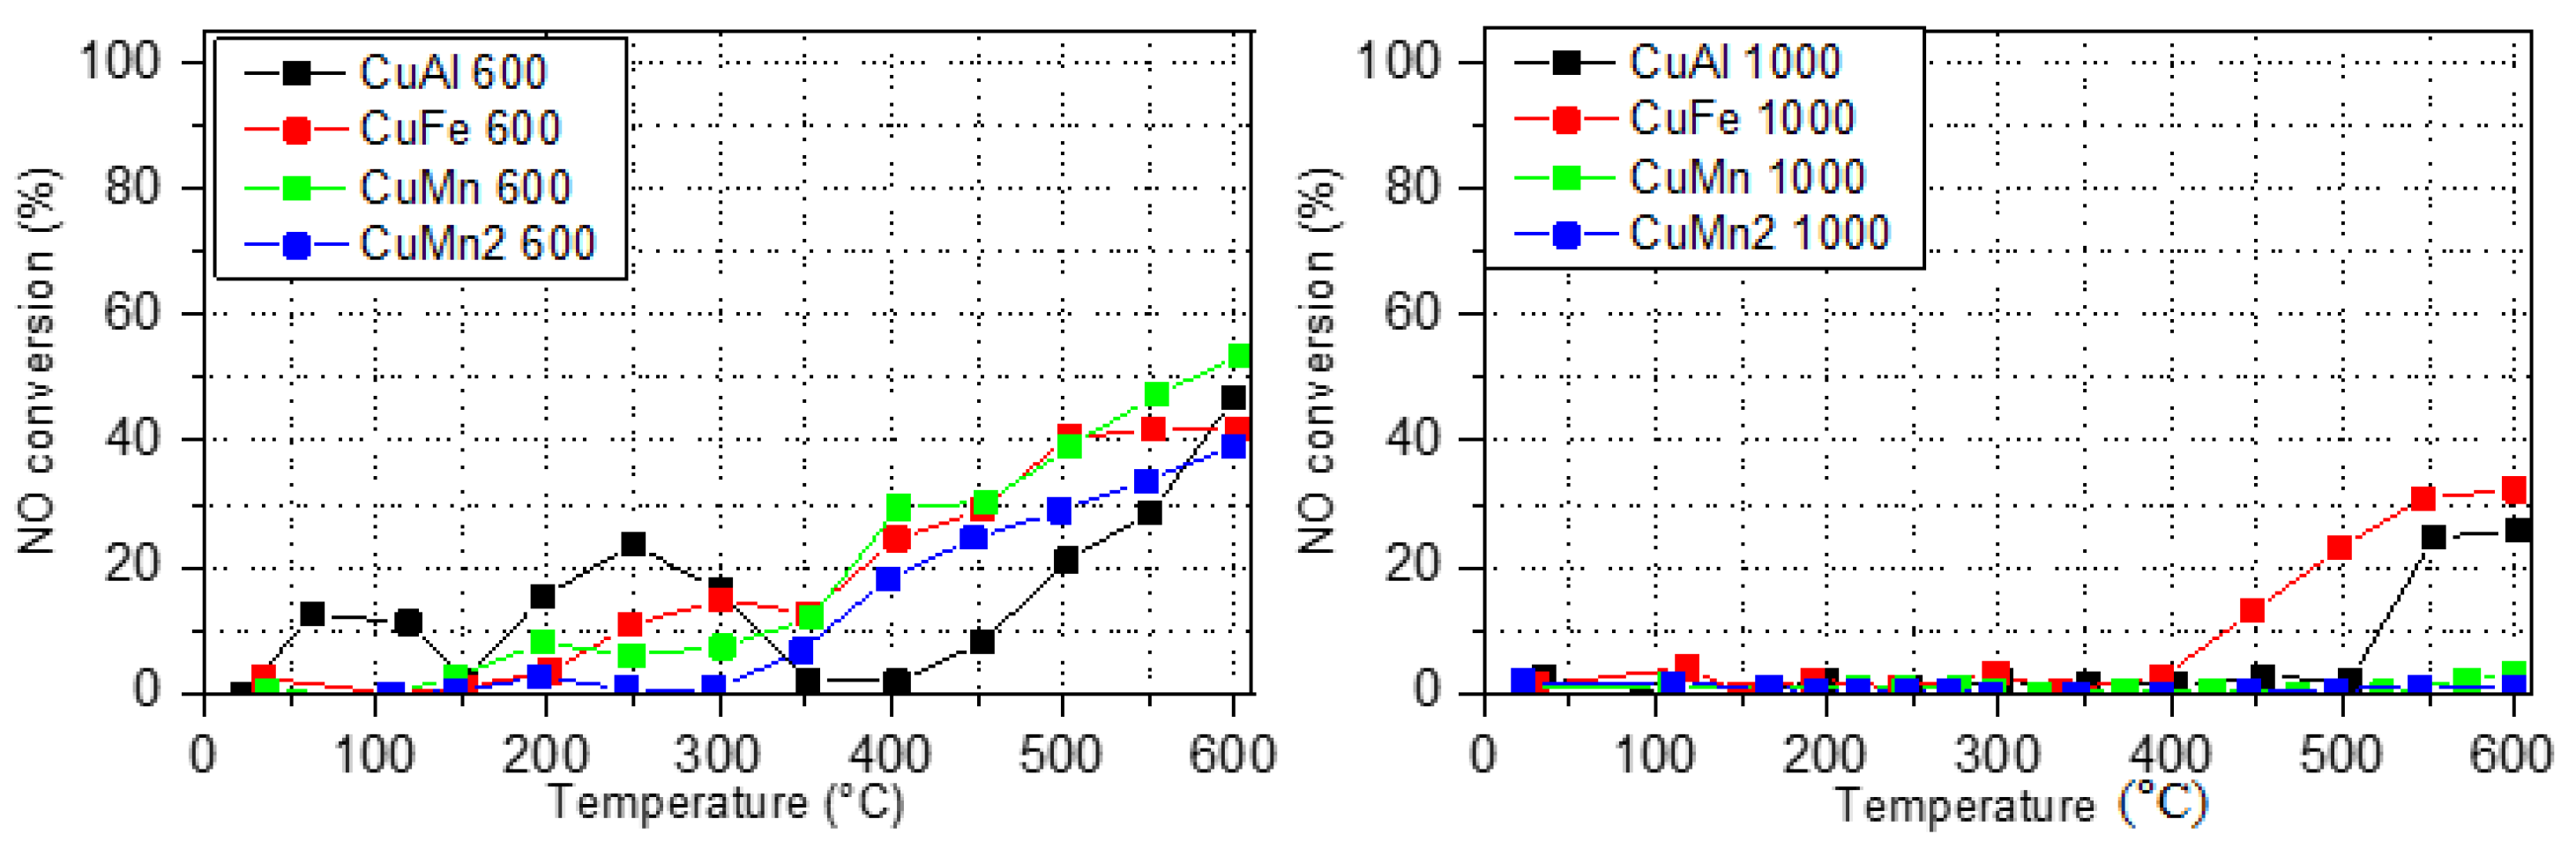
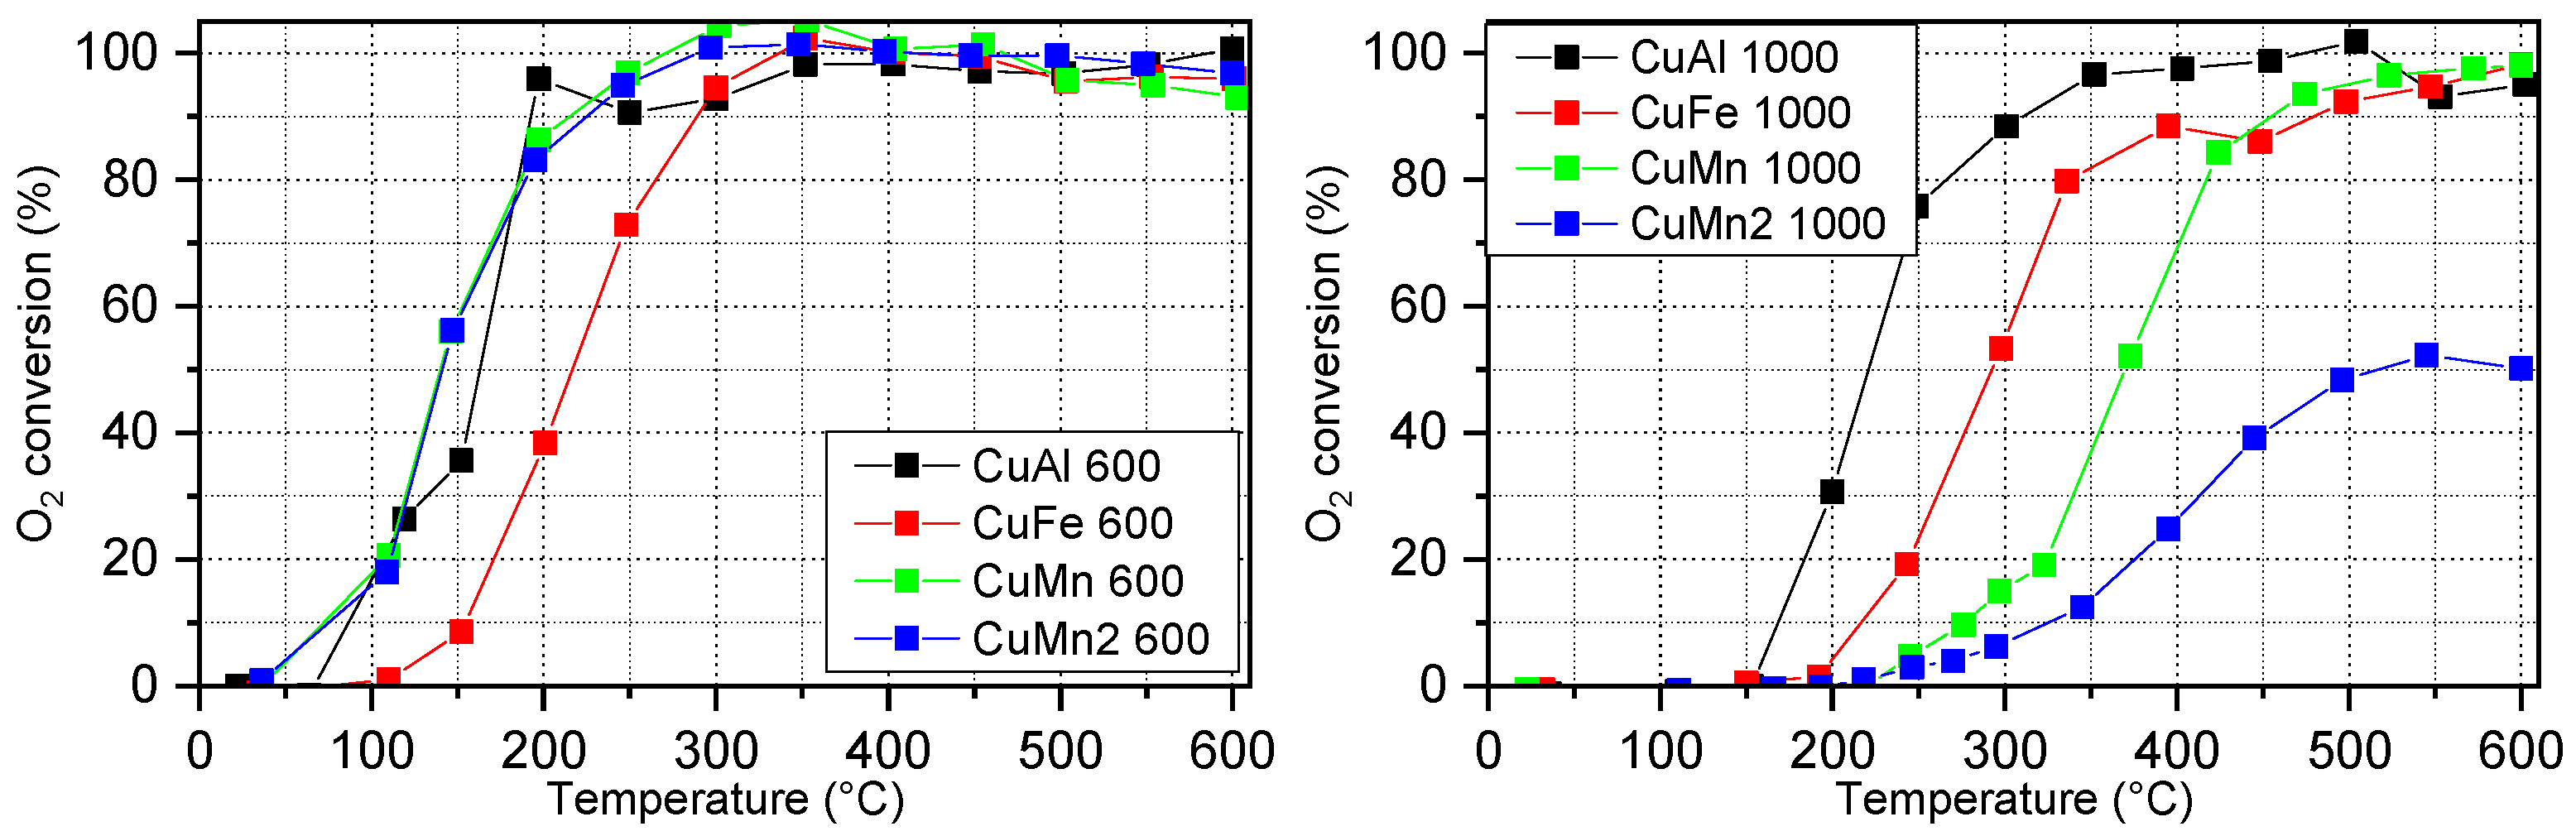
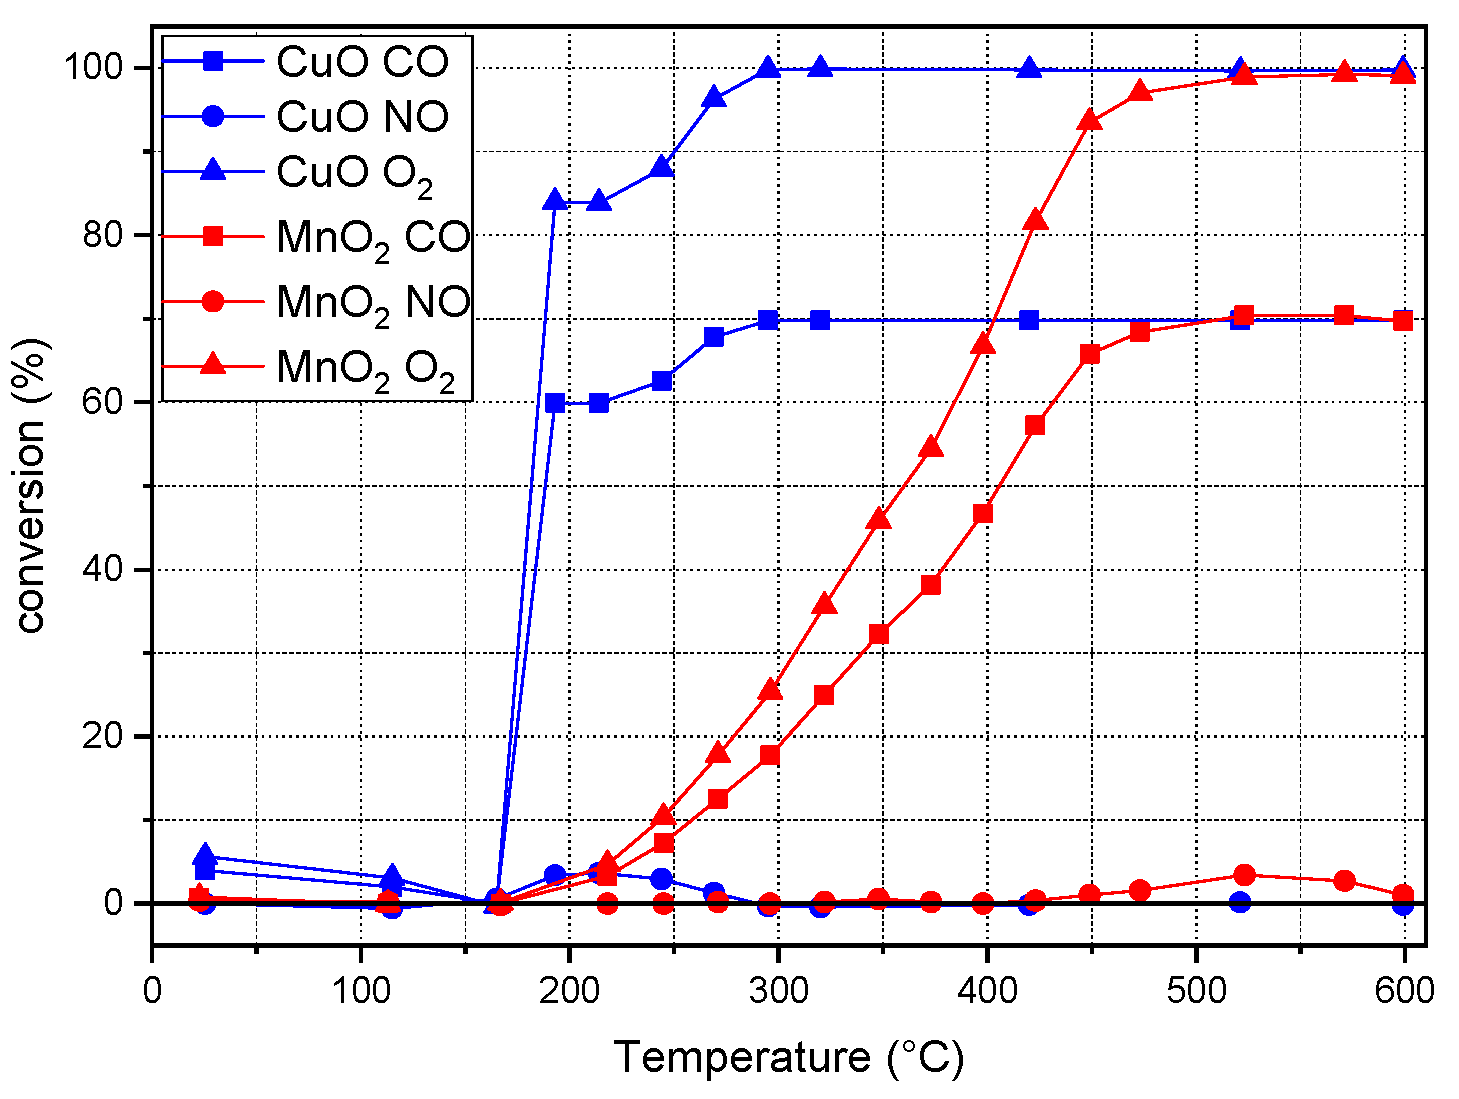
2.2. Catalytic Activity
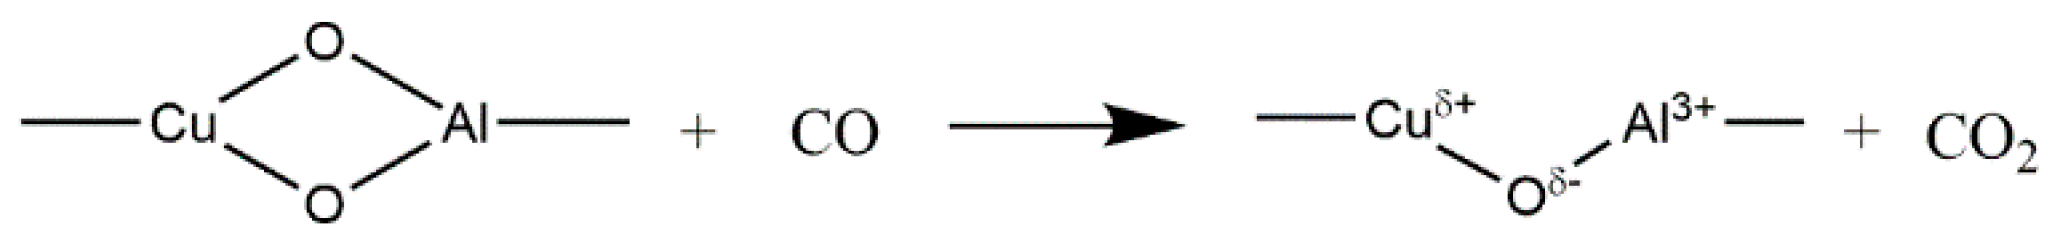
3. Discussion
4. Materials and Methods
4.1. Chemicals
4.2. Catalyst Preparation
4.3. Physicochemical Characterisation
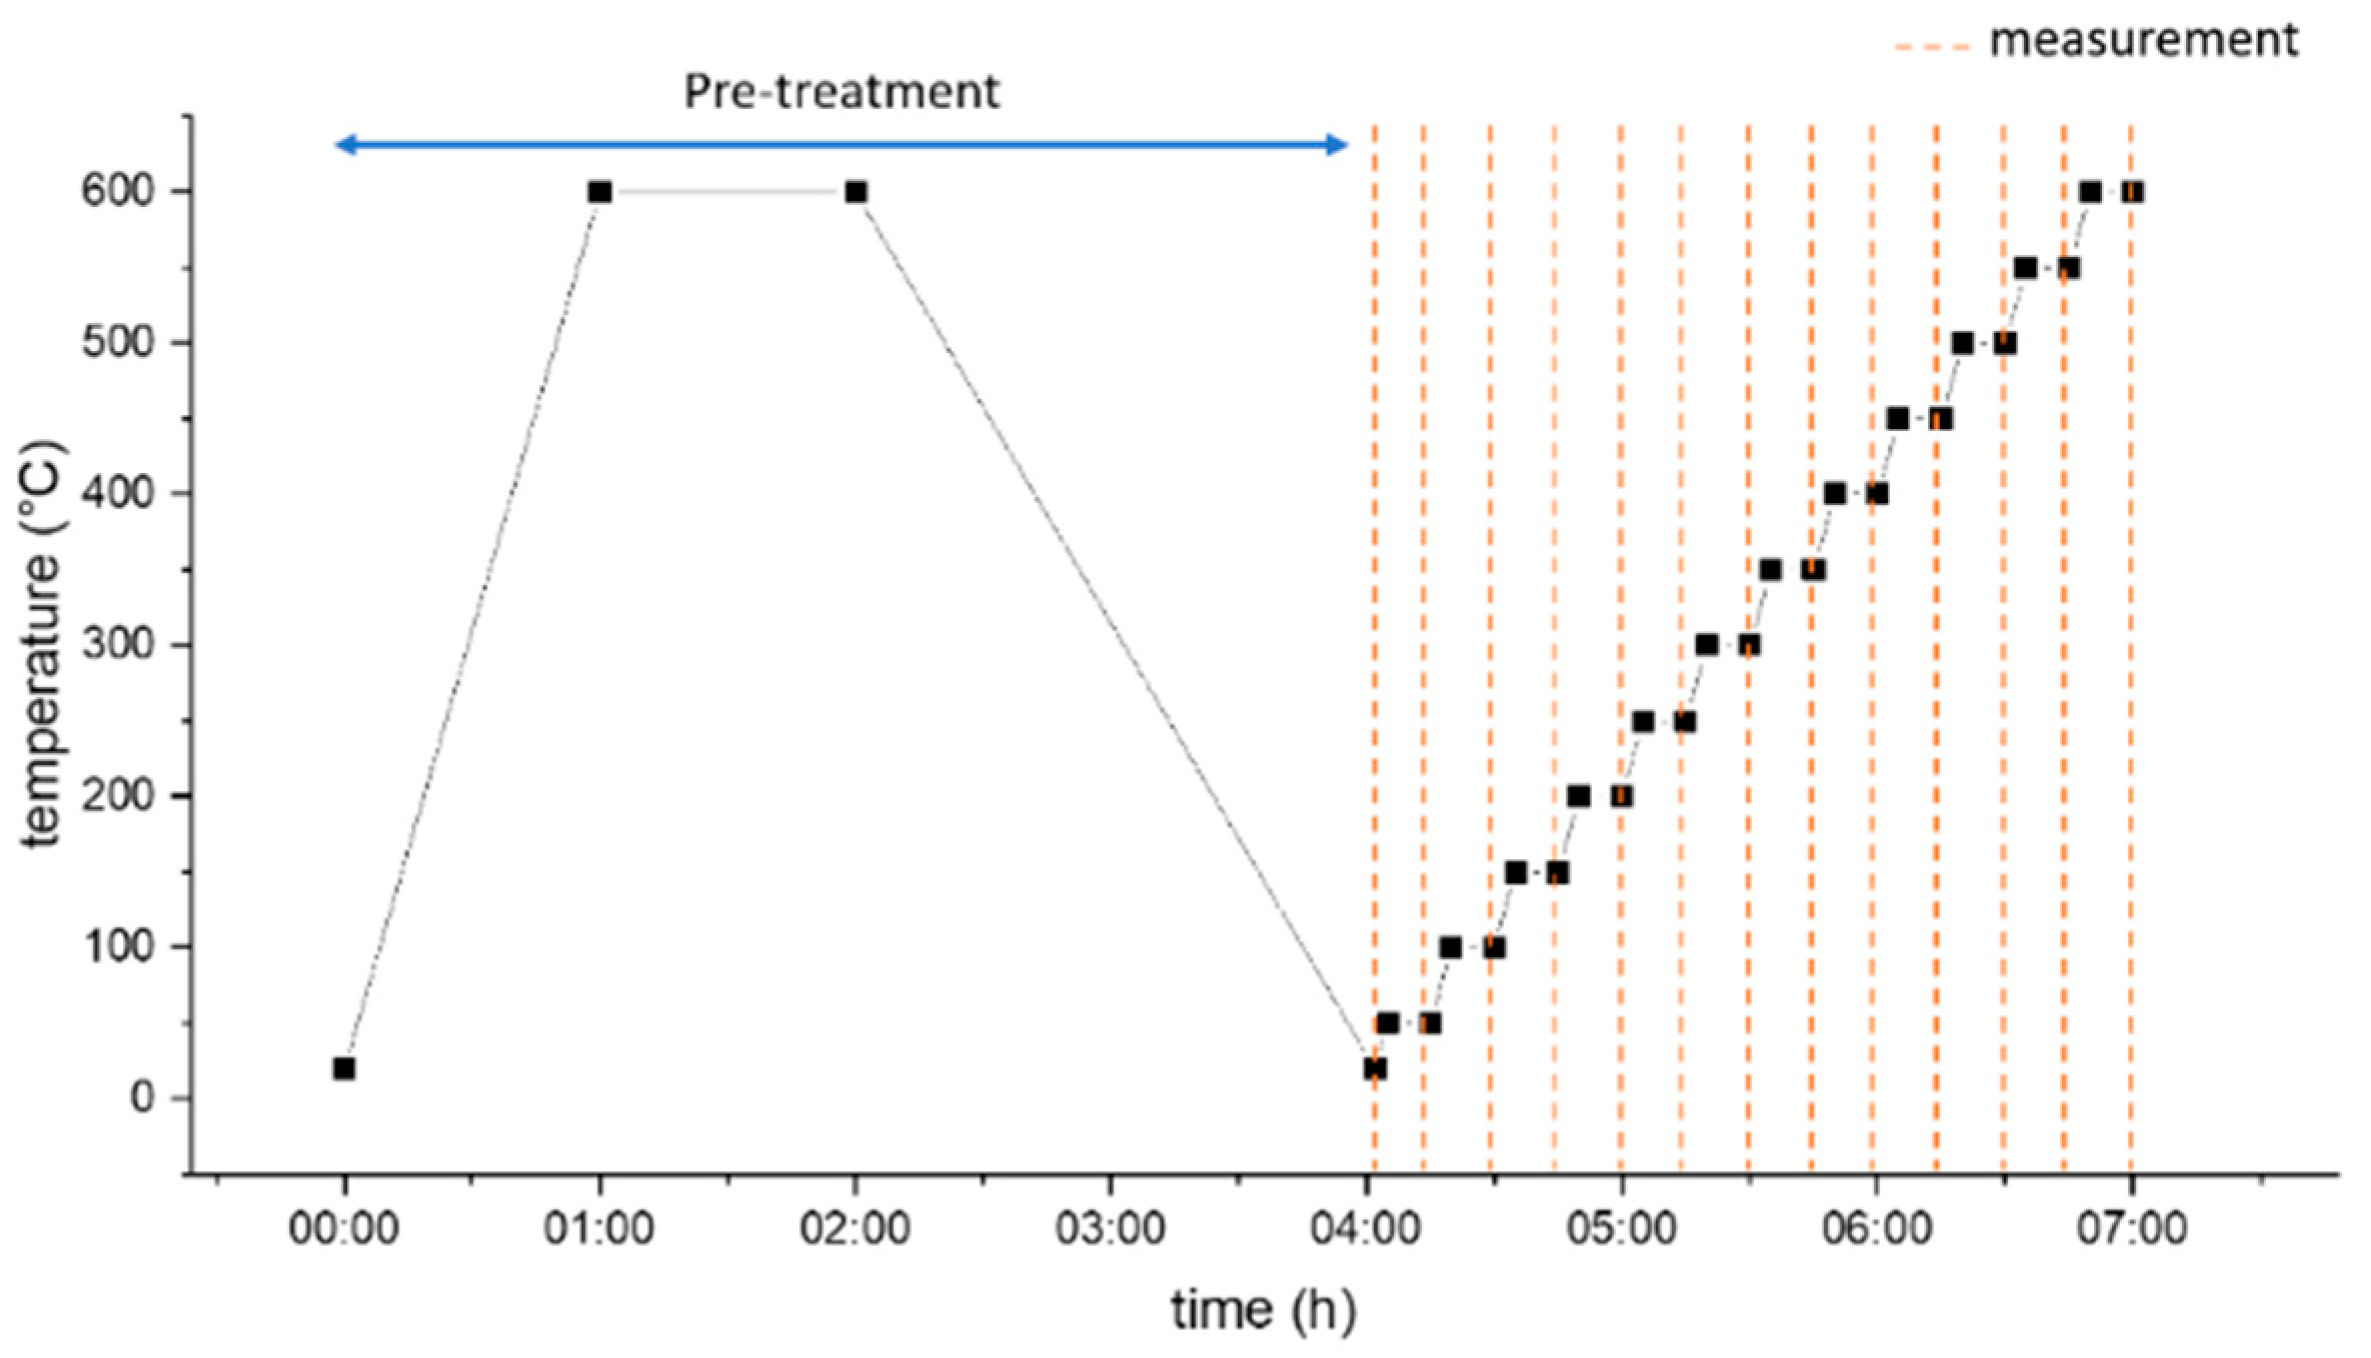
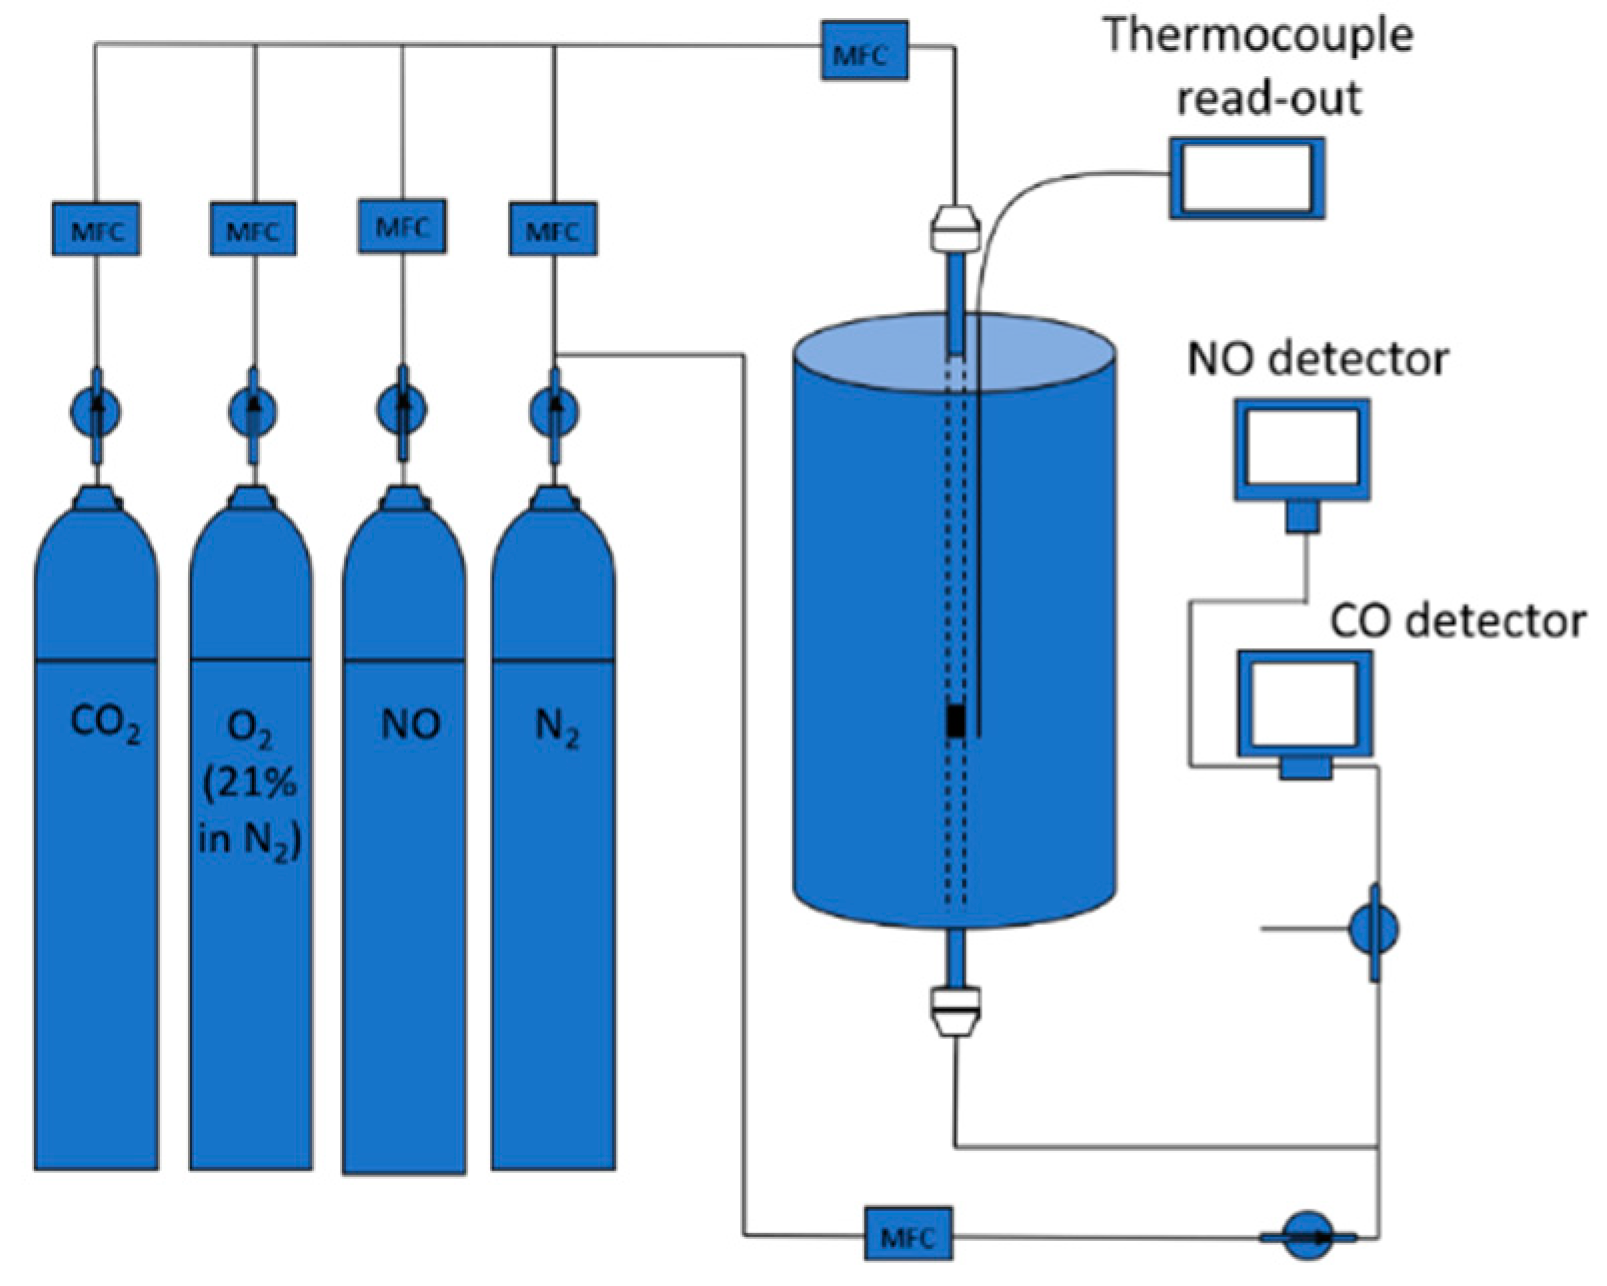
4.4. Catalytic Activity Measurements
5. Conclusions
Supplementary Materials
Author Contributions
Funding
Acknowledgments
Conflicts of Interest
References
- European Automobile Manufacturers Association. Fuel Types of New Cars: Petrol +11.9%, Diesel −3.7%, Electric +80.5% in Fourth Quarter of 2019. Available online: https://www.acea.be/press-releases/article/fuel-types-of-new-cars-petrol-11.9-diesel-3.7-electric-81.3-in-fourth-quart (accessed on 11 June 2020).
- Kumar, K.; Kumar, N.; Singh, H. Comprehensive Review of Three way Catalytic Converter. International J. Adv. Res. Innov. Ideas Educ. 2017, 3, 1188–1196. [Google Scholar]
- European Commission. European Commission Report on Critical Raw Materials and the Circular Economy Part. 1/3; European Commission: Brussels, Belgium, 2018. [Google Scholar]
- Kummer, J.T. Catalysts for automobile emission control. Prog. Energy Combust. Sci. 1980, 6, 177–199. [Google Scholar] [CrossRef]
- Almquist, J.A.; Bray, W.C. The catalytic oxidation of carbon monoxide. I. Efficiency of the catalysts, manganese dioxide, cupric oxide and mixtures of these oxides. J. Am. Chem. Soc. 1923, 45, 2305–2322. [Google Scholar] [CrossRef]
- Buciuman, F.C.; Patcas, F.; Hahn, T. A spillover approach to oxidation catalysis over copper and manganese mixed oxides. Chem. Eng. Process. Process Intensif. 1999, 38, 563–569. [Google Scholar] [CrossRef]
- Cousin, P.; Ross, R.A. Preparation of mixed oxides: A review. Mater. Sci. Eng. A 1990, 130, 119–125. [Google Scholar] [CrossRef]
- Bliss, A. Arthur Becket Lamb February 25,1880—May 15, 1952. J. Am. Chem. Soc. 1955, 77, 5773–5780. [Google Scholar] [CrossRef]
- Lamb, A.B.; Bray, W.C.; Frazer, J.C.W. The Removal of Carbon Monoxide from Air. J. Ind. Eng. Chem. 1920, 12, 213–221. [Google Scholar] [CrossRef]
- Biemelt, T.; Wegner, K.; Teichert, J.; Lohe, M.R.; Martin, J.; Grothe, J.; Kaskel, S. Hopcalite nanoparticle catalysts with high water vapour stability for catalytic oxidation of carbon monoxide. Appl. Catal. B Environ. 2016, 184, 208–215. [Google Scholar] [CrossRef]
- Dey, S.; Dhal, G.C.; Mohan, D.; Prasad, R. Study of Hopcalite (CuMnOx) Catalysts Prepared Through A Novel Route for the Oxidation of Carbon Monoxide at Low Temperature. Bull. Chem. React. Eng. Catal. 2017, 12, 393. [Google Scholar] [CrossRef] [Green Version]
- Puckhaber, L.S.; Cheung, H.; Cocke, D.L.; Clearfield, A. Reactivity of copper manganese oxides. Solid State Ion. 1989, 32–33, 206–213. [Google Scholar] [CrossRef]
- Clarke, T.J.; Davies, T.E.; Kondrat, S.A.; Taylor, S.H. Mechanochemical synthesis of copper manganese oxide for the ambient temperature oxidation of carbon monoxide. Appl. Catal. B Environ. 2015. [Google Scholar] [CrossRef]
- Behar, S.; Gonzalez, P.; Agulhon, P.; Quignard, F.; Świerczyński, D. New synthesis of nanosized Cu-Mn spinels as efficient oxidation catalysts. Catal. Today 2012, 189, 35–41. [Google Scholar] [CrossRef]
- Napruszewska, B.D.; Michalik, A.; Walczyk, A.; Duraczyńska, D.; Dula, R.; Rojek, W.; Lityńska-Dobrzyńska, L.; Bahranowski, K.; Serwicka, E.M. Composites of Laponite and Cu-Mn Hopcalite-Related Mixed Oxides Prepared from Inverse Microemulsions as Catalysts for Total Oxidation of Toluene. Materials 2018, 11, 1365. [Google Scholar] [CrossRef] [PubMed] [Green Version]
- Clarke, T.J.; Kondrat, S.A.; Taylor, S.H. Total oxidation of naphthalene using copper manganese oxide catalysts. Catal. Today 2015. [Google Scholar] [CrossRef]
- Zhao, Q.; Yan, Z.; Chen, C.; Chen, J. Spinels: Controlled Preparation, Oxygen Reduction/Evolution Reaction Application, and Beyond. Chem. Rev. 2017, 117, 10121–10211. [Google Scholar] [CrossRef]
- O’Neill, H.S.C.; James, M.; Dollase, W.A.; Redfern, S.A.T. Temperature dependence of the cation distribution in CuAl2O4 spinel. Eur. J. Mineral. 2005, 17, 581–586. [Google Scholar] [CrossRef]
- Vandenberghe, R.E.; Robbrecht, G.G.; Brabers, V.A.M. On the stability of the cubic spinel structure in the system Cu Mn O. Mater. Res. Bull. 1973, 8, 571–579. [Google Scholar] [CrossRef]
- Fridrichová, J.; Bacik, P.; Ertl, A.; Wildner, M.; Dekan, J.; Miglierini, M. Jahn-Teller distortion of Mn 3+ -occupied octahedra in red beryl from Utah indicated by optical spectroscopy. J. Mol. Struct. 2017, 1152. [Google Scholar] [CrossRef]
- Robbrecht, G.G.; Henriet-Iserentant, C.M. On the Lattice Parameters and the Tetragonal Distortion of the Copper and Cadmium Manganite Systems. Phys. Status Solidi 1970, 41, K43–K46. [Google Scholar] [CrossRef]
- Zuo, X.; Yang, A.; Vittoria, C.; Harris, V. Computational study of copper ferrite (CuFe2O4). J. Appl. Phys. 2006, 99, 08M909. [Google Scholar] [CrossRef]
- Anandan, S.; Selvamani, T.; Prasad, G.G.; Asiri, M.A.; Wu, J.J. Magnetic and catalytic properties of inverse spinel CuFe2O4 nanoparticles. J. Magn. Magn. Mater. 2017, 432, 437–443. [Google Scholar] [CrossRef]
- Ciocarlan, R.G.; Arčon, I.; Pui, A.; Mertens, M.; Tusar, N.N.; Seftel, E.M.; Cool, P. In-depth structural characterization and magnetic properties of quaternary ferrite systems Co0.5Zn0.25M0.25Fe2O4 (M = Ni, Cu, Mn, Mg). J. Alloys Compd. 2020. [Google Scholar] [CrossRef]
- Shoemaker, D.P.; Li, J.; Seshadri, R. Unraveling Atomic Positions in an Oxide Spinel with Two Jahn-Teller Ions: Local Structure Investigation of CuMn2O4. J. Am. Chem. Soc. 2009, 131, 11450–11457. [Google Scholar] [CrossRef] [PubMed]
- Waskowska, A.; Gerward, L.; Olsen, J.; Steenstrup, S.; Talik, E. CuMn2O4: Properties and the high-pressure induced Jahn-Teller phase transition. J. Phys. Condens. Matter 2001, 13, 2549. [Google Scholar] [CrossRef]
- Radhakrishnan, N.K.; Biswas, A.B. A neutron diffraction study of the spinel oxide CuMn2O4. Phys. Status Solidi 1977, 44, 45–49. [Google Scholar] [CrossRef]
- Friedman, R.M.; Freeman, J.J.; Lytle, F.W. Characterization of CuAl2O3 catalysts. J. Catal. 1978, 55, 10–28. [Google Scholar] [CrossRef]
- Strohmeier, B.R.; Levden, D.E.; Field, R.S.; Hercules, D.M. Surface spectroscopic characterization of Cu Al2O3 catalysts. J. Catal. 1985. [Google Scholar] [CrossRef]
- Blasse, G. Ferromagnetism and ferrimagnetism of oxygen spinels containing tetravalent manganese. J. Phys. Chem. Solids 1966, 27, 383–389. [Google Scholar] [CrossRef]
- Vandenberghe, R.E.; Legrand, E.; Scheerlinck, D.; Brabers, V.A.M. Neutron diffraction study of the cation ordering in Cu1.5Mn1.5O4 and CuMg0.5Mn1.5O4. Acta Crystallogr. Sect. B 1976, 32, 2796–2798. [Google Scholar] [CrossRef]
- Jarosch, D. Crystal structure refinement and reflectance measurements of hausmannite, Mn3O4. Mineral. Petrol. 1987, 37, 15–23. [Google Scholar] [CrossRef]
- Xu, J.F.; Ji, W.; Shen, Z.X.; Li, W.S.; Tang, S.H.; Ye, X.R.; Jia, D.Z.; Xin, X.Q. Raman spectra of CuO nanocrystals. J. Raman Spectrosc. 1999, 30, 413–415. [Google Scholar] [CrossRef]
- Liu, Y.; Cheng, B.; Wang, K.-K.; Ling, G.-P.; Cai, J.; Song, C.-L.; Han, G.-R. Study of Raman spectra for γ-Al2O3 models by using first-principles method. Solid State Commun. 2014, 178, 16–22. [Google Scholar] [CrossRef]
- D’Ippolito, V.; Andreozzi, G.B.; Bersani, D.; Lottici, P.P. Raman fingerprint of chromate, aluminate and ferrite spinels. J. Raman Spectrosc. 2015, 46, 1255–1264. [Google Scholar] [CrossRef]
- Tomar, N.; Ghanti, E.; Bhagi, A.K.; Nagarajan, R. Studies on the hydrolysis of {Cu[Al(OPri)4]2}, a single source precursor for CuAl2O4 spinel. J. Non. Cryst. Solids 2009. [Google Scholar] [CrossRef]
- Ghanti, E.; Nagarajan, R. Synthesis of CuAl2(acac)4(OiPr)4, its hydrolysis and formation of bulk CuAl2O4 from the hydrolyzed gels; a case study of molecules to materials. Dalton Trans. 2010, 39, 6056–6061. [Google Scholar] [CrossRef]
- de Faria, D.L.A.; Venâncio Silva, S.; de Oliveira, M.T. Raman microspectroscopy of some iron oxides and oxyhydroxides. J. Raman Spectrosc. 1997, 28, 873–878. [Google Scholar] [CrossRef]
- Balaji, M.; Chithra Lekha, P.; Pathinettam Padiyan, D. Core-shell structure in copper ferrite-polyaniline nanocomposite: Confirmation by laser Raman spectra. Vib. Spectrosc. 2012. [Google Scholar] [CrossRef]
- Chatterjee, B.K.; Bhattacharjee, K.; Dey, A.; Ghosh, C.K.; Chattopadhyay, K.K. Influence of spherical assembly of copper ferrite nanoparticles on magnetic properties: Orientation of magnetic easy axis. Dalton Trans. 2014, 43, 7930–7944. [Google Scholar] [CrossRef]
- Yang, X.; Tang, W.; Liu, Z.; Makita, Y.; Ooi, K. Synthesis of lithium-rich LixMn2O4 spinels by lithiation and heat-treatment of defective spinels. J. Mater. Chem. 2002, 12, 489–495. [Google Scholar] [CrossRef]
- Han, Y.-F.; Chen, F.; Zhong, Z.; Ramesh, K.; Chen, L.; Widjaja, E. Controlled Synthesis, Characterization, and Catalytic Properties of Mn2O3 and Mn3O4 Nanoparticles Supported on Mesoporous Silica SBA-15. J. Phys. Chem. B 2006, 110, 24450–24456. [Google Scholar] [CrossRef]
- Van Der Grift, C.J.G.; Mulder, A.; Geus, J.W. Characterization of silica-supported copper catalysts by means of temperature-programmed reduction. Appl. Catal. 1990, 60, 181–192. [Google Scholar] [CrossRef]
- Choukroun, D.; Daems, N.; Kenis, T.; Van Everbroeck, T.; Hereijgers, J.; Altantzis, T.; Bals, S.; Cool, P.; Breugelmans, T. Bifunctional Nickel–Nitrogen-Doped-Carbon-Supported Copper Electrocatalyst for CO2 Reduction. J. Phys. Chem. C 2020, 124, 1369–1381. [Google Scholar] [CrossRef]
- Ruiz Puigdollers, A.; Schlexer, P.; Tosoni, S.; Pacchioni, G. Increasing Oxide Reducibility: The Role of Metal/Oxide Interfaces in the Formation of Oxygen Vacancies. ACS Catal. 2017, 7, 6493–6513. [Google Scholar] [CrossRef] [Green Version]
- Biasin, A.; Fabro, J.; Michelon, N.; Glisenti, A.; Canu, P. Investigation of thermal effects on heterogeneous exothermic reactions and their impact on kinetics studies. Chem. Eng. J. 2019. [Google Scholar] [CrossRef]
- Iablokov, V.; Frey, K.; Geszti, O.; Kruse, N. High Catalytic Activity in CO Oxidation over MnOxNanocrystals. Catal. Lett. 2010, 134, 210–216. [Google Scholar] [CrossRef]
- Patel, A.; Shukla, P.; Chen, J.; Rufford, T.E.; Rudolph, V.; Zhu, Z. Activity of mesoporous-MnOx (m-MnOx) and CuO/m-MnOx for catalytic reduction of NO with CO. Catal. Today 2013, 212, 38–44. [Google Scholar] [CrossRef]
- Okamoto, Y.; Gotoh, H.; Hishida, K.; Aritani, H.; Tanaka, T.; Yoshida, S. Surface copper-TiO2 interaction species for NO-CO reactions. Appl. Surf. Sci. 1997, 121–122, 509–512. [Google Scholar] [CrossRef]
- Okamoto, Y.; Gotoh, H. Copper-zirconia catalysts for NO-CO reactions. Catal. Today 1997, 36, 71–79. [Google Scholar] [CrossRef]
- Emamjomeh, M.M.; Sivakumar, M.; Varyani, A.S. Analysis and the understanding of fluoride removal mechanisms by an electrocoagulation/flotation (ECF) process. Desalination 2011, 275, 102–106. [Google Scholar] [CrossRef]
- Graves, P.R.; Johnston, C.; Campaniello, J.J. Raman scattering in spinel structure ferrites. Mater. Res. Bull. 1988, 23, 1651–1660. [Google Scholar] [CrossRef]
- Buhl, R. Manganites spinelles purs d’elements de transition preparations et structures cristallographiques. J. Phys. Chem. Solids 1969, 30, 805–812. [Google Scholar] [CrossRef]
- Areán, C.O.; Viñuela, J.S.D. Structural study of copper-nickel aluminate (CuxNi1−xAl2O4) spinels. J. Solid State Chem. 1985, 60, 1–5. [Google Scholar] [CrossRef]
- Severino, F.; Brito, J.L.; Laine, J.; Fierro, J.L.G.; Agudo, A.L. Nature of Copper Active Sites in the Carbon Monoxide Oxidation on CuAl2O4 and CuCr2O4 Spinel Type Catalysts. J. Catal. 1998, 177, 82–95. [Google Scholar] [CrossRef]
- da Silva, S.W.; Nakagomi, F.; Silva, M.S.; Franco, A.; Garg, V.K.; Oliveira, A.C.; Morais, P.C. Effect of the Zn content in the structural and magnetic properties of ZnxMg1−xFe2O4 mixed ferrites monitored by Raman and Mössbauer spectroscopies. J. Appl. Phys. 2010, 107, 09B503. [Google Scholar] [CrossRef]
- Vandenabeele, P. Practical Raman Spectroscopy: An Introduction; Analytical Techniques in the Sciences; Wiley: Hoboken, NJ, USA, 2013; ISBN 9781119961901. [Google Scholar]
- Lazarević, Z.; Jovalekić, č; Milutinović, A.; Sekulić, D.; Ivanovski, V.; Recnik, A.; Cekic, B.; Romčević, N. Nanodimensional spinel NiFe2O4 and ZnFe2O4 ferrites prepared by soft mechanochemical synthesis. J. Appl. Phys. 2013, 113. [Google Scholar] [CrossRef]
- Saravanakumar, B.; Muthu Lakshmi, S.; Ravi, G.; Ganesh, V.; Sakunthala, A.; Yuvakkumar, R. Electrochemical properties of rice-like copper manganese oxide (CuMn2O4) nanoparticles for pseudocapacitor applications. J. Alloys Compd. 2017, 723, 115–122. [Google Scholar] [CrossRef]
- Pekov, I.; Sandalov, F.; Koshlyakova, N.; Vigasina, M.; Polekhovsky, Y.; Britvin, S.; Sidorov, E.; Turchkova, A. Copper in Natural Oxide Spinels: The New Mineral Thermaerogenite CuAl2O4, Cuprospinel and Cu-Enriched Varieties of Other Spinel-Group Members from Fumaroles of the Tolbachik Volcano, Kamchatka, Russia. Minerals 2018, 8, 498. [Google Scholar] [CrossRef] [Green Version]
- Mars, P.; van Krevelen, D.W. Oxidations carried out by means of vanadium oxide catalysts. Chem. Eng. Sci. 1954, 3, 41–59. [Google Scholar] [CrossRef]
- Carlotto, S.; Natile, M.M.; Glisenti, A.; Vittadini, A. Catalytic Mechanisms of NO Reduction in a CO-NO Atmosphere at Co- and Cu-Doped SrTiO3(100) Surfaces. J. Phys. Chem. C 2018, 122, 449–454. [Google Scholar] [CrossRef]
- Carlotto, S.; Natile, M.M.; Glisenti, A.; Paul, J.-F.; Blanck, D.; Vittadini, A. Energetics of CO oxidation on lanthanide-free perovskite systems: The case of Co-doped SrTiO3. Phys. Chem. Chem. Phys. 2016, 18, 33282–33286. [Google Scholar] [CrossRef]
- Xie, S.; Rosynek, M.P.; Lunsford, J.H. Catalytic Reactions of NO over 0–7 mol% Ba/MgO Catalysts: I. The Direct Decomposition of NO. J. Catal. 1999, 188, 24–31. [Google Scholar] [CrossRef]
- Vannice, M.A.; Walters, A.B.; Zhang, X. The Kinetics of NOx Decomposition and NO Reduction by CH4 over La2O3 and Sr/La2O3. J. Catal. 1996, 159, 119–126. [Google Scholar] [CrossRef]
- Patel, A.; Shukla, P.; Chen, J.; Rufford, T.E.; Wang, S.; Rudolph, V.; Zhu, Z. Structural sensitivity of mesoporous alumina for copper catalyst loading used for NO reduction in presence of CO. Chem. Eng. Res. Des. 2015, 101, 27–43. [Google Scholar] [CrossRef]
- Patel, A.; Shukla, P.; Pan, G.T.; Chong, S.; Rudolph, V.; Zhu, Z. Influence of copper loading on mesoporous alumina for catalytic NO reduction in the presence of CO. J. Environ. Chem. Eng. 2017, 5, 2350–2361. [Google Scholar] [CrossRef]
- Zhu, Z.H.; Zhu, H.Y.; Wang, S.B.; Lu, G.Q. Preparation and Characterization of Copper Catalysts Supported on Mesoporous Al2O3 Nanofibers for N2O Reduction to N2. Catal. Lett. 2003, 91, 73–81. [Google Scholar] [CrossRef]
- Shimizu, K.; Maeshima, H.; Satsuma, A.; Hattori, T. Transition metal-aluminate catalysts for NO reduction by C3H6. Appl. Catal. B Environ. 1998, 18, 163–170. [Google Scholar] [CrossRef]
- Pinto, F.M.; Suzuki, V.Y.; Silva, R.C.; La Porta, F.A. Oxygen Defects and Surface Chemistry of Reducible Oxides. Front. Mater. 2019, 6, 260. [Google Scholar] [CrossRef]
- Cocke, D.L.; Vepřek, S. First direct evidence of a solid state charge transfer redox system Cu2+ + Mn3+ ⇋ Cu1+ + Mn4+ in copper manganese oxide. Solid State Commun. 1986, 57, 745–748. [Google Scholar] [CrossRef]
- Vepřek, S.; Cocke, D.L.; Kehl, S.; Oswald, H.R. Mechanism of the deactivation of Hopcalite catalysts studied by XPS, ISS, and other techniques. J. Catal. 1986, 100, 250–263. [Google Scholar] [CrossRef]
- Spassova, I.; Khristova, M.; Panayotov, D.; Mehandjiev, D. Coprecipitated CuO-MnOx Catalysts for Low-Temperature CO-NO and CO-NO-O2 Reactions. J. Catal. 1999, 185, 43–57. [Google Scholar] [CrossRef]
- Gassan-zade, G.Z.; Mukherjee, T.K.; Alkhazov, T.G. Effect of oxygen on the catalytic reduction of nitric oxides by carbon monoxide over NiO. React. Kinet. Catal. Lett. 1979, 12, 525–529. [Google Scholar] [CrossRef]
- Hargreaves, J.S.J. Some considerations related to the use of the Scherrer equation in powder X-ray diffraction as applied to heterogeneous catalysts. Catal. Struct. React. 2016, 2, 33–37. [Google Scholar] [CrossRef] [Green Version]


| Catalyst/Size (nm) | CuO | Spinel |
|---|---|---|
| CuAl 600 | 10 | - |
| CuFe 600 | 17 | - |
| CuMn 600 | 11 | 22 |
| CuMn2 600 | - | 33 |
| CuAl 1000 | 44 | 56 |
| CuFe 1000 | 46 | 62 |
| CuMn 1000 | 26 | 63 |
| CuMn2 1000 | - | 56 |
| - | T50 O2 | T20 NO | SSA | RRCO | Spec. RRCO | TOFCO | RRNO | Spec. RRNO | TOFNO |
|---|---|---|---|---|---|---|---|---|---|
| - | - | - | - | at 200 °C | at 200 °C | at 200 °C | at 550 °C | at 550 °C | at 550 °C |
| - | (°C) | (°C) | (m2/g) | (mol. s−1. gcat−1) | (mol. s−1 (m2)−1) | (h−1) | (mol. s−1. gcat−1) | (mol. s−1 (m2)−1) | (h−1) |
| CuAl 600 | 178 | 390 | 129 | 1.56 × 10⁻⁶ | 1.21 × 10⁻⁸ | 1.21 | 1.97 × 10⁻⁶ | 1.53 × 10⁻⁶ | 0.152 |
| CuFe 600 | 217 | 384 | 49 | 5.71 × 10⁻⁷ | 1.17 × 10⁻⁸ | 0.82 | 2.88 × 10⁻⁶ | 5.90 × 10⁻⁶ | 0.413 |
| CuMn 600 | 140 | 377 | 36 | 1.32 × 10⁻⁶ | 3.61 × 10⁻⁸ | 1.12 | 3.23 × 10⁻⁶ | 8.86 × 10⁻⁶ | 0.276 |
| CuMn2 600 | 141 | 412 | 47 | 1.24 × 10⁻⁶ | 2.63 × 10⁻⁸ | 1.76 | 2.35 × 10⁻⁶ | 4.98 × 10⁻⁶ | 0.334 |
| CuAl 1000 | 221 | 543 | 3 | 4.60 × 10⁻⁷ | 1.32 × 10⁻⁷ | 0.36 | 1.61 × 10⁻⁶ | 4.63 × 10⁻⁶ | 0.125 |
| CuFe 1000 | 293 | 483 | 1 | 7.44 × 10⁻⁸ | 1.11 × 10⁻⁷ | 0.11 | 2.15 × 10⁻⁶ | 3.21 × 10⁻⁶ | 0.308 |
| CuMn 1000 | 370 | - | 0.2 | 0 | 0 | 0.00 | 8.35 × 10⁻⁶ | 4.72 × 10⁻⁶ | 0.007 |
| CuMn2 1000 | 516 | - | 0.1 | 4.20 × 10⁻⁹ | 3.02 × 10⁻⁸ | 0.01 | 7.85 × 10⁻⁶ | 5.64 × 10⁻⁶ | 0.011 |
| CuO | 182 | - | 1 | 1.55 × 10⁻⁶ | 1.69 × 10⁻⁶ | 0.44 | 0 | 0 | 0.000 |
| MnO2 | 360 | - | 4 | 4.41 × 10⁻⁸ | 1.06 × 10⁻⁸ | 0.01 | 2.09 × 10⁻⁶ | 5.04 × 10⁻⁶ | 0.007 |
Publisher’s Note: MDPI stays neutral with regard to jurisdictional claims in published maps and institutional affiliations. |
© 2020 by the authors. Licensee MDPI, Basel, Switzerland. This article is an open access article distributed under the terms and conditions of the Creative Commons Attribution (CC BY) license (http://creativecommons.org/licenses/by/4.0/).
Share and Cite
Everbroeck, T.V.; Ciocarlan, R.-G.; Hoey, W.V.; Mertens, M.; Cool, P. Copper-Containing Mixed Metal Oxides (Al, Fe, Mn) for Application in Three-Way Catalysis. Catalysts 2020, 10, 1344. https://0-doi-org.brum.beds.ac.uk/10.3390/catal10111344
Everbroeck TV, Ciocarlan R-G, Hoey WV, Mertens M, Cool P. Copper-Containing Mixed Metal Oxides (Al, Fe, Mn) for Application in Three-Way Catalysis. Catalysts. 2020; 10(11):1344. https://0-doi-org.brum.beds.ac.uk/10.3390/catal10111344
Chicago/Turabian StyleEverbroeck, Tim Van, Radu-George Ciocarlan, Wouter Van Hoey, Myrjam Mertens, and Pegie Cool. 2020. "Copper-Containing Mixed Metal Oxides (Al, Fe, Mn) for Application in Three-Way Catalysis" Catalysts 10, no. 11: 1344. https://0-doi-org.brum.beds.ac.uk/10.3390/catal10111344