Article

The Influence of Calcination Temperature on Photocatalytic Activity of TiO2-Acetylacetone Charge Transfer Complex towards Degradation of NOx under Visible Light

by
Lucas A. Almeida
1,
Margarita Habran
2,
Rafael dos Santos Carvalho
3,
Marcelo E. H. Maia da Costa
3,
Marco Cremona
3,
Bruno C. Silva
4,
Klaus Krambrock
4,
Omar Ginoble Pandoli
5,
Edisson Morgado Jr.
6 and
Bojan A. Marinkovic
1,*
1
Department of Chemical and Materials Engineering, Pontifical Catholic University of Rio de Janeiro (PUC-Rio), 22453-900 Rio de Janeiro, RJ, Brazil
2
Facultad de Ingeniería, Universidad ECCI, 111311 Bogotá, Colombia
3
Department of Physics, Pontifical Catholic University of Rio de Janeiro (PUC-Rio), 22453-900 Rio de Janeiro, RJ, Brazil
4
Department of Physics, Federal University of Minas Gerais, 31270-901 Belo Horizonte, MG, Brazil
5
Department of Chemistry, Pontifical Catholic University of Rio de Janeiro (PUC-Rio), 22453-900 Rio de Janeiro, RJ, Brazil
6
PETROBRAS S.A., Research & Development Centre, 21941-915 Rio de Janeiro, RJ, Brazil
*
Author to whom correspondence should be addressed.
Submission received: 12 November 2020 / Revised: 2 December 2020 / Accepted: 8 December 2020 / Published: 14 December 2020

Abstract

:
The improvement of photocatalytic activity of TiO2-based nanomaterials is widely investigated due to the tentative of their industrialization as environmental photocatalysts and their inherently low solar spectrum sensitivity and rapid recombination of charge carriers. Coupling of oxygen-based bidentate diketone to nanocrystalline TiO2 represents a potential alternative for improving the holdbacks. Formation of TiO2-acetylacetone charge transfer complex (CTC) by sol-gel route results in a hybrid semiconductor material with photodegradation activity against toxic NOx gas. In this research, the influence of the chelating agent acetylacetone (ACAC) content on the CTC photocatalytic efficiency under visible light was evaluated. A high content of ACAC in the CTC is not a decisive factor for efficiency of photocatalytic reactions. In fact, the highest efficiency for NOx degradation (close to 100%, during 1 h of visible light exposure) was reported for the material calcined in air at 300 °C with the content of strongly bonded acetylacetone not higher than 3 wt.%. Higher calcination temperature (400 °C) left TiO2 almost completely depleted in ACAC, while at the highest applied temperature (550 °C) a portion of anatase was transformed into rutile and the sample is free of ACAC. The analyses pointed out that superoxide anion radical (O2) plays an active role in photo-oxidation of NOx. Our findings indicate that this CTC has both high visible light spectral sensitivity and photocatalytic efficiency.

Graphical Abstract

1. Introduction

TiO2-based nanomaterials have been widely investigated for photocatalytic applications [1,2,3,4,5]. Nevertheless, their low sensitivity to solar radiation spectrum and fast free electron-to-hole recombination remain the shortfalls to be overcome. Among different approaches reported in literature to deal with these challenges, the addition of organic molecules is a promising alternative [6,7,8,9,10,11].
There are two different types of organic molecules and mechanisms that can enhance the visible range absorption of TiO2 [6,12]. Dye sensitization is related to large dye molecules, such as Ru-based complexes, which act as visible light sensitizers by promoting electron excitation within dye from the highest occupied molecular orbital (HOMO) into the lowest unoccupied molecular orbital (LUMO). This process is followed by injection of the excited free electrons from LUMO into the conduction band (CB) of semiconductor which, subsequently, interact with the adsorbed O2 molecules to form reactive oxygen species (ROS), such as superoxide anion radical (O2). The ROS species are capable to react with the target toxic molecules causing its mineralization or they can attack in opposite sense and destabilize dye molecule [6,13].
On the other hand, ligand to metal charge transfer (LMCT) is based on the interaction between a semiconductor and a smaller organic molecule, for example, an oxygen-based bidentate, such as acetylacetone (ACAC) [14,15], dopamine, catechol or salicylic acid [11,16]. The mechanism is based on the direct injection of electrons from the HOMO of a bidentate molecule into the CB of a semiconductor [17]. The LMCT mechanism is mostly reported for TiO2-based materials [6,15,18], although also documented for some other semiconductors, such as Mg2TiO4 and BiOCl [7,19]. The LMCT complexes are capable to absorb visible light and to promote the formation of the superoxide anion radical ·O2 under visible light irradiation [6].
One-step coupling of ACAC onto TiO2 during sol-gel synthesis was recently reported [14], in contrast to the common addition approach, in which bidentate molecules are added to TiO2 after completion of synthesis procedure [6]. The as-obtained amorphous xerogel [14] showed a strong LMCT, due to long time stability of O2, and fast degradation rate in dark conditions, to avoid photocatalytic degradation process of phenanthrene, a polycyclic aromatic hydrocarbon used as a model compound. The same authors reported that this xerogel crystallized to anatase only after the calcination at 500 °C for 1 h. In another study, the same group confirmed high oxidative degradation capability of the amorphous xerogel in dark, using 2,4-dichlorophenol as the model compound [8]. They also reported the formation of black anatase, with high concentration of Ti3+, after air calcination of amorphous xerogel at 400 °C for 1 h. The as-synthesized material also presented high stability of ROS at room temperature.
It is worth noting that ACAC is originally proposed in sol-gel synthesis as a complexing agent to limit the rates of hydrolysis and condensation reactions and, therefore, to limit the size of the newly formed crystallites [20]. However, when used in excess it serves for CTC formation and promotes LMCT [8,14,15].
Previously, our research group [15] synthesized directly through the sol-gel method, followed by drying at 100 °C, nanocrystalline anatase (mean crystallite size of ~2.5 nm) covered by ACAC. It was demonstrated that the as-prepared TiO2-ACAC nanocrystalline served as spacer for visible light sensitive mesoporous nanohybrids of lepidocrocite-like ferrititanate which was calcined only at 300 °C. TiO2-ACAC xerogel showed, under the visible light irradiation, photocatalytic activity for oxidative degradation of NOx higher than the one measured for Evonik P-25 TiO2 powder. The same study confirmed formation of LMCT, and, therefore, HOMO to CB electron transfer, at approximately 2.5 eV.
The present study pledged to understand the influence of calcination temperatures, between 300 and 550 °C, on the content of ACAC and on the photocatalytic properties of the TiO2-ACAC calcined materials. To the best of our knowledge, a study dealing with the photocatalytic efficiency of TiO2-ACAC CTC under visible light irradiation towards toxic NOx gas degradation (~100 ppm) and, simultaneously, investigating the influence of ACAC content on its performance has not been reported, yet.

2. Results

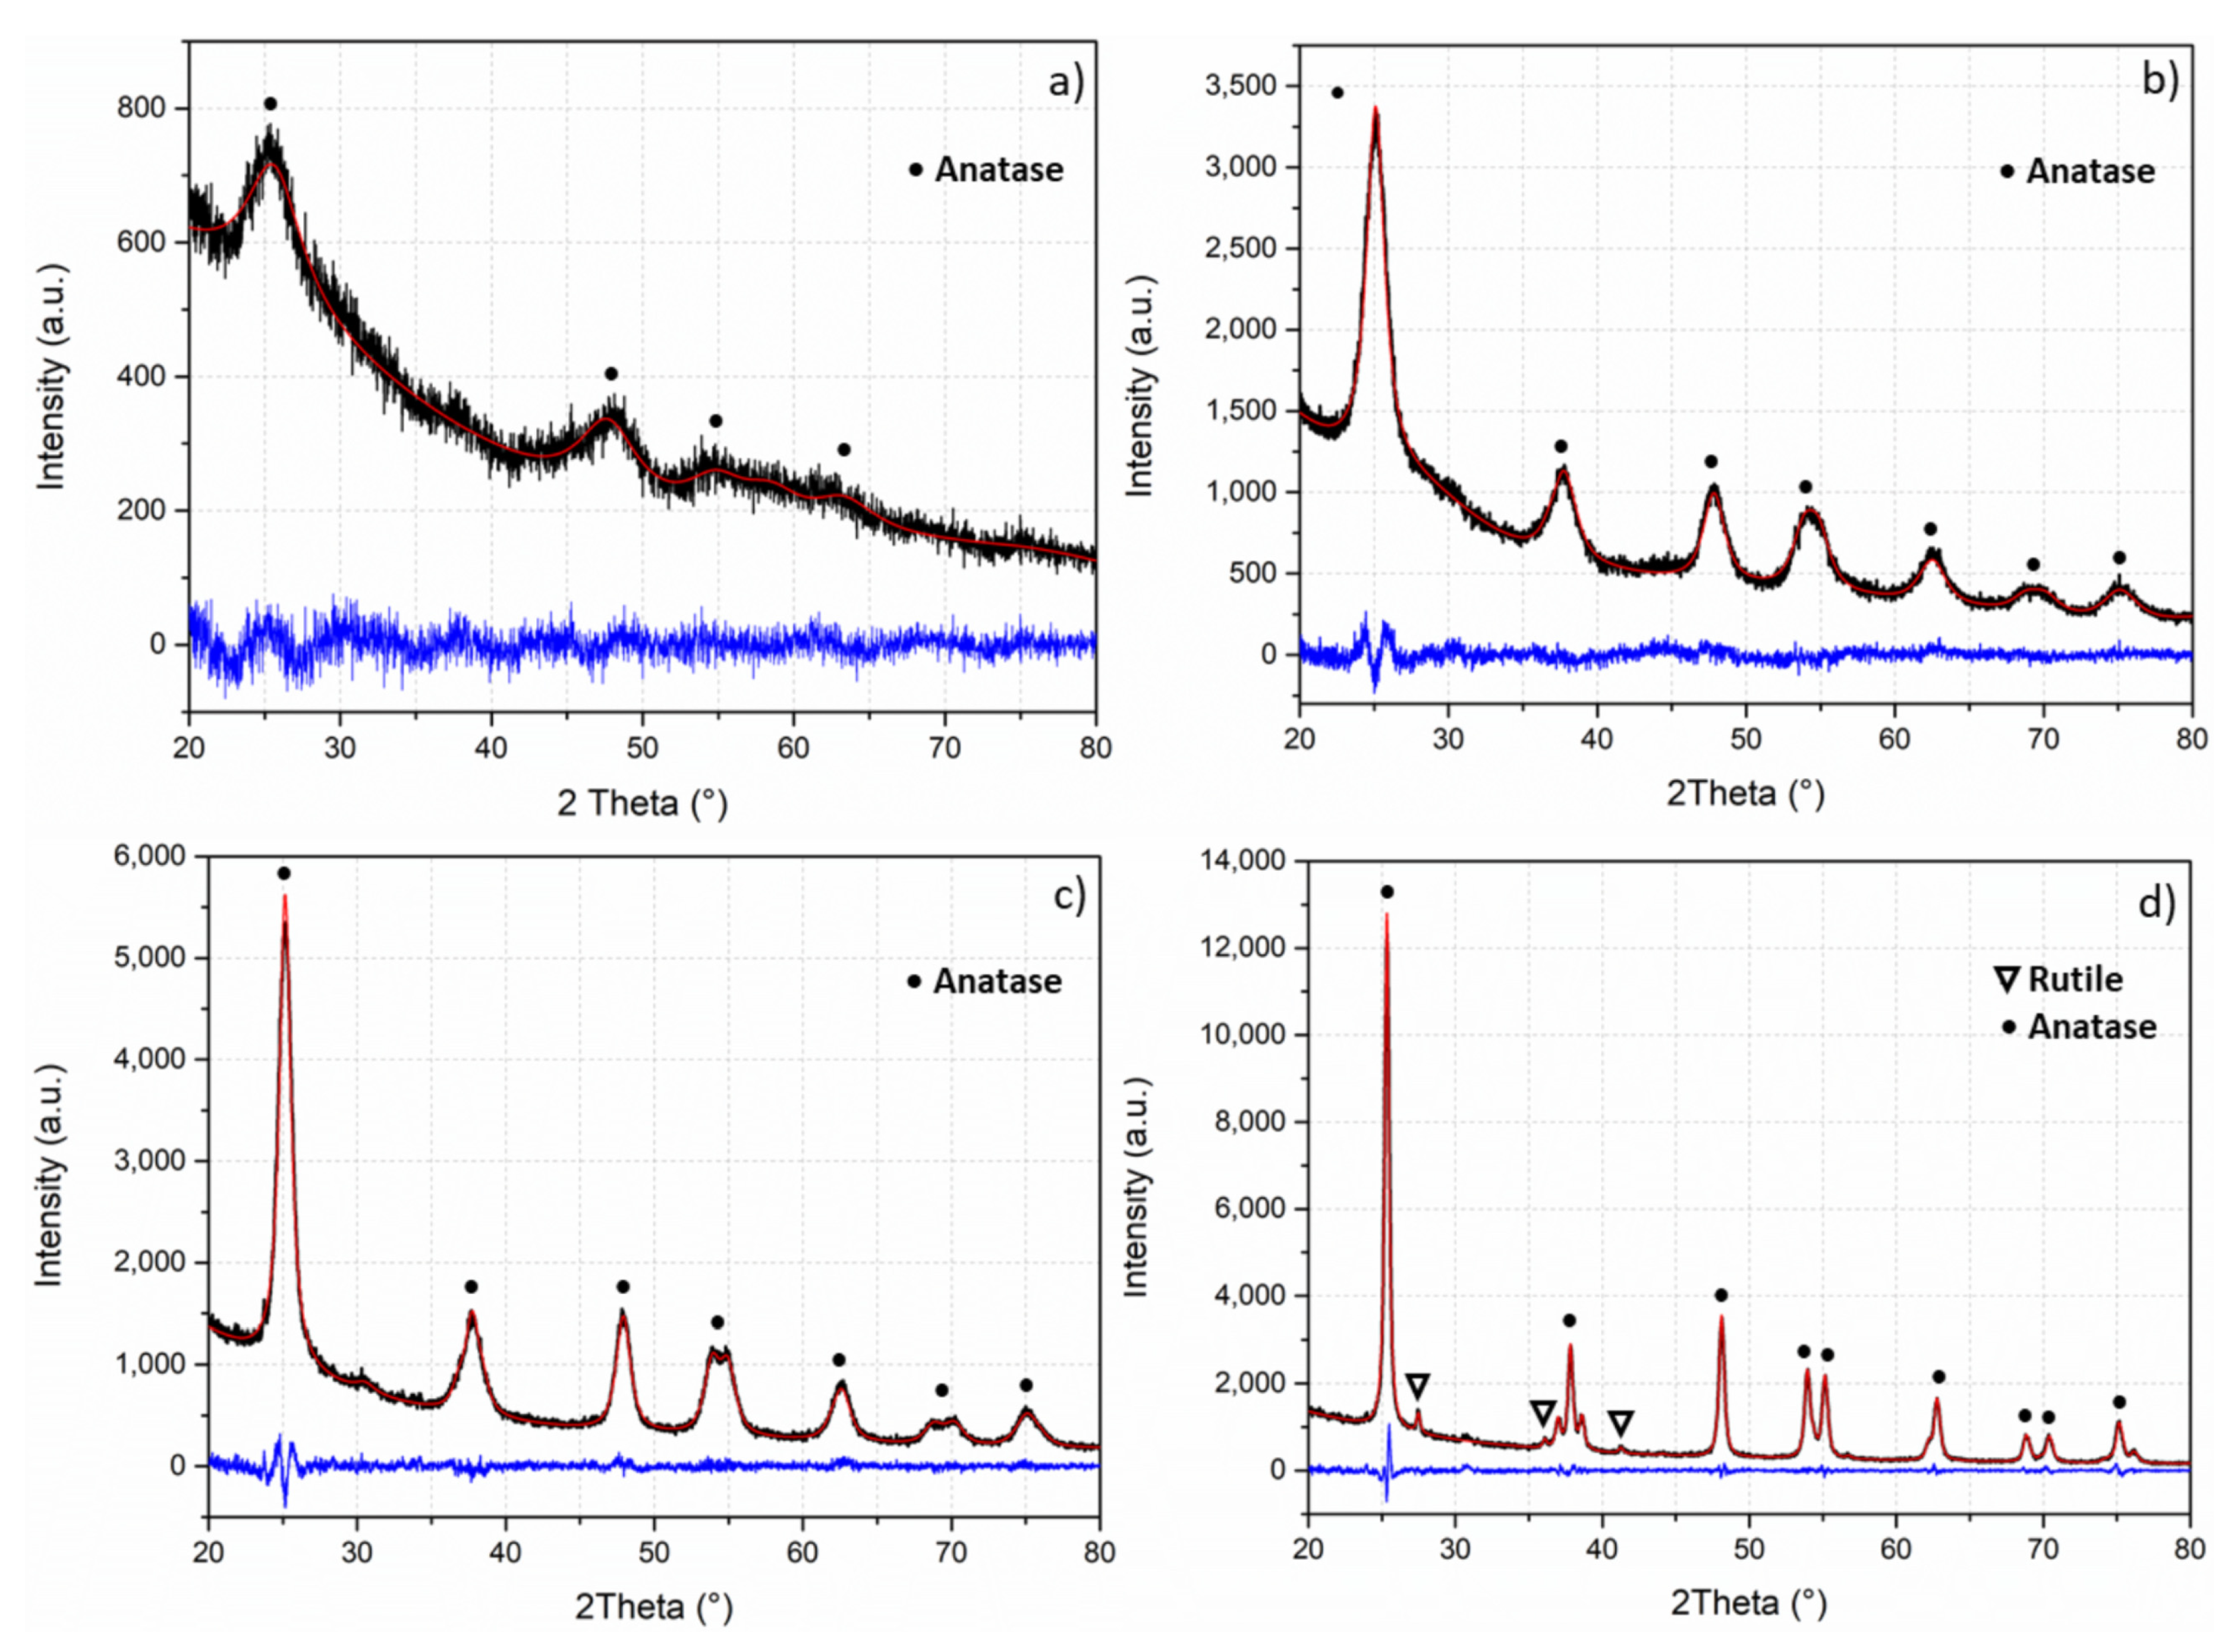
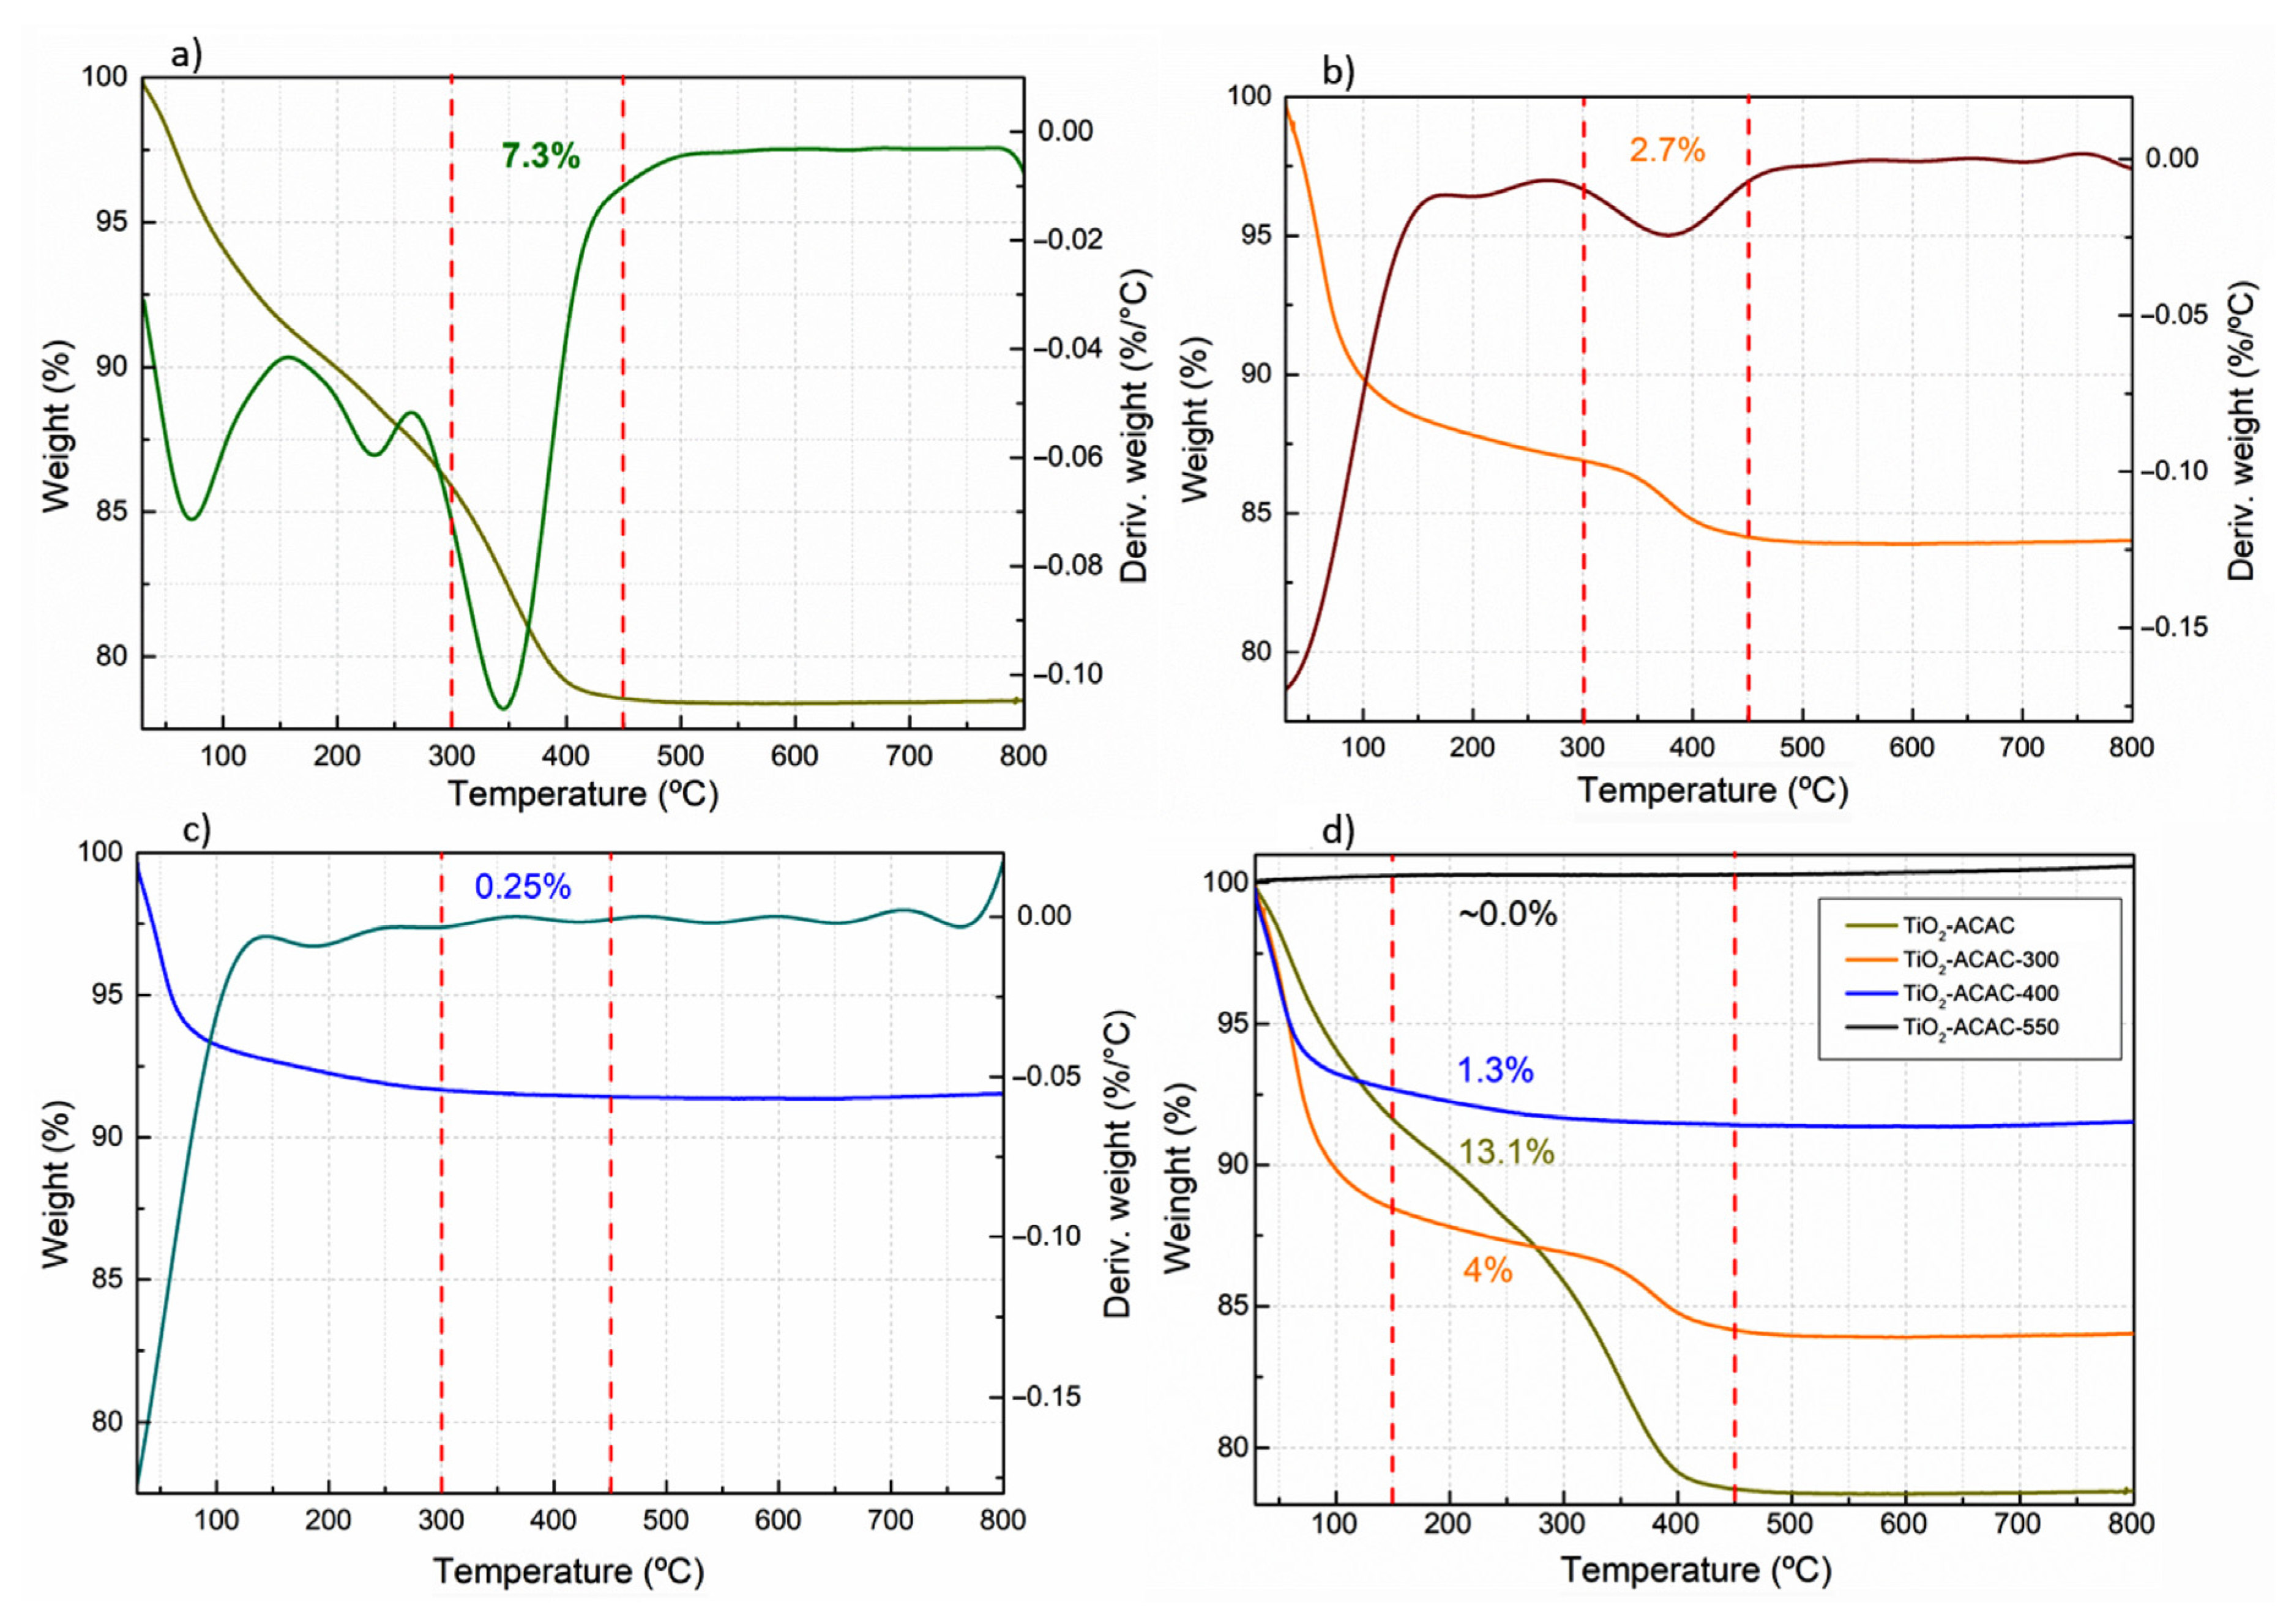
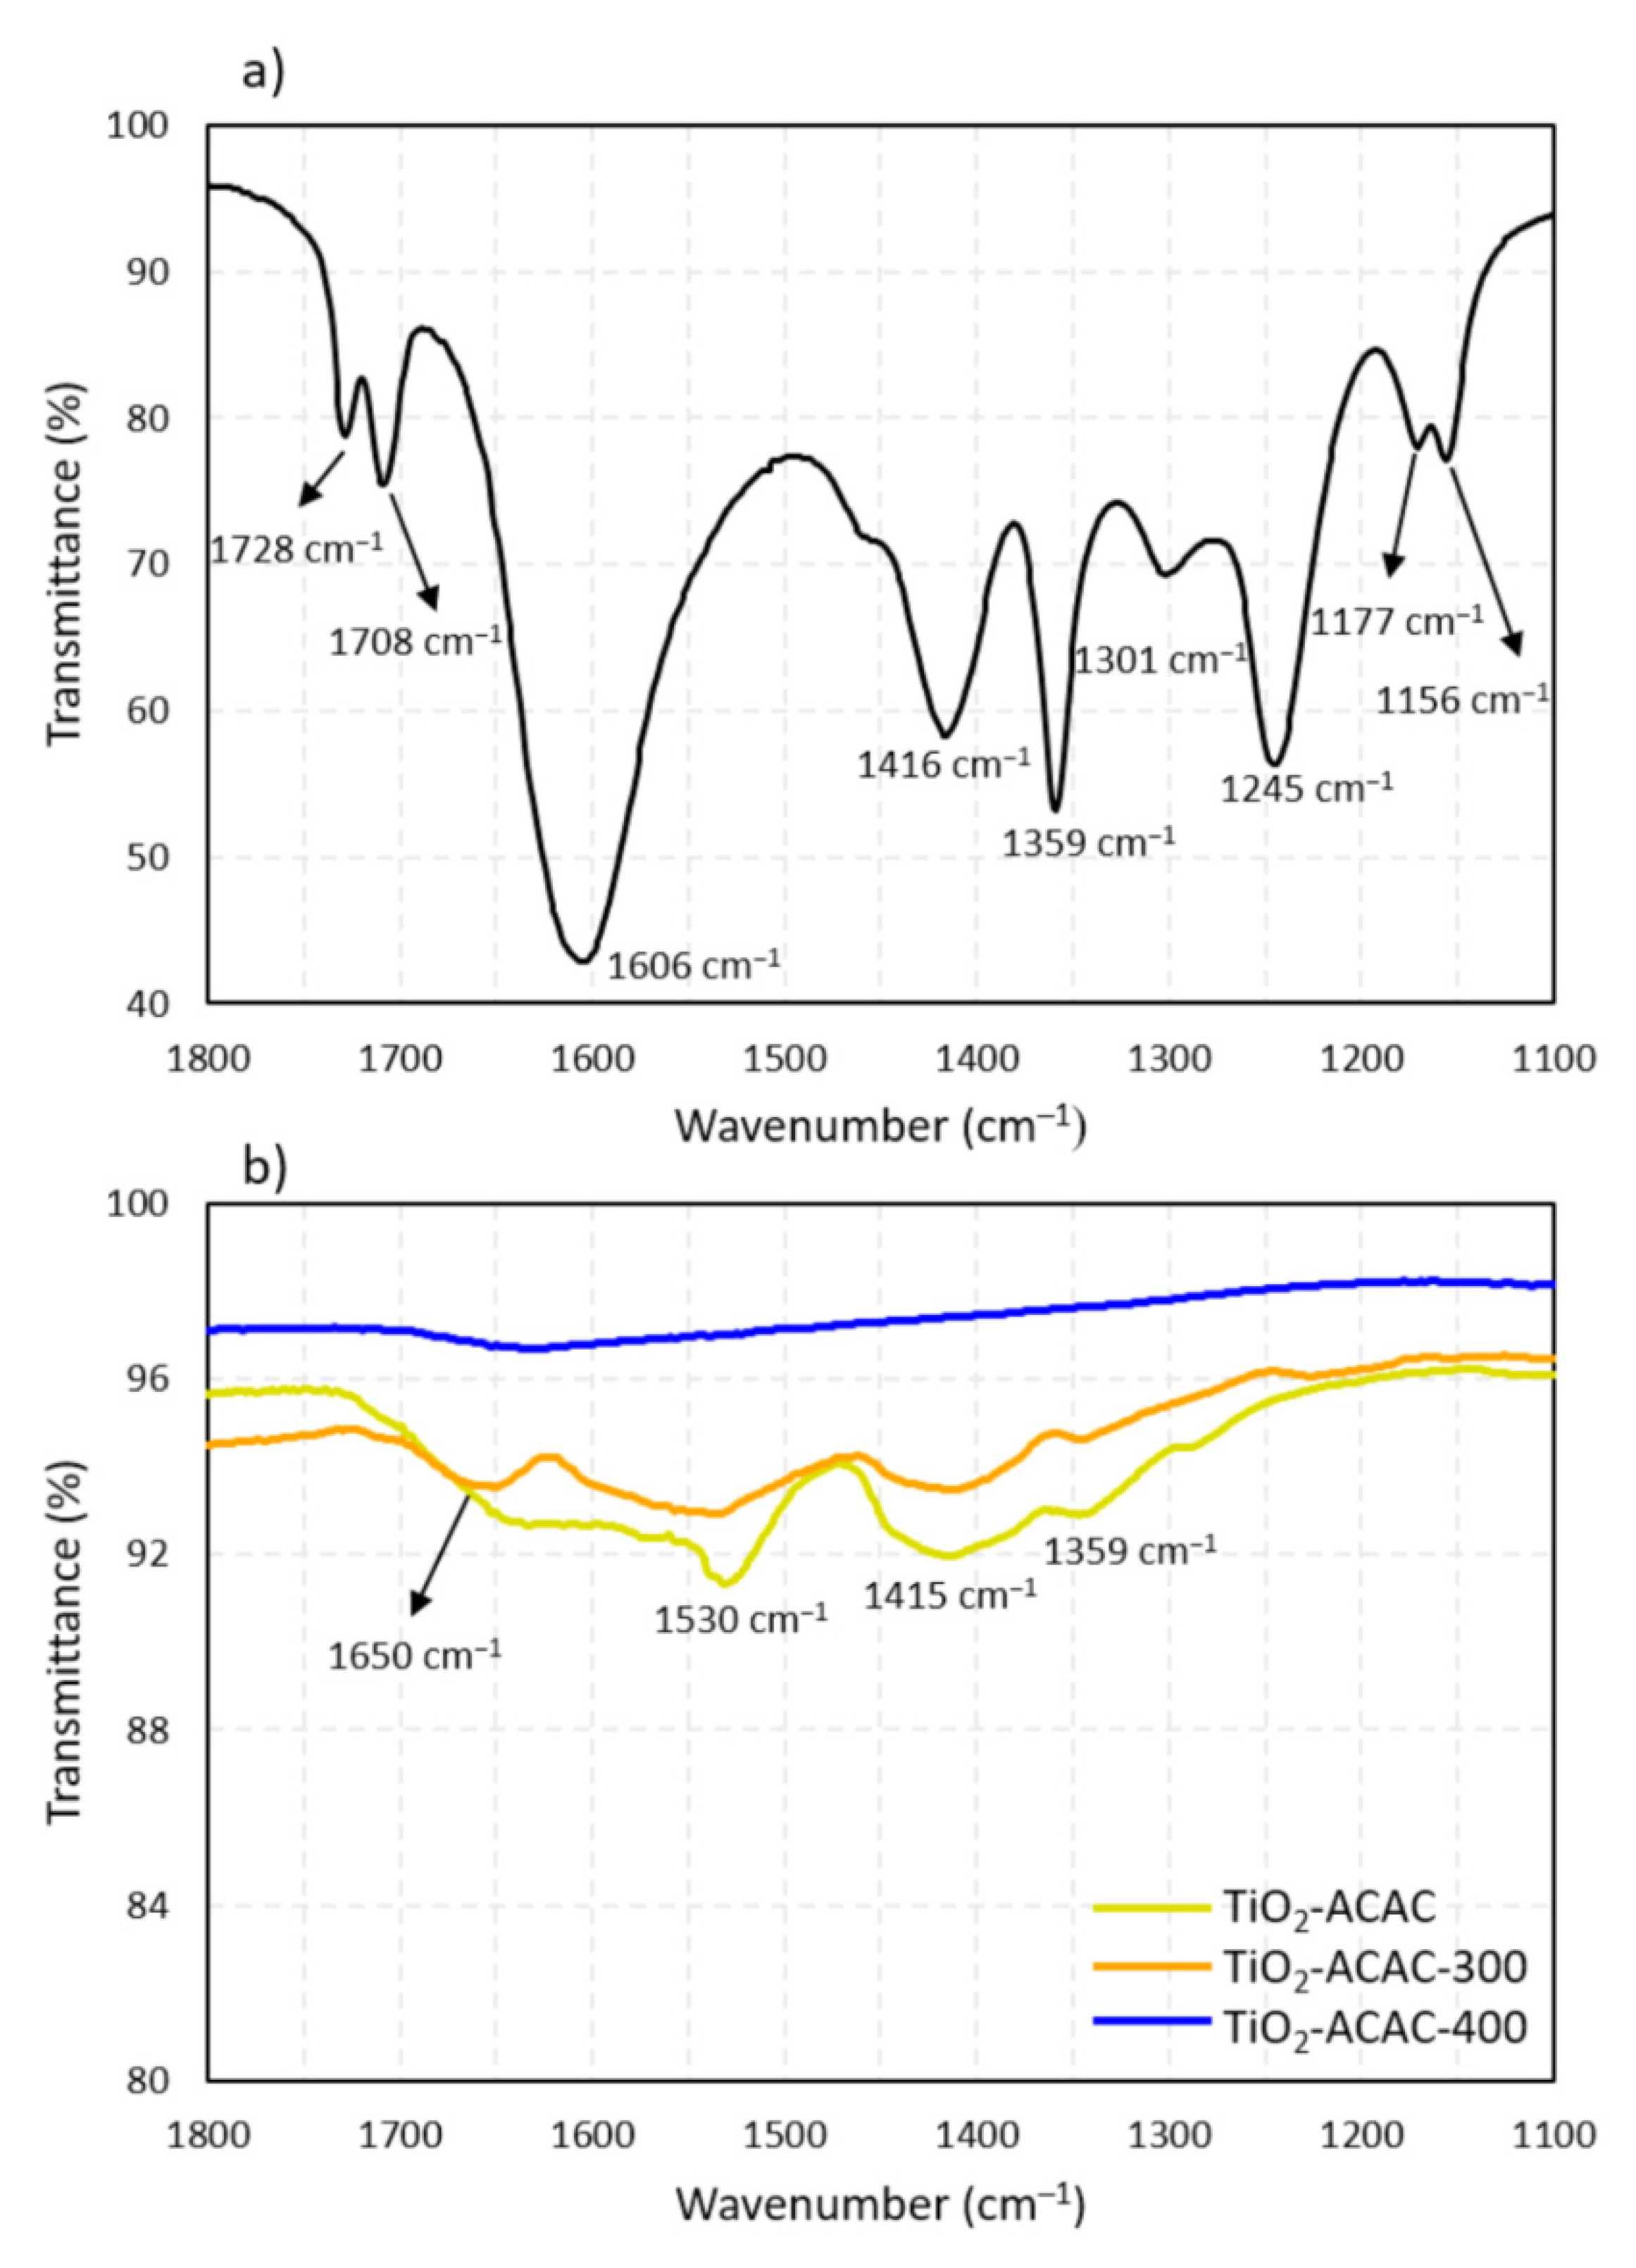
2.1. Characterization of Anatase-ACAC Coupling

X-ray powder diffraction (XRPD) patterns of TiO2-ACAC, TiO2-ACAC-300, TiO2-ACAC-400 and TiO2-ACAC-550 are presented in Figure 1 and demonstrate that all samples are crystalline. As previously reported by Habran et al. [15] anatase xerogel (mean crystallite size of ~2.5 nm, as calculated by Le Bail method) has been formed through the sol-gel route followed by drying at 100 °C, without the need for additional calcination to crystallize xerogel [21]. On the other hand, Sannino et al. [8,14] synthesized TiO2-ACAC xerogel in amorphous state. Nevertheless, it should be noted that the sol-gel procedure carried out by these authors [8,14] was different from the one performed in this work and in some previous studies [15,21]. Scolan and Sanchez [21] pointed out that [ACAC]/[Ti] ratio influenced the TiO2 xerogel crystal structure and suggested that over the [ACAC]/[Ti] = 1 to 4, it appears in anatase crystalline form (here we used [ACAC]/[Ti] = 2). Calcination at 300 °C and 400 °C led to the increase of mean crystallite size of anatase to 6.6 nm and 10.5 nm, respectively, while at 550 °C mean crystallite size of anatase increased to 33 nm, as calculated by Le Bail method. In addition, after the calcination at 550 °C, few rutile diffraction lines appeared (Figure 1d) as a consequence of the expected phase transformation from anatase (metastable phase) to rutile (thermodynamically stable phase). The temperatures > 550 °C lead to unwanted predominance of rutile, a TiO2 polymorph with lower photocatalytic performance, and, therefore, were not studied afterwards.
The thermogravimetric (TGA) analyses (Figure 2) evidenced a decrease of ACAC content in the samples with the rise of calcination temperature. TGA curve of TiO2-ACAC xerogel and its first derivative (DTG) showed three stages of mass loss (Figure 2a). The first one, due to the water loss, finished at ~150 °C (water loss up to ~150 °C was observed also for TiO2-ACAC-300 and TiO2-ACAC-400, Figure 2b,c). The second and third events, observed for TiO2-ACAC and partially for TiO2-ACAC-300, are ascribed to two stage ACAC loss due to different interactions of ACAC molecules with the inorganic substrate (i.e., surface of TiO2 nanoparticles) [15,21], as discussed ahead. In addition, it is possible to attribute a portion of the weight loss in the second event to dehydroxylation process from the TiO2 surface [22,23]. The DTG peaks of these two events are situated at 240 °C and 345 °C for TiO2-ACAC (Figure 2a). The higher-temperature peak at 345 °C is more intense and contributed more (7.3 wt.% loss above 300 °C) to the total weight loss above 150 °C (calculated at 13.1 wt.%). In accordance to Scolan and Sanchez [21], these two events, situated at 240 °C and 345 °C, are attributed to release, followed by combustion, of ACAC adsorbed and bounded, respectively, onto nanocrystalline TiO2 surface.
The ACAC-300 (Figure 2b) showed a much lower overall weight loss above 150 °C (4 wt.%) and only the DTG peak at higher temperatures, centered at 375 °C, is clearly present (contributing with 2.7 wt.% to the weight loss above 300 °C).
The absence of the lower-temperature peak (at ~240 °C) suggested that the adsorbed ACAC was removed during the calcination at 300 °C (Figure 2b). Notestein et al. [24] also identified weight loss above 300 °C for calixarene-TiO2 CTC and ascribed it to the release of calixarene bonded onto TiO2. After the calcination at 400 °C (TiO2-ACAC-400), the overall weight loss above 150 °C was as low as 1.3 wt.% and only ~0.25 wt.% was lost above 300 °C (Figure 2c), while for TiO2-ACAC-550 weight loss was zero along the whole investigated temperature range (Figure 2d).
The Fourier transform infrared (FTIR) spectrum of pure ACAC, Figure 3a and Supplementary Figure S1, is in accordance with literature [25]. In Table 1 are summarized the vibration bands for pure ACAC as well as bands encountered for TiO2-ACAC and TiO2-ACAC-300.
The bands located at 1728 and 1708 cm−1 are assigned to ketonic carbonyl group in pure ACAC, corresponding to C=O vibration of asymmetric and symmetric stretching modes, respectively. The strong band centered at 1606 cm−1 is attributed to the keto-enolic tautomerization due to two following structures: ν(HO–C=C–C=O) and ν(COC=C–OH). The right-wing asymmetry of the band situated at 1606 cm−1 is due to enol band vibration of (C=C), located at ~1530 cm−1 [21].
The bonding of acetylacetone to TiO2 should have occurred through the carbonyl functional groups in ketonic and enolic forms (Scheme 1), likewise in dopamine-TiO2 CTC where this interaction occurs through two phenolic groups [18]. A proof of such bonding is the disappearance of the carbonyl group bands (situated originally at 1728 and 1708 cm−1) as observed in the spectra of TiO2-ACAC and TiO2-ACAC-300 (Figure 3b and Supplementary Figure S2), in accordance to the previously reported [21]. The bands located at 1416 and 1359 cm−1 are attributed to methyl asymmetric and symmetric bending. The band at 1301 cm−1 is attributed to the ACAC chain breath ν(C….C….C)s [25,26,27]. In addition, Vukoje et al. [28] reported a strong intensity reduction of C-O stretching band at 1304 cm−1 of phenolic group, indicated coupling of lauryl gallate to the surface Ti atoms from anatase nanoparticles.
On the other hand, the bands situated at 1650 cm−1 and 1530 cm−1, observed both in TiO2-ACAC and TiO2-ACAC-300 spectra (Figure 3b), are associated to the chemical interactions (dipole and covalent, respectively) of ACAC with Ti4+ (Table 1 and Scheme 1) [26,29]. This is very relevant for understanding of the nature of TiO2 to ACAC interactions after drying and calcination. These bands, appeared in TiO2-ACAC spectrum with low intensities, and with even lower intensity in TiO2-ACAC-300 spectrum (Figure 3b). The reduction of intensities of these two bands on FTIR spectra of TiO2-ACAC to TiO2-ACAC-300 is due to the decrease of carbon content, i.e., ACAC, from 3.5 m/m% in TiO2-ACAC to 0.85 m/m% in TiO2-ACAC-300, as measured by CHN analysis. The spectrum of TiO2-ACAC-400 is featureless in the spectral range from 1800 to 1100 cm−1, evidencing absence of ACAC, in accordance to TGA (Figure 2c) and to CHN data, that reported only 0.15 m/m% of carbon in this sample and corroborating literature findings evidencing zero ACAC content after calcination at 400 °C [8]. As expected, in the spectral range from 1800 to 1100 cm−1, TiO2-ACAC-550 spectra is featureless (not showed).
The adsorption–desorption curves of N2 measured for TiO2-ACAC, TiO2-ACAC-300 and TiO2-ACAC-400 showed rather different features (Supplementary Figure S3). TiO2-ACAC show a type I isotherm curve, typical for a microporous material, exhibiting high specific surface area (Table 2). It should be also noted that its mesoporous volume is approximately the half of that calculated for TiO2-ACAC-300, which presented a type IV isotherm with hysteresis at higher partial pressure range (Table 2). It is also worth noting that TiO2-ACAC and TiO2-ACAC-300 present practically the same specific surface area of ~130 m2 g−1 (Table 2). This is an important feature that discards specific surface area as a factor that contributes to different photocatalytic activities of TiO2-ACAC and TiO2-ACAC-300 towards NOx degradation, as demonstrated ahead. On the other hand, TiO2-ACAC-400 possesses much lower specific surface area (Table 2), an indication of crystal growth, accompanied by significant mesoporous volume reduction.
The X-ray photoelectron spectroscopy (XPS) analyses of TiO2-ACAC-300, TiO2-ACAC-400 and TiO2-ACAC-550 (Supplementary Figures S4–S6) do not support presence of Ti3+ in the calcined material, differently from Aronne et al. [8] who identified more than 20% of Ti ions in Ti3+ state after calcination in air at 400 °C for 1 h. Only the TiO2-ACAC spectrum (Supplementary Figure S4) presented Ti3+ peak, with [Ti3+]/[Ti4+] = 1.05. Both TiO2-ACAC-300 and TiO2-ACAC-400 samples presented practically the same content of oxygen belonging to surface hydroxide ions, localized at the binding energies close to 532.5 eV [30] together with the lattice oxygen with peak centered at ~530 eV (Supplementary Figure S6). The three calcined samples presented XPS peaks related to carbon 1s spectra (Supplementary Figure S5) attributed to C=O, C−O and C−C at approximately 288.6 eV, 286.3 and 284.7 eV, respectively. The non-calcined sample, TiO2-ACAC, presented an extra peak located at ~283 eV, ascribed to C–Ti interaction [31]. This band is not observed in the calcined samples (TiO2-ACAC-300, TiO2-ACAC-400 and TiO2-ACAC-550).

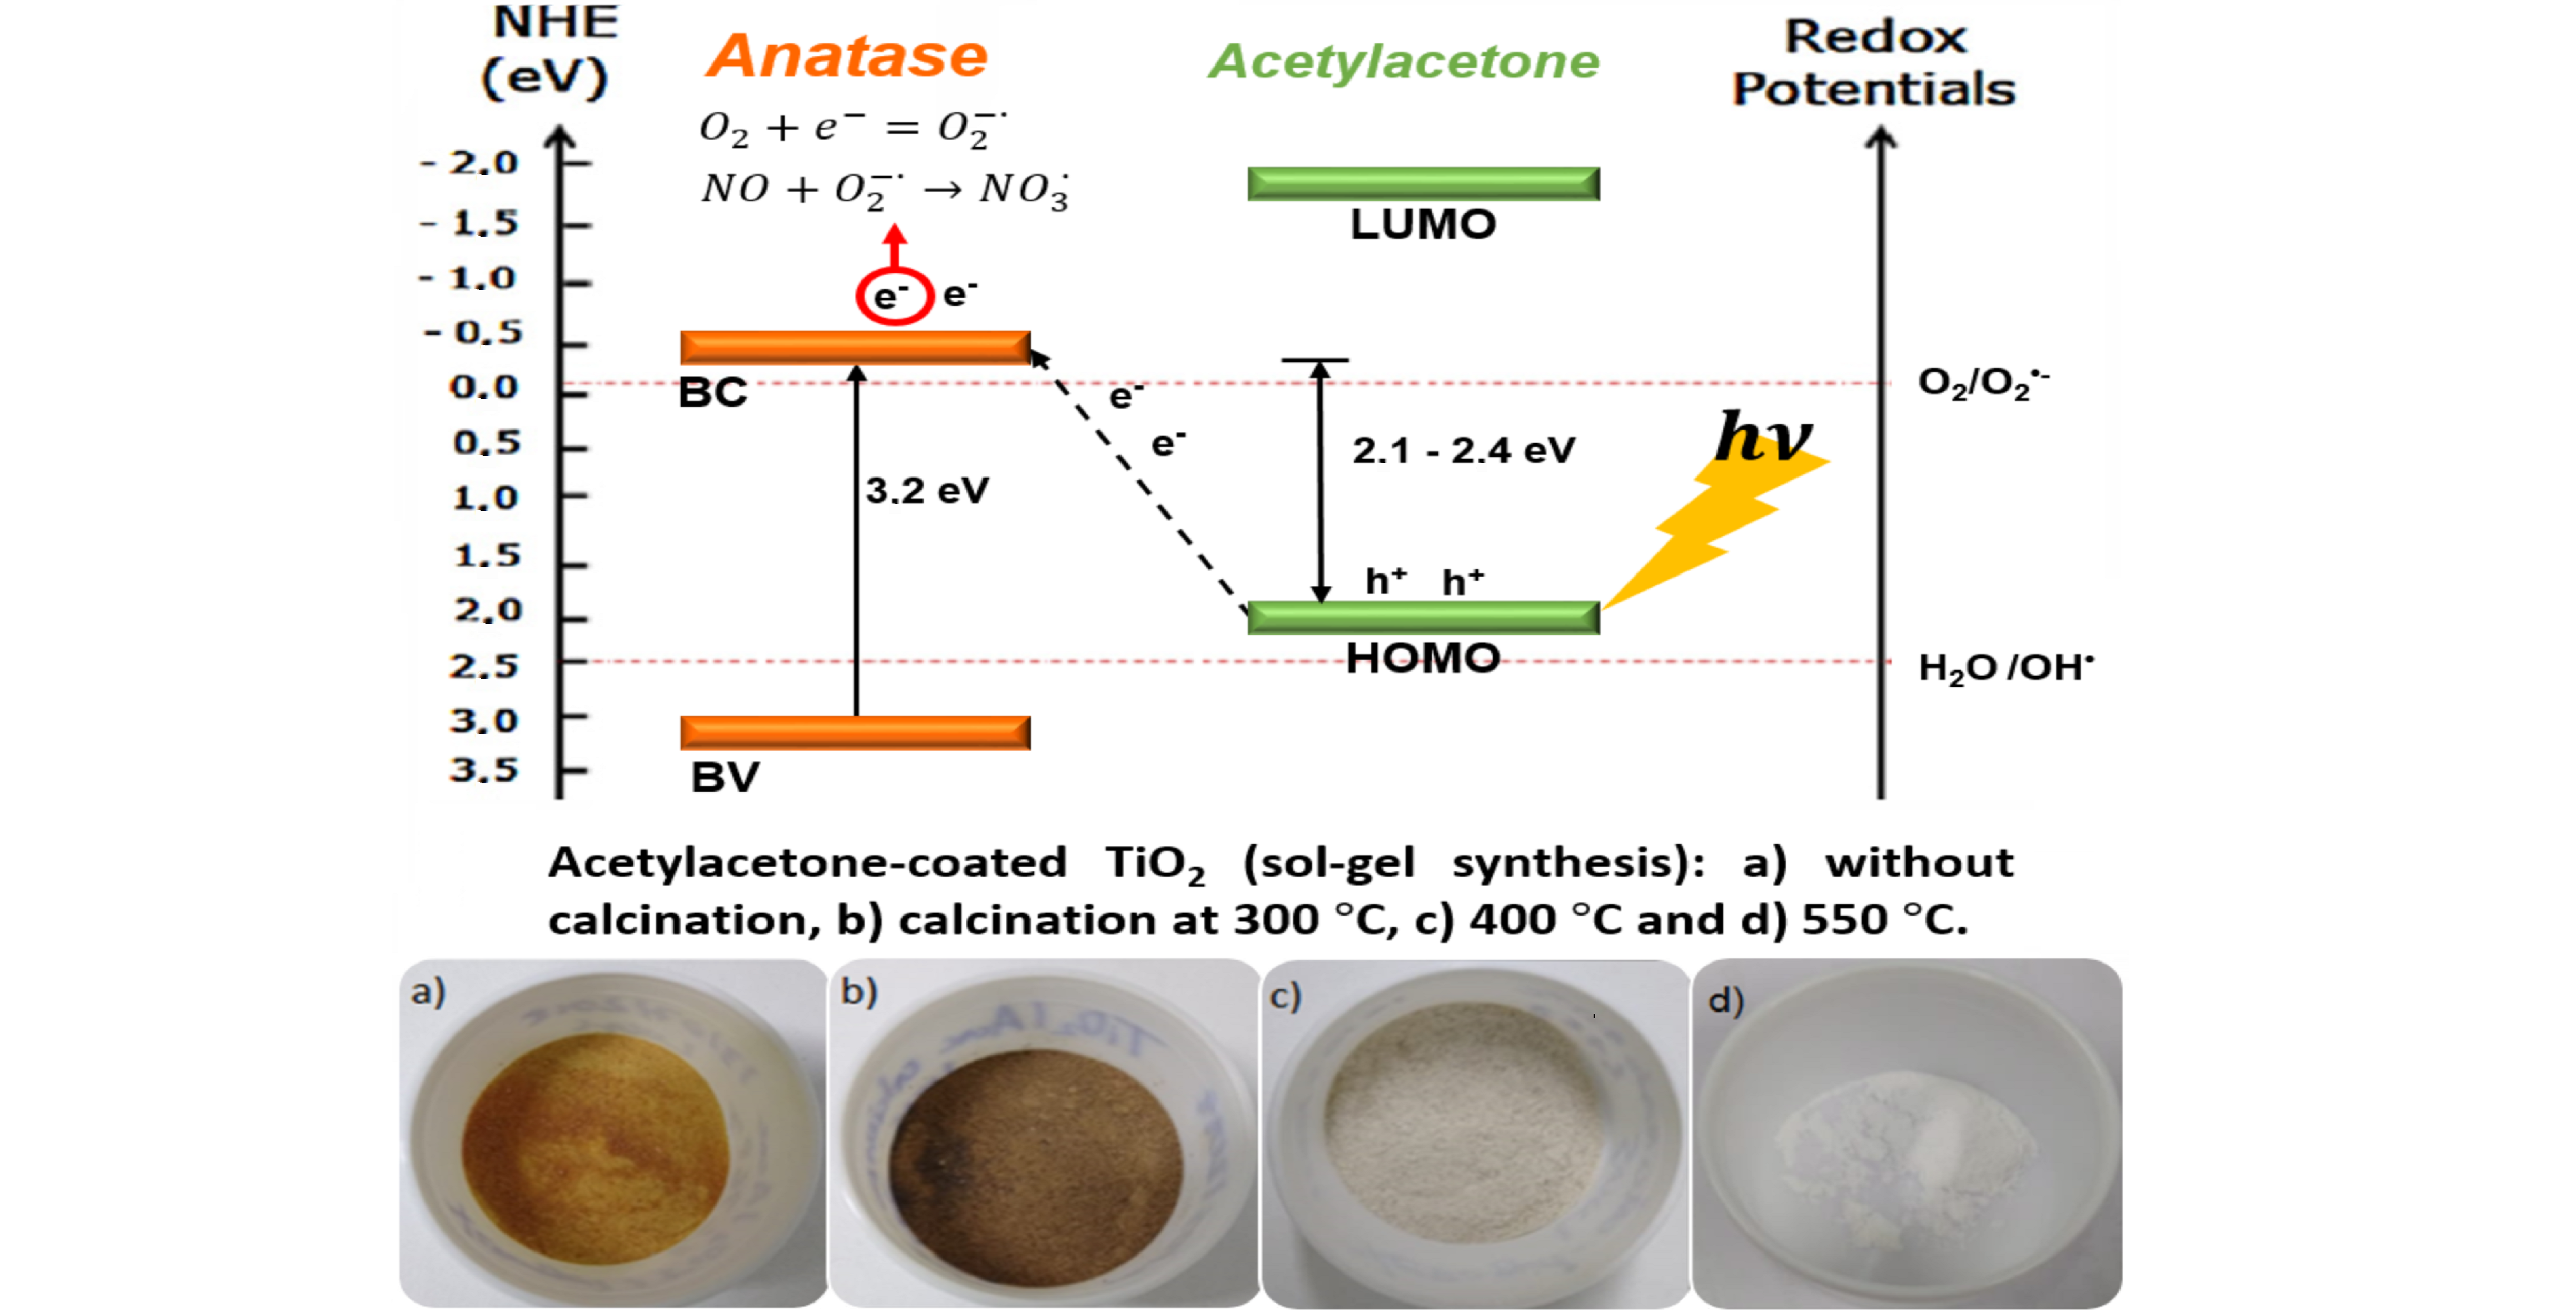
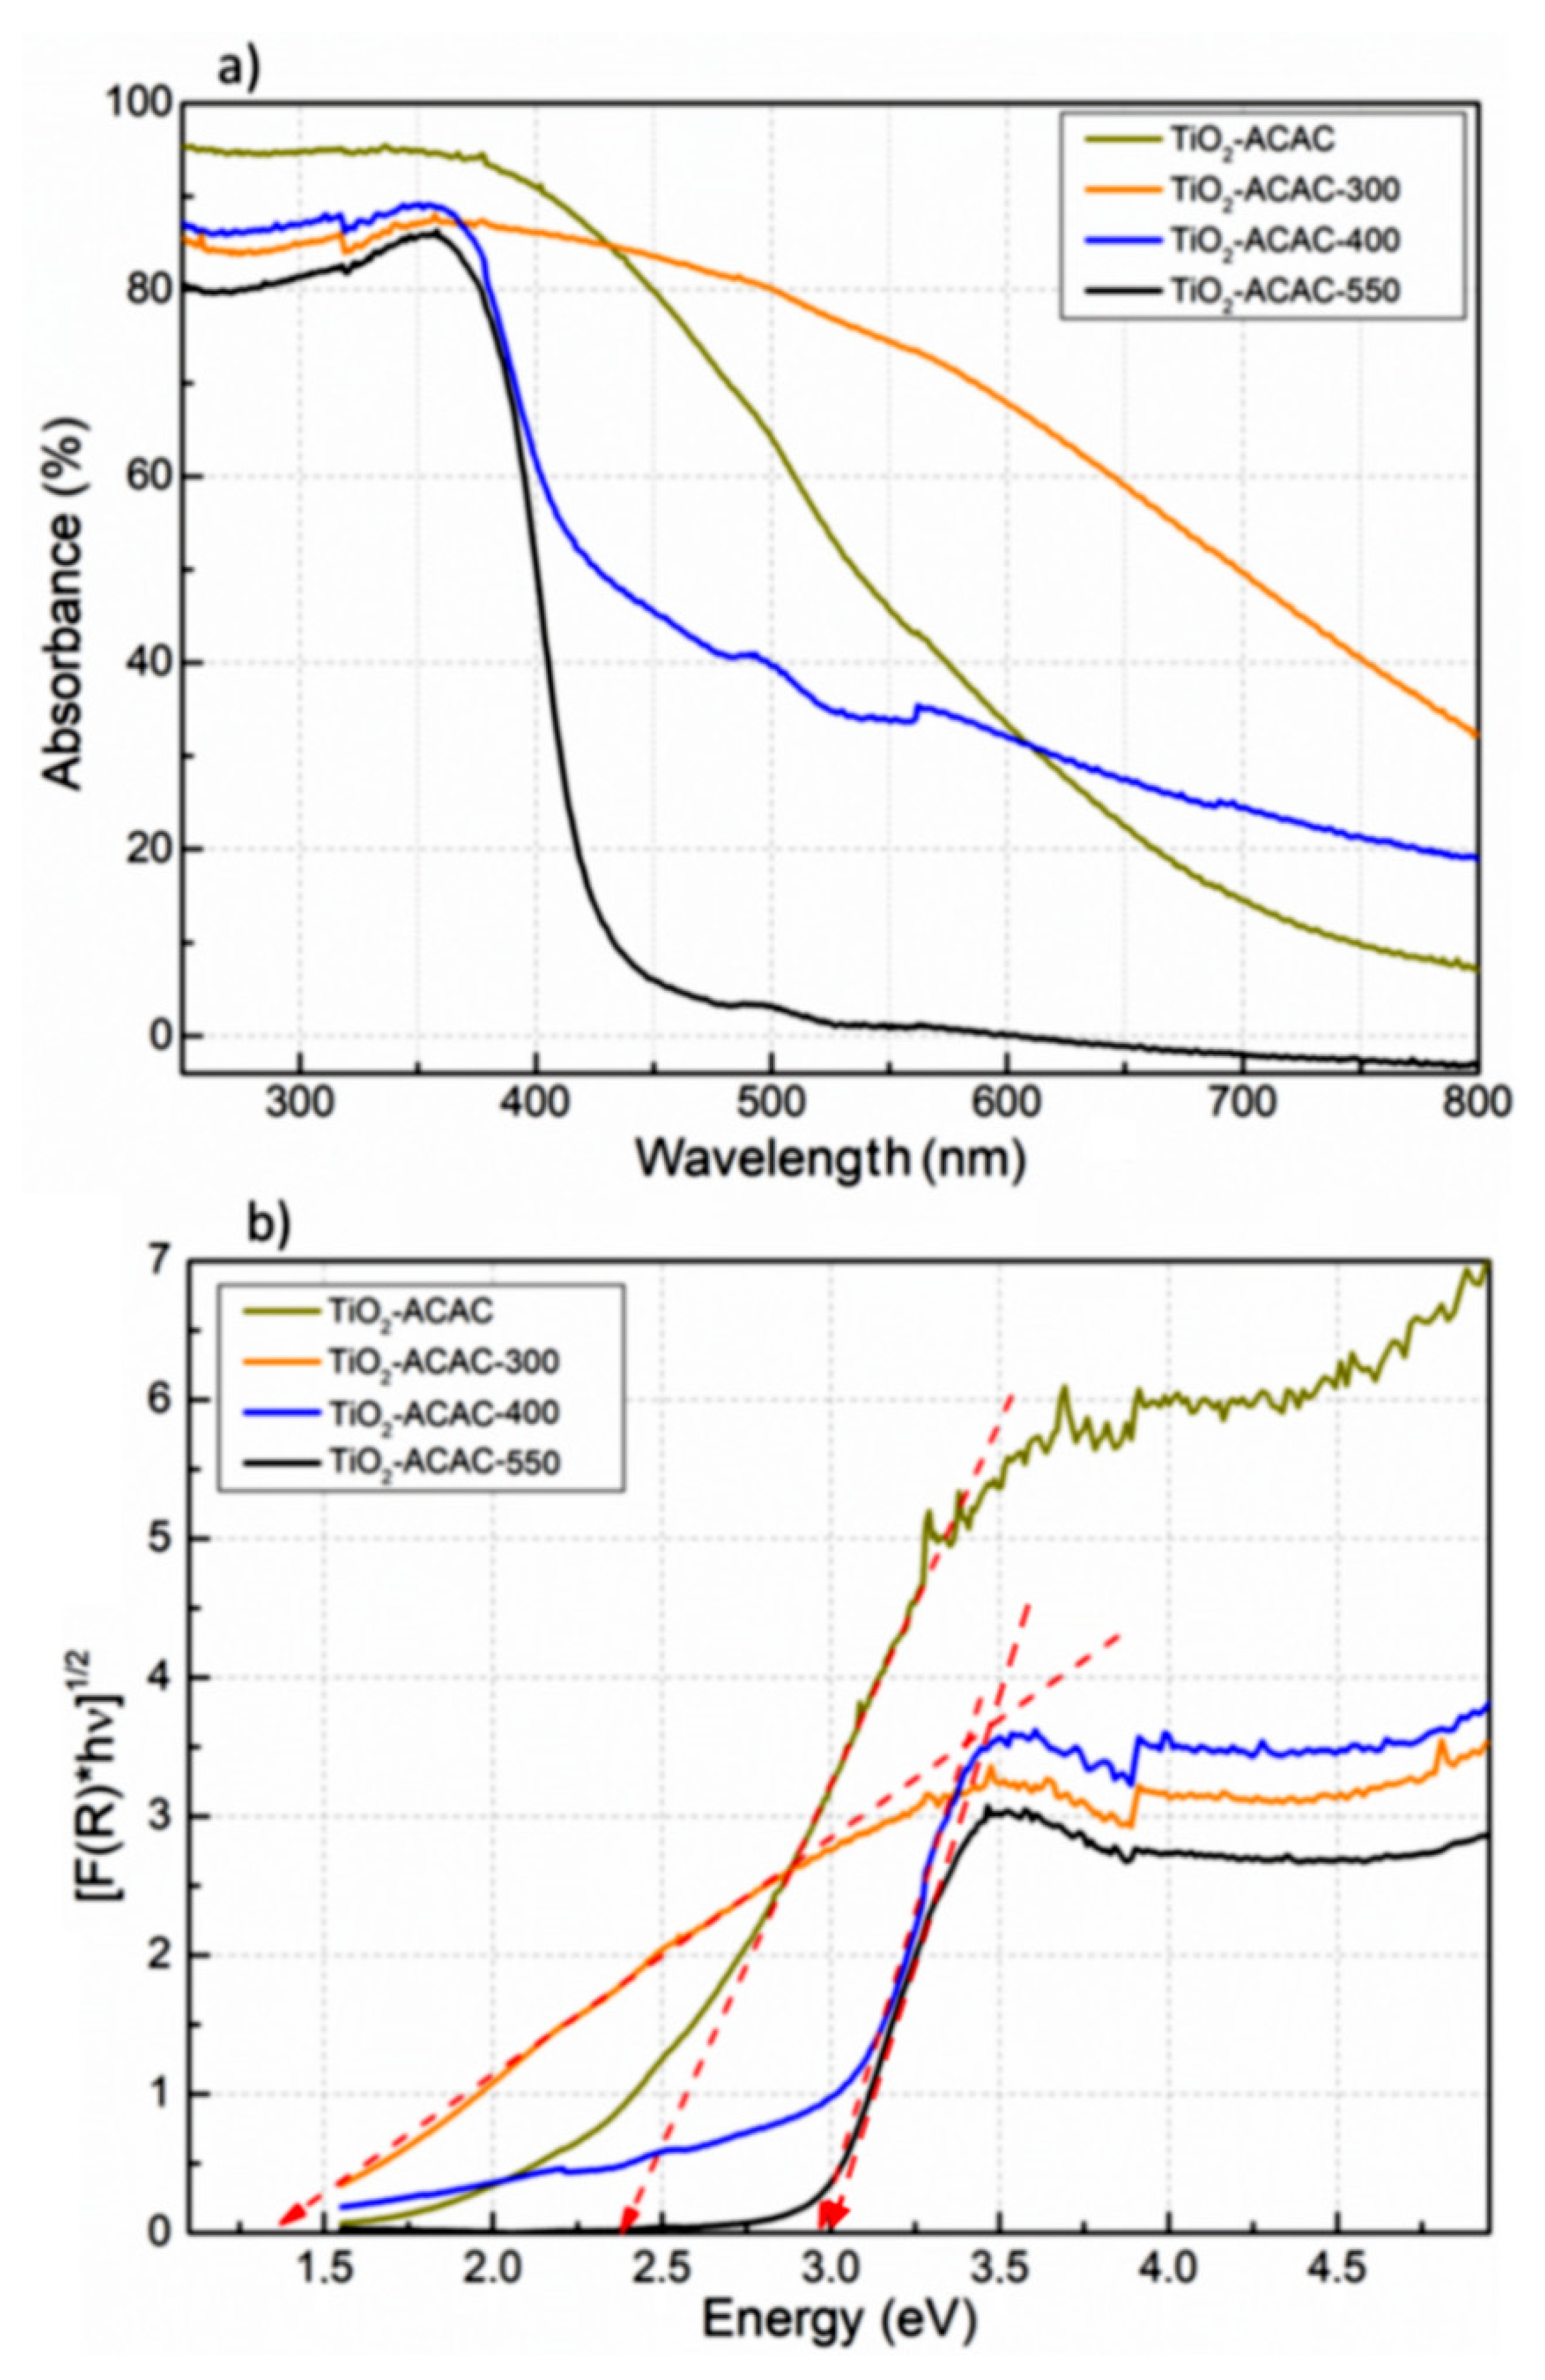
2.2. Optical Properties of TiO2-Acetylacetone Charge Transfer Complexes

The diffuse reflectance spectroscopy (DRS) spectra of TiO2-ACAC, TiO2-ACAC-300, TiO2-ACAC-400 and TiO2-ACAC-550 and their respective Kubelka-Munk plots are presented in Figure 4 and the optical band-gaps are listed in Table 2. TiO2-ACAC, TiO2-ACAC-300 and TiO2-ACAC-400 are not white powders, changing their colors from red-yellowish, brown to beige, respectively. TiO2-ACAC xerogel demonstrates a large absorption tail within the visible spectral range with the band-gap of 2.4 eV, as evaluated from the Kubelka-Munk plot, similar to those reported by Sannino et al. [14], Aronne et al. [8] and Habran et al. [15] for TiO2-ACAC xerogel, prior to the calcination stage. This narrowing of anatase band-gap from ~3.2 eV to 2.4 eV is attributed to LMCT from HOMO of acetylacetone to CB of TiO2 [8,14,15]. On the other hand, TiO2-ACAC-550, a white powder composed of a mixture of anatase and rutile, demonstrated optical band-gap of 3.0 eV.
TiO2-ACAC-300 shows even higher absorption within the visible light spectrum in comparison to its precursor xerogel (TiO2-ACAC) and presented optical bang-gap of 1.4 eV, which promotes its brown color. TiO2-ACAC-400 has band-gap energy of 3.0 eV, however, differently from the TiO2-ACAC-550, it presents a wide absorption tail throughout visible spectral range, indicating deep electronic states inside the band-gap.
Figure 5 shows the photoluminescence (PL) curves for TiO2-ACAC, TiO2-ACAC-300 and TiO2-ACAC-400. The PL curve for TiO2-ACAC-550 spectra is shown in the Supplementary Figure S7. Two broad PL bands are observed for TiO2-ACAC and TiO2-ACAC-300, while only one is identified for TiO2-ACAC-400. All three materials exhibit a band centered at around 430 nm (2.88 eV), related to the emission of self-trapped excitons [32]. The second, and more intense, broad band noted for TiO2-ACAC and TiO2-ACAC-300 with the peak close to 590 nm (2.1 eV) is related to the emission of free electrons from anatase CB into HOMO of acetylacetonate [8,14,15]. This band is more intense for TiO2-ACAC-300 in comparison to TiO2-ACAC, while it is completely absent in TiO2-ACAC-400 (Figure 5) and TiO2-ACAC-550 spectra (Supplementary Figure S7).

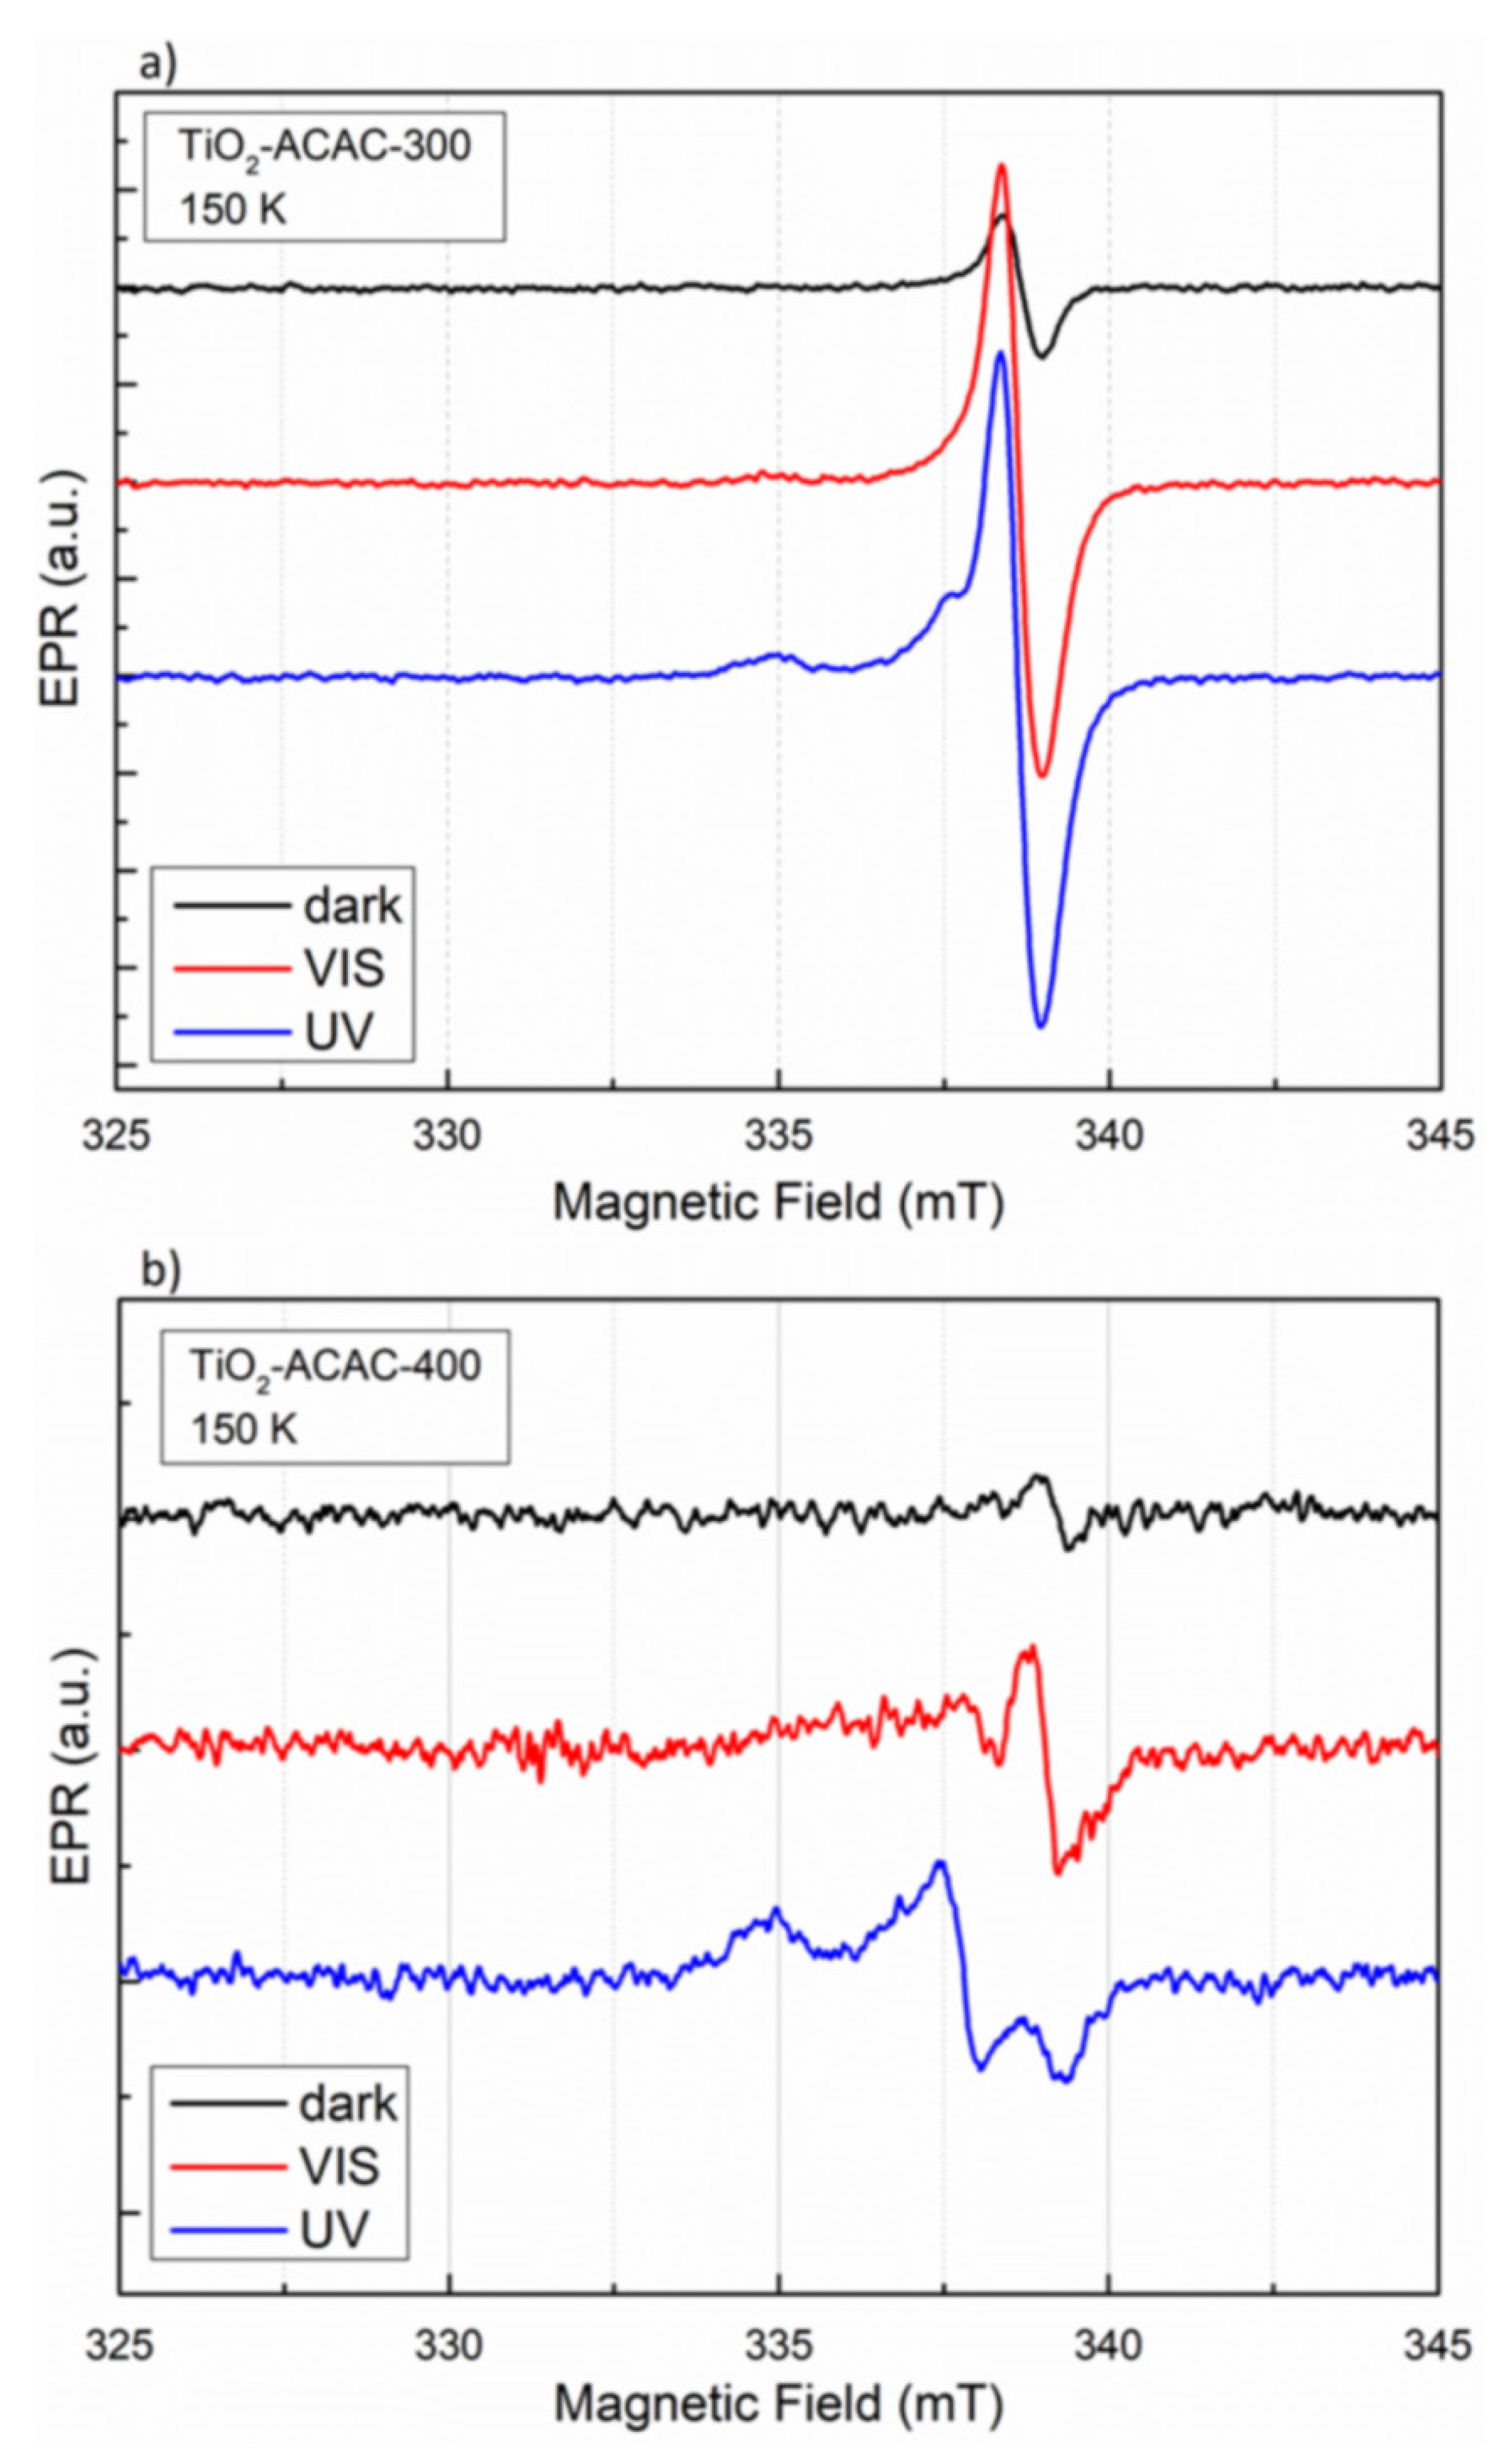
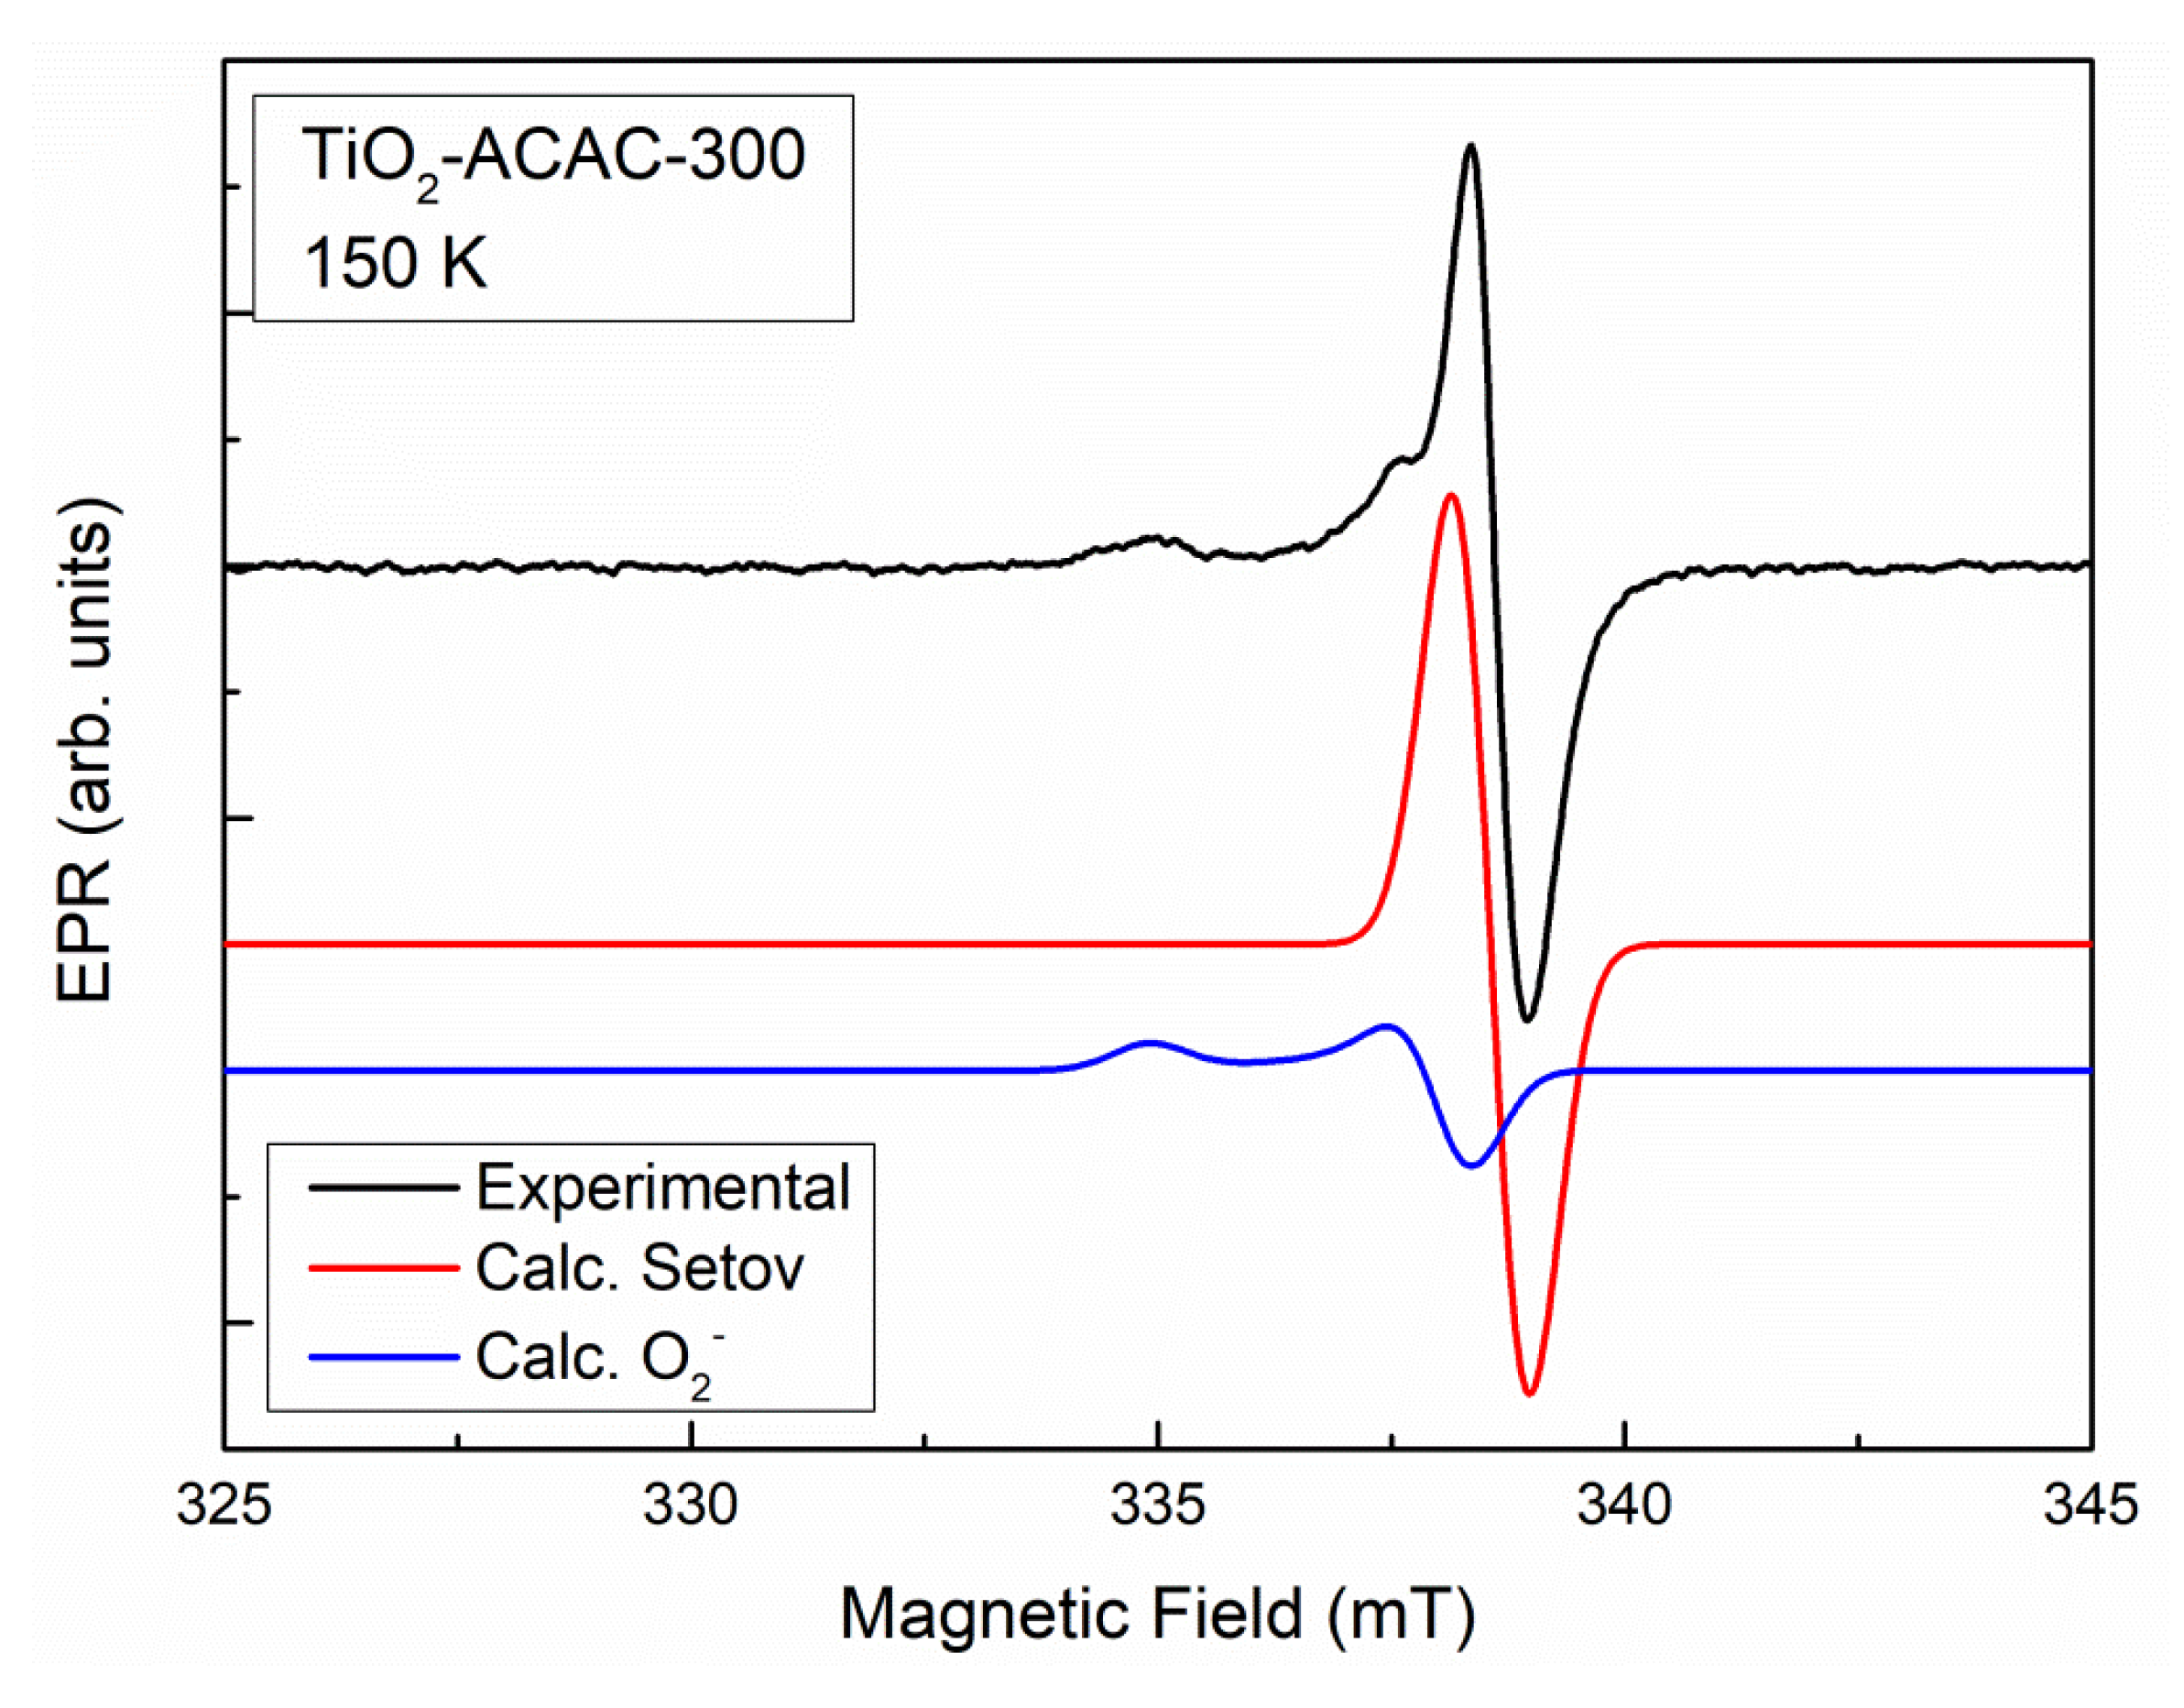
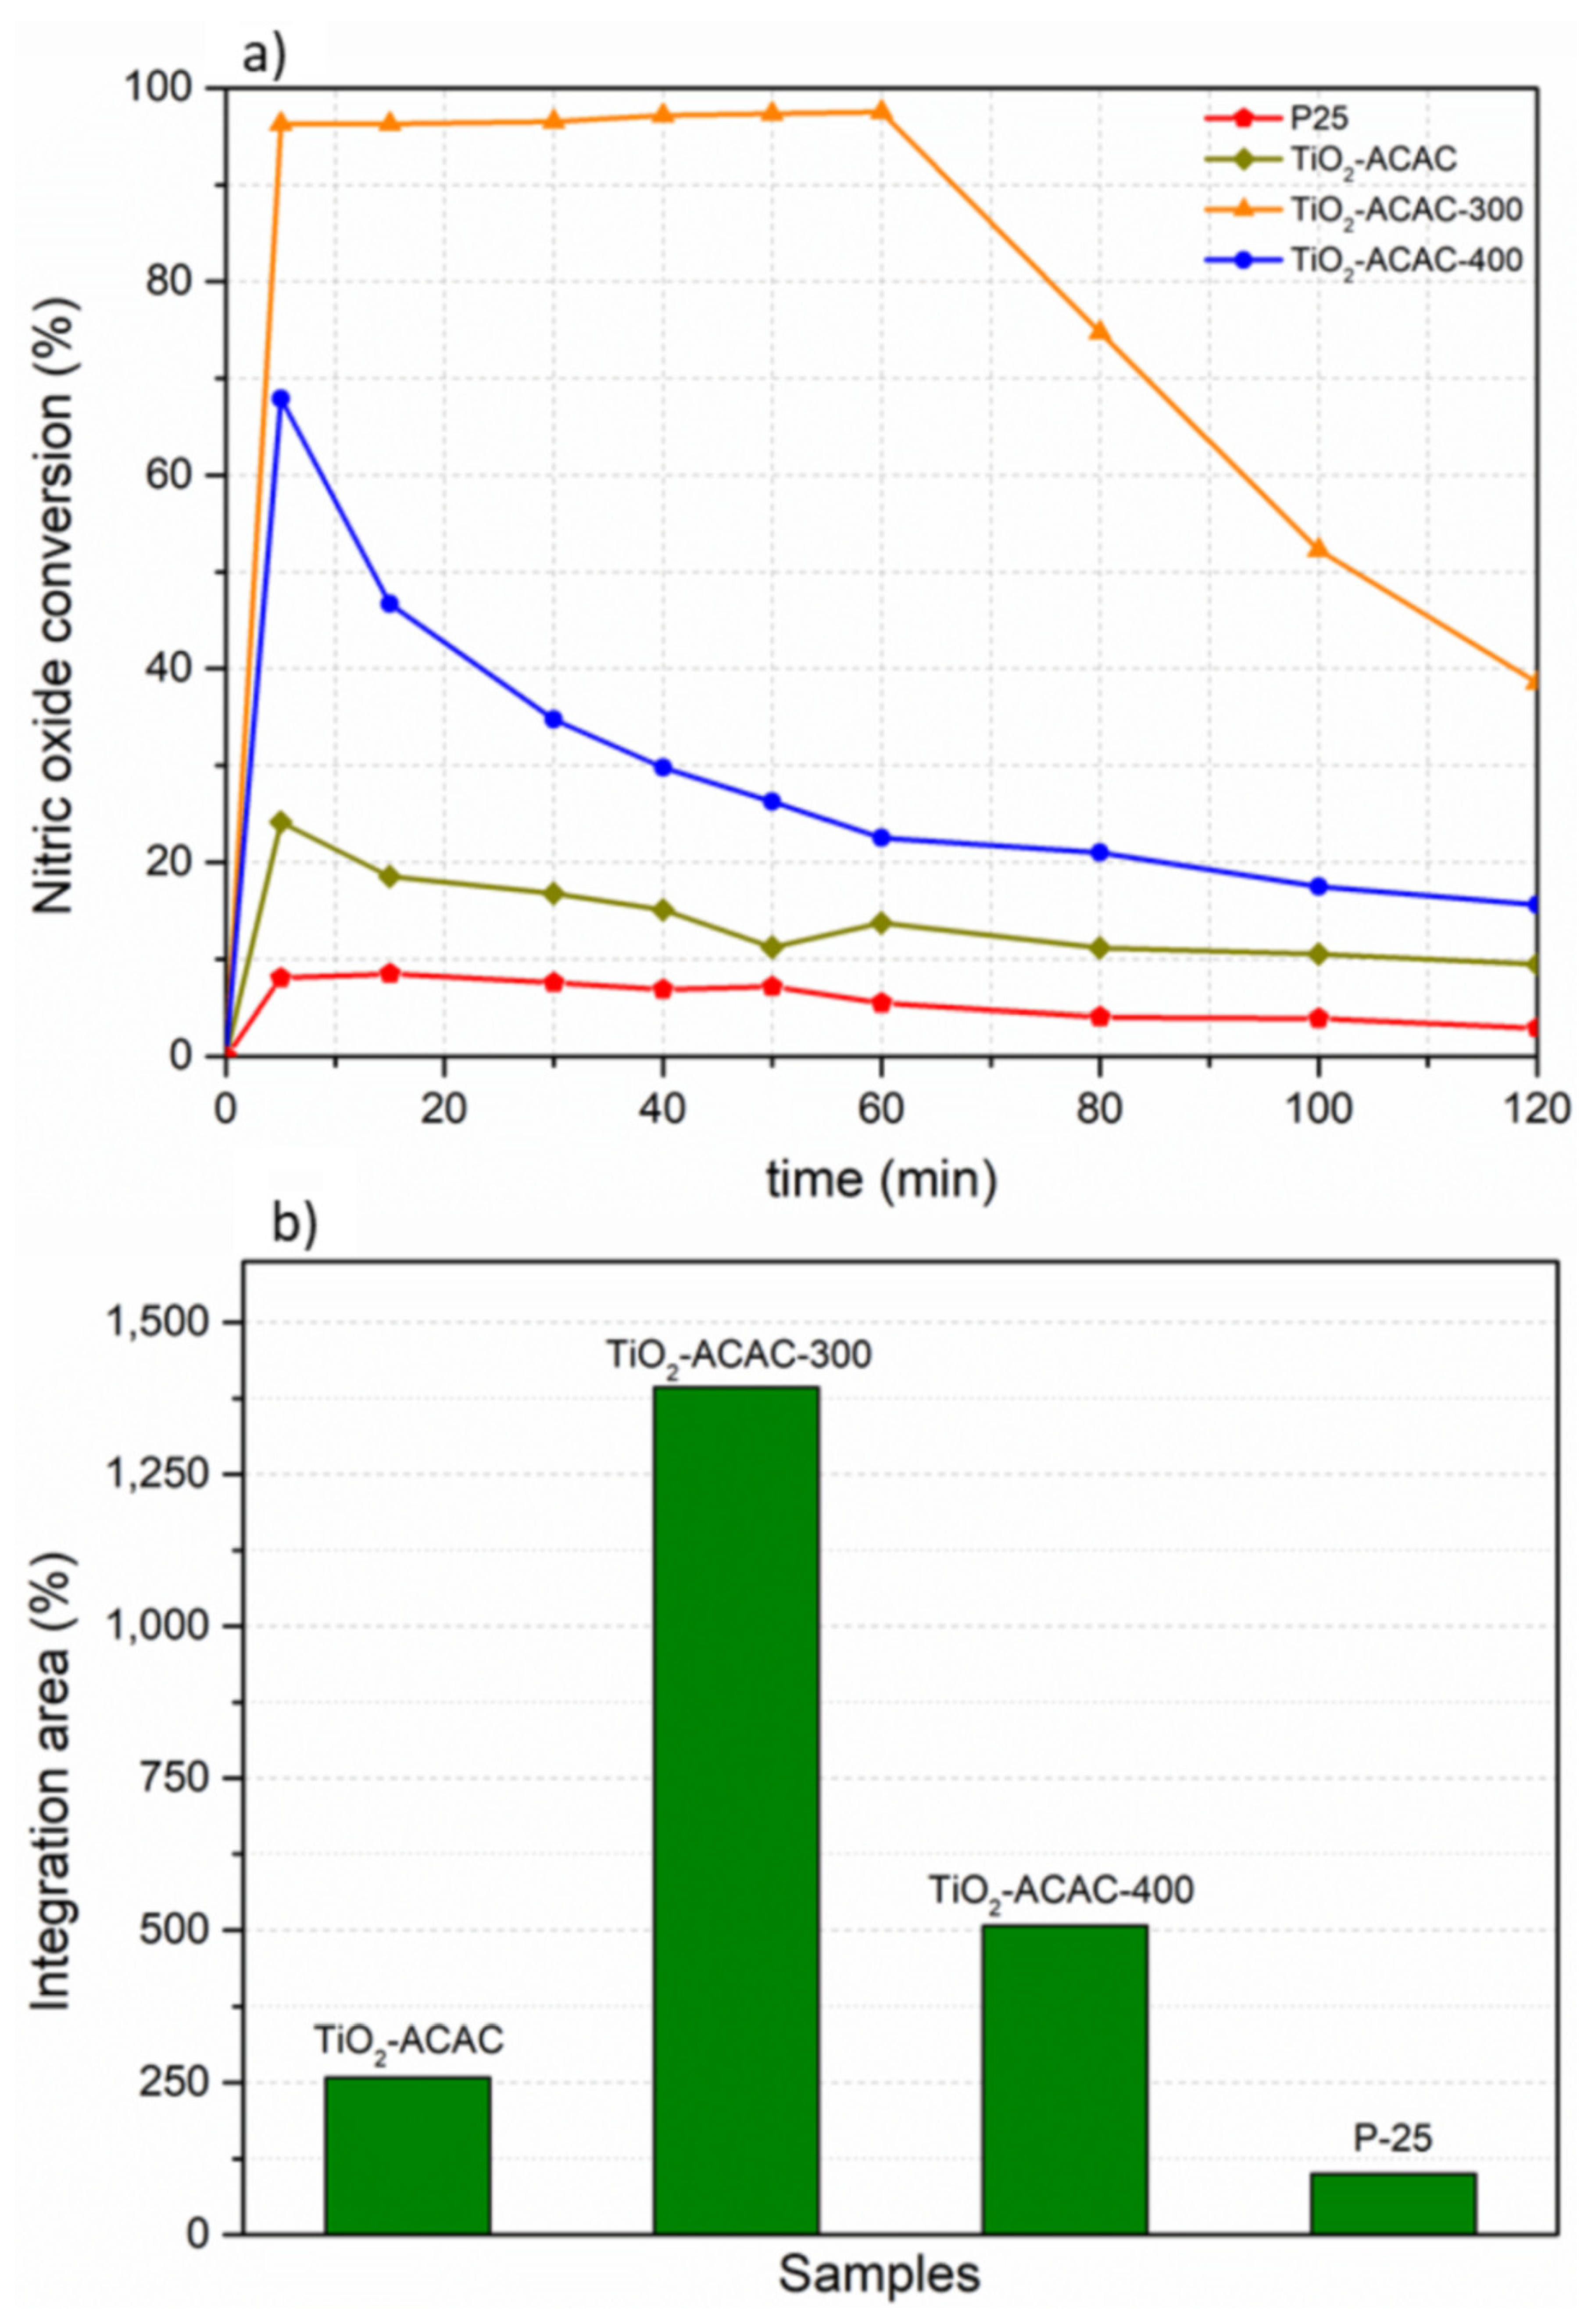
2.3. Electron Paramagnetic Resonance and Photocatalytic Degradation of NOx

The Electron Paramagnetic Resonance (EPR) signals for TiO2-ACAC-300 and TiO2-ACAC-400 at 150 K are shown in Figure 6. The principal feature in an EPR graph of TiO2-ACAC-300 is the presence of a strong single-electron-trapped oxygen vacancies (SETOV) signal, together with a less prominent O2 signal observable under visible light (Figure 6) and especially under ultra-violet (UVA) irradiation, as presented in Figure 6 and Figure 7. In Figure 7, O2 and SETOV signals were calculated for TiO2-ACAC-300 by Easyspin software and compared to the experimental O2 and SETOV signals, acquired at 150 K under UVA.
The signal of SETOV is also present in the EPR spectrum of TiO2-ACAC-400, however, its concentration is about six times lower than in TiO2-ACAC-300 (Supplementary Figure S8). Absolute concentration of SETOV in TiO2-ACAC-300 is 7 × 1015 cm−3, obtained from double integration of the EPR spectrum and comparison with copper (II) sulfate pentahydrate standard. Spectral fits using Easyspin software reveal that the SETOV EPR signal is best described by an isotropic line with g value of 2.000(2) and line width of 0.8(1) mT. On the other hand, the EPR spectrum of superoxide anion radical is described by axial g tensor with values g|| = 2.004(1) and g⊥ = 2.023(1) and line width of 0.8(1) mT. These values are in agreement with literature [33,34]. It is worth noting that Ti3+ electron centers were not observed by EPR, in agreement with XPS results (Supplementary Figure S6). EPR signals of TiO2-ACAC are discussed elsewhere [15] and confirmed the presence of Ti3+, besides SETOV and ·O2, in accordance to XPS findings presented in the current study.
Photocatalytic degradation of NOx, under visible light illumination, demonstrated almost total abatement of the gas, for the time span of 1h, when TiO2-ACAC-300 was used for this purpose (Figure 8). After the time span of 1 h, deactivation process started to be apparent due to adsorption of mineralized NO3 on the surface of de nanoparticles [15]. In order to confirm the origin of its deactivation we performed XRPD and Ion Chromatography (Supplementary Figure S9 and Supplementary Section S10). XRPD pattern of deactivated was analyzed by Le Bail method and presented the same characteristics as the pattern showed in Figure 1b, i.e., anatase was the only phase, while the mean crystallite phase was calculated as 6.7 (±0.1) nm, confirming that there were no changes in terms of mean crystallite size before and after deactivation. On the other hand, Ion Chromatography (see, Supplementary Section S10 for experimental procedure) detected that deactivated photocatalyst contained 6.40 mg L−1 of NO3, while virgin photocatalyst presented only 0.16 mg L−1. These results pointed out that adsorption of NO3, which is the final product of photo-oxidation of NOx gas, on the surface of the photocatalyst is responsible for its deactivation.
A similar deactivation process, the key factor hindering a wider commercial application of photocatalysis, was observed during photodegradation of volatile organic compounds (VOCs) due to the adsorption of intermediate products on the Bi-decorated TiO2 surface [36] and, also, in many other studies [37,38]. Therefore, regeneration of deactivated photocatalysts has been widely studied and there are techniques for regeneration of such photocatalysts [39].
TiO2-ACAC-400 showed higher photocatalytic degradation efficiency than TiO2-ACAC, although, significantly lower than the one measured for TiO2-ACAC-300 (almost 3 times lower, over the time span of 120 min, as presented at Figure 8b). The commercial photocatalyst Evonik P-25 TiO2 showed only minor activity under visible light illumination and lower than the one presented by TiO2-ACAC, confirming some previous results [15]. TiO2-ACAC-550 showed insignificant conversion of NOx and, therefore, was not plotted in Figure 8.

3. Discussion

The highest photocatalytic properties of TiO2-ACAC-300 towards NOx degradation under visible light could be directly linked to the formation of CTC between nanocrystalline anatase and acetylacetone, and, therefore, to the higher absorption within visible light spectrum, as strongly indicated by TGA, FTIR, DRS and PL (Figure 2, Figure 3, Figure 4 and Figure 5), although higher anatase crystallinity of TiO2-ACAC-300 as compared to its precursor TiO2-ACAC might be also contributing to the increased photocatalytic efficiency.
Additionally, TiO2-ACAC-400, practically free of ACAC, showed a modest photocatalytic activity towards NOx in comparison to TiO2-ACAC-300 (Figure 8). The broad PL peak of TiO2-ACAC-300 centered at 590 nm (2.10 eV), also observed for TiO2-ACAC although less intense (Figure 5), is a fingerprint of LMCT between ACAC and anatase [8,14,15].
TGA suggested (Figure 2) that the content of ACAC over different TiO2 prepared in this study, is an important factor that may be affecting their photocatalytic performance. A higher overall content of ACAC in TiO2-ACAC (Figure 2) does not promote photocatalytic degradation but, in fact, decreases it, in comparison to TiO2-ACAC-300. Apparently, as judged from the DTG peak situated at 240 °C observed for TiO2-ACAC (Figure 2a), the portion of ACAC lost during this event is only weekly adsorbed [21] and would not be contributing to LMCT mechanism. In addition, Madaràsz et al. [40] and Oja Acik et al. [41] reported mass loss at around 240 °C due to free acetylacetone release. Although their titania crystalline phase was not anatase, but a titanium oxobis(acetylacetonate), it is relevant for our study that at the temperatures ~240 °C free acetylacetone, or adsorbed in accordance to [21], is released.
The high content of ACAC (7.3 wt.%) lost in TiO2-ACAC between 300 and 450 °C was not beneficial, as well. This might be due to lower crystallinity (Figure 1) and the higher quantity of point defects, such as SETOV and Ti3+ within TiO2-ACAC [15] relative to TiO2-ACAC-300 (Figure 7). The amount of ACAC lost at higher temperatures is lower for TiO2-ACAC-300 (2.7 wt.%), Figure 2b, in comparison to TiO2-ACAC. For TiO2-ACAC-400, the amount of ACAC is insignificant (at most 0.25 wt.%) to cause an efficient LMCT contribution. In the case of TiO2-ACAC-550, the calcination process eliminates any residual trace of ACAC anchored on TiO2 surface, therefore, lacks any chance for HOMO to CB electron transfer. Milicevic et al. [42] suggested that in a similar CTC material, consisting of thiosalicylic acid and TiO2, thiosalicylic acid is bound to TiO2 through interaction between surface Ti ions and carboxyl groups. Therefore, it can be rationalized that only the part of the ACAC chemically bonded to Ti4+ at anatase surface is capable to participate in LMCT. FTIR spectra of TiO2-ACAC and TiO2-ACAC-300 suggested, indeed, interaction between ACAC and TiO2 (Figure 3, Table 1 and Scheme 1).
Additionally, the portion of ACAC which is not directly bound to Ti4+ at the surface of anatase, can make more difficult interaction of O2 and H2O with the inorganic substrate and, therefore, inhibiting the formation of ROS. The significant increase of mesoporous volume in TiO2-ACAC-300 (Vmeso = 0.157 mL g−1) when compared to TiO2-ACAC (Vmeso = 0.072 mL g−1) would be relevant as a factor that may promote photo-oxidation reactions at TiO2-ACAC-300.
The presence of SETOV defect, attributed to bulk VO, as expressed by Kröger-Vink notation, observed by EPR in TiO2-ACAC-300 and TiO2-ACAC-400 may not have strong influence on their photocatalytic activity in the visible spectral range, in accordance to some authors [34]. However, it is hard to discard its participation in the studied photocatalytic reactions for both TiO2-ACAC-300 and TiO2-ACAC-400, particularly due to the moderate photodegradation activity of TiO2-ACAC-400, a material which is practically free of ACAC. In addition, high visible light absorption of TiO2-ACAC-400 would be only possible with the presence of deep electronic states, such as SETOV.
Although, the total content of ACAC in TiO2-ACAC-300 is relatively low and does not exceed 3 wt.%., previous analyses corroborated that LMCT mechanism is especially active in this material, probably due to strong chemical interaction between ACAC and Ti4+ at the surface of anatase nanoparticles as demonstrated by FTIR (Table 1). Therefore, promotion of electrons from HOMO to CB is efficient, causing high sensitivity of CTC inside the visible spectral region and, consequently, efficient photogeneration of O2 providing high photodegradation of NOx gas, as demonstrated in the schematic model of the electronic levels of the CTC in respect to the redox potential (Figure 9).
It appears that the calcination conditions, resulting in TiO2-ACAC-300, are better optimized in comparison to the other calcination conditions tested in this study. TiO2-ACAC presents a much higher quantity of ACAC, however, our analyses (especially TGA and PL) suggested that a part of it does not participate in LMCT mechanism and may even impede the interactions of O2/H2O with TiO2, a necessary condition for posterior formation of ROS species. The calcination at 400 °C, on the other hand, removes ACAC from the surface of anatase nanoparticles, suppressing, thus, LMCT mechanism and, consequently, its photocatalytic efficiency. EPR spectroscopy (Figure 6 and Figure 7) revealed formation of superoxide anion radical under illumination, suggesting that .O2 has an important role in photo-oxidation reactions of NOx, when TiO2-ACAC-300 and TiO2-ACAC-400 are used as photocatalysts for abatement of NOx gas.

4. Materials and Methods

4.1. Synthesis

The synthesis of anatase nanoparticles coupled to acetylacetone was carried out following the sol-gel route previously reported by Scolan and Sanchez [21], keeping [ACAC]/[Ti] = 2. In the first step, an alcoholic solution of 20 mL of ACAC, (~99%), with 100 mL of ethanol, (≥99.8%), provided by Sigma Aldrich, San Luis, MO, USA (1:5 v/v) was prepared. Secondly, 30 mL of titanium (IV) isopropoxide, Ti(OiPr)4, (~97%, Sigma Aldrich, San Luis, MO, USA), were added dropwise under magnetic stirring to the solution ACAC/ethanol and a yellow solution was obtained. After 40 min of stirring, 180 mL of HNO3 provided by Sigma Aldrich, San Luis, MO, USA (0.015 M) were added, using a Pasteur pipette, into the yellowish solution to induce hydrolysis reaction. This solution was heated to 60 °C and kept under magnetic stirring for 8 h to promote condensation reaction. Afterwards, a yellow gel was obtained through drying on Petri dish at room temperature, for ~20 h. Finally, the gel was dried at 100 °C for ~15 h to obtain a red-yellowish xerogel of acetylacetone-coated TiO2 (denoted TiO2-ACAC). Three equal portions of the TiO2-ACAC xerogel were heat treated in air using a laboratory furnace at (i) 300 °C/2 h; (ii) 400 °C/2 h and (iii) 550 °C/1 h, forming the samples denoted TiO2-ACAC-300, TiO2-ACAC-400 and TiO2-ACAC-550, respectively.

4.2. Characterization Techniques

The previously prepared materials, TiO2-ACAC, TiO2-ACAC-300, TiO2-ACAC-400 and TiO2-ACAC-550, were thoroughly characterized.
X-ray powder diffraction (XRPD) was carried out in a Bruker D8 Discovery diffractometer (Bruker, Billerica, MA, USA), operating with Cu Kα radiation. The XRPD patterns were acquired in a range from 20° to 80° (2θ), with a step size of 0.02° (2 s per step) and were analyzed by Le Bail method, through Topas 4.2 software (Bruker, Billerica, MA, USA).
The thermogravimetric (TGA) analyses were performed using a Perkin-Elmer Simultaneous Thermal Analyzer, STA 6000 (Perkin-Elmer, Waltham, MA, USA), under synthetic air flow (20 mL min−1), at heating rate of 10 °C min−1 in the temperature range of 30–800 °C.
The Fourier transform infrared spectroscopy (FTIR) was performed on a Perkin-Elmer Spectrum Two FT-IR-ATR spectrometer (Perkin-Elmer, Waltham, MA, USA). Certain quantity of each material was used for the analysis without any pre-treatment. Spectra were recorded in the range from 400 to 4000 cm−1, with a resolution of 4 cm−1 and 20 scans.
The carbon amount was estimated by CHN elemental analysis. Thermo Electron Corporation Flash EA 1112 Series (Thermo Scientific, Waltham, MA, USA) was used for this purpose.
The X-ray photoelectron spectroscopy (XPS) was carried out using an Alpha 110 hemispherical analyzer (VG Thermo Scientific, Waltham, MA, USA) and the Al Kα line (1486.6 eV) radiation. The energy correction was carried out using C 1s line with the energy of 284.7 eV [43]. The integrated areas of different peaks were calculated by software CasaXPS.
The textural proprieties were determined by N2 adsorption-desorption at −196 °C using a TriStar 3020 (Micromeritics, Norcross, GA, USA). Samples were pre-treated at 120 °C under vacuum of 50 mTorr, for 1 h. The specific surface area was calculated from N2 adsorption isotherms by Brunauer-Emmett-Teller (BET) approach. The correlation coefficients were higher than 0.999 for all BET analyses. Mesoporous volume (Vmeso) was determined by Barrett-Joyner-Halenda (BJH) method from the desorption branch of isotherm, assuming cylindrical pore model.
The Electron Paramagnetic Resonance (EPR) spectra were recorded on a modified commercial X-band EPR MiniScope MS 400 spectrometer (Magnettech, Berlin, Germany) working at 9.45 GHz, using 100 kHz field modulation. The magnetic field was generated by a Varian 9” electromagnet coupled to a Walker (Salem, VA, USA) DC current source. Low-temperature measurements between 4.2 and 300 K were guaranteed by a He flux cryosystem, ESR 900 (Oxford Instruments, Oxford, England). Spectra simulations were obtained by Easyspin@ software (U.S. National Science Foundation, the U.S. National Institutes of Health, and the Swiss National Science Foundation). For g-factor calibration, the stable radical 2,2-diphenyl-1-picrylhydrazyl (DPPH) has been used (g = 2.0037). Powdered samples were measured in EPR quartz tubes (Wilmad Lab Glass, Vineland, NJ, USA). For illumination of samples inside the microwave cavity, UVA light (2 mW cm−2) from a solid-state laser diode (375 nm) or a white high-power light-emitting diode (0.5 mW cm−2) were used.
The diffuse reflectance spectroscopy (DRS) analyses were carried out using a Perkin-Elmer Lambda 650 UV/Vis spectrophotometer (Perkin-Elmer, Waltham, MA, USA) in duplicate, applying α-Al2O3 as blank reference. The DRS data were used as input for Kubelka-Mulk function to determinate band-gap energies.
The photoluminescence emission spectroscopy (PL) at room temperature was performed by Spectroflurometer Photon Technology International, model Quanta Master 40 (American Laboratory Trading, East Lyme, CT, USA), under Xenon lamp excitation at 360 nm.

4.3. Measurement of Photocatalytic Activity

The photo-oxidation of NOx gas (100 ppm), balanced with ultrahigh pure He (99.999%), was carried out using the same experimental procedure and equipment reported in our previous works [35,44].
All measurements of photocatalytic activity were performed in duplicate using 0.1 g of photocatalysts, under 15 mL min−1 flow of NOx gas (91.8 ppm) balanced with ultrahigh pure He. The only modification, in respect to the previous procedure [44], was that three T5 tubular fluorescent lamps (visible light, λ = 400–700 nm) of 8 W each, have been used, instead of UVA lamps, while the total irradiance of light source was 0.77 W cm−2. The photocatalytic activities of TiO2-ACAC, TiO2-ACAC-300, TiO2-ACAC-400 and TiO2-ACAC-550, together with that of P-25 powder (Evonik, Essen, Germany), were analyzed towards NOx degradation as a function of time, through the integration of area below the NOx conversion (%) vs. time curve, as previously proposed [44].

5. Conclusions

Photocatalytic degradation of NOx gas (concentration of ~100 ppm) has been used to probe TiO2-ACAC materials to determine the influence of different amounts of ACAC anchored on TiO2 surface, designed without or with calcination stage between 300 and 550 °C. TiO2-ACAC calcined at 300 °C, taking advantage of the LMCT mechanism, registered high photocatalytic activity for NOx degradation under visible light irradiation for the first time.
This study found that calcination temperature influences decisively the final photocatalytic activity of TiO2-ACAC CTC, since it affects the content of ACAC in the system and the predominate type of interaction between this bidentate compound and anatase nanoparticles. A proper content of ACAC, strongly interacting with Ti4+ at anatase surface, will improve LMCT and will permit desirable interaction of ROS species and NOx molecules on the surface of nanoparticles. A higher crystallinity of TiO2-ACAC-300 in respect to TiO2-ACAC (non-calcined material) might be also contributing to the increased photocatalytic efficiency. The activity reached for TiO2-ACAC-300 might be further improved by adjusting calcination conditions, such as temperature, time and atmosphere. It is revealed that O2 has an important role in photo-oxidation of NOx; however, the use of ROS scavengers in the future will be helpful to understand the role of other ROS species potentially involved in photo-oxidation processes.
Since the TiO2-ACAC system has promising photocatalytic properties for NOx abatement, further efforts should be accomplished to develop heterostructures based on this system, in order to improve charge separation.

Supplementary Materials

The following are available online at https://0-www-mdpi-com.brum.beds.ac.uk/2073-4344/10/12/1463/s1, Figure S1: FTIR spectrum of acetylacetone; Figure S2: FTIR spectra of TiO2-ACAC, TiO2-ACAC-300 and TiO2-ACAC-400; Figure S3: N2 adsorption–desorption isotherms of TiO2-ACAC, TiO2-ACAC-300 and TiO2-ACAC-400; Table S1: Mean pore diameter; Figure S4: XPS spectra within Ti 2p range of TiO2-ACAC, TiO2-ACAC-300, TiO2-ACAC-400 and TiO2-ACAC-550; Figure S5: XPS spectra within C 1s range of TiO2-ACAC, TiO2-ACAC-300, TiO2-ACAC-400 and TiO2-ACAC-550; Figure S6: XPS spectra within O 1s range of TiO2-ACAC-300, TiO2-ACAC-400 and TiO2-ACAC-550; Figure S7: PL spectrum of TiO2-ACAC-550; Figure S8: Concentration of SETOV defects as a function of time for TiO2-ACAC-300 and TiO2-ACAC-400, under visible (white LED) and ultraviolet radiation; Figure S9: Experimental XRPD patterns refined by Le Bail method for TiO2-ACAC-300. Section S10: Ion Chromatography analysis procedure of virgin and deactivated photocatalysts.

Author Contributions

Conceptualization, B.A.M.; synthesis and overall characterizations L.A.A.; funding acquisition, B.A.M; synthesis M.H.; data interpretation L.A.A., M.H., E.M.J., O.G.P. and B.A.M.; photoluminescence analysis and interpretation, R.d.S.C. and M.C.; XPS analysis and interpretation, M.E.H.M.d.C.; EPR analysis and interpretation, B.C.S. and K.K.; FTIR analysis and interpretation, O.G.P.; writing—original draft preparation, B.A.M.; writing—review and editing, L.A.A., K.K., O.G.P., E.M.J. and B.A.M. All authors have read and agreed to the published version of the manuscript.

Funding

This research received no external funding.

Acknowledgments

This study was financed in part by the Coordenação de Aperfeiçoamento de Pessoal de Nível Superior-Brasil (CAPES)–Finance Code 001. B.A.M. is grateful to CNPq (National Council for Scientific and Technological Development) for a Research Productivity Grant. L.A. is grateful to Petrobras S.A. for a master degree scholarship. O.G.P. thanks FAPERJ for research grant (E-26/010.100622/2018).

Conflicts of Interest

The authors declare no conflict of interest.

References

  1. Kordás, K.; Mohl, M.; Kónya, Z.; Kukovecz, Á. Layered titanate nanostructures: Perspectives for industrial exploitation. Transl. Mater. Res. 2015, 2. [Google Scholar] [CrossRef]
  2. Wang, L.; Sasaki, T. Titanium oxide nanosheets: Graphene analogues with versatile functionalities. Chem. Rev. 2014, 114, 9455–9486. [Google Scholar] [CrossRef] [PubMed]
  3. Christoforidis, K.C.; Fornasiero, P. Photocatalytic hydrogen production: A rift into the future energy supply. ChemCatChem 2017, 9, 1523–1544. [Google Scholar] [CrossRef] [Green Version]
  4. Ren, H.; Koshy, P.; Chen, W.F.; Qi, S.; Sorrell, C.C. Photocatalytic materials and technologies for air purification. J. Hazard. Mater. 2017, 325, 340–366. [Google Scholar] [CrossRef] [PubMed]
  5. Luévano-Hipólito, E.; Martínez-de la Cruz, A. Photooxidation of NOx using scheelite-type ABO4 (A = Ca, Pb; B = W, Mo) phases as catalyts. Adv. Powder Technol. 2017, 28, 1511–1518. [Google Scholar] [CrossRef]
  6. Zhang, G.; Kim, G.; Choi, W. Visible light driven photocatalysis mediated via ligand-to-metal charge transfer (LMCT): An alternative approach to solar activation of titania. Energy Environ. Sci. 2014, 7, 954–966. [Google Scholar] [CrossRef] [Green Version]
  7. Medić, M.M.; Vasić, M.; Zarubica, A.R.; Trandafilović, L.V.; Dražić, G.; Dramićanin, M.D.; Nedeljković, J.M. Enhanced photoredox chemistry in surface-modified Mg2TiO4 nano-powders with bidentate benzene derivatives. RSC Adv. 2016, 6, 94780–94786. [Google Scholar] [CrossRef]
  8. Aronne, A.; Fantauzzi, M.; Imparato, C.; Atzei, D.; de Stefano, L.; D’Errico, G.; Sannino, F.; Rea, I.; Pirozzi, D.; Elsener, B.; et al. Electronic properties of TiO2-based materials characterized by high Ti3+ self-doping and low recombination rate of electron-hole pairs. RSC Adv. 2017, 7, 2373–2381. [Google Scholar] [CrossRef] [Green Version]
  9. Wang, Z.; Lang, X. Visible light photocatalysis of dye-sensitized TiO2: The selective aerobic oxidation of amines to imines. Appl. Catal. B Environ. 2018, 224, 404–409. [Google Scholar] [CrossRef]
  10. Agbe, H.; Nyankson, E.; Raza, N.; Dodoo-Arhin, D.; Chauhan, A.; Osei, G.; Kumar, V.; Kim, K.H. Recent advances in photoinduced catalysis for water splitting and environmental applications. J. Ind. Eng. Chem. 2019, 72, 31–49. [Google Scholar] [CrossRef]
  11. Li, X.; Xu, H.; Shi, J.L.; Hao, H.; Yuan, H.; Lang, X. Salicylic acid complexed with TiO2 for visible light-driven selective oxidation of amines into imines with air. Appl. Catal. B Environ. 2019, 244, 758–766. [Google Scholar] [CrossRef]
  12. Rochkind, M.; Pasternak, S.; Paz, Y. Using dyes for evaluating photocatalytic properties: A critical review. Molecules 2015, 20, 88–110. [Google Scholar] [CrossRef] [PubMed] [Green Version]
  13. Nosaka, Y.; Nosaka, A.Y. Generation and detection of reactive oxygen species in photocatalysis. Chem. Rev. 2017, 117, 11302–11336. [Google Scholar] [CrossRef] [PubMed]
  14. Sannino, F.; Pernice, P.; Imparato, C.; Aronne, A.; D’Errico, G.; Minieri, L.; Perfetti, M.; Pirozzi, D. Hybrid TiO2-acetylacetonate amorphous gel-derived material with stably adsorbed superoxide radical active in oxidative degradation of organic pollutants. RSC Adv. 2015, 5, 93831–93839. [Google Scholar] [CrossRef]
  15. Habran, M.; Pontón, P.I.; Mancic, L.; Pandoli, O.; Krambrock, K.; da Costa, M.E.H.M.; Letichevsky, S.; Costa, A.M.L.M.; Morgado, E.; Marinkovic, B.A. Visible light sensitive mesoporous nanohybrids of lepidocrocite-like ferrititanate coupled to a charge transfer complex: Synthesis, characterization and photocatalytic degradation of NO. J. Photochem. Photobiol. A Chem. 2018, 365, 133–144. [Google Scholar] [CrossRef]
  16. Varaganti, S.; Ramakrishna, G. Dynamics of interfacial charge transfer emission in small molecule sensitized TiO2 nanoparticles: Is it localized or delocalized? J. Phys. Chem. C. 2010, 114, 13917–13925. [Google Scholar] [CrossRef]
  17. Sánchez-De-Armas, R.; Oviedo, J.; San Miguel, M.Á.; Sanz, J.F. Direct vs indirect mechanisms for electron injection in dye-sensitized solar cells. J. Phys. Chem. C. 2011, 115, 11293–11301. [Google Scholar] [CrossRef]
  18. Dugandžić, I.M.; Jovanović, D.J.; Mančić, L.T.; Milošević, O.B.; Ahrenkiel, S.P.; Šaponjić, Z.V.; Nedeljković, J.M. Ultrasonic spray pyrolysis of surface modified TiO2 nanoparticles with dopamine. Mater. Chem. Phys. 2013, 143, 233–239. [Google Scholar] [CrossRef]
  19. Li, M.; Jin, Y.; Su, J.; Shen, J. Degradation of catechol on BiOCl: Charge transfer complex formation and photoactivity. J. Adv. Oxid. Technol. 2017, 20, 1–8. [Google Scholar] [CrossRef]
  20. Zagaynov, I.V.; Buryak, A.K. Mesoporous nanoscale ceria: Synthesis from cerium (III) acetylacetonate and mechanism. J. Sol-Gel Sci. Technol. 2015, 74, 103–108. [Google Scholar] [CrossRef]
  21. Scolan, E.; Sanchez, C. Synthesis and characterization of surface-protected nanocrystalline titania particles. Chem. Mater. 1998, 10, 3217–3223. [Google Scholar] [CrossRef]
  22. Musić, S.; Gotić, M.; Ivanda, M.; Popović, S.; Turković, A.; Trojko, R.; Sekulić, A.; Furić, K. Chemical and microstructural properties of TiO2 synthesized by sol-gel procedure. Mater. Sci. Eng. B. 1997, 47, 33–40. [Google Scholar] [CrossRef]
  23. Ghosh, O.S.N.; Gayathri, S.; Alagarasan, D.; Kumar, K.V.P.; Viswanath, A.K. One pot transparent sol-gel synthesis of TiO2 nanospheres with pristine anatase phase and their physicochemical characteristics. Appl. Sci. Lett. 2016, 2, 23–30. [Google Scholar] [CrossRef]
  24. Notestein, J.M.; Iglesia, E.; Katz, A. Photoluminescence and charge-transfer complexes of calixarenes grafted on TiO2 nanoparticles. Chem. Mater. 2007, 19, 4998–5005. [Google Scholar] [CrossRef]
  25. Ndwandwe, S.; Tshibangu, P.; Dikio, E.D. Synthesis of carbon nanospheres from vanadium β-diketon catalyst. Int. J. Electrochem. Sci. 2011, 6, 749–760. [Google Scholar]
  26. Tayyari, S.F.; Milani-Nejad, F. Vibrational assignment of acetylacetone. Spectrochim. Acta Part A Mol. Biomol. Spectrosc. 2000, 56, 2679–2691. [Google Scholar] [CrossRef]
  27. Čeponkus, J.; Platakyte, R.; Šablinskas, V.; Quintanilla, A.G. FTIR study of acetylacetone, D2-acetylacetone and hexafluoroacetylacetone-water complexes in argon and nitrogen matrices. Chemija 2018, 29, 1–16. [Google Scholar] [CrossRef] [Green Version]
  28. Vukoje, I.; Kovač, T.; Džunuzović, J.; Džunuzović, E.; Lončarević, D.; Ahrenkiel, S.P.; Nedeljković, J.M. Photocatalytic ability of visible-light-responsive TiO2 nanoparticles. J. Phys. Chem. C. 2016, 120, 18560–18569. [Google Scholar] [CrossRef]
  29. Siwińska-Stefańska, K.; Zdarta, J.; Paukszta, D.; Jesionowski, T. The influence of addition of a catalyst and chelating agent on the properties of titanium dioxide synthesized via the sol–gel method. J. Sol-Gel Sci. Technol. 2015, 75, 264–278. [Google Scholar] [CrossRef] [Green Version]
  30. Atout, H.; Álvarez, M.G.; Chebli, D.; Bouguettoucha, A.; Tichit, D.; Llorca, J.; Medina, F. Enhanced photocatalytic degradation of methylene blue: Preparation of TiO2/reduced graphene oxide nanocomposites by direct sol-gel and hydrothermal methods. Mater. Res. Bull. 2017, 95, 578–587. [Google Scholar] [CrossRef] [Green Version]
  31. Moulder, J.F.; Stickle, W.F.; Sobol, P.E.; Bomben, K.D. Handbook of X-ray Photoelectron Spectroscopy: A Reference Book of Standard Spectra for Identification and Interpretation of XPS Data; Perkin-Elmer, Physical Electronics Division: Eden Prairie, MN, USA, 1992. [Google Scholar] [CrossRef]
  32. Santara, B.; Giri, P.K.; Imakita, K.; Fujii, M. Evidence of oxygen vacancy induced room temperature ferromagnetism in solvothermally synthesized undoped TiO2 nanoribbons. Nanoscale 2013, 5, 5476–5488. [Google Scholar] [CrossRef] [PubMed]
  33. Carter, E.; Carley, A.F.; Murphy, D.M. Evidence for O2 radical stabilization at surface oxygen vacancies on polycrystalline TiO2. J. Phys. Chem. C. 2007, 111, 10630–10638. [Google Scholar] [CrossRef]
  34. Li, H.; Ren, F.; Liu, J.; Wang, Q.; Li, Q.; Yang, J.; Wang, Y. Endowing single-electron-trapped oxygen vacancy self-modified titanium dioxide with visible-light photocatalytic activity by grafting Fe(III) nanocluster. Appl. Catal. B Environ. 2015, 172, 37–45. [Google Scholar] [CrossRef]
  35. Habran, M.; Krambrock, K.; da Costa, M.E.H.M.; Morgado, E.; Marinkovic, B.A. TiO2 anatase nanorods with non-equilibrium crystallographic {001} facets and their coatings exhibiting high photo-oxidation of NO gas. Environ. Technol. 2018, 39, 231–239. [Google Scholar] [CrossRef] [PubMed]
  36. Lai, M.; Zhao, J.; Chen, Q.; Feng, S.; Bai, Y.; Li, Y.; Wang, C. Photocatalytic toluene degradation over Bi-decorated TiO2: Promoted O2 supply to catalyst’s surface by metallic Bi. Catal. Today 2019, 335, 372–380. [Google Scholar] [CrossRef]
  37. Sauer, M.L.; Ollis, D.F. Catalyst deactivation in gas-solid photocatalysis. J. Catal. 1996, 163, 215–217. [Google Scholar] [CrossRef]
  38. He, F.; Muliane, U.; Weon, S.; Choi, W. Substrate-specific mineralization and deactivation behaviors of TiO2 as an air-cleaning photocatalyst. Appl. Catal. B Environ. 2020, 275, 119145. [Google Scholar] [CrossRef]
  39. Yan, X.J.; Tang, Y.; Ma, C.; Liu, Y.; Xu, J. Deactivation and regeneration of photocatalysts: A review. Desalin. Water Treat. 2018, 124, 160–176. [Google Scholar] [CrossRef]
  40. Madarász, J.; Kaneko, S.; Okuya, M.; Pokol, G. Comparative evolved gas analyses of crystalline and amorphous titanium(IV)oxo-hydroxo-acetylacetonates by TG-FTIR and TG/DTA-MS. Thermochim. Acta 2009, 489, 37–44. [Google Scholar] [CrossRef]
  41. Acik, I.O.; Madarász, J.; Krunks, M.; Tõnsuaadu, K.; Pokol, G.; Niinistö, L. Titanium(IV) acetylacetonate xerogels for processing titania films: AAA thermoanalytical study. J. Therm. Anal. Calorim. 2009, 97, 39–45. [Google Scholar] [CrossRef]
  42. Milićević, B.; Đorđević, V.; Lončarević, D.; Dostanić, J.M.; Ahrenkiel, S.P.; Dramićanin, M.D.; Sredojević, D.; Švrakić, N.M.; Nedeljković, J.M. Charge-transfer complex formation between TiO2 nanoparticles and thiosalicylic acid: A comprehensive experimental and DFT study. Opt. Mater. 2017, 73, 163–171. [Google Scholar] [CrossRef]
  43. Oswald, S.; Thoss, F.; Zier, M.; Hoffmann, M.; Jaumann, T.; Herklotz, M.; Nikolowski, K.; Scheiba, F.; Kohl, M.; Giebeler, L.; et al. Binding energy referencing for XPS in alkali metal-based battery materials research (II): Application to complex composite electrodes. Batteries 2018, 4, 36. [Google Scholar] [CrossRef] [Green Version]
  44. De Abreu, M.A.S.; Morgado, E.; Jardim, P.M.; Marinkovic, B.A. The effect of anatase crystal morphology on the photocatalytic conversion of NO by TiO2-based nanomaterials. Cent. Eur. J. Chem. 2012, 10, 1183–1198. [Google Scholar] [CrossRef] [Green Version]
Figure 1. Experimental XRPD patterns refined by Le Bail method for (a) TiO2-acetylacetone (ACAC); (b) TiO2-ACAC-300; (c) TiO2-ACAC-400 and (d) TiO2-ACAC-550. The experimental pattern is black, the calculated pattern is red and the difference plot is blue.
Catalysts 10 01463 g001
Figure 2. TGA and DTG curves of (a) TiO2-ACAC; (b) TiO2-ACAC-300; (c) TiO2-ACAC-400; (d) TGA curves of all TiO2-based samples. In (ac), vertical dashed lines mark mass loss due to ACAC bounded to TiO2. In (d), vertical dashed lines mark the temperature range related to the overall mass loss of ACAC (adsorbed and bounded).
Catalysts 10 01463 g002
Figure 3. (a) Fourier-transform infrared (FTIR) spectra of pure acetylacetone and (b) TiO2-ACAC, TiO2-ACAC-300 and TiO2-ACAC-400.
Catalysts 10 01463 g003
Scheme 1. Interaction between ACAC in keto-enolic form with Ti4+.
Catalysts 10 01463 sch001
Figure 4. (a) DRS curves and (b) Kubelka-Munk plots of TiO2-ACAC, TiO2-ACAC-300, TiO2-ACAC-400 and TiO2-ACAC-550.
Catalysts 10 01463 g004
Figure 5. PL spectra of TiO2-ACAC, TiO2-ACAC-300 and TiO2-ACAC-400.
Catalysts 10 01463 g005
Figure 6. EPR spectra of (a) TiO2-ACAC-300 and (b) TiO2-ACAC-400 at 150 K.
Catalysts 10 01463 g006
Figure 7. EPR experimental spectrum of TiO2-ACAC-300 at 150 K under UVA light and EPR calculated spectra of single-electron-trapped oxygen vacancies (SETOV) and superoxide anion radical at 150 K, using Easyspin software.
Catalysts 10 01463 g007
Figure 8. (a) Photocatalytic conversion of NOx as a function of time for TiO2-ACAC, TiO2-ACAC-300, TiO2-ACAC-400 and Evonik P-25; (b) histograms of photocatalytic activities obtained through the integration area approach [35] (Evonik P-25 activity has been used for comparison, being fixed at 100%).
Catalysts 10 01463 g008
Figure 9. Scheme of electronic bands for the TiO2-ACAC CTC and, consequent, for NOx photooxidation reaction.
Catalysts 10 01463 g009
Table 1. Assignments for vibrational band frequencies in the region 1700–1000 cm−1 for the keto-enolic ACAC and for TiO2-ACAC and TiO2-ACAC-300.
Frequency
(cm−1)
Assignment
Pure ACAC
Frequency
(cm−1)
Assignment
TiO2-ACAC &
TiO2-ACAC-300
1728νass (C=O) keto form1650νC=O (Ti…ACAC) in keto form
1708νsim (C=O) keto form
1606ν (HO-C=C) Enolic form conjugated with C=O1530νC=C (Ti-ACAC)
in enolic form
1416δass (CH3) + δip (C=C–H)
vinil hydrogen into enolic form
1416δass (CH3) + δip (C=C–H)
1359δsim (CH3)1359δsim (CH3)
1301ν (H3C–C–C–C–CH3)Chain breath
1245δ (OH)
Enolic form
1177δoop (C=C–H)
vinil hydrogen into enolic form
Table 2. Specific surface areas (S) calculated by Brunauer-Emmett-Teller (BET) approach, volumes of mesopores (Vmeso) determined by Barrett-Joyner-Halenda (BJH) method and optical band-gaps.
SamplesS (BET) m2 g−1Vmeso (BJH)
mL g−1
Band-Gap eV
TiO2-ACAC1320.072.4
TiO2-ACAC-3001370.161.4
TiO2-ACAC-400690.033.0
TiO2-ACAC-550--3.0
Publisher’s Note: MDPI stays neutral with regard to jurisdictional claims in published maps and institutional affiliations.

