Adsorption and Photocatalytic Mineralization of Bromophenol Blue Dye with TiO2 Modified with Clinoptilolite/Activated Carbon


Green Engineering and Sustainability Research Group, Department of Chemical Engineering, Faculty of Engineering and the Built Environment, Durban University of Technology, 70 Mansfield Road, Berea, Durban 4001, South Africa
*
Author to whom correspondence should be addressed.
Catalysts 2021, 11(1), 7; https://0-doi-org.brum.beds.ac.uk/10.3390/catal11010007
Submission received: 22 October 2020
/
Revised: 17 December 2020
/
Accepted: 18 December 2020
/
Published: 23 December 2020
(This article belongs to the Special Issue Green Catalysts: Application to Waste and Groundwater Treatment)
Abstract
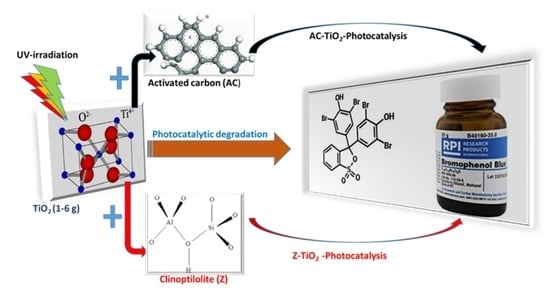
:This study presents a hybridized photocatalyst with adsorbate as a promising nanocomposite for photoremediation of wastewater. Photocatalytic degradation of bromophenol blue (BPB) in aqueous solution under UV-irradiation of wavelength 400 nm was carried out with TiO2 doped with activated carbon (A) and clinoptilolite (Z) via the co-precipitation technique. The physiochemical properties of the nanocomposite (A–TiO2 and Z–TiO2) and TiO2 were characterized by X-ray diffraction (XRD), scanning electron microscopy (SEM), and Fourier-transform infrared (FTIR) spectroscopy. Results of the nanocomposite (A–TiO2 and Z–TiO2) efficiency was compared to that with the TiO2, which demonstrated their adsorption and synergistic effect for the removal of chemical oxygen demand (COD) and color from the wastewater. At an optimal load of 4 g, the photocatalytic degradation activity (Z–TiO2 > A–TiO2 > TiO2) was found favorably by the second-order kinetic model. Consequently, the Langmuir adsorption isotherms favored the nanocomposites (Z–TiO2 > A–TiO2), whereas that of the TiO2 fitted very well on the Freundlich isotherm approach. Z–TiO2 evidently exhibited a high photocatalytic efficacy of decomposition over 80% of BPB (COD) at reaction rate constant (k) and coefficient of determination (R2) values of 5.63 × 10⁻⁴ min−1 and 0.989, respectively.
1. Introduction
The recent uprising of industrialization is being associated with the depletion of water resources owing to its consumption rate, making it essential to maintain healthy living [1,2]. Notwithstanding, the impact of anthropogenic activities and socio-economic development has resulted in poor sanitation and inadequate freshwater supply for drinking, even in countries or regions considered as water-rich [1]. Water shortages in many developing countries have been reported as one of the most significant political and societal problems confronting them [1,3].
South Africa, like many African countries, continues to suffer from the fresh water supply, which is declining in quality because of an increase in the pollution index and impeding of river catchments being caused by urbanization, deforestation, industrial and agricultural activities [4,5,6]. Furthermore, dyes and pigments produced by various industries such as cosmetics, textile, paper, leather, pharmaceutical, nutrition, and plastics are the foremost common contaminants in wastewater [7]. Distinctively, with a yearly estimation of over 70,000 tons of dyes produced, during the dyeing processes, 15% are being misapplied [8,9]. The release of these dyes and other organic pollutants into wastewater and the aquatic environment, even at low concentrations, are noticeable to be highly toxic with low transparency [9,10]. Additionally, emerging contaminants (antibiotics, pesticides, nanoplastics) complexity opposing water quality poses a great threat to aquatic life and human health [7,11]. Therefore, it is essential to develop a viable technology for the treatment of wastewater, most especially textile effluent.
Conventionally, decontamination technologies such as coagulation, ion flotation, sedimentation, filtration, biological treatment, and chlorination are limited in handling dye effluents [11,12,13,14,15]. Furthermore, most of the technologies end up generating secondary pollutants associated with complex sludge and toxic byproducts, which requires further treatment [6,16]. These setbacks make most of the treatment technologies to be cost-ineffective and time and energy-intensive in nature [11,14,17]. Therefore, a balanced technology is required to simultaneously improve water quality and debase dyes in wastewater settings.
Currently, advanced oxidation processes (AOPs) emerges as the needful technology to remediate poor water quality associated with conventional wastewater treatment technologies to mitigate high strength organic pollutants [18,19,20,21,22]. Among the different AOPs, heterogeneous photocatalysis as a principal component of green chemistry has inspired extensive research on designing eco-friendly and effective photocatalysts [23,24]. These photocatalysts are primarily semiconductors, which include TiO2, ZnO, Fe2O3, CdS, and ZnS [7,23]. Among them, TiO2 has been the most widely used due to its ability to break down organic pollutants to achieve complete mineralization with high reactivity, reduced toxicity, low cost, and being chemically stable [25,26]. Conversely, photodegradation of dyes under ultra-violet (UV) irradiation with TiO2 is reported to have some setbacks [27,28]. Thus, the presence of dye on the surface of TiO2 induces its negative charge ions by reducing the energy required for their excitation, hence extends its adsorption efficiency under a visible region of the spectrum. Even though TiO2 powders are easy to agglomerate, their adsorption capacity is very poor, with difficulties in recycling and separation [27,28]. Adsorbents, on the other hand, after regeneration, reduces their adsorption capacity as compared to photocatalysts [29,30,31]. To overcome these setbacks, a combination of photocatalysts and adsorbents have been reported to be very promising for wastewater treatment. One such way is by catalyst fixation onto a support such as gold nanoparticles, activated carbon, and zeolites (e.g., ZSM-5) [31,32].
However, only a few reports have cited the use of TiO2 nanocomposite doped on clinoptilolite (Z) or activated carbon (AC) for the mineralization of bromophenol blue dye (BPD) from wastewater. BPD was selected as the functional model for the wastewater simulation because of the role it plays as a dye and pigments for the wide usage in art decoration and textile industries, with the end product being wastewater [8,9]. Therefore, this study presents photocatalytic degradation of BBD using the TiO2/UV system. Furthermore, the influence of Z, AC, and hybridized photocatalysts (Z–TiO2 and AC-TiO2) loading rate (1–6 g), as well as their adsorption capacity, was investigated. Decolonization and degrading of the organics in the form of color, turbidity, and chemical oxygen demand (COD) was considered as the performance criteria.
2. Results and Discussion
2.1. Physiochemical Properties of TiO2-Based Composite (A–TiO2/Z–TiO2)
2.1.1. Crystalline Size
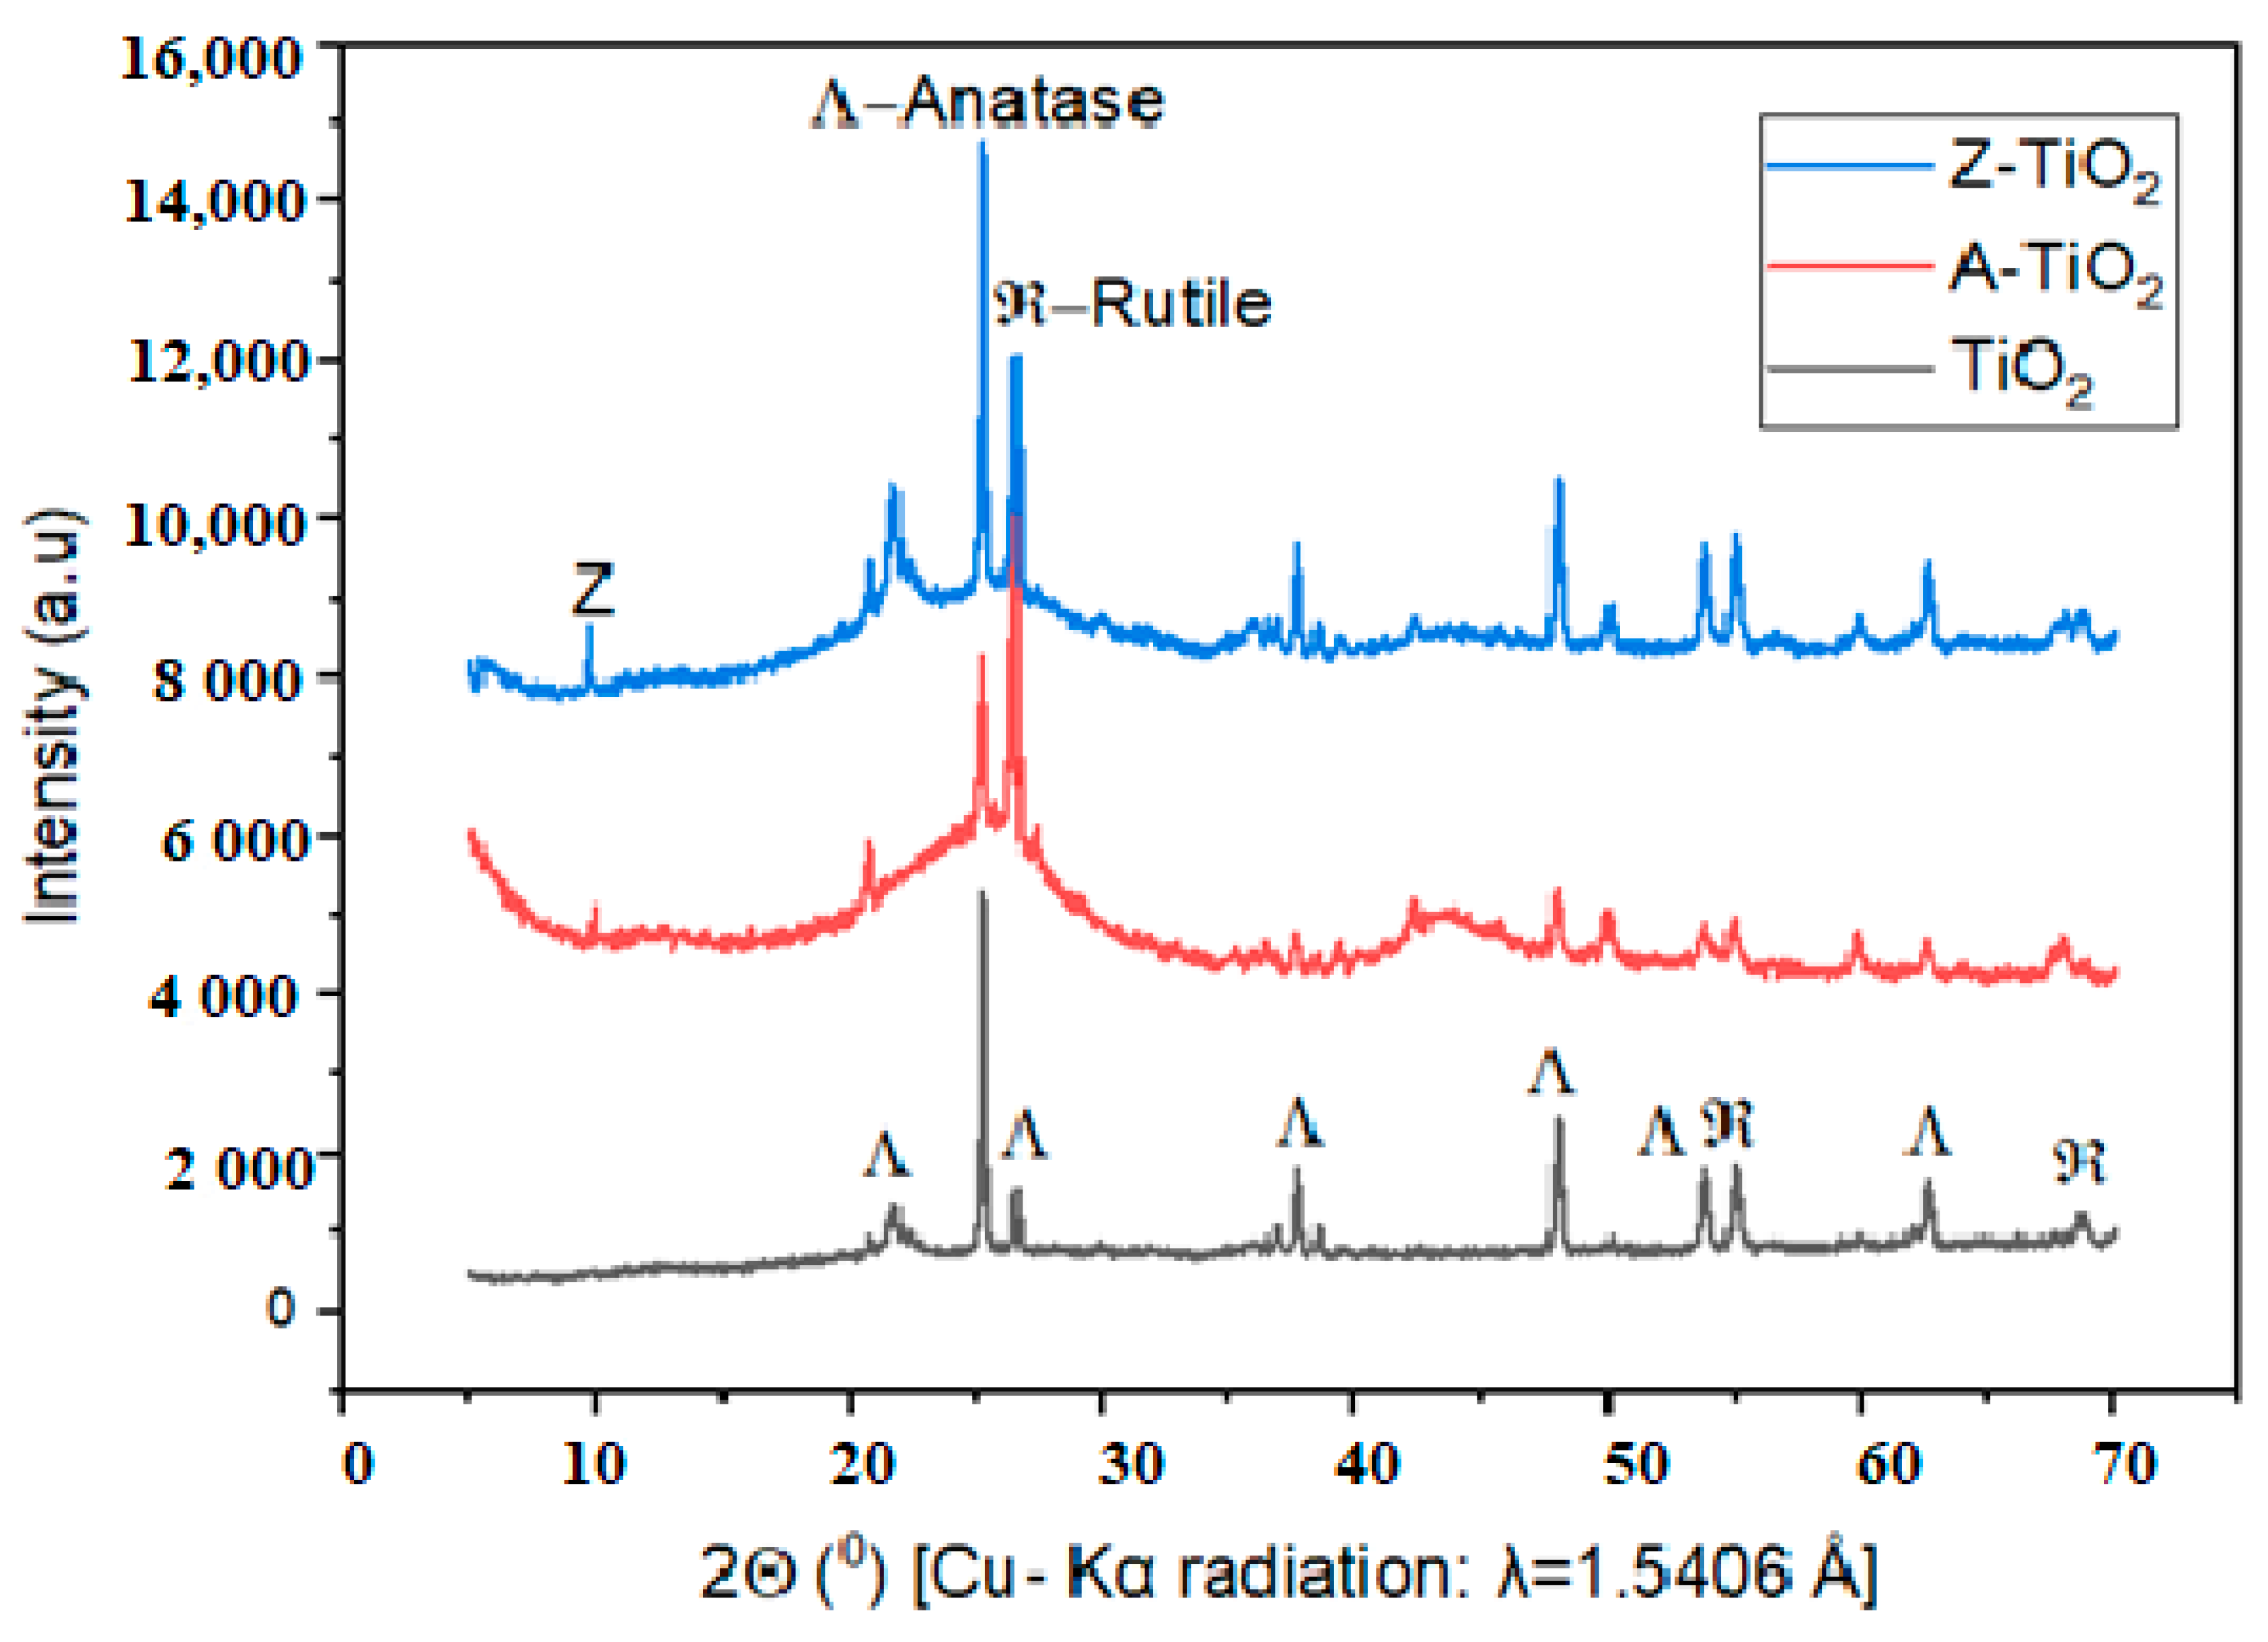
The change in the crystallographic structure of TiO2 after being modified into A–TiO2 and Z–TiO2 nanocomposites were determined by X-ray diffraction (XRD). As can be seen (Figure 1), the XRD results showed the presence of crystalline phases in phase mixtures, with most of the TiO2 structures as the anatase phase. Comparatively, the change in the intensities of the TiO2 peaks to that of A–TiO2 and Z–TiO2 signpost the effect that the isomorphic interaction may have occurred during the modification mechanism [32,33]. Notwithstanding, the dominating phase of the TiO2 pattern in all the samples by the XRD peaks (Figure 1) within the angle range of 2θ (5° > 2θ > 70°) is anatase corresponding to the JCPDS Files No.21-1272 [33,34]. The peaks observed at 2θ values of 25.28°, 38.68°, 48.16°, 54.05°, 62.87°, and 68.98°, respectively, are attributed to 101, 112, 200, 105, 211 and 116 crystalline structures of the anatase (Ʌ) plane. The lowest Bragg angle of the anatase (Ʌ) phase is around 25.28°, and that of rutile (ℜ) is about 27.45°. Activated carbon being an amorphous material is being revealed (Figure 1) by the broad bump of A–TiO2 around 2θ = 25.28°. Adding to this, the reflection peak in the A–TiO2 of the anatase around 2θ = 25.67° decreased, whereas the rutile peak at 2θ = 27.45° (002) became sharper and stronger. However, the anatase peak in the Z–TiO2 remained unchanged, even though the rutile peak intensity heightened. The most intense reflection of clinoptilolite (Z) was found at 2θ = 9.88°. Conversely to this result, Zhong et al. [33] suggested the steadiest rutile polymorph of TiO2 observed at 2θ = 27.45° of the Z–TiO2 displayed the same signal characterized for natural zeolite (clinoptilolite). In terms of A–TiO2, there is no peak at the 2θ = 24.67° position, which is generally characterized as a crystalline plane (002) of activated carbon (A), which seems to be isolated by the TiO2 (anatase peak at 25.28°). This makes A–TiO2 be in an amorphous state, by its carbon suppressing the TiO2 (anatase peak at 2θ = 25.45°) transition to reveal the rutile peak at 2θ = 27.45°. Additional, peaks at 2θ values of 52.06° (004), 55.2° (211) and 58.68° (204) of A–TiO2 and Z–TiO2, aside it being rutile, might also be attributed to reflections of crystallographic phases of impurities as some are depicted in Table 1. Additionally, the anatase being the predominant phase, therefore, expedited the nanocomposite for the photocatalytic activity [35]. Furthermore, the dominant crystal size (22–34 nm) of TiO2 present in the nanocomposites (A–TiO2 and Z–TiO2) as anatase was calculated by using the Scherer’s Equation (1) and the diffraction peak at the 2θ = 25.28° (101) plane [27], where is the wavelength of X-ray radiation (CuKα = 0.15406 nm), K is a constant taken as 0.98, β is the first line width at half maximum height (FWHM) of the peak (determined using Origin software, version 2018), and θ is the diffracting angle (2θ = 25.28° for 101 planes).
where is the wavelength of X-ray radiation (CuKα = 0.15406 nm), K is a constant taken as 0.98, β is the first line width at half maximum height (FWHM) of the peak (determined using Origin software), and θ is the diffracting angle (2θ = 25.28° for 101 planes).
2.1.2. Morphological Analysis
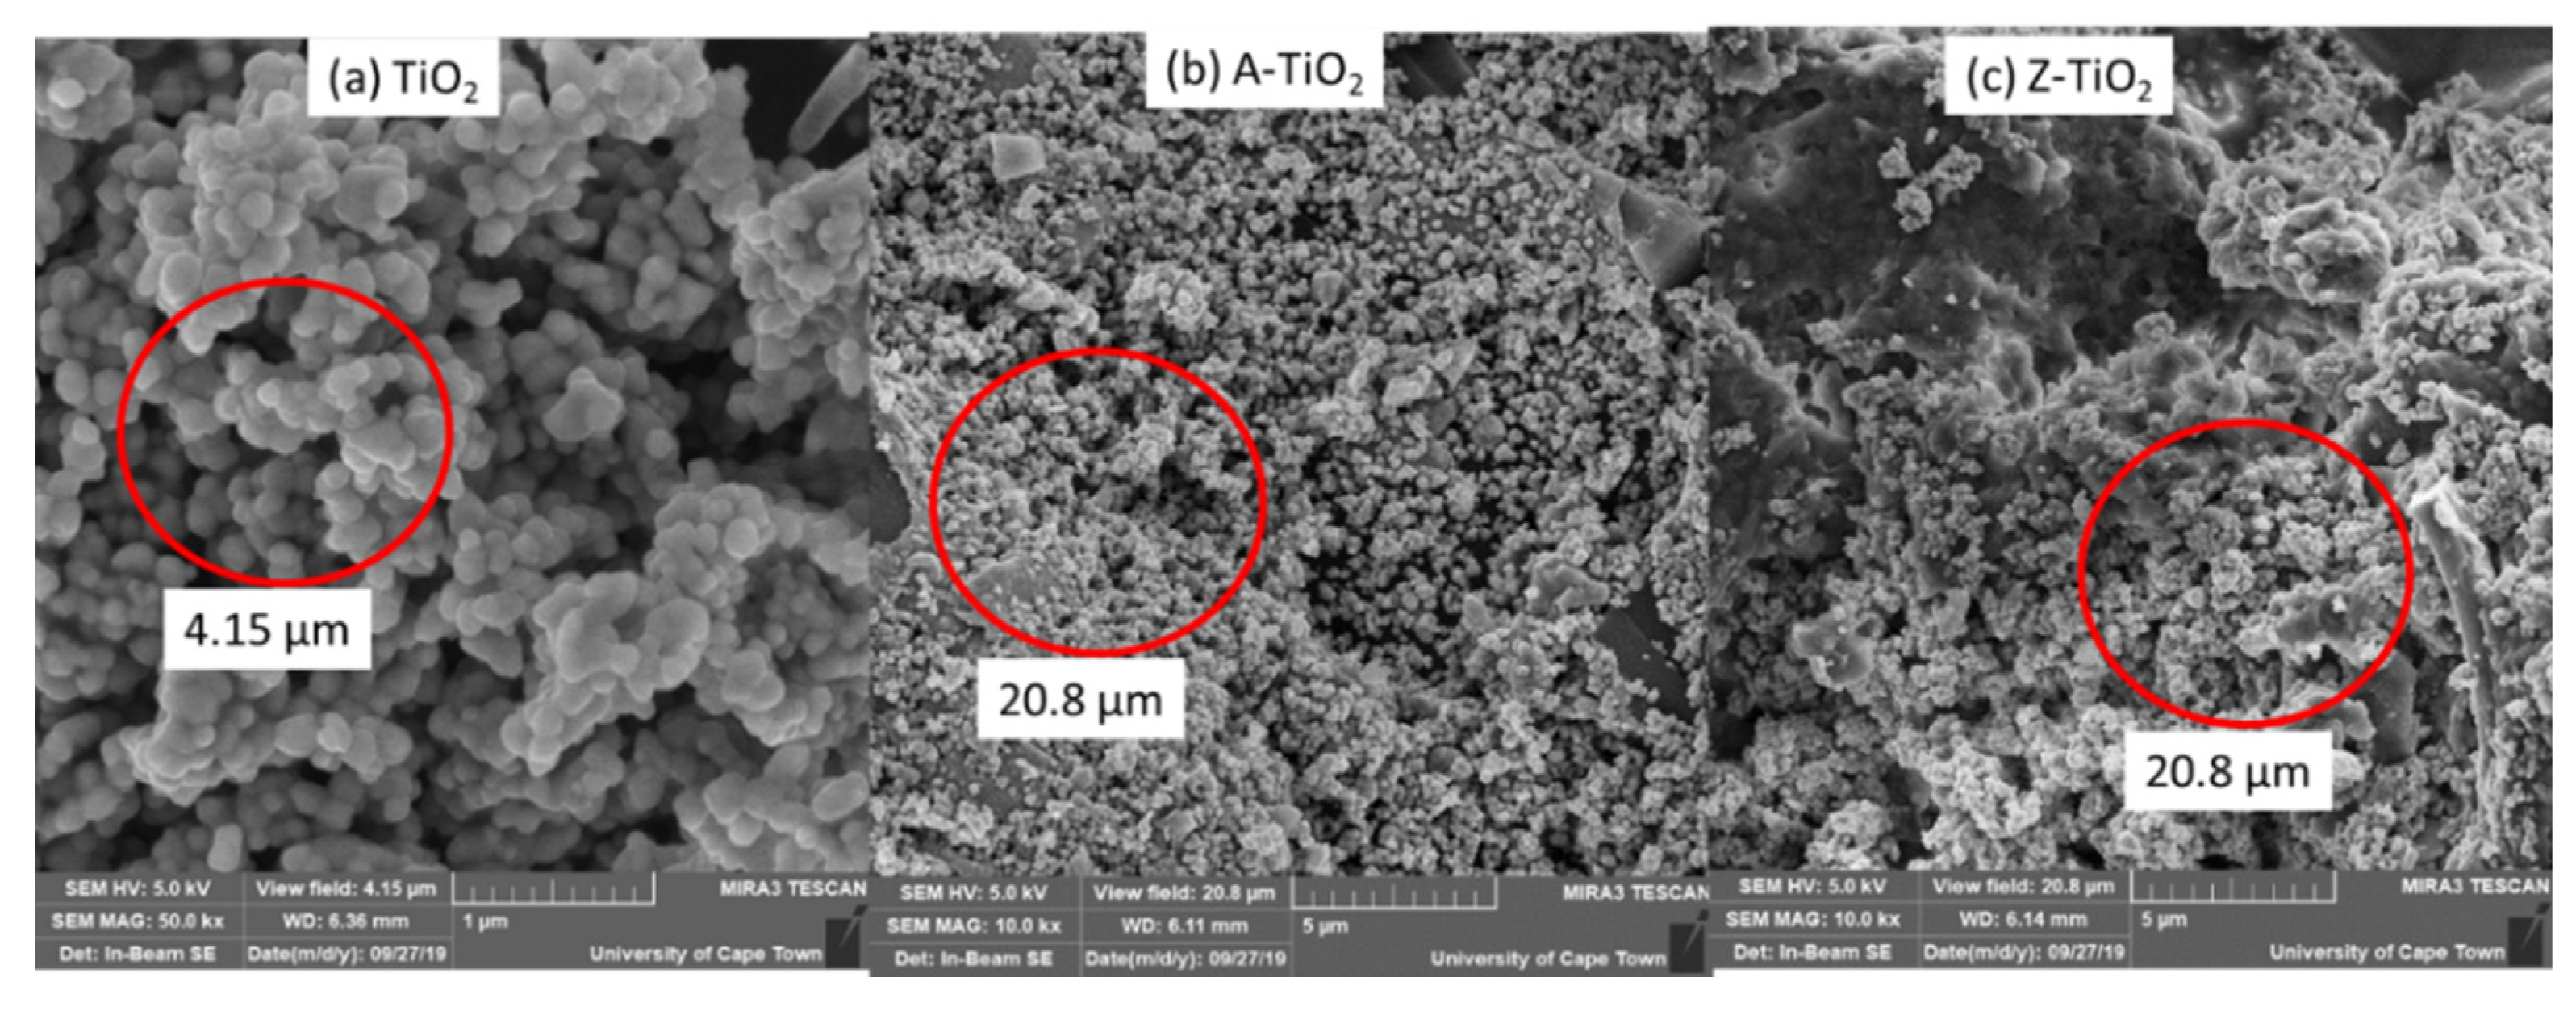
Scanning electron microscopy (SEM) at the University of Cape Town, South Africa was employed to characterize the surface morphologies of the TiO2, A–TiO2, and Z–TiO2 nanocomposites, and the results obtained are presented in Figure 2. It is observed (Figure 2a) that the TiO2 with no covering has very hexagonal and unformulated structures with abundant pores to accommodate other materials [31,33,35]. The average grain size (Figure 2a) of the pores was 4.15 µm under the scale of 1 µm with a magnification of 50 kx and a working distance (WD) of 6.36 mm. Conversely, for the A–TiO2 and Z–TiO2 representing a WD of 6.11 mm (Figure 2b) and 6.14 mm (Figure 2c), respectively, a grain pore size of 20.8 µm under the same scale of 5 µm and magnification of 10 kx was obtained.
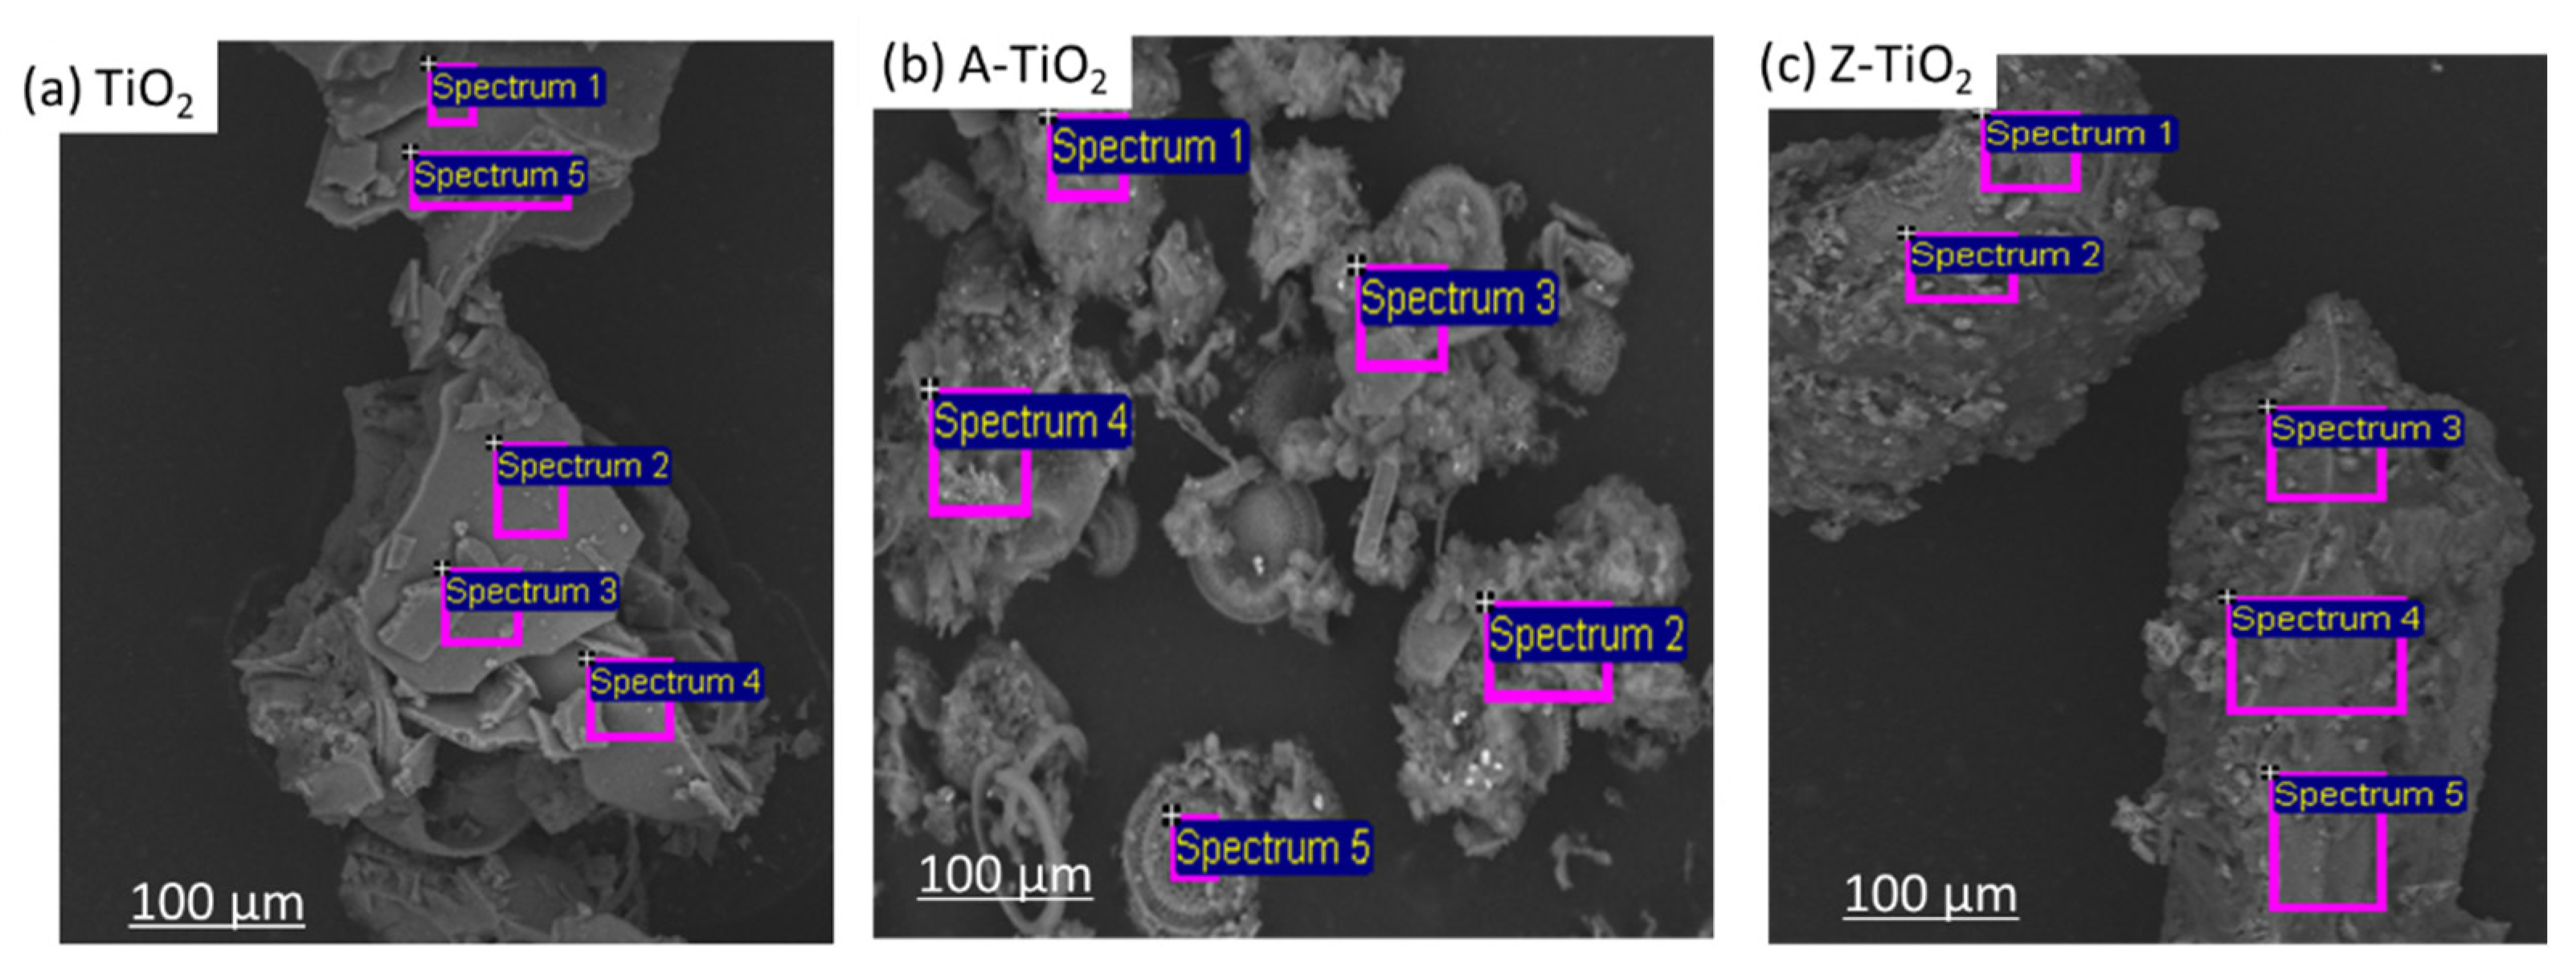
Subsequently, the EDX images at 100 μm for the TiO2 (Figure 3a), A–TiO2 (Figure 3b), and Z–TiO2 (Figure 3c) revealed the possible hybridization with well-dispersed TiO2 on the A–TiO2 and Z–TiO2 nanocomposites. Evidently, the hexagonal structure (Figure 3a) of TiO2 nanoparticles was well dispersed and intertwined on the surface of A–TiO2 or Z–TiO2 [33], which transformed their surface structures (Figure 3b,c). The porous and agglomerated structures are revealed in the A–TiO2 (Figure 3b) and Z–TiO2 (Figure 3c). However, the surface chemistry of A–TiO2 or Z–TiO2 with other elements present, as shown in Table 1, may have obstructed the TiO2 surface coating and photocatalytic activities. The elemental compositions of the TiO2, A–TiO2, and Z–TiO2 nanocomposites, is shown in Table 1. This revealed the elements in the TiO2 (O > Ti > C > Na) were distinctively present in the A–TiO2, and Z–TiO2 which proofed the success of hybridizing the nanocomposite. Considering the elemental structures, Z–TiO2 contained O > Ti > C > Si > K > Al > Na > Mg > Ca, where Si, Al, O and other cationic elements forms the internal framework of Z [34,35]. The unique pores of Z provided a large surface area and improved the homogeneous dispersion of TiO2 nanoparticles on the surface (Figure 3c) of A–TiO2 constituted O > K > C > Ti > Cl > Al > P > Si > Ca > Mg > S, whereby most of the cationic carriers suppressed the presence of the Ti composition (Figure 3b). In addition, the strong synergy between Al and Si decreased the charge carriers of the Ti as there is a high possibility of forming composite oxides [33,35].
2.1.3. Molecular Structures and Functional Groups
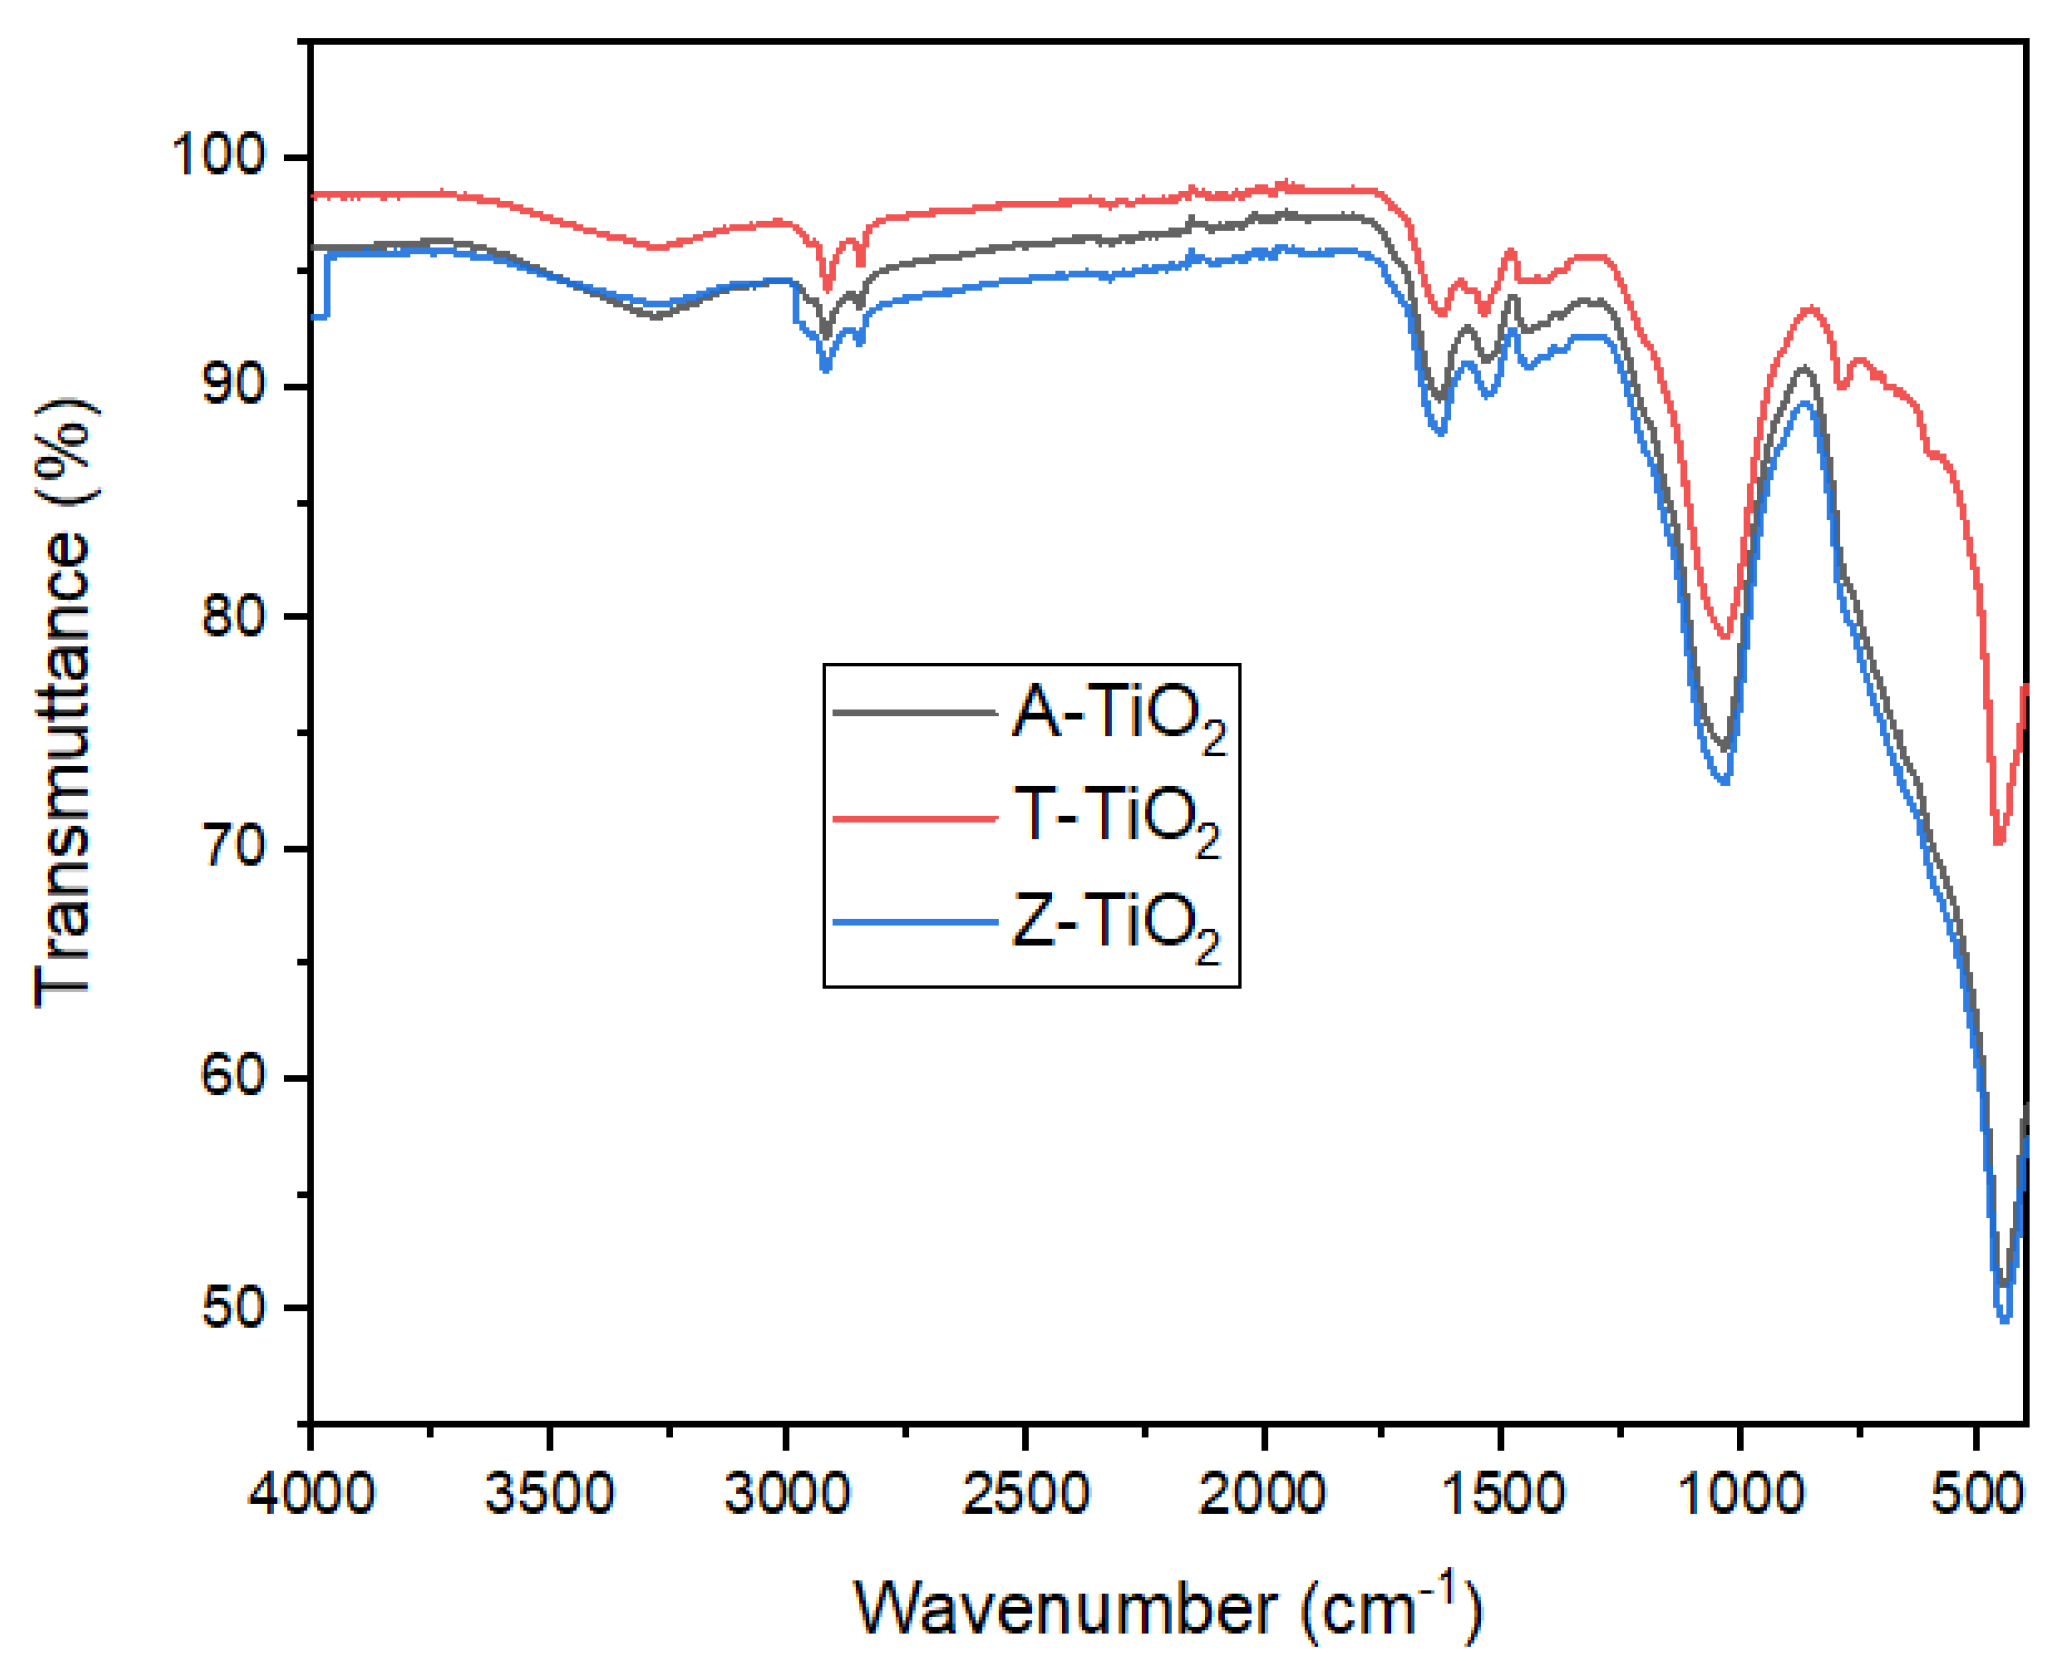
The nanocomposites (A–TiO2 and Z–TiO2) and TiO2 were furthermore analyzed by Fourier-transform infrared (FTIR) spectroscopy. The chemical bonds and functional groups within a fingerprint region of wavenumber of 400–2000 cm−1 revealed by the FTIR spectra are presented in Figure 4. The spectrum also reveals the vibration bands between the reactive hydroxyl groups, as well as the hydrophilic nature of the TiO2 [28,36]. The peaks observed around 3250 cm−1 was attributed to the strong vibrations of OH groups bonded with water or TiO2, where the shift in the OH bonding or the overlayer might be due to the combined A or Z with the TiO2. The peaks detected around 1630–1820 cm−1 were ascribed to the OH and C=O vibration band. The single band around 1635 cm−1 associated with the vibration mode of the Ti-O bond and other oxygenated functional groups [30,33]. The weak absorption band around 1590 cm−1 and 1450 cm−1 for the A–TiO2 and Z–TiO2 were attributed to the carboxyl (C-OH/C-H) and hydroxyl (H-O-H) bending vibration mode, which might have occurred by the nanocomposite adsorbing moisture during the preparation [36]. Furthermore, the broad and weak peaks observed around 1070 cm−1 for the A–TiO2 and Z–TiO2 might also be due to the modification of the TiO2 spectrum being attributed to the C-O-C stretching vibrations [36,37]. Finally, the broad peaks within the range of 400 cm−1 to 1000 cm−1 may be instigated by the vibration stretch of Ti-O and –OH, as observed in all the samples [35].
2.2. Photocatalytic Degradation
2.2.1. Effect of pH on Photocatalytic Degradation
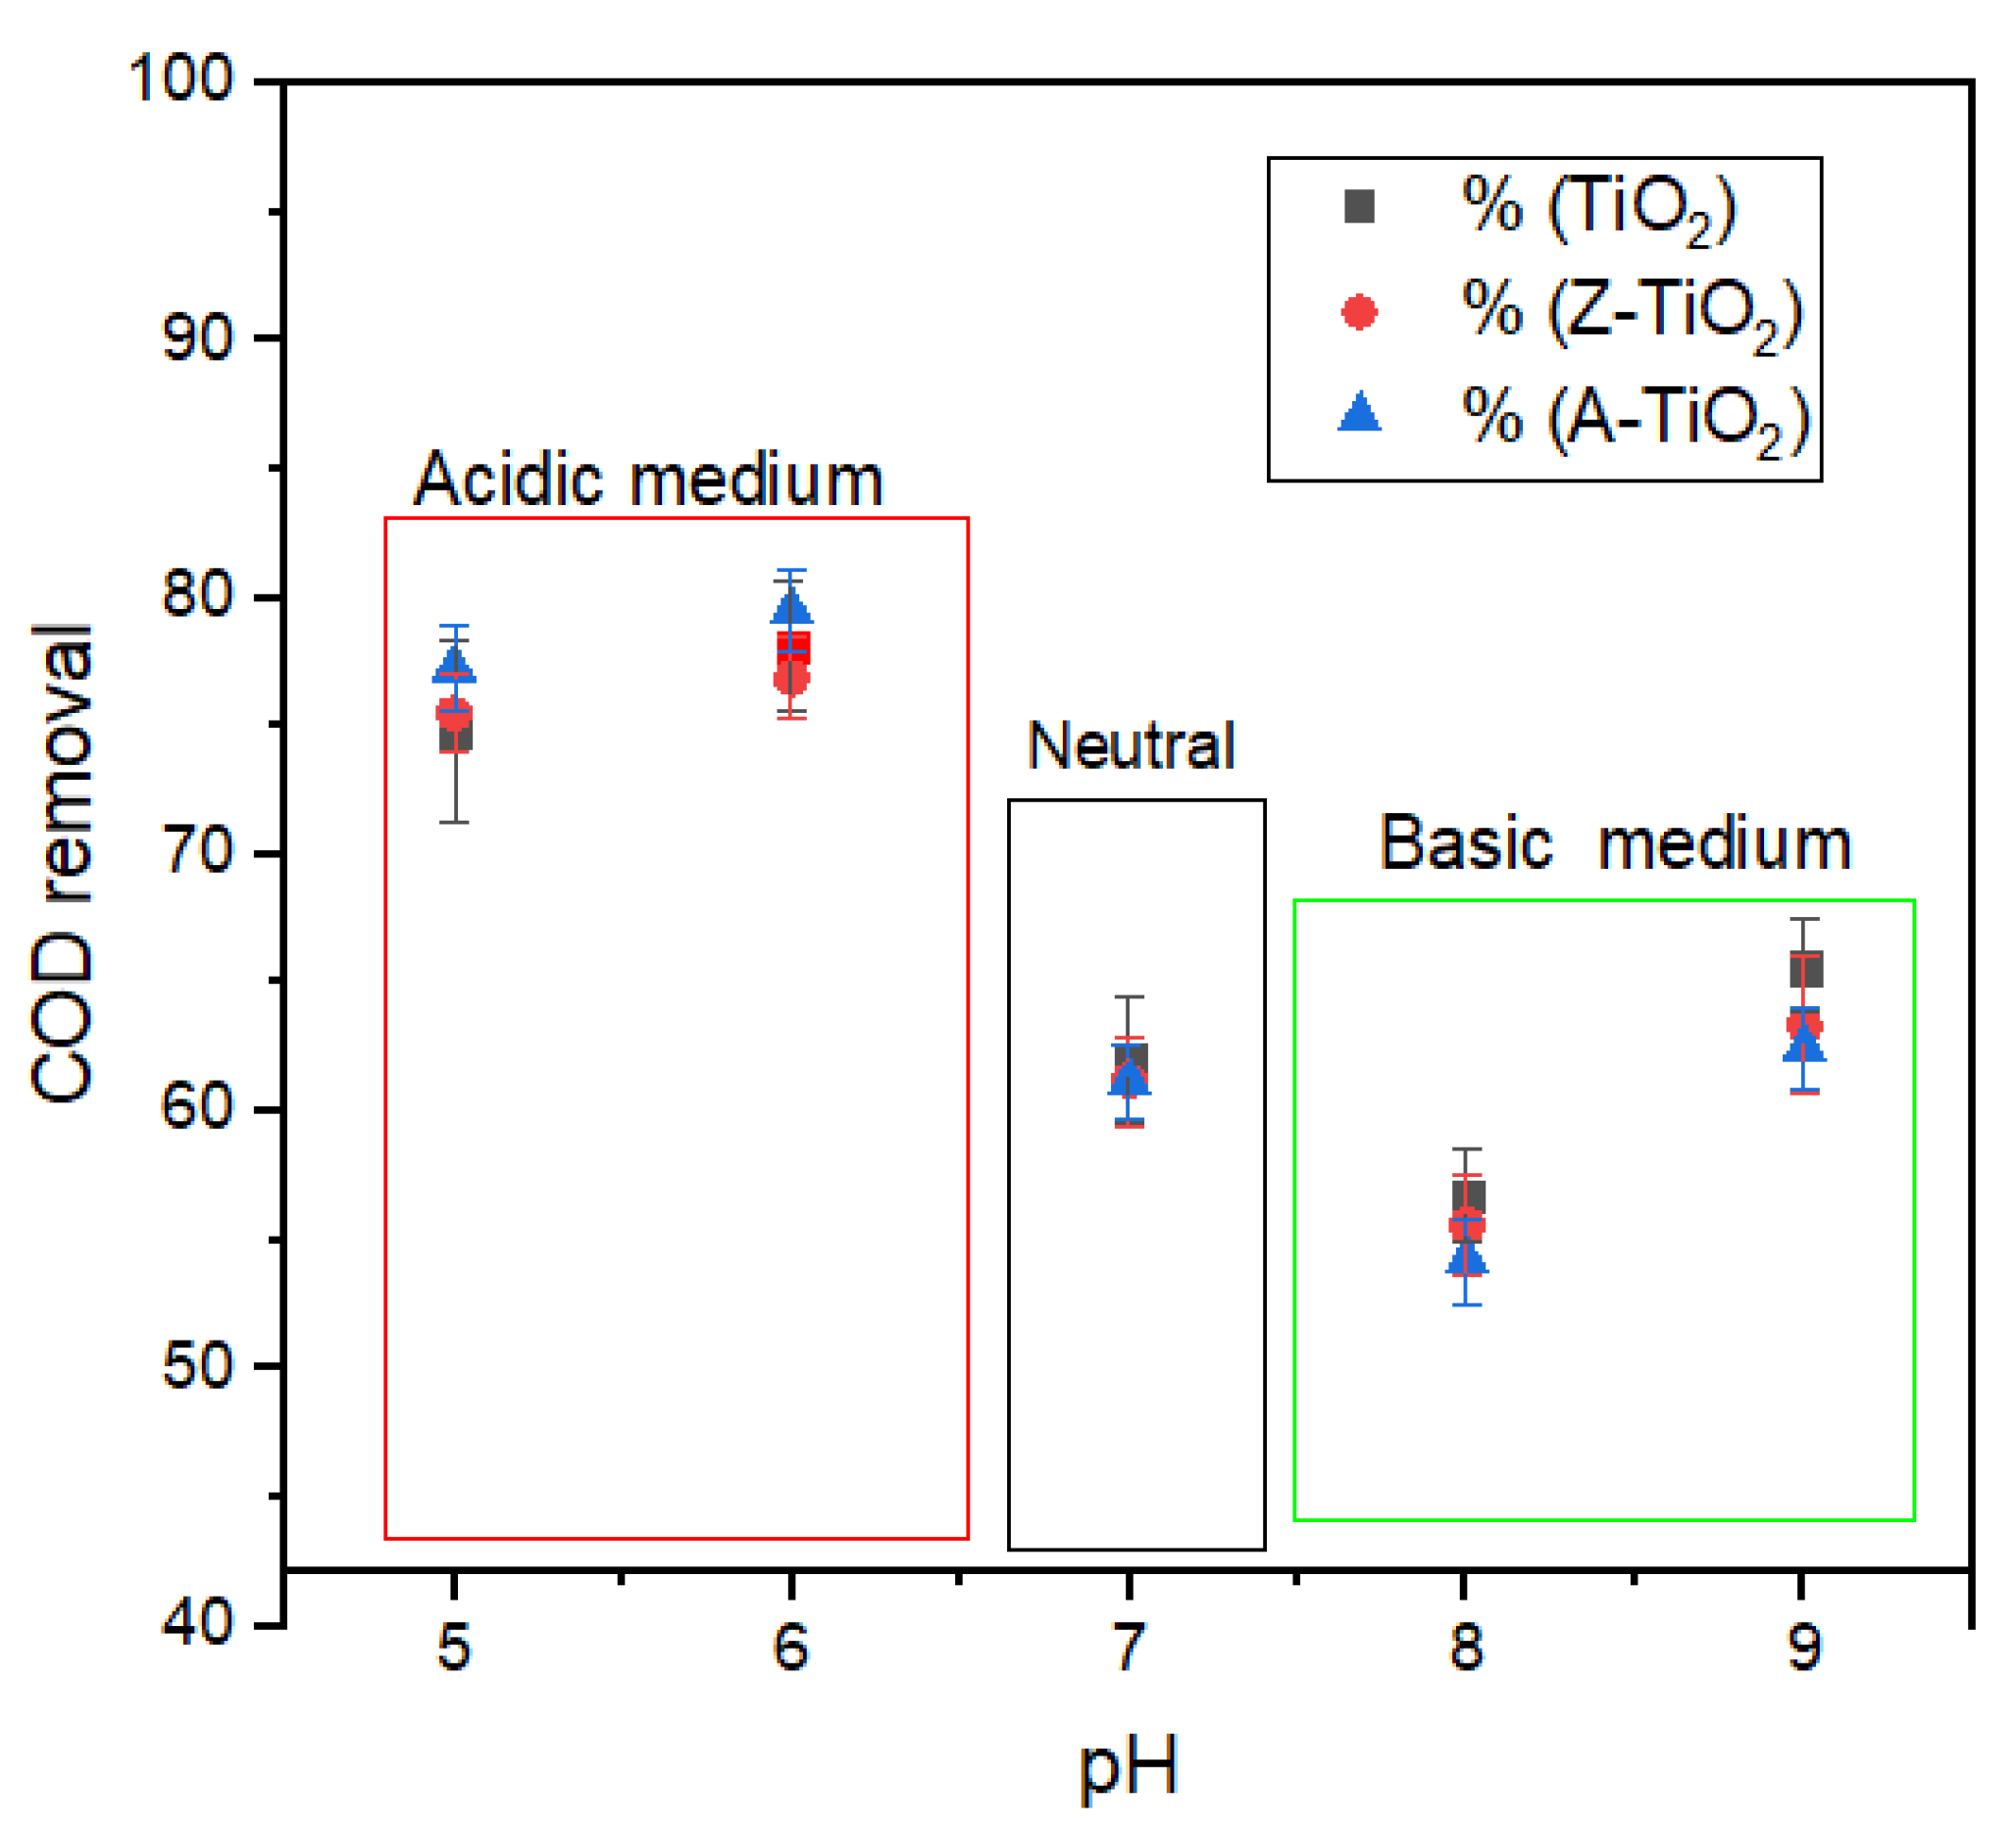
The pH of an effluent strongly plays an important role in photocatalytic degradation of organic compounds, such as dyes in an aqueous suspension with TiO2 NPs. First and foremost, the pH of the BPB synthesized effluent was investigated to ascertain the TiO2, Z–TiO2, and A–TiO2 photocatalytic activities on COD removal. This was carried out by varying the pH of the effluent from 5–9 while keeping the catalyst load and reaction time constant at 2 g and 30 min, respectively. Figure 5 shows the degradation efficiency obtained by the TiO2, Z–TiO2 and A–TiO2 on the COD removal. Evidently, the pH affected the adsorption shift of the organic substrates onto the surface of the photocatalyst as well as their photodegradation efficiency from the neutral to the acidic and basic mediums. The degradation efficiencies recorded for the acidic medium (pH 5–6) were 75–79%, 75–77%, and 77–80% for TiO2, Z–TiO2 and A–TiO2, respectively. Under the neutral medium, almost the same degradation efficiency of about 63% was recorded for all the catalysts. In the basic or alkaline medium (pH 8–9), the degradation efficiency of 66%, 64%, and 63% was, respectively recorded for the TiO2, Z–TiO2, and A–TiO2. The results confirm the occurrence of photocatalysis on the surface of NPs are mostly influenced by their charged ions and the pH of the solutions [18,24]. Thus, the charged ions and change in pH promoted the pollutant’s stability, neutralization, agglomeration, and adsorption onto the photocatalyst surface [24]. The high acidic medium-efficiency can be attributed to the presence of negatively charged contaminants in the effluent, which were attracted and adsorbed onto the surface of the positively charged photocatalysts (TiO2, Z–TiO2 and A–TiO2) [21,24]. In addition, the low-efficiency exhibited within the basic medium (pH 8–9) may be due to the electrostatic repulsion between the positively charged NPs and the cationic charges in the solution.
2.2.2. Effects of Photocatalyst Dosage
The photocatalytic performance of single (A, Z, TiO2) and binary nanocomposites (A–TiO2 and Z–TiO2) were investigated by measuring catalyst-load-dependent degradation of the COD (367.7 mg/L), and color (458 Pt. Co) initial concentrations from the BPD simulated effluent under a UV-light. The effluent pH was kept constant at an acidic medium of 6.5 to enhance the protonation of the active sites of the catalyst. Subsequently, to ascertain the optimal dosage (2–4 g) of the nanocomposites (A–TiO2 and Z–TiO2), first, the load (1–6 g) of a single catalyst (A, Z, and TiO2) was investigated at the reaction time of 30 min.
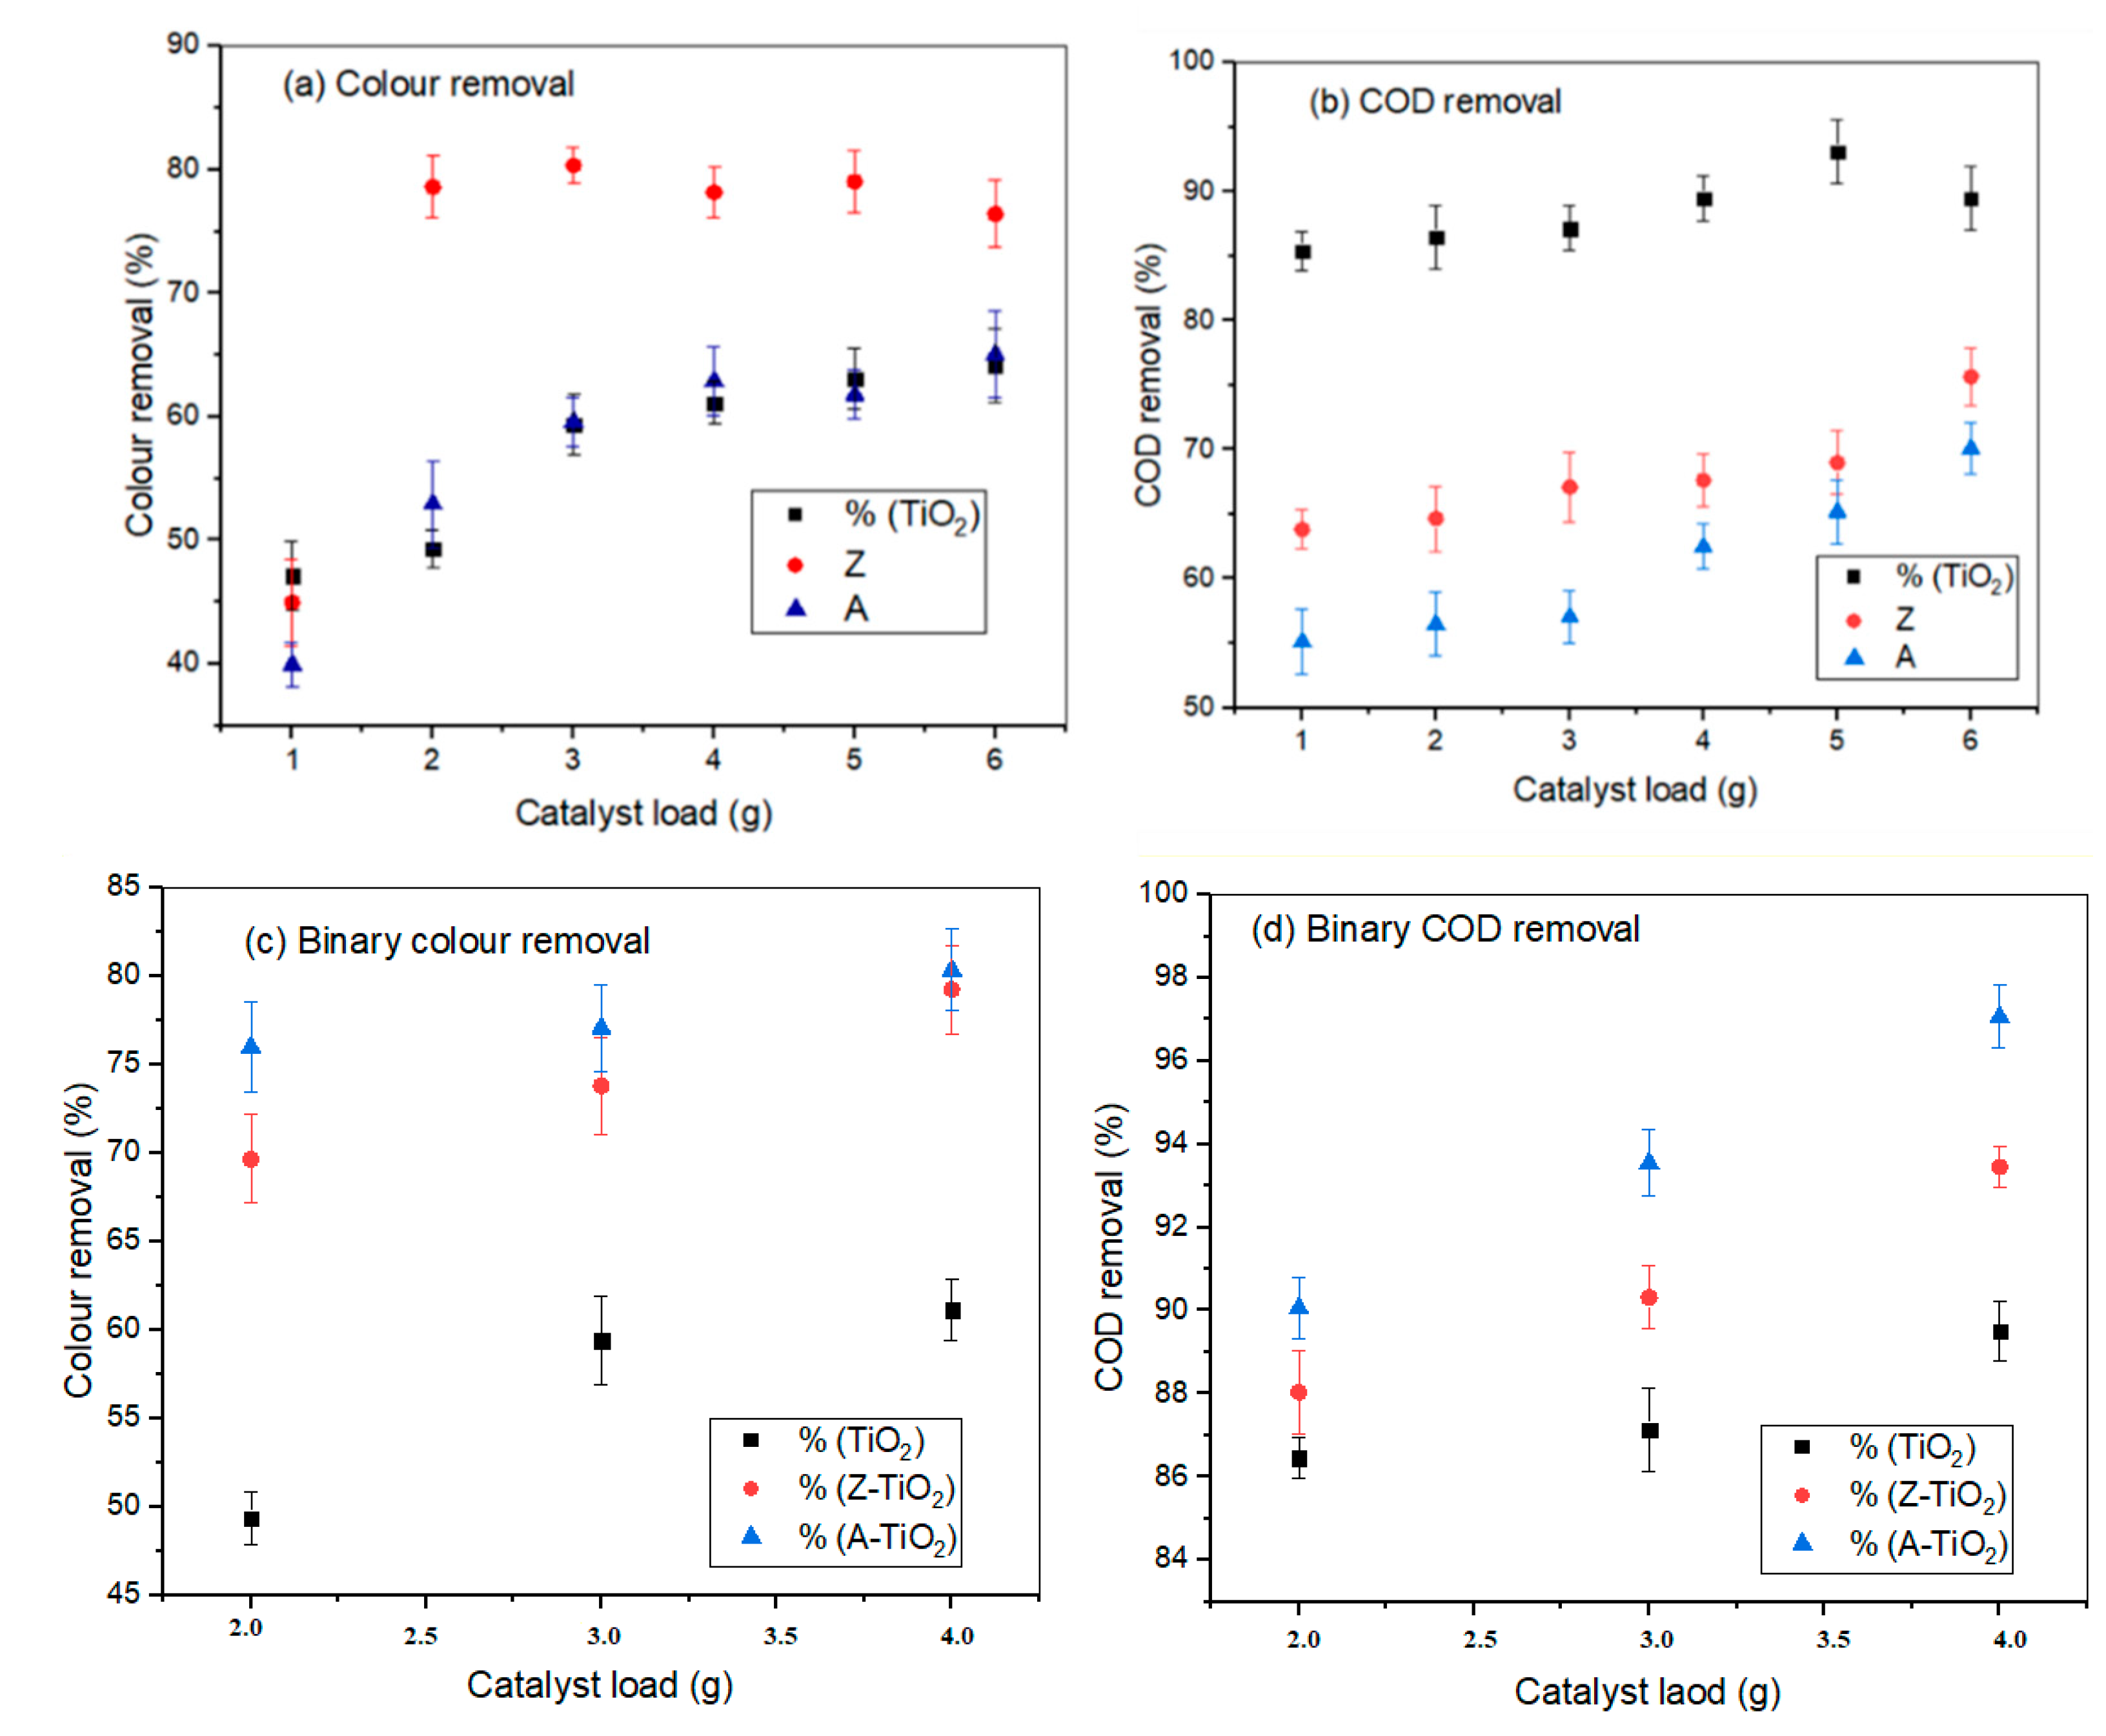
Figure 6 shows that photocatalytic degradation efficiency increased with an increase in the catalyst load until an optimal dosage is attained. As seen (Figure 6a,b), an increase in the catalyst load (1–5 g) promoted the photodegradation rate with more active sites, whereby after the optimal load (5 g), there was a degeneration as compared to the A and Z loads at 6 g. Thus, an increase in the active sites of the catalyst surfaces was too dense to interact with the contaminant, thereby destabilizing and deactivating them as they agglomerate [20,30]. At a single catalyst load of 5 g, about 60–80% and 65–90% of the initial concentration of color (Figure 6a) and COD (Figure 6b) was respectively removed. In addition, the increasing order of the single catalyst loads was observed for the color (Z > TiO2 > A) and COD removal (TiO2 > Z > A).
Evidently, the single catalyst load results favored the TiO2 due to its high active sites and hydroxyl radicals, which entrapped the contaminants [31,32]. This affirms that the photocatalytic nature of TiO2, once activated by UV radiations, produces a very reactive species, which led to the degradation of the organic substance in the solutions [29,36]. However, in the subsequent investigation of the nanocomposites in 1:1 ratio (A–TiO2 and Z–TiO2) loads (2–4 g), there is a prompt increase in the contaminant removal efficiency (Figure 6c,d) as compared to the individual components (Figure 6a,b). Thus, the TiO2 in the nanocomposite was photo-activated by producing a high amount of the hydroxyl radicals [30,36]. Thus, an increase in the nanocomposite load to a high level (4 g) produced more of the photogenerated electron holes [37]. This increased the removal efficiency of the A–TiO2 by 20% as compared to the TiO2, for the removal of color and COD, as shown in Figure 6c,d, respectively. In addition, the increasing order of color ((Figure 6c) and COD (Figure 6d) removal by the catalyst was found as A–TiO2 > Z–TiO2 > TiO2. However, among the nanocomposites, activated carbon (A) is recounted as a good electron acceptor, whereas TiO2 is also known to be an effective electron donor [33,34]. Consequently, the A–TiO2 was found to be very effective in suppressing the photogenerated species from destabilization during overload as compared to that of the TiO2 [35,37]. Therefore, the synergistic effect of hybridizing A–TiO2 (Figure 6) eventually reduced the destabilization of the hole-pair electrons at the high dosage which increased its efficiency [36].
2.3. Adsorption and Photocatalysis
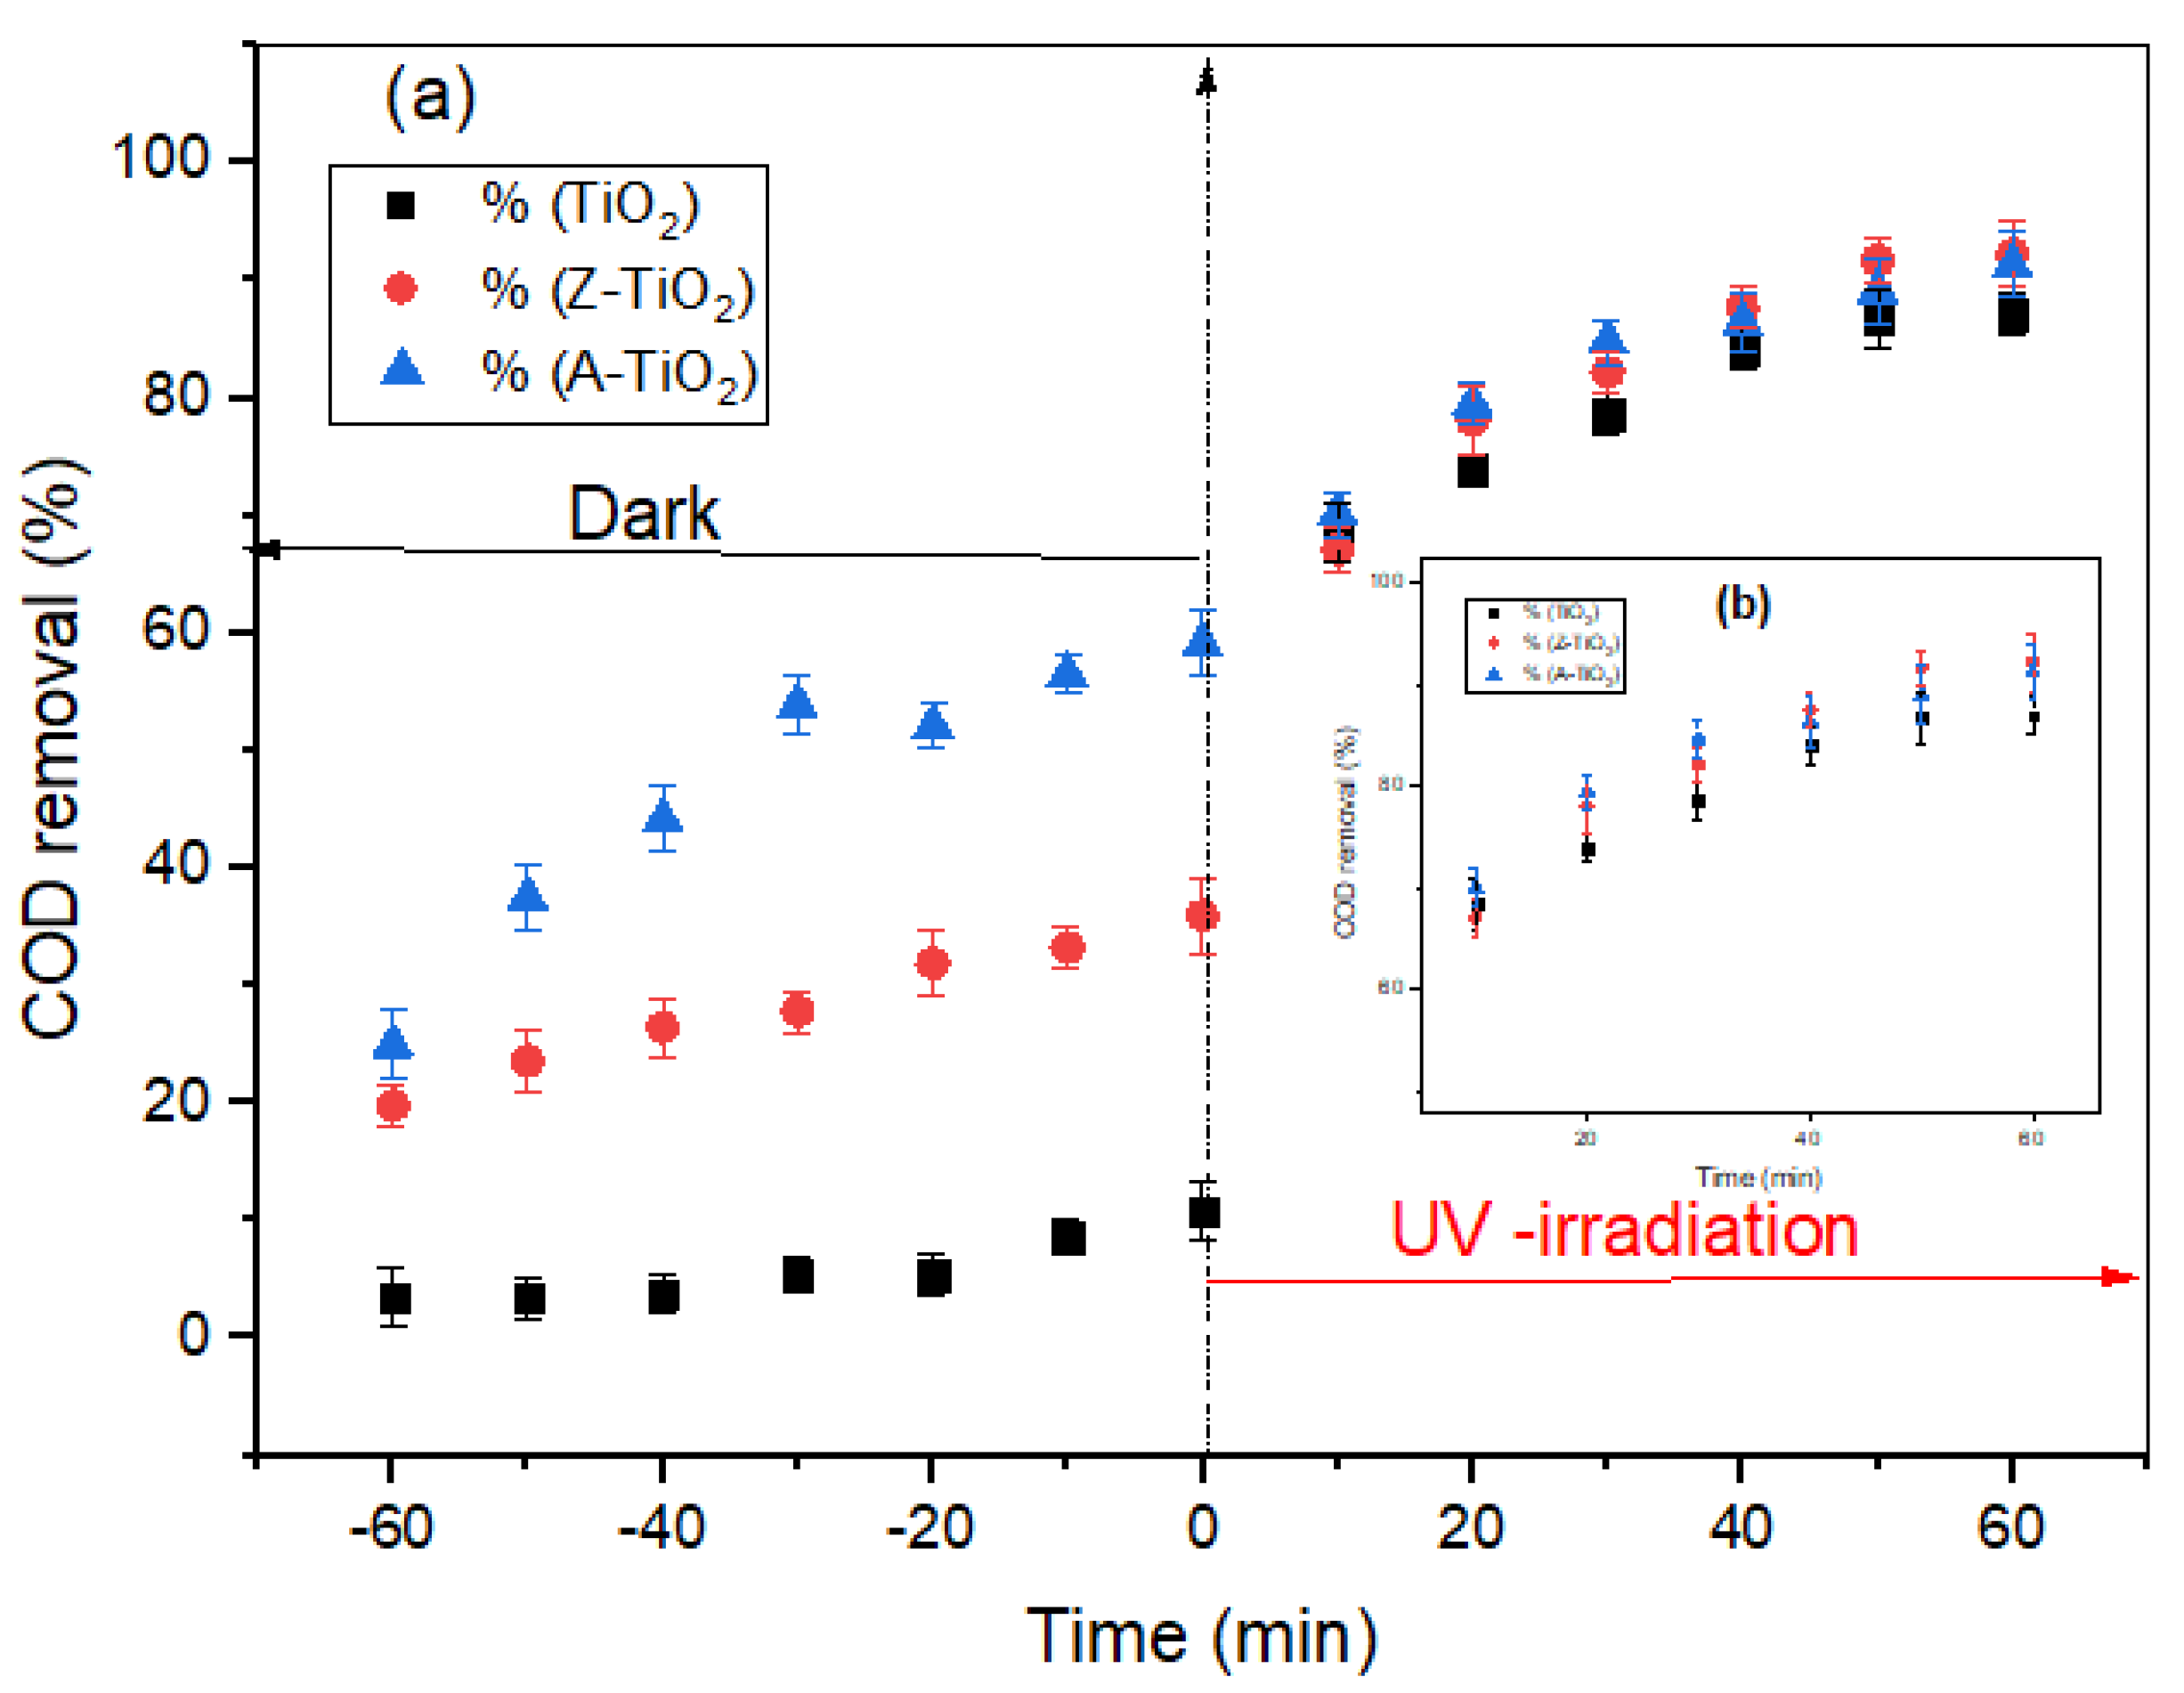
Figure 7 presents the adsorption and photocatalytic degradation performance of the nanocomposites (A–TiO2 and Z–TiO2) and TiO2, which were simultaneously achieved with a catalyst load of 4 g by monitoring the removal of COD. Firstly, the dark adsorption (no UV-light) was carried out within a stipulated time interval of 60 minutes, after which the solution was illuminated for another 60 minutes to enhance the photodegradation. However, the adsorption and photocatalytic activities of the supported TiO2 (A–TiO2 and Z–TiO2) under the irradiation time of 60 min led to higher degradation (>85% COD) as compared to the unsupported TiO2 (80% COD). In the dark adsorption experiment, TiO2 was seen to be less efficient because of its deactivated reactive sites, which makes it slow to react with other complex compounds. Even though the increasing order (Z–TiO2 > A–TiO2 > TiO2) of the photocatalytic degradation efficiency favored Z–TiO2 (Figure 7b), the hybridized A–TiO2 also had effective adsorptive (Figure 7a) capacity owing to its low density and surface area [33,35]. Thus, the support on TiO2 with A and Z increased the irradiated surface area and adsorption capacity of the TiO2. According to Zhong et al. [33], the high specific surface area of the nanocomposite creates an interface, which tolerates immobilization and destabilization of the photocatalyst to trap the organic pollutants. Results obtained have also confirmed the three steps of the decomposition mechanism of TiO2, such as (i) movement of the excited radicals, (ii) adsorption and photodegradation of the organic pollutants from the bulk solution onto the photocatalyst surface [34].
2.3.1. Kinetic Models
The kinetics of heterogeneous photocatalyst reactions in the slurry is usually described by the Langmuir–Hinshelwood model expressed in (2). However, the degradation and adsorption processes can be monitored either by a first-order (3) or the second-order kinetic models (5) [38,39].
where and represents the reaction rate, the rate constant (mg/min) and adsorption constant (mg−1), respectively. Assuming is negligible at a low concentration, the rate of degradation in (2) can then be expressed as a first-order model (3).
where is the first-order rate constant (min−1). Equation (3) can then be integrated into (4).
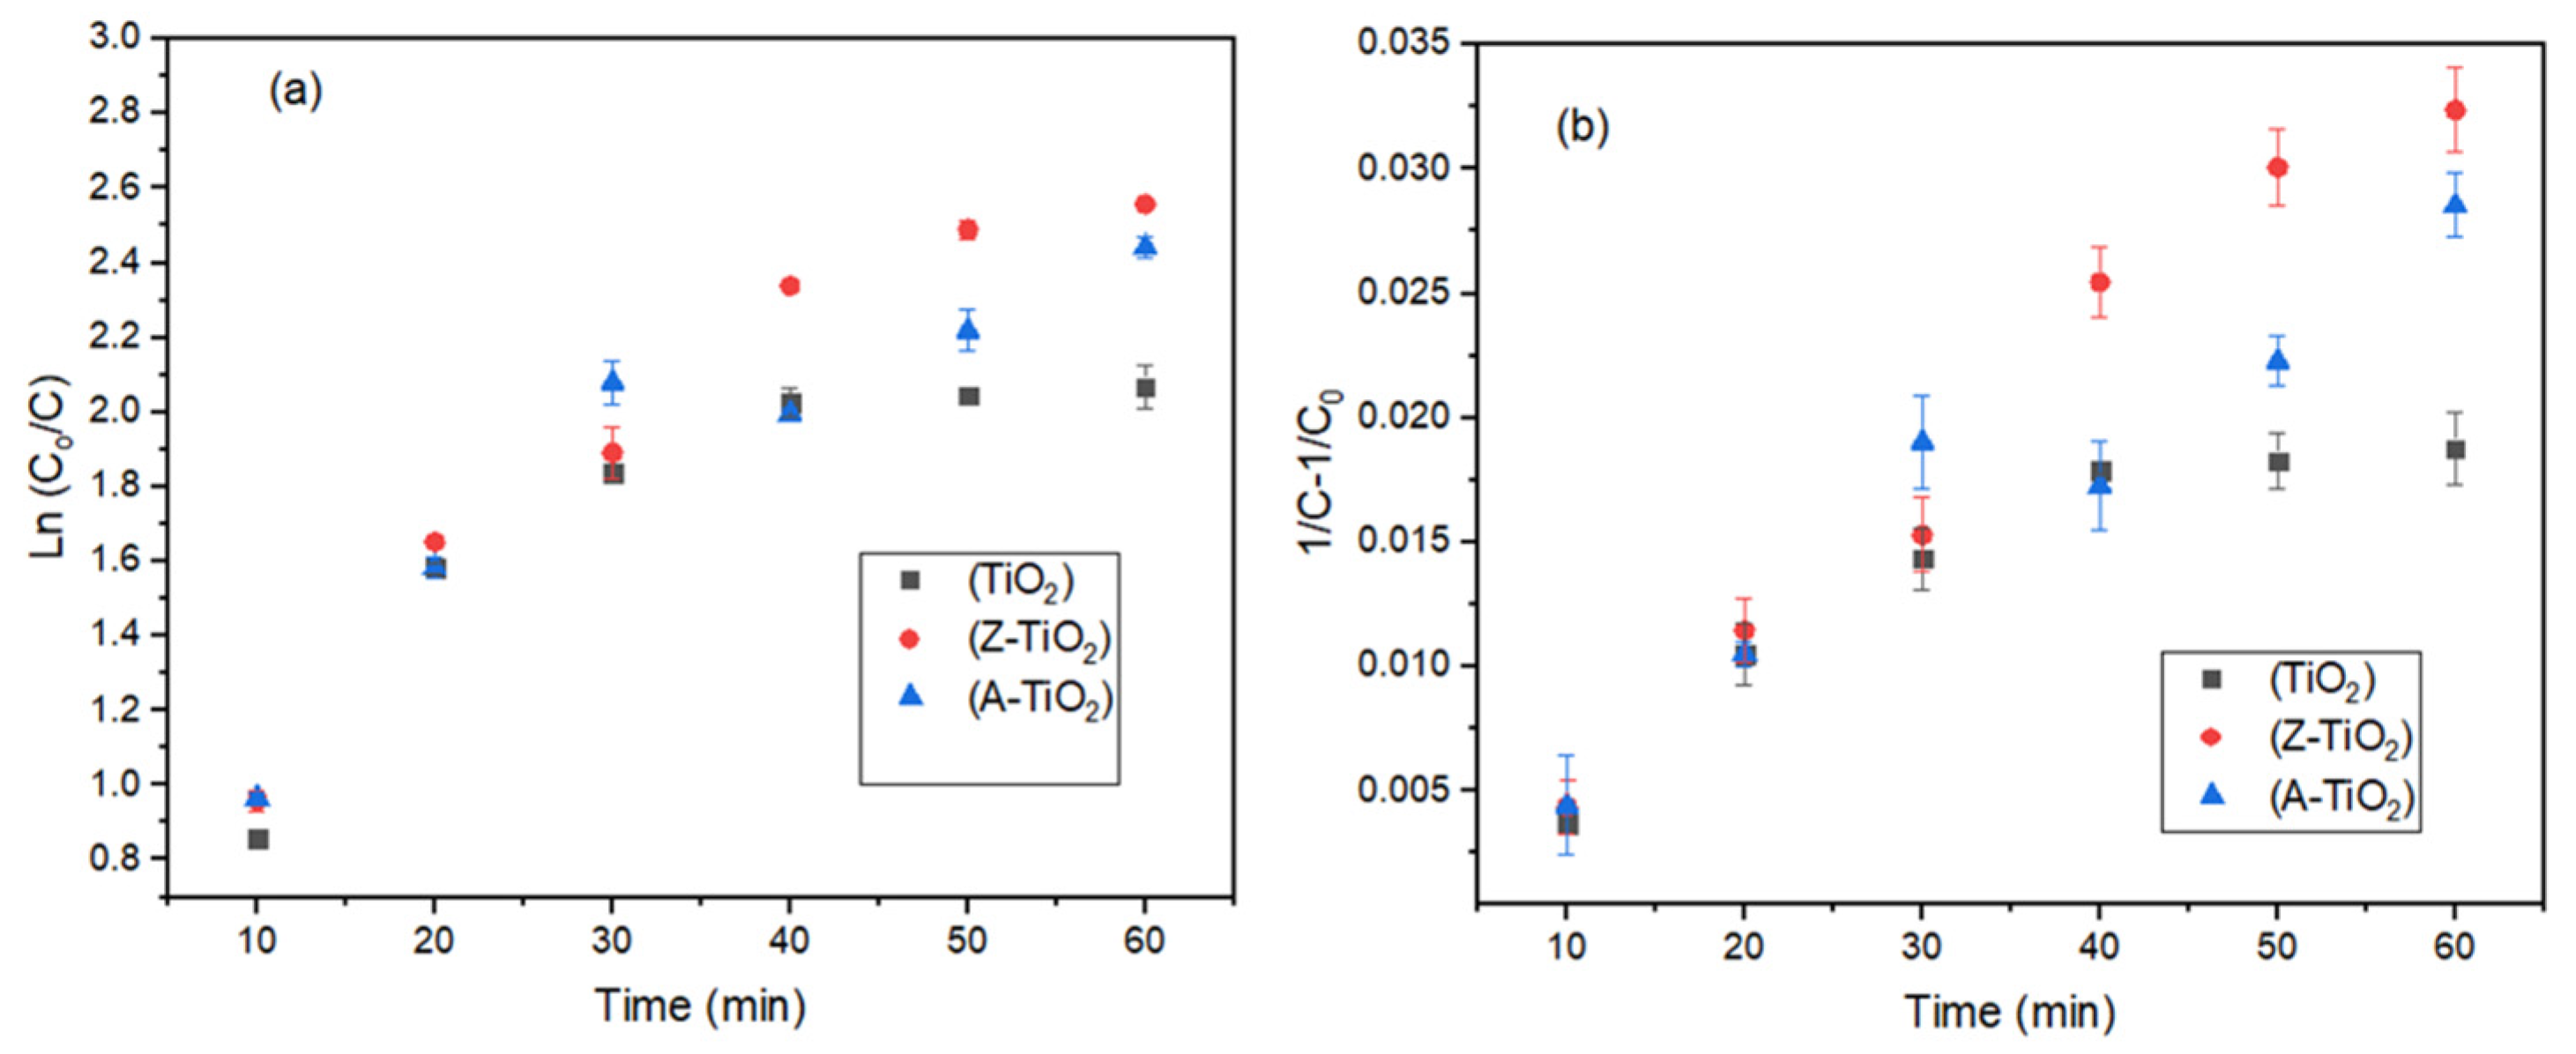
To estimate the rate of reaction constants for the first and second-order kinetic models, (Figure 8a) and (Figure 8b), respectively, was plotted. Where, is the second-order rate constant (min−1), is the initial COD concentration, is time, and is the concentration at the specified time.
Table 2 presents the kinetics data obtained, indicating that the reactions do not fit well on the first-order kinetic model. However, all the reactions fitted well on the second–order kinetic model as observed based on their rate constants (k) and coefficient of determination (R2) values. A 95% confidence level with a difference of less than 0.2 between the and Adjusted , also suggests the significance and accuracy of the model predictability. Additionally, the probability functions (p < 0.05) were significantly different from the zero levels. The increasing order of the and values were seen as Z–TiO2 > A–TiO2 > TiO2, whereby Z–TiO2 had the highest values of 5.63 × 10⁻⁴ min−1 and 0.989, respectively. This validates the trend observed for the highest removal of the COD by photocatalytic degradation (Z–TiO2 > A–TiO2 > TiO2), as shown in Figure 7, the data obtained favored the second–order kinetic model. In addition, the adsorbates (A) presence in the nanocomposites (A–TiO2) suppressed the TiO2, which made it more favorable for adsorption [40,41].
2.3.2. Kinetic Isotherms
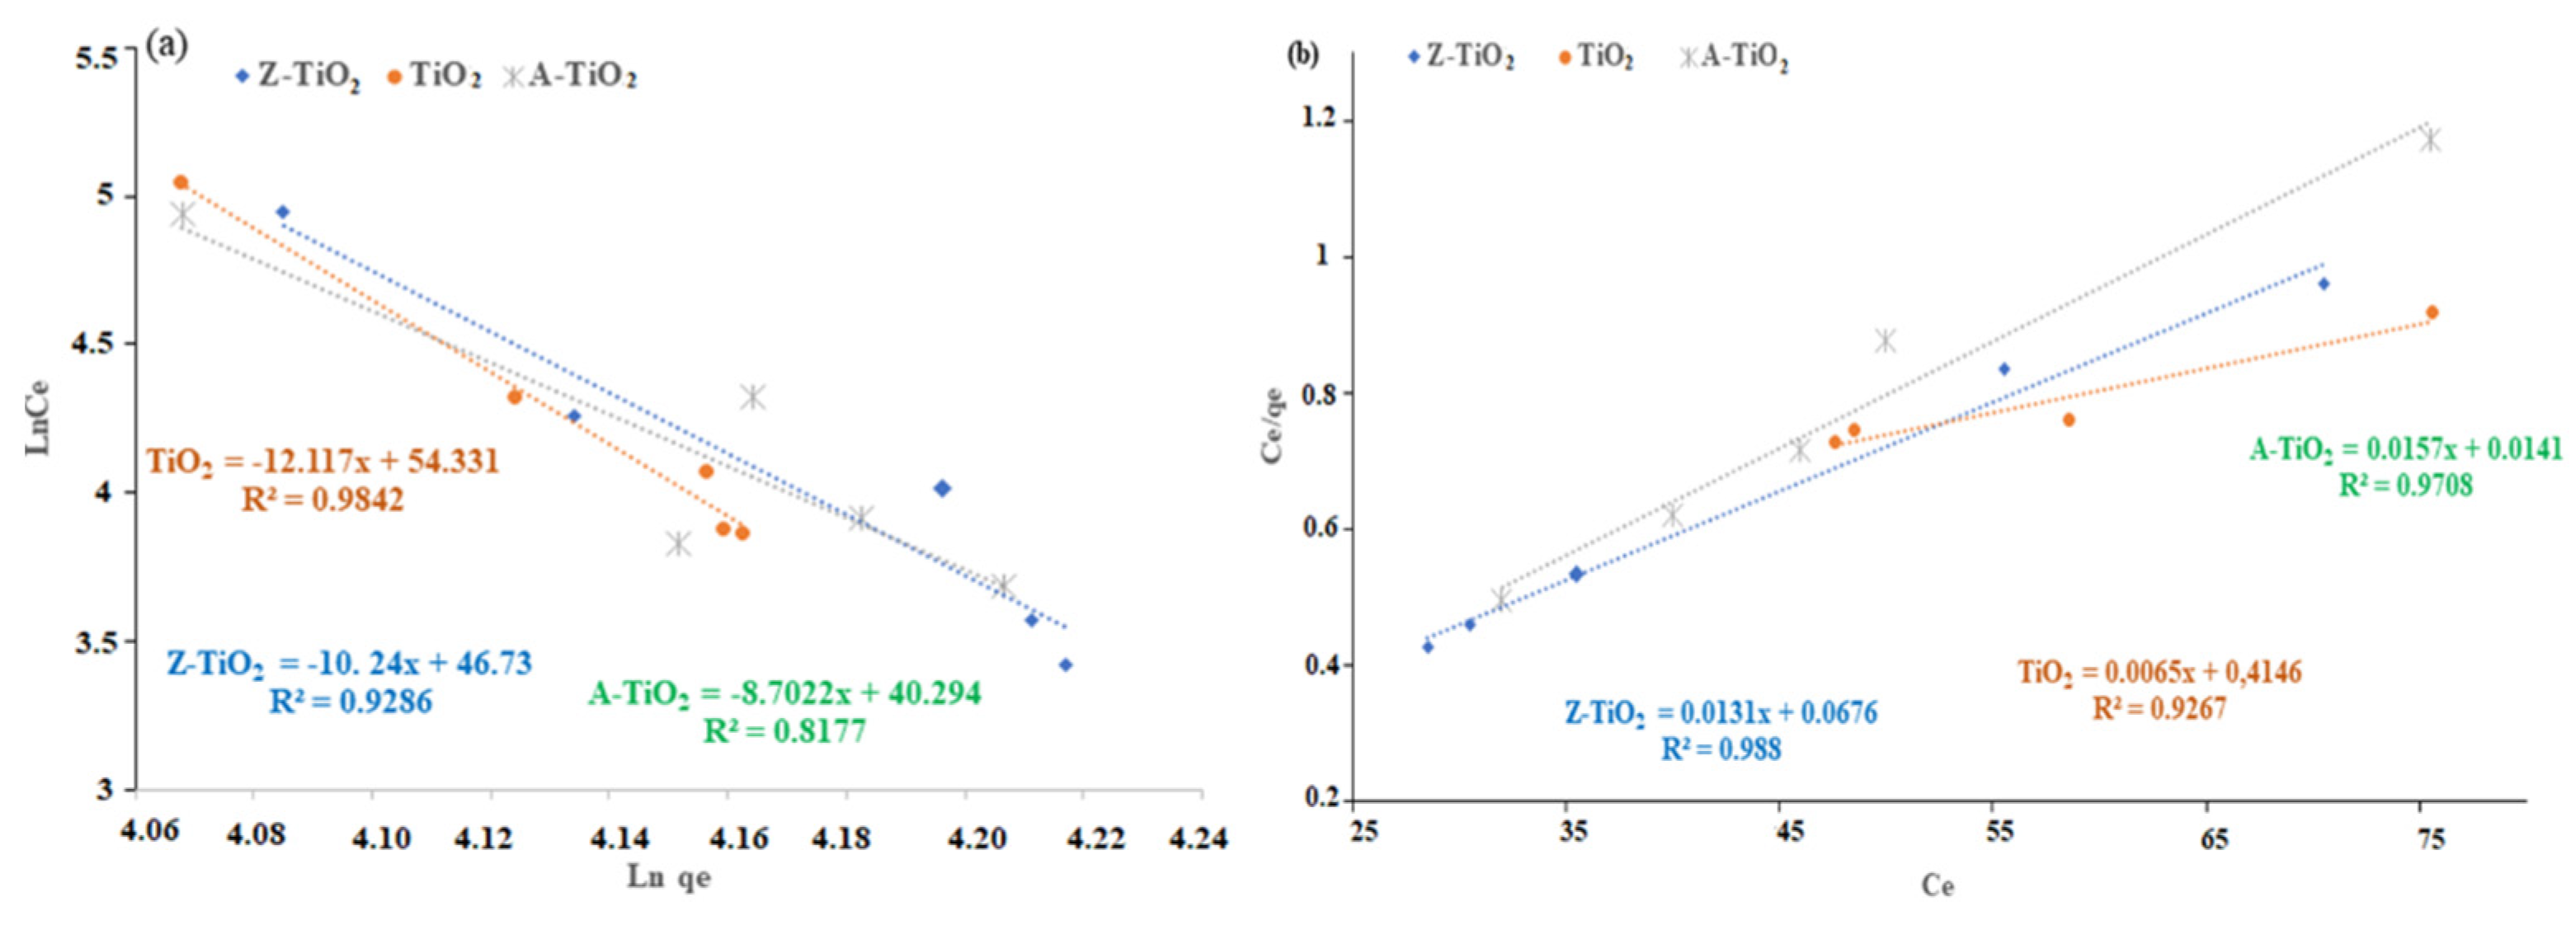
Figure 9 presents Freundlich and Langmuir isotherms best fits of the data obtained from the adsorption of COD. The adsorption was done in the dark until equilibrium was achieved, whereas the photocatalytic degradation was carried out under UV-irradiation for 60 min. The Langmuir isotherm defined by (6) is expressed in a linearized form as (7).
where, is the adsorbate at equilibrium (mg/g), is the theoretical maximum adsorption capacity (mg/g), is the Langmuir adsorption constant (L/mg) and is the supernatant concentration at equilibrium (mg/L). From (7), a plot of gives a straight line (Figure 9b) with slope and intercept . The Freundlich isotherm described in (8) is expressed in a linear form as (9), where and are the Freundlich isotherm constants representing the adsorbate capacity (mg/L) and intensity, respectively.
A plot of gives a straight line (Figure 9a) with as the slope and as the intercept. The Freundlich isotherm (Figure 9a), which is used for non-ideal adsorption containing heterogeneous surfaces with different affinity, was preferred for the TiO2 adsorption. The order of increasing the deactivated sites towards adsorption in the Freundlich isotherm (Figure 9a) was TiO2 > Z–TiO2 > A–TiO2, whereby TiO2 fits well with the R2 value of 0.984. This confirms that adsorption occurred at reactive sites with different strengths of affinity, whereby the adsorption efficiency reduced (Figure 7) as the reactive sites being occupied increased [38,39]. Conversely, the nanocomposites (Z–TiO2 > A–TiO2) were well fitted with the Langmuir isotherms (Figure 9b), which assumes unchanging monolayer adsorption with no interaction between the adsorbates as compared to TiO2. However, Z–TiO2 was found to fit on both Freundlich (R2 = 0.929) and Langmuir (R2 = 0.988) isotherms. This can be attributed to the heterogeneous surface of Z–TiO2 which, with the presence of the TiO2, makes it possible to exhibit different energy or affinity levels [36,37,38]. Wolf [39], therefore itemized that (i) monolayer adsorption occurs on the adsorbent surface, which has a finite number of similar active sites, (ii) the interaction does not take place between adjacent adsorbed molecules, (iii) the active sites have equal affinities towards the adsorbate molecules and finally (iv) the adsorption process is reversible.
3. Materials and Methods
3.1. Chemicals and Synthetic Effluent
A locally manufactured TiO2 used in this study was supplied by Huntsman Tioxide, South Africa (Pty). Its crystal structure composes of anatase (75%) and rutile (25%) with a mean particle size of 25 nm, specific surface area and density of 48 m2/g and 4.26 g/cm3, respectively. AC with a specific surface area, pore-volume and ash content of 1576 m2/g, 0.967, and 3%, respectively, was supplied by a local South Africa industry (RTB Chemicals). Natural zeolite powder (95–98% of clinoptilolite balanced with silica, 125–250) was supplied by Pratley Minerals, South Africa.
Synthetic textile effluent for the experiment was simulated according to a modified protocol of ISO (9887;1992) to mimic a local South African textile effluent based in Kwazulu Natal province. The constituents of the effluent included bromophenol blue (BPB) dye (505 ± 15 mg/L) and other metal salts of ionic and inorganic derivatives such as Zn (9 ± 75 mg/L), Fe (18 ± 3 mg/L), Cu (25 ± 53 mg/L), Mg (5 ± 15 mg/L), Mn (24 ± 13 mg/L), Al (3 ± 25 mg/L), Ca (33 ± 8 mg/L) and Na (34 ± 22 mg/L) dissolved with deionized water (25 L) [42]. All chemicals used were of analytical grade supplied by Sigma-Aldrich, Johannesburg, South Africa.
Nanocomposite Synthesis (A–TiO2 and Z–TiO2)
The composites (A–TiO2, Z–TiO2) were synthesized based on a modified low-temperature co-precipitation method [31,35]. First, 30 g of AC and 10 g of TiO2 was added to 200 mL of deionized water and sonicated (45 kHz at 80 °C) for 1 h. After the sonication, the samples were oven-dried at 80 °C for 24 h, which resulted in A–TiO2. This was then washed with deionized water, filtered, and dried for 1 hour at 110 °C. Prior to usage, the A–TiO2 was calcined at 600 °C for 1 h at a ramp speed of 15 s. The above procedure was also repeated for the Z–TiO2.
3.2. Characterization of Composite (A–TiO2 and Z–TiO2)
3.2.1. X-Ray Diffraction (XRD) Analysis
X-ray diffractometer equipment (Bruker AXS, D8 Advance) coupled with PANalytical software (version 6.01) (Empyrean, PRO MPD, Almelo, The Netherlands) operated at 40 kV with a target current of 40 mA was used for the analysis. The samples were closely packed in a rectangular glass cell and scanned with a J-J scan coupled with the copper anode (Cu-Kα radiation: λ = 1.5406 Å) and Bragg–Brentano configuration. This was carried out at a room temperature with a speed of 0.033° min−1 over a region of 5 to 70 (2θ) [43].
3.2.2. Fourier Transform Infrared Spectroscopy (FTIR) Analysis
The FTIR spectra of the samples were obtained by using an FTIR-spectrometer (Shimadzu FTIR 8400) in the wavenumber range of 400–4000 cm−1 with a resolution of 4 cm−1 [43]. This method provided information about the molecular structure and functional groups of the composite.
3.2.3. Scanning Electronic Microscope (SEM) Analysis
A Scanning electronic microscope at the University of Cape Town, South Africa (Nova NanoSEM coupled with EDT and TLD detector) was used to analyze the morphological structure of the samples. This was operated at an acceleration voltage of 5 kV with a magnification in the range of 10–50 kx [43].
3.3. Experimental Procedure
The adsorption and photocatalytic experiments were carried out with a modified jar tester reactor, which consisted of six 1 L beakers, stirred at a speed of 150 rpm. At a distance less than 2 cm, the setup was exposed to a UV light of wavelength 400 nm and power rating of 18 W (T8 blacklight-blue bulb 400 nm, 18 W, Philips, and Netherland). Three sets of experiments, as presented in Table 3, were used to investigate the effects of single catalyst load (1–6 g), binary catalyst load (2–4 g), and reaction time (10–60 min). Furthermore, the adsorption capacity of the binary composites was investigated without the UV radiation for the 60 min reaction time, whereas samples were collected in 10 min intervals. The supernatant samples collected with a syringe were filtered through a Whatman filter (Grade 5; 2.5 µm). The effluent was initially characterized for COD (367.7 mg/L) and color (458 Pt. Co) using HACH DR 3900 within the wavelength of 455–635 nm (Hach Company, Loveland, CO, USA) as well as turbidity (14.48 NTU) using HI 98,703 portable turbidimeter (Hanna Instruments, Veneto, Italy). Likewise, the Hannah pH-meter (HI98130, Hanna Instruments, Woonsocket, RI, USA) was used to measure the pH (7.5) of the effluent. Based on primary studies, the pH (6.5) was kept constant by adjusting it with 1 M HCl and NaOH. Upon analyzing the treated samples, the contaminants removal efficiency was calculated using the following Equation (10).
where C0 and Cf are initial and final concentrations of contaminants before and after treatment. The removal rate of COD obtained by the Z–TiO2 and A–TiO2 composites contributed to the adsorption and photocatalysis process. All the experiments were carried out in triplicates, and the average values obtained were reported.
4. Conclusions
In this study, the treatability of bromophenol blue (BPB) dye in aqueous solution by adsorption and photocatalytic degradation with and without UV light of wavelength 400 nm and a power rating of 18 W, was investigated. This was carried out under different catalyst loads (1–6 g) and reaction times (10–60 min) for the removal of COD, color, and turbidity. Furthermore, nanocomposites (A–TiO2 and Z–TiO2) were synthesized, where their physicochemical analyses (SEM, FTIR, and XRD) demonstrated large pore size (20.8 µm) and crystalline size (22–34 nm) with high surface area and chemical stability improvement as compared to the uncoated TiO2. At the optimal single catalyst load of 5 g, above 70% removal of color (Z > TiO2 > A), turbidity (TiO2 > A > Z) and COD (TiO2 > Z > A) with their respective increasing order index were observed, whereby TiO2 demonstrated the highest photocatalytic activity. In comparing the nanocomposite loads (2–4 g), at an optimal load of 4 g, the photocatalytic efficiency increased by 20% with an increasing order index for color and COD removal as A–TiO2 > Z–TiO2 >TiO2, whereas TiO2 > Z–TiO2 > A–TiO2 was observed for turbidity removal. The hybridized A–TiO2 and Z–TiO2 maximized the adsorption and photocatalysis as a viable prospect for remediation of BPB as compared to the TiO2. Kinetically, the photodegradation of the COD by Z–TiO2 > A–TiO2 > TiO2 were well fitted on the second–order kinetic model, of which Z–TiO2 had the highest values of 5.63 × 10⁻⁴ min−1 and 0.989, respectively. Under the same operating conditions, the Langmuir adsorption isotherms favored the nanocomposites (Z–TiO2 > A–TiO2 > TiO2), whereas that of the TiO2 fitted on the Freundlich isotherm (TiO2 > Z–TiO2 > A–TiO2). Above all, hybridization of the photocatalyst with the adsorbent (Z–TiO2) was found to be potentially effective for photoremediation of wastewater for future work of separation and recovery of the TiO2 photocatalyst.
Author Contributions
Conceptualization, methodology, investigation, and writing of the original draft preparation was done by E.K.T., whereas supervision, review, and editing was done by S.R. All authors have read and agreed to the published version of the manuscript.
Funding
This research was funded by the Water Research Commission of South Africa under project identification WRC Project: C2019/2020-00212.
Institutional Review Board Statement
Not applicable.
Informed Consent Statement
Not applicable.
Data Availability Statement
Data is contained within the article.
Acknowledgments
The authors wish to thank the Durban University of Technology, Green Engineering and Sustainability Research Group, and the Water Research Commission of South Africa for their support on the project identification WRC Project: C2019/2020-00212.
Conflicts of Interest
The authors declare no conflict of interest. The funders had no role in the design of the study; in the collection, analyses, or interpretation of data; in the writing of the manuscript, or in the decision to publish the results.
References
- Gleeson, T.; Wada, Y.; Bierkens, M.F.P.; Van Beek, L.P.H. Water balance of global aquifers revealed by groundwater footprint. Nature 2012, 488, 197–200. [Google Scholar] [CrossRef]
- Wada, Y.; Van Beek, L.P.H.; Van Kempen, C.M.; Reckman, J.W.T.M.; Vasak, S.; Bierkens, M.F.P. Global depletion of groundwater resources. Geophys. Res. Lett. 2010, 37. [Google Scholar] [CrossRef] [Green Version]
- Richey, A.S.; Thomas, B.F.; Lo, M.H.; Famiglietti, J.S.; Swenson, S.; Rodell, M. Uncertainty in global groundwater storage estimates in a Total Groundwater Stress framework. Water Resour. Res. 2015, 51, 5198–5216. [Google Scholar] [CrossRef] [PubMed]
- Edokpayi, J.N.; Odiyo, J.O.; Durowoju, O.S. Impact of Wastewater on Surface Water Quality in Developing Countries: A Case Study of South Africa. In Water Quality; IntechOpen: London, UK, 2017. [Google Scholar]
- Barnard, J.L. Biological nutrient removal without the addition of chemicals. Water Res. 1975, 9, 485–490. [Google Scholar] [CrossRef]
- Adewumi, J.R.; Ilemobade, A.; Van Zyl, J. Treated wastewater reuse in South Africa: Overview, potential and challenges. Resour. Conserv. Recycl. 2010, 55, 221–231. [Google Scholar] [CrossRef]
- Tetteh, E.K.; Opoku, M.A.; Armah, E.K.; Rathilal, S. Fate of COVID-19 Occurrences in Wastewater Systems: Emerging Detection and Treatment Technologies—A Review. Water 2020, 12, 2680. [Google Scholar] [CrossRef]
- Gao, Y.; Yang, B.; Wang, Q. Biodegradation and Decolorization of Dye Wastewater: A Review. In IOP Conference Series: Earth and Environmental Science; IOP Publishing: Bristol, UK, 2018. [Google Scholar]
- Arora, S. Textile Dyes: It’s Impact on Environment and its Treatment. J. Bioremediat. Biodegrad. 2014, 5, 1. [Google Scholar] [CrossRef]
- Wang, Z.; Xue, M.; Huang, K.; Liu, Z. Textile Dyeing Wastewater Treatment. In Advances in Treating Textile Effluent; IntechOpen: London, UK, 2011. [Google Scholar]
- Cheremisinoff, P.N. Handbook of Water and Wastewater Treatment Technology; Butterworth-Heinemann: Oxford, UK, 2019. [Google Scholar]
- Salgot, M.; Folch, M. Wastewater treatment and water reuse. Curr. Opin. Environ. Sci. Health 2018, 2, 64–74. [Google Scholar] [CrossRef]
- Mohanty, K.; Purkait, M.K. Membrane Technologies and Applications; CRC Press: Boca Raton, FL, USA, 2011. [Google Scholar]
- Xu, P.; Zeng, G.; Huang, D.L.; Feng, C.L.; Hu, S.; Zhao, M.H.; Lai, C.; Wei, Z.; Huang, C.; Xie, G.X.; et al. Use of iron oxide nanomaterials in wastewater treatment: A review. Sci. Total. Environ. 2012, 424, 1–10. [Google Scholar] [CrossRef]
- Chen, G. Electrochemical technologies in wastewater treatment. Sep. Purif. Technol. 2004, 38, 11–41. [Google Scholar] [CrossRef]
- Tetteh, E.K.; Rathilal, S. Application of Organic Coagulants in Water and Wastewater Treatment. Org. Polym. 2019. [Google Scholar] [CrossRef] [Green Version]
- Tetteh, E.K.; Rathilal, S. Application of magnetized nanomaterial for textile effluent remediation using response surface methodology. Mater. Today Proc. 2020. [Google Scholar] [CrossRef]
- Miklos, D.B.; Remy, C.; Jekel, M.; Linden, K.G.; Drewes, J.; Hübner, U. Evaluation of advanced oxidation processes for water and wastewater treatment—A critical review. Water Res. 2018, 139, 118–131. [Google Scholar] [CrossRef] [PubMed]
- Garcia-Segura, S.; Ocon, J.D.; Chong, M.N. Electrochemical oxidation remediation of real wastewater effluents—A review. Process. Saf. Environ. Prot. 2018, 113, 48–67. [Google Scholar] [CrossRef]
- Jin, J.; El-Din, M.G.; Bolton, J.R. Assessment of the UV/Chlorine process as an advanced oxidation process. Water Res. 2011, 45, 1890–1896. [Google Scholar] [CrossRef]
- Kanakaraju, D.; Glass, B.D.; Oelgemöller, M. Advanced oxidation process-mediated removal of pharmaceuticals from water: A review. J. Environ. Manag. 2018, 219, 189–207. [Google Scholar] [CrossRef]
- Sievers, M. Advanced Oxidation Processes. In Treatise on Water Science; Elsevier: Amsterdam, The Netherlands, 2010. [Google Scholar]
- Durgalakshmi, D.; Rakkesh, R.A.; Rajendran, S.; Naushad, M. Principles and Mechanisms of Green Photocatalysis; Springer Nature: Cham, Switzerland, 2020. [Google Scholar]
- Sacco, O.; Vaiano, V.; Sannino, D. Main parameters influencing the design of photocatalytic reactors for wastewater treatment: A mini review. J. Chem. Technol. Biotechnol. 2020, 95, 2608–2618. [Google Scholar] [CrossRef]
- Zakaria, W.F.W.; Jalil, A.; Hassan, N.S.; Ibrahim, M.; Jalil, A.A. Visible-light driven photodegradation of phenol over niobium oxide-loaded fibrous silica titania composite catalyst. J. Chem. Technol. Biotechnol. 2020, 95, 2638–2647. [Google Scholar]
- Wafi, A.; Szabó-Bárdos, E.; Horváth, O.; Pósfai, M.; Makó, É.; Juzsakova, T.; Fónagy, O. The Photocatalytic and Antibacterial Performance of Nitrogen-Doped TiO2: Surface-Structure Dependence and Silver-Deposition Effect. Nanomaterials 2020, 10, 2261. [Google Scholar] [CrossRef] [PubMed]
- Tetteh, E.K.; Rathilal, S.; Naidoo, D.B. Photocatalytic degradation of oily waste and phenol from a local South Africa oil refinery wastewater using response methodology. Sci. Rep. 2020, 10, 8850. [Google Scholar] [CrossRef]
- Khan, W.Z.; Najeeb, I.; Tuiyebayeva, M.; Makhtayeva, Z. Refinery wastewater degradation with titanium dioxide, zinc oxide, and hydrogen peroxide in a photocatalytic reactor. Process. Saf. Environ. Prot. 2015, 94, 479–486. [Google Scholar] [CrossRef]
- Naushad, M.; Rajendran, S.; Lichtfouse, E. Green Photocatalysts; Springer Nature: Cham, Switzerland, 2020. [Google Scholar]
- Raja, S.; Mattoso, L.H.C. Functionalized Polymer-BaseZd Composite Photocatalysts; Springer Nature: Cham, Switzerland, 2020. [Google Scholar]
- Huang, C.-W.; Wu, M.-C. Photocatalytic degradation of methylene blue by UV-assistant TiO2 and natural sericite composites. J. Chem. Technol. Biotechnol. 2020, 95, 2715–2722. [Google Scholar]
- Zanrosso, C.D.; Piazza, D.; Lansarin, M.A. Solution mixing preparation of PVDF/ZnO polymeric composite films engineered for heterogeneous photocatalysis. J. Appl. Polym. Sci. 2020, 137, 48417. [Google Scholar] [CrossRef]
- Zhong, J.; Chen, F.; Zhang, J. Carbon-Deposited TiO2: Synthesis, Characterization, and Visible Photocatalytic Performance. J. Phys. Chem. C 2010, 114, 933–939. [Google Scholar] [CrossRef]
- Shen, M.; Wu, Z.; Huang, H.; Du, Y.; Zou, Z.; Yang, P. Carbon-doped anatase TiO2 obtained from TiC for photocatalysis under visible light irradiation. Mater. Lett. 2006, 60, 693–697. [Google Scholar] [CrossRef]
- Lee, Y.-F.; Chang, K.-H.; Hu, C.-C.; Lin, K.-M. Synthesis of activated carbon-surrounded and carbon-doped anatase TiO2 nanocomposites. J. Mater. Chem. 2010, 20, 5682–5688. [Google Scholar] [CrossRef]
- haq, I.U.; Ahmad, W.; Ahmad, I.; Yaseen, M. Photocatalytic oxidative degradation of hydrocarbon pollutants in refinery wastewater using TiO2 as catalyst. Water Environ. Res. 2020, 92, 2086–2094. [Google Scholar] [CrossRef]
- Derikvandi, H.; Nezamzadeh-Ejhieh, A. An effective wastewater treatment based on sunlight photodegradation by SnS2–ZnS/clinoptilolite composite. Solid State Sci. 2020, 101, 106127. [Google Scholar] [CrossRef]
- Ibhadon, A.O.; Fitzpatrick, P. Heterogeneous photocatalysis: Recent advances and applications. Catalysts 2013, 3, 189–218. [Google Scholar] [CrossRef] [Green Version]
- Wolf, D. Kinetics of Heterogeneous Catalytic Reactions; Springer Series in Chemical Physics; Springer: Berlin/Heidelberg, Germany, 2004. [Google Scholar]
- Ross, J.R.H. The Kinetics and Mechanisms of Catalytic Reactions. In Heterogeneous Catalysis; Elsevier: Oxford, UK, 2012. [Google Scholar]
- Vannice, M.A. Kinetics of Catalytic Reactions; Springer: Berlin/Heidelberg, Germany, 2005. [Google Scholar]
- Ashfaq, A.; Khatoon, A. Waste Management of Textiles: A Solution to The Environmental Pollution. Int. J. Curr. Microbiol. App. Sci. 2014, 3, 780–787. [Google Scholar]
- Tetteh, E.K.; Rathilal, S. Kinetics and Nanoparticle Catalytic Enhancement of Biogas Production from Wastewater Using a Magnetized Biochemical Methane Potential (MBMP) System. Catalysts 2020, 10, 1200. [Google Scholar] [CrossRef]
Figure 1.
XRD pattern of TiO2 (black), A–TiO2 (red) and Z–TiO2 (blue); Λ—anatase, and ℜ—rutile.

Figure 2.
SEM images of (a) TiO2, (b) A–TiO2 and (c) Z–TiO2.

Figure 3.
EDX images of (a) TiO2, (b) A–TiO2 and (c) Z–TiO2.

Figure 4.
FTIR spectra of TiO2 (red) < A–TiO2 (black) < Z–TiO2 (blue).

Figure 5.
Effect of pH on photocatalytic degradation of chemical oxygen demand (COD) at a catalyst load of 2 g and reaction time of 30 min.
Figure 5.
Effect of pH on photocatalytic degradation of chemical oxygen demand (COD) at a catalyst load of 2 g and reaction time of 30 min.

Figure 6.
Effects of catalyst load at 1–6 g for the removal of (a) color (458 Pt. Co) and (b) COD (367.7 mg/L) with subsequent binary catalyst load effect of 2–4 g (c,d) at a reaction time of 30 min.
Figure 6.
Effects of catalyst load at 1–6 g for the removal of (a) color (458 Pt. Co) and (b) COD (367.7 mg/L) with subsequent binary catalyst load effect of 2–4 g (c,d) at a reaction time of 30 min.

Figure 7.
Adsorption (a) and photocatalytic (b) degradation of COD (367.7 mg/L) at 4 g catalyst loading of TiO2 (black) < A–TiO2 (blue) < Z–TiO2 (red).
Figure 7.
Adsorption (a) and photocatalytic (b) degradation of COD (367.7 mg/L) at 4 g catalyst loading of TiO2 (black) < A–TiO2 (blue) < Z–TiO2 (red).

Figure 8.
Photocatalytic degradation of COD (367.7 mg/L) as a function of time; (a) first-order and (b) second-order kinetic models.
Figure 8.
Photocatalytic degradation of COD (367.7 mg/L) as a function of time; (a) first-order and (b) second-order kinetic models.

Figure 9.
Freundlich (a) and. Langmuir (b) adsorption isotherms for the degradation of COD (367.7 mg/L) using 4 g of Z–TiO2 > A–TiO2 > TiO2.
Figure 9.
Freundlich (a) and. Langmuir (b) adsorption isotherms for the degradation of COD (367.7 mg/L) using 4 g of Z–TiO2 > A–TiO2 > TiO2.


Table 1.
Elemental distribution of TiO2, A–TiO2, and Z–TiO2 for their average spectra (Figure 3).
Table 1.
Elemental distribution of TiO2, A–TiO2, and Z–TiO2 for their average spectra (Figure 3).
| Elemental Composition | TiO2 | A–TiO2 | Z–TiO2 | |||
|---|---|---|---|---|---|---|
| Weight (%) | Std. Dev. | Weight (%) | Std. Dev. | Weight (%) | Std. Dev. | |
| C | 13.08 | 3.69 | 17 | 1.1 | 19.72 | 6.74 |
| O | 45.64 | 2.41 | 31.4 | 11.41 | 35.64 | 6.59 |
| Na | 10.73 | 1.35 | 0.27 | 0.21 | 1.01 | 0.55 |
| Ti | 30.55 | 5.78 | 16.02 | 0.26 | 23.15 | 1.69 |
| Mg | 0.4 | 0.08 | 0.64 | 0.63 | ||
| Al | 2.66 | 0.6 | 1.18 | 1.11 | ||
| Si | 0.86 | 0.14 | 16.57 | 1.94 | ||
| K | 23.23 | 2.17 | 1.6 | 0.51 | ||
| Ca | 0.48 | 0.33 | 0.49 | 0.64 | ||
| P | 1.17 | 0.36 | ||||
| S | 0.28 | 0.07 | ||||
| Cl | 6.23 | 2.17 | ||||
| Total | 100 | 100 | 100 | |||
Table 2.
Kinetics data for the removal of COD with a catalyst load of 4 g.
| Photocatalyst Type | TiO2 | Z–TiO2 | A–TiO2 |
|---|---|---|---|
| First-order Model | |||
| k1 (min−1) | 0.0218 | 0.0313 | 0.0269 |
| R2 | 0.872 | 0.955 | 0.927 |
| Adjusted R2 | 0.769 | 0.912 | 0.869 |
| Sum of squares | 0.832 | 1.714 | 1.212 |
| Second-order Model | |||
| k2 (min−1) | 0.000327 | 0.000563 | 0.000415 |
| R2 | 0.952 | 0.989 | 0.973 |
| Adjusted R2 | 0.916 | 0.978 | 0.945 |
| Sum of squares | 1.926 | 1.346 | 1.564 |
Table 3.
Adsorption and photocatalysis experimental design.
| Category | Investigating Factor | Purpose | Single Material (A, TiO2, and Z) | Binary Composite (A–TiO2 and Z–TiO2) |
| 1 | Single dosage (1–6 g) | Photocatalysis | All | N/A |
| 2 | Binary dosage (2–4 g) | Photocatalysis | TiO2 | All |
| 3 | Reaction time (±60 min) | Adsorption and photocatalysis | TiO2 | All |
Publisher’s Note: MDPI stays neutral with regard to jurisdictional claims in published maps and institutional affiliations. |
© 2020 by the authors. Licensee MDPI, Basel, Switzerland. This article is an open access article distributed under the terms and conditions of the Creative Commons Attribution (CC BY) license (http://creativecommons.org/licenses/by/4.0/).
Share and Cite
MDPI and ACS Style
Kweinor Tetteh, E.; Rathilal, S. Adsorption and Photocatalytic Mineralization of Bromophenol Blue Dye with TiO2 Modified with Clinoptilolite/Activated Carbon. Catalysts 2021, 11, 7. https://0-doi-org.brum.beds.ac.uk/10.3390/catal11010007
AMA Style
Kweinor Tetteh E, Rathilal S. Adsorption and Photocatalytic Mineralization of Bromophenol Blue Dye with TiO2 Modified with Clinoptilolite/Activated Carbon. Catalysts. 2021; 11(1):7. https://0-doi-org.brum.beds.ac.uk/10.3390/catal11010007
Chicago/Turabian StyleKweinor Tetteh, Emmanuel, and Sudesh Rathilal. 2021. "Adsorption and Photocatalytic Mineralization of Bromophenol Blue Dye with TiO2 Modified with Clinoptilolite/Activated Carbon" Catalysts 11, no. 1: 7. https://0-doi-org.brum.beds.ac.uk/10.3390/catal11010007
Note that from the first issue of 2016, this journal uses article numbers instead of page numbers. See further details here.