Article

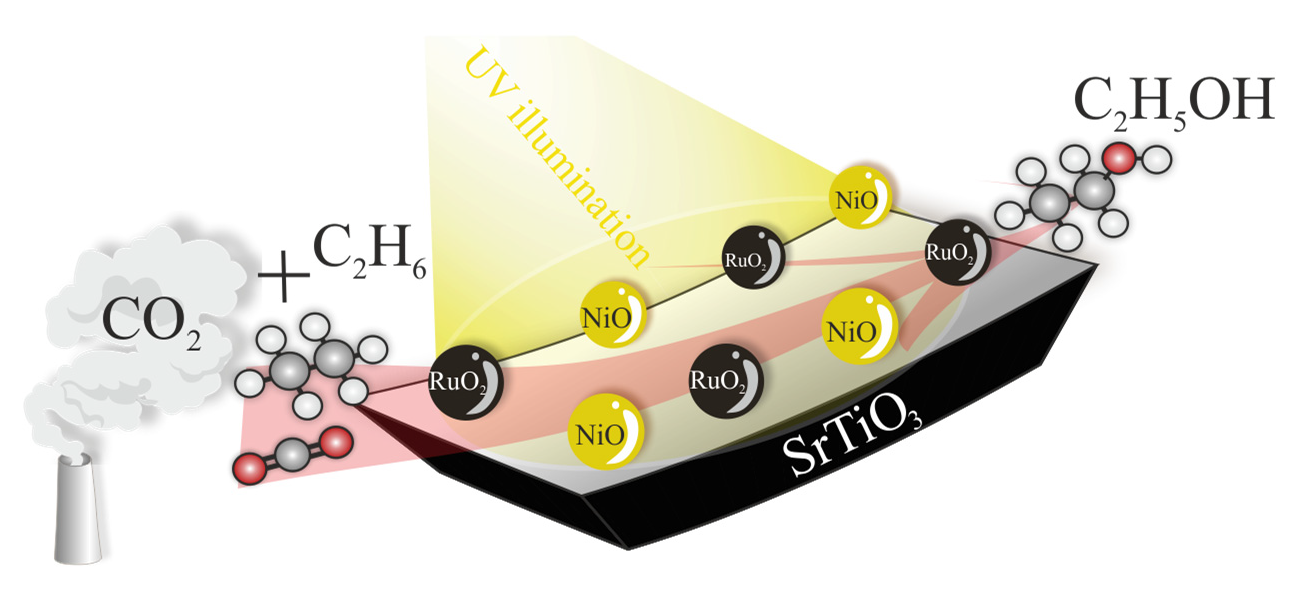
Turning Carbon Dioxide and Ethane into Ethanol by Solar-Driven Heterogeneous Photocatalysis over RuO2- and NiO-co-Doped SrTiO3

by
Larissa O. Paulista
1,
Josep Albero
2,
Ramiro J. E. Martins
1,
Rui A. R. Boaventura
1,
Vítor J. P. Vilar
1,
Tânia F. C. V. Silva
1,* and
Hermenegildo García
2,*
1
Laboratory of Separation and Reaction Engineering—Laboratory of Catalysis and Materials (LSRE-LCM), Departamento de Engenharia Química, Faculdade de Engenharia, Universidade do Porto, Rua Dr. Roberto Frias, 4200-465 Porto, Portugal
2
Instituto Universitario de Tecnología Química CSIC-UPV, Universidad Politécnica de Valencia, Av. de los Naranjos s/n, 46022 Valencia, Spain
*
Authors to whom correspondence should be addressed.
Submission received: 9 March 2021 / Revised: 29 March 2021 / Accepted: 30 March 2021 / Published: 1 April 2021
(This article belongs to the Special Issue Photo/Electrocatalysis for Wastewater Treatment)

Abstract

:
The current work focused on the sunlight-driven thermo-photocatalytic reduction of carbon dioxide (CO2), the primary greenhouse gas, by ethane (C2H6), the second most abundant element in shale gas, aiming at the generation of ethanol (EtOH), a renewable fuel. To promote this process, a hybrid catalyst was prepared and properly characterized, comprising of strontium titanate (SrTiO3) co-doped with ruthenium oxide (RuO2) and nickel oxide (NiO). The photocatalytic activity towards EtOH production was assessed in batch-mode and at gas-phase, under the influence of different conditions: (i) dopant loading; (ii) temperature; (iii) optical radiation wavelength; (vi) consecutive uses; and (v) electron scavenger addition. From the results here obtained, it was found that: (i) the functionalization of the SrTiO3 with RuO2 and NiO allows the visible light harvest and narrows the band gap energy (ca. 14–20%); (ii) the selectivity towards EtOH depends on the presence of Ni and irradiation; (iii) the catalyst photoresponse is mainly due to the visible photons; (iv) the photocatalyst loses > 50% efficiency right after the 2nd use; (v) the reaction mechanism is based on the photogenerated electron-hole pair charge separation; and (vi) a maximum yield of 64 μmol EtOH gcat−1 was obtained after 45-min (85 μmol EtOH gcat−1 h−1) of simulated solar irradiation (1000 W m−2) at 200 °C, using 0.4 g L−1 of SrTiO3:RuO2:NiO (0.8 wt.% Ru) with [CO2]:[C2H6] and [Ru]:[Ni] molar ratios of 1:3 and 1:1, respectively. Notwithstanding, despite its exploratory nature, this study offers an alternative route to solar fuels’ synthesis from the underutilized C2H6 and CO2.

Graphical Abstract

1. Introduction

The global economy has been moving towards an ever-growing consumption of fossil fuels, together with the emission of anthropogenic greenhouse gases, which has led to an energy crisis and global warming. Therefore, the development of promising strategies aiming at the carbon dioxide (CO2) chemical conversion into renewable hydrocarbon fuels is urgent. In fact, Intergovernmental Panel on Climate Change (IPCC) has already reported the necessity for new options in the direction of ‘negative emissions’, even including the carbon dioxide removal (CDR) from the atmosphere targeting the global warming mitigation. Some advances have been made in the field of heterogeneous catalysis for the reduction of CO2, the main greenhouse gas. Still, many of the studies have predominantly focused on synthesizing chemical intermediates, such as syngas (CO + H2), alkenes, and aromatic compounds [1,2,3,4]. Furthermore, the transport and storage of syngas and alkenes raise potential safety risks, due to the high toxicity range and flammability of these gases, respectively [5,6]. Nonetheless, a lack of feasible approaches to produce valuable and safer oxygenate molecules directly from CO2 and other high environmental concern gases, such as shale gas, appears to exist.
A recent study performed by Xie et al. [7] has proposed a tandem reactor strategy that enables the synthesis of oxygenates (aldehydes and alcohols) by inserting the CO moiety from the CO2 into alkenes generated from the underutilized ethane (C2H6), the shale gas second-largest component. This strategy comprised two stages: (i) one, where syngas and ethylene were generated through catalyzed CO2-assisted dehydrogenation and C2H6 reforming at 600–800 °C; and (ii) a further one, where the readily-generated syngas and ethylene were used in a catalyzed hydroformylation reaction at 200 °C to produce propanal and/or 1-propanol. Additionally, other reactions of CO2 with C2H6 can also occur, including [8]: (i) oxidative dehydrogenation of ethane with CO2; (ii) non-oxidative dehydrogenation, (iii) cracking to form methane, and (iv) reverse water gas shift to produce water. So, depending on the catalyst proprieties and the reaction conditions, it is possible to foresee the synthesis of oxygenated compounds from the interaction between the CO2 and ethane molecules in a single unit. However, as CO2 is an extremely stable molecule, the catalytic processes’ performance demands high temperature. Hopefully, this drawback can be compensated by employing thermo-photocatalysis [8,9,10,11].
Despite the several efforts made over the past few years towards photocatalytic reduction, the CO2 conversion still suffers from very low efficiencies. However, the photocatalytic activity can be enhanced through the structural engineering of photocatalysts with different architectures and surface properties (e.g., bandgap engineering, nanostructuralization, macro/meso/microporous structuralization, etc.) [1,12,13,14]. Among the perovskite semiconductors, strontium titanate (SrTiO3) is a promising photocatalyst for CO2 reduction because of its semiconducting proprieties, high thermal and photochemical stability, negligible toxicity, and low cost [15]. Besides, the surface defects of the SrTiO3, such as oxygen vacancy, can act as an electron trap, as well as a CO2 absorption site [16]. There are precedents in the literature reporting that SrTiO3 semiconductor modified by means of co-doping gives rise to highly efficient photocatalyst capable of enhancing hydrogen evolution [17,18,19,20]. The doping process with metals can change the semiconductor’s optical and electronic proprieties through up-shift in the valence band (VB), or down-shift in the conduction band (CB), or even induce doping levels within the forbidden band. On that account, the photocatalyst may be enhanced regarding the photoresponse to visible light, the product selectivity, and the efficiency for CO2 photoreduction [14]. A double doping approach using nickel (Ni) and ruthenium (Ru) transition metals can improve the photocatalytic activity and selectivity in the UV-visible region by changing the semiconductor’s electronic structure [17,21]. Meanwhile, the nickel can act as an electron trap, suppressing the electron-hole pair recombination and, consequently, boosting the CO2 photoconversion effectiveness [22]. Moreover, the harmless Ni2+ is an important species as it concerns the co-doping with high-valence ions, since it maintains the charge balance and increases the photocatalytic performance [17,20].
To the best of our knowledge, there is only one study addressing the outstanding adeptness of the SrTiO3 co-doped with RuO2 and NiO, but as a photocatalyst on nitrogen fixation with water pursuing ammonia synthesis [23]. Also, as far as we know, there are no reports on literature regarding the thermo-photocatalytic conversion of CO2 and C2H6 into value-added oxygenate molecules. Accordingly, this study aims to contribute to this growing area of research by exploring the performance of the hybrid SrTiO3:RuO2:NiO catalyst towards ethanol production (EtOH) from CO2 and C2H6, using solar-driven heterogeneous thermo-photocatalysis. The photocatalytic activity was evaluated at gas-phase under batch operation mode as a function of (i) photocatalyst composition, in terms of Ru and Ni loading; (ii) photothermal response; (iii) photoresponsiveness, under different optical radiation wavelength; (iv) photocatalyst reuse; and (v) the sacrificial agent addition, in a perspective of understanding the reaction mechanism.

2. Results

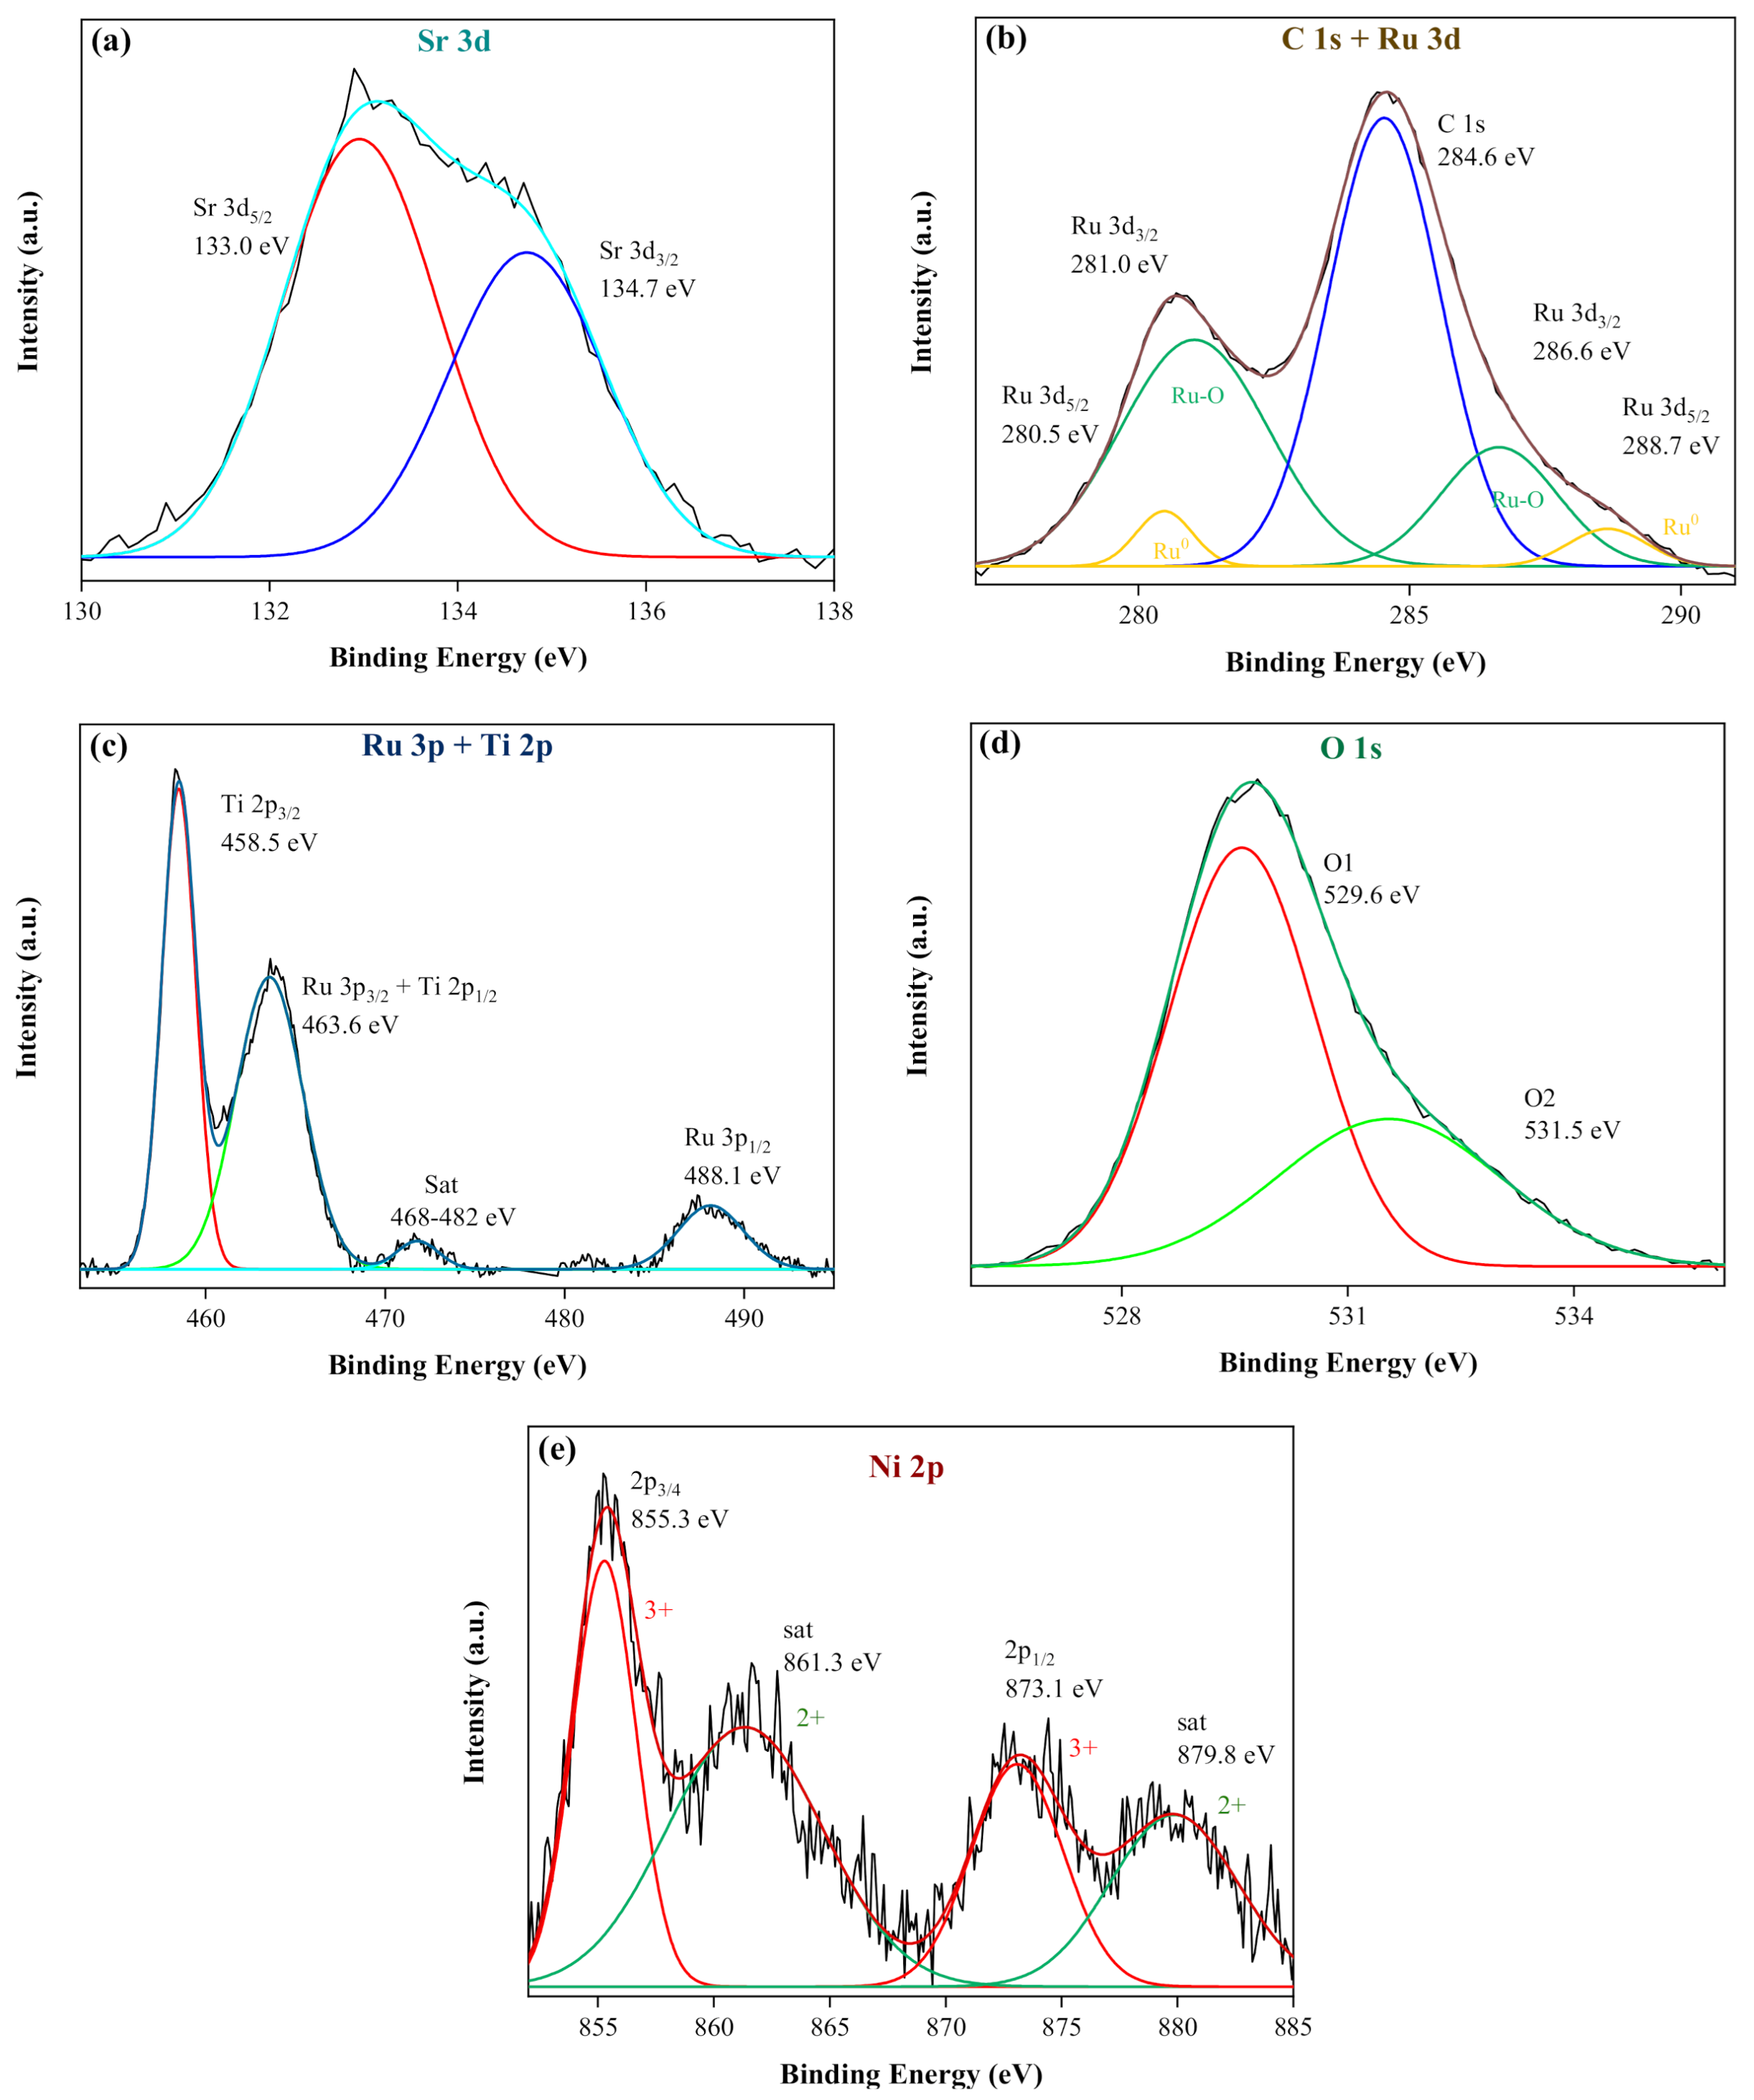
2.1. Characterization of the Photocatalysts

The photocatalyst, used in the thermo-photocatalytic reduction of CO2 with ethane, was obtained by functionalizing of commercial SrTiO3 through a double doping approach with RuO2 and NiO, as illustrated in Figure 1 and further described in the materials and methods section. To understand the structural and morphological changes on the SrTiO3:RuO2:NiO photocatalyst, several characterization techniques were used, namely: (i) UV-Vis diffuse reflectance spectroscopy (DRS), which was also applied for SrTiO3 and SrTiO3:Ru2 intermediate samples (Figure 2); (ii) X-ray diffraction (XRD) and Raman spectroscopy (Figure 3); (iii) energy-dispersive X-ray spectroscopy (EDS) mapping and transition electron microscopy (TEM) (Figure 4); and (iv) X-ray photoelectron spectroscopy (XPS) (Figure 5).
Figure 2 depicts the UV–Vis DRS spectra (Figure 2a–c) and the optical band gap energy (Eg) (Figure 2d) of the SrTiO3, SrTiO3:Ru and SrTiO3:RuO2:NiO samples, where it is possible to verify that: (i) the pristine SrTiO3 presented a characteristic absorption band in the UV light region and the highest Eg value of ca. 3.2 eV (estimated through the application of Kubelka-Munk method [24]) in accordance with the literature [25], with an absorption edge around 380–390 nm, corroborating the need towards a spectral red-shift; (ii) the decoration of the SrTiO3 with Ru nanoparticles indeed increased the response against the visible irradiation since the Eg values decreased by about 8–14%, compared to SrTiO3, resulting in a wide absorption band between 400–800 nm due to the RuO2 plasmon band, as also recorded Mateo et al. [21]; (iii) the impregnation with nickel further increased the visible light harvest, mainly after 520 nm through the ion transition level [26], and narrowed the Eg between 14–20%, compared to SrTiO3; (iv) the global spectrum intensity progressively increased as the dopant concentration raised; (v) the Eg values did not follow a gradual decay pattern as the metal oxides’ concentration increase, since the presence of excessive ions can induce intrinsic point defects, or oxygen vacancies, on the surface of metal-doped semiconductors, which may act as recombination centers [27,28]; and (vi) the double doping approach led to a partial suppression of the higher energy ions, resulting in a photocatalyst with weaker UV light absorption between 200–400 nm, when compared to Ru-doped SrTiO3, as similarly reported for the co-doping of SrTiO3 with Ni and Ta/La [17,20,29].
Based on the XRD pattern (Figure 3), it can be observed that the SrTiO3:RuO2:NiO photocatalyst actually features the characteristic diffraction peaks of the SrTiO3, RuO2 and NiO compounds, as expected. Moreover, it can also be inferred that the Ru and Ni metallic species were effectively oxidized on the semiconductor surface since the corresponding diffraction peaks matched with the RuO2 and NiO reference XRD patterns (JCPDS 01-070-2662 and JCPDS 78-0643, respectively). From the Rietveld refinement, the sample reflection peaks were indexed to the tetragonal crystal system, with unit-cell lattice constants of a = b = 3.874 Å and c = 12.720 Å and axial angles of α = β = γ = 90° (estimated through Match! software). Conversely, the reference reflection peaks (JCPDS 35-0734) of the main photocatalyst component, the SrTiO3, are indexed to a cubic crystal system (α = β = γ = 90°) with standard lattice parameter values of a = b = c = 3.905 Å [30].
The change on the perovskite crystalline structure suggests that the tetragonal lattices of the composed SrTiO3:RuO2:NiO photocatalyst are mainly a consequence of the SrTiO3 semiconductor cubic lattice stretching along the c lattice vector, most likely across the co-doping process with the metallic species. This cubic-to-tetragonal transition can be associated with oxygen’s octahedral rotation around the c axis [31]. Furthermore, given the similarity between the atomic radius of Ru and Ti (0.056 and 0.060 nm, respectively) [32], it could be assumed that the Ru atom was incorporated into the host SrTiO3 lattice, thus also interfering with the lattice’s crystallinity. Finally, the photocatalyst’s crystallite size was estimated according to Scherrer’s equation [33,34], considering all diffraction XRD peaks. It was found out that the crystallite size ranged between 4.4 and 36.9 nm, presenting an average of 21.3 nm. This lack of uniformity observed on the crystallite’s size distribution can be attributed to the production of more lattice defects and lattice strains in the post-co-doping thin films [35,36].
The double doping process was also confirmed by the Raman microscopic spectrum (Figure 3: inset), which presents two characteristic Eg (507 cm−1) and A1g (618 cm−1) bands, depicting the interaction of RuO2:NiO with the SrTiO3, as described by Álvarez et al. [37]. The insertion of the Ni2+ atom into the RuO2 lattice might have led to the variation in the Raman spectrum. Thence, a single wideband at 507 cm−1 was overlapped to the longitudinal order (LO) photon mode and Eg active mode corresponding to NiO and RuO2, respectively. Consequently, there was stress on the RuO2 lattice parameters, driving to the weakening of the A1g band (Figure 3: inset).
The TEM micrographs (Figure 4) display agglomerates of uneven particles, which corroborates with the crystallite size distribution obtained from the XRD characterization, presenting a spherical-like morphology, sized between 60–90 nm, surrounded by smaller spherical-like particles, sized around 4–6 nm, corresponding to the SrTiO3 semiconductor (in agreement with the commercial specifications) and Ni and Ru metals, respectively. As expected, EDS mapping (Figure 4) confirms the presence of all elements used in the preparation of the photocatalyst, such as Sr, Ti, O, belonged to the SrTiO3 main compound, along with Ni and Ru metallic particles, whose existence are ascribed to the semiconductor co-doping process.
XPS analysis (Figure 5) also attests to the elemental composition of the SrTiO3:RuO2:NiO photocatalyst, consisting of Ni, Ru, Ti, Sr, and O components, and the absence of any impurity. The spectrum of the Sr 3d occupied state (Figure 5a) shows the formation of a doublet signal with binding energies of 133.0 eV and 134.7 eV, associated with Sr 3d5/2 and Sr 3d3/2 orbitals, respectively, which is related to the bond between the Sr atom and the perovskite structure matrix. Although the C 1s + Ru 3d combined spectrum (Figure 5b) presents a signal interference associated with the C 1s reference (284.6 eV), from the deconvolution of this spectrum, it is possible to recognize a doublet signal ascribed to two chemically different Ru oxidation states, namely: (i) zero-valent Ru metal, with binding energies at 280.5 and 288.7 eV (Ru 3d5/2); and (ii) Ru oxides, with predominant intensity and binding energies at 281.0 and 286.6 eV (Ru 3d3/2). As regards the Ti element (Figure 5c), two peaks related to the Ti 2p3/2 and Ti 2p1/2 orbitals were recorded at binding energies of 458.5 eV and 463.6 eV, respectively, which are typical values for the Ti oxidation state in the SrTiO3 [38]. However, the intensity peak at 463.6 eV also features an overlapping of the Ti 2p1/2 and the Ru 3p3/2 orbitals. On the other hand, the intensity peak at 488.1 eV was only assigned to the Ru 3p1/2 region. Accordingly, Ru and Ti elements can affect the ligand screening at charge-transfer configurations [39]. Besides that, the energy region among 468-482 eV might be associated with satellite structures belonging to the main Ti 2p and Ru 3p occupied states. From the deconvolution of the O 1s spectrum (Figure 5d), two peaks were defined, namely O1 and O2, centered at biding energies of 529.6 eV and 531.5 eV, respectively. These peaks can be attributed to metal-oxygen bonds of the RuO2 and NiO dopants, as well as to defects in the SrTiO3 semiconductor [40,41,42]. The absence of peaks above 531.5 eV may indicate that there is no chemical adsorption of oxygen in the sample [40]. Finally, the Ni 2p spectrum (Figure 5e) shows two spin−orbit doublets and two shakeup satellite peaks, the so-called “sat”. Specifically, the two main binding peaks at 855.3 and 873.1 eV and the other two satellite peaks at 861.3 and 879.8 eV were assigned to Ni3+ and Ni2+ species, respectively.

2.2. Assessment of the Photocatalytic Activity

2.2.1. Effect of the Co-Doping Metal Loading

The main product detected during the gas-phase batch-mode photocatalytic trials was ethanol (Figure S1a). So, it was the only compound thoroughly explored across this paper, conversely to the remaining ones. Furthermore, other products such as hydrogen, carbon monoxide, ethylene, diethyl ether, and water were also identified. However, their concentration continuously remained below the analytic equipment detection limit (<2 ppm). It should also be mentioned that experiments with a Ru content null or higher than 0.8 wt.% were not performed, since a study reported by Mateo et al. [21] has disclosed that: (i) both RuO2 and SrTiO3 have indispensable roles regarding CO2 methanation, as the first act as the active specie and the second act as the support and the promoter of the photoinduced charge separation; and (ii) and a Ru dosage of 1.2 wt.% led to lower photocatalyst activity than a 0.4 wt.% Ru loading, due to the increase of the average Ru nanoparticle size.
The influence of different Ru (0.2, 0.4 and 0.8 wt.%) and Ni ([Ru]:[Ni] molar ratios of 1:0, 1:0.3, 1:1, and 1:2) dosages within the SrTiO3 semiconductor towards the photo-thermal-assisted ethanol production is showed in Figure 6. It was found that: (i) the selectivity for ethanol formation was only achieved when Ni was present in the photocatalyst composition; (ii) the ethanol’s generation was raised as (a) the Ru content increased, keeping the [Ru]:[Ni] molar ratio in 1:1 and (b) the [Ru]:[Ni] molar ratio augmented until 1:1, using a Ru concentration of 0.8 wt.%; and (iii) a maximum ethanol production of almost 64 μmol EtOH gcat−1 was attained after 45-min reaction (the equivalent to 85 μmol EtOH gcat−1 h−1), considering the best catalyst. According to Myint et al. [8], reforming and oxidative dehydrogenation of ethane with CO2 using FeNi as catalyst shows selectivity to ethylene formation via the C–H bond cleavage. So, there is an opportunity to improve ethanol’s formation either by ethylene hydration or by inserting CO2-derived CO into ethane-derived ethylene [43]. Moreover, the Ni2+ species may act as electron traps, which will suppress electron-hole pairs recombination, thus ensuring an effective charge separation [22] and favoring ethanol generation. On the other hand, when Ni2+ is doped in excess, the photocatalytic CO2 reduction reaction could be hindered by the low availability or even the lack of photogenerated electrons, thus decreasing the amount of the reaction by-products. This effect was experimentally checked when the [Ru]:[Ni] molar ratio was increased from 1:1 to 1:2, keeping the Ru content at 0.8 wt.%, as no improvement was spotted regarding the ethanol production yield. Therefore, the photocatalyst composed of a Ru loading of 0.8 wt.%, a [Ru]:[Ni] molar ratio of 1:1, and a reaction time of 45–60 min were selected for the following assays.
Nevertheless, after 45-min reaction time at 200 °C, the ethanol concentration started to decrease, indicating the formation of other by-products (Figure 6). In fact, the presence of diethyl ether was identified through GC-MS analysis (Figure S1b), but in concentrations below the detection limit of the GC analytical method (< 0.05 ppm). This side-product could have been produced from the ethanol dehydration, according to Equation (1) [44]. A study performed by Oliveira et al. [45] has shown that this reaction was favored for temperatures between 180 and 200 °C, using Cu-Fe/ZSM-5 catalysts. In comparison, for temperatures above 200 °C, the formation of ethylene was endorsed instead, using ZSM-5 or Fe/Pure ZSM-5 catalysts.
2   C 2 H 5 OH       C 2 H 10 O +   H 2 O

2.2.2. Effect of the Reaction Temperature

Xie et al. [7] have presented a two-step approach that allows the synthesis of value-added oxygenates from the reaction of CO2 with ethane, via heterogeneous dehydrogenation/reforming and hydroformylation catalysis, using a combination of Fe3Ni/CeO2 (first rector) and Rh-based catalysts (second reactor) at temperatures of 600–800 °C and 200 °C, respectively. On the other hand, according to a review published by Nair et al. [11], a synergy can be achieved when combining thermal catalysis with photocatalysis, i.e., the hybrid thermal-photocatalysis process, which might permit work at relatively lower temperatures. For instance, despite CO2 methanation usually occurs in temperatures between 300 °C and 550 °C [46], Mateo et al. [21] have reported the CO2 methanation at 150 °C using SrTiO3:RuO2-driven photocatalysis. Therefore, the temperature must be a crucial parameter to take into consideration in this kind of process.
Figure 7 displays the photothermal influence on the catalytic activity towards ethanol production from the CO2 and C2H6 reaction, from which it is possible to verify that by increasing the temperature from 50 °C to 150 °C the ethanol’s production proportionally increased ca. 0.17 μmol gcat−1 h−1 per each Celsius degree, considering the timeframe irradiation of 45 min. Distinctively, when the temperature was raised from 150 °C to 200 °C, the ethanol formation yield significantly increased by about 125%, the equivalent to a specific reaction rate increment of 0.94 μmol gcat−1 h−1 °C−1. The nonlinear transition in the heating experiments suggests that at 200°C there are more molecules with energy values equal to or higher than the reaction activation energy [47]. Therefore, this temperature was chosen to pursue further experiments. It should also be mentioned that the influence of higher temperatures on the reaction rate was not explored due to reactor thermic limitations.

2.2.3. Effect of the Optical Radiation Wavelength

In order to evaluate the spectral response of the best photocatalyst, which can be directly linked to the UV-Vis DRS data, different radiation cut-off filters (no filter, 400 nm, 515 nm, 550 nm, 665 nm and dark) were used in the thermal-photocatalysis reaction regarding ethanol production. From the UV-Vis DRS data (Figure 2), it was found that the estimated Eg of the SrTiO3:RuO2:NiO photocatalyst was lower than of the pristine SrTiO3, most likely due to interfacial combination and matched band edges among the different nanomaterials. This means that the electron-hole pairs of the composed photocatalyst, contrary to the pure perovskite, can be generated under visible irradiation by low-energy photons. For that reason, a better photocatalytic activity can be anticipated under visible light.
From Figure 8, it can be seen that: (i) the control experiment in the dark exhibited negligible ethanol formation; (ii) the photoresponse decreased as the excitation wavelength increased; (iii) the Ru- and Ni-co-doped SrTiO3 showed some residual photocatalytic activity, even exited at wavelengths higher than 655 nm; and (iv) the contribution of the visible radiation (>400 nm) for the global reaction efficiency is about 63% and, as such, higher than of the UV irradiation. These results, along with the ones from the previous section, showed that the use of heterogeneous thermal-catalysis alone is not able to promote any ethanol generation, and the use of heterogeneous photocatalysis by itself, at temperatures equal to or lower than 150 °C, lead to low reaction yields. So, it can be concluded that a synergy effect between UV-Vis radiation and temperature was attained and the integration of these two parameters is essential aiming at the generation of ethanol.
The difference observed on the ethanol production yield, concerning the trials without filter and using the 400 nm cut-off filter, can be ascribed to the activity of the SrTiO3 since it is only excited by high-energy UV photons. The results here presented are in good agreement with the UV-vis DRS spectra and the estimated values of the optical band gap energies (Figure 2), which showed that the metals co-doping led to an improved photocatalyst with higher visible light absorption and lower band gap energy. Within the visible spectrum, the catalyst photoresponse was greater in the high-energy region, most probably because noble metal nanoparticles, such as Ru, present insightful optical proprieties due to the strong absorption in the visible light range, called the plasmon band [48]. Furthermore, the absorbance for the wavelengths above 550 nm can be attributed to the plasmon resonance related to the Ni nanoparticles [20,49]. Taking all the above into account, the photoresponse of the SrTiO3:RuO2:NiO catalyst can be attributed to the SrTiO3 semiconductor excitation, as well as of the Ru and Ni plasmon band, being the latter more efficient towards ethanol production.
The ethanol’s production yield obtained in the current work (85 μmol EtOH gcat−1 h−1) is comparable to the others reported in the literature using the same full-length illumination system, i.e., a 300 W xenon lamp, but through artificial photosynthesis using CO2 and H2O as reactants instead. Dai et al. [50] have presented a study regarding the photocatalytic reduction of CO2 at 4 °C using a PTh/Bi2WO6 photocatalyst, under batch mode operation, where the ethanol production yield was 5.1 μmol EtOH gcat−1 h−1, which is 17-fold lower compared to the present study. On the other hand, Cheng et al. [51], using a continuous planar optofluidic microreactor filled with C2CdS-Cu2+/TiO2 photocatalyst at a flow rate of 4 mL min−1 and 80 °C, obtained an ethanol production rate of 109 μmol gcat−1 h−1, which is slightly above (28%) to the one attained in this work.

2.2.4. Effect of the Photocatalyst Reuse

Photocatalyst stability towards ethanol’s production by thermal-photocatalysis with CO2 and C2H6 was investigated during four consecutive batch cycles, using the same SrTiO3:RuO2:NiO sample. Unfortunately, after successive photocatalyst uses, the ethanol’s formation rate is significantly decreased (>50% in the 2nd use), reaching a total inhibition right after the 4th use (Figure 9a), indicating poor photocatalytic stability. The TEM images (Figure 9b) clearly exhibit an increase in the opaqueness of the deactivated photocatalyst (Figure 9b.1), when compared to the fresh one (Figure 9b.2), indicating the presence of some impurities onto the catalyst surface, which can block the active sites, thus decreasing the reaction efficiency [52]. Furthermore, molecules able to absorb with multiple bonds, such as CO and other unsaturated hydrocarbons, can act as a poison for the catalyst because they can interact with metals by means of chemisorption through multiple and reverse bonding [53]. Given these results, the photocatalyst reactivation was tried to reduce the poisoning effect, after the 4th use, by two methods: (i) calcination with O2 from the air, at 350 °C for 2 h, in an effort to oxidize the salts of the active catalytic materials into active metal oxides; or (ii) H2 flow at 200 °C for 2 h, in an endeavor to reduce the metals co-doped and remove the elements causing the poisoning. Nevertheless, both reactivation mechanisms did not have the desired effect, obtaining almost null ethanol production yields.

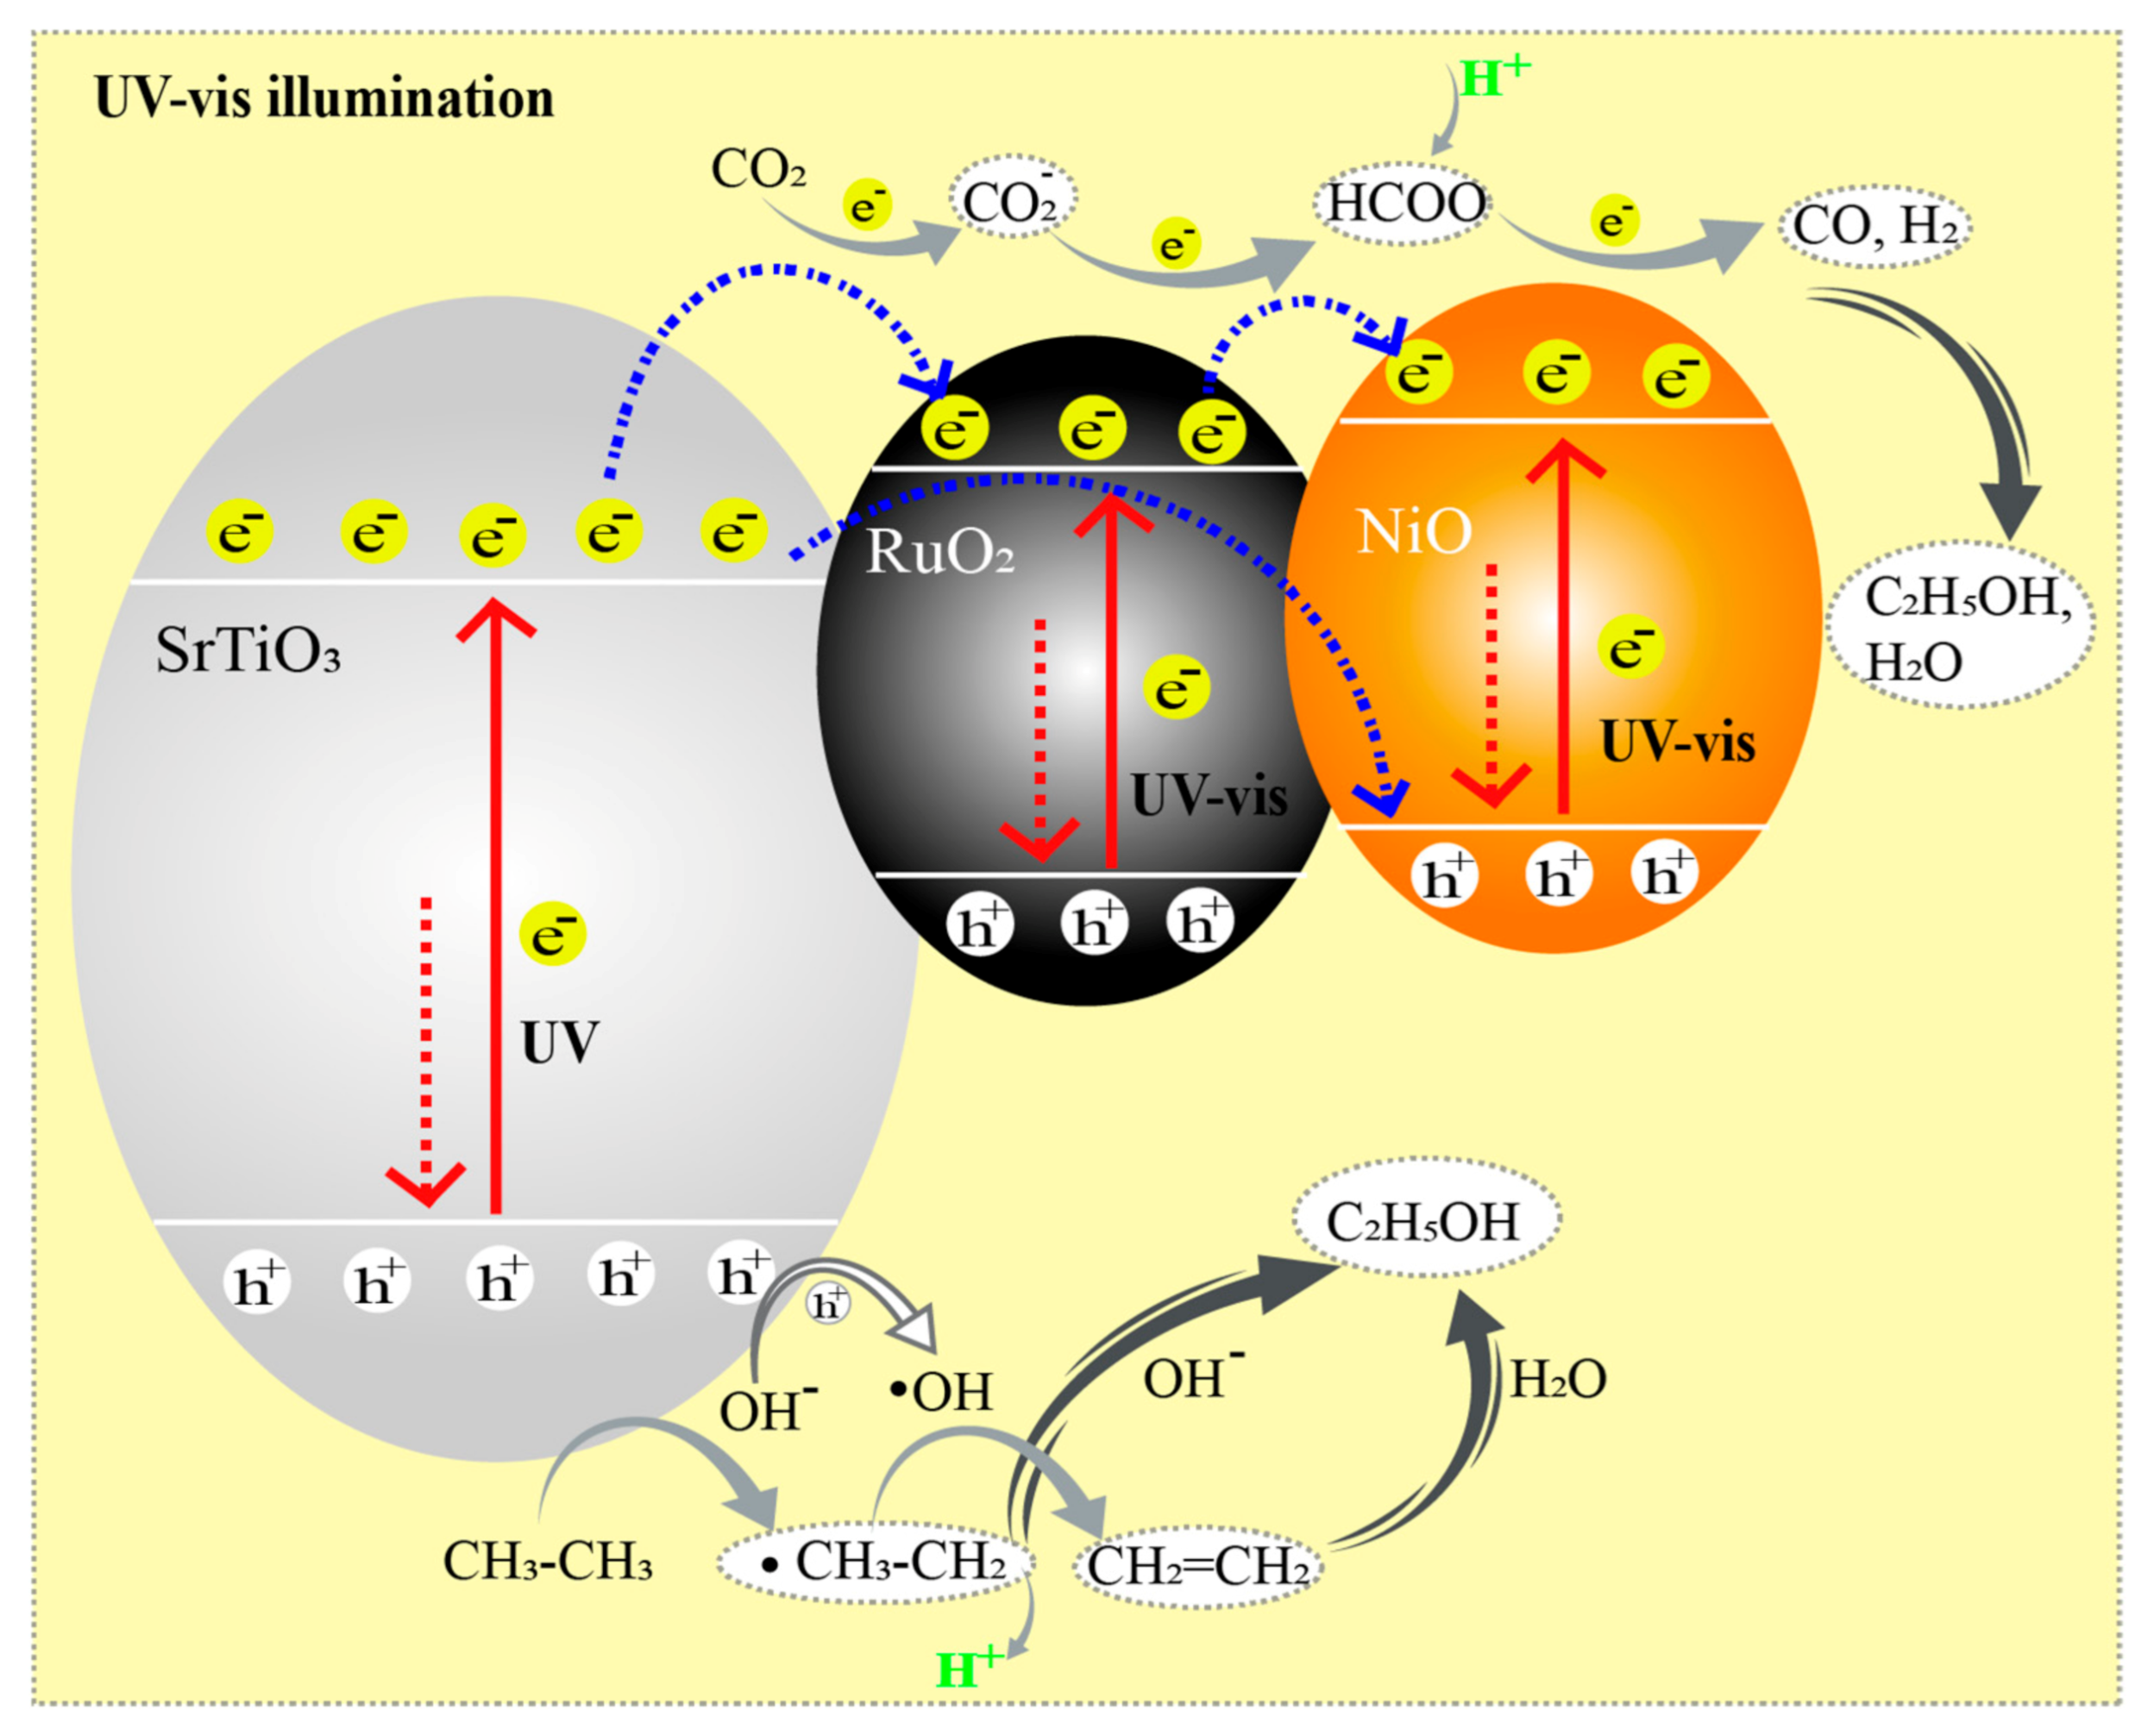
2.3. Reaction Mechanism Proposal

In an attempt to understand the potential mechanism of the gas-phase photo-thermal-reaction of CO2 with C2H6, mediated by sunlight, four extra experiments were carried out, adding: (i) 0.2 mmol of O2; (ii) 0.3 µmol of H2O; (iii) 4 µmol tetracyanoethylene (TCNE); or (iv) 10 µmol of TCNE (Figure 10).
TCNE was chosen as an electron scavenger since the cyano groups (CN) have low-energy π* orbitals and, consequently, present a high ability to accept electrons [54]. Therefore, it is expected that the chemical reduction reaction of CO2 by the photogenerated electrons at the photocatalyst conduction band is impaired. It was also reported that CN and NCO small-molecules can inhibit CO2 reduction and CO oxidation [55,56]. In this way, the oxygenate molecules production is also affected by CO insertion hindering. Accordingly, Figure 10a discloses that the addition of 4 µmol of TCNE severely blocked the ethanol production, being achieved a reaction rate of only 5.6 μmol EtOH gcat−1 h−1 (in contrast with the 85 μmol EtOH gcat−1 h−1 obtained in the absence of electron scavengers), while the utilization of 10 µmol of TCNE causing its total inhibition. This behavior suggests that the reaction mechanism is based on the charge separation into valence band holes and conduction band electrons.
The addition of water along with the CO2 and C2H6 diminished the reaction rate by about 47%, as can be seen in Figure 10b. In this case, the ethanol yield might have been compromised by the preferential production of carbonic acid through the reaction of CO2 with H2O, according to Equation (2), before the formation of the potential ethanol precursors, C2H4 and CO.
CO 2 +   H 2 O       H 2 CO 3
Even though O2 can act as an electron scavenger in CO2 hydrogenation reaction [57], in the present study, the ethanol yield was increased in its presence, reaching up to a production rate of about 1.7-fold higher (146 µmol EtOH gcat−1 h−1). This profile suggests that the photogenerated electrons were used by O2 to produce ethanol. According to Bergner et al. [58], the main products obtained from the reaction of oxygen atoms with ethane are ethanol, acetaldehyde, ketene, and CO. Ethanol formation is explained by the inclusion of one O(1D) atom into an ethane C–H bond, representing a promising path to the chemical complexity [58,59]. Moreover, at low O2 concentrations, the production of CO and H2O by the incomplete combustion of C2H6 may occur. Hence, the improved ethanol yield can also be linked to CO generation since two CO molecules can form C2H4 and C2H5OH, as proposed by Yang et al. [43].
So far, it can be established that the ethanol production is straightly connected with the reaction products of the CO2 and/or C2H6, taking into account the following pathways [8,60]: (i) dry reforming of C2H6, producing H2 and CO via Equation (3); (ii) oxidative dehydrogenation of C2H6 with CO2, generating C2H4, CO and H2O, according to Equation (3) and (4); (iii) non-oxidative dehydrogenation, converting C2H6 into C2H4 and H2, given by Equation (5); (iv) reverse water gas shift, forming CO and H2O, as shown in Equation (6); and (v) cracking of ethane to yield methane, through Equation (7).
C 2 H 6 ( g ) + 2   CO 2   ( g )     4   CO ( g )   + 3   H 2   ( g )    
C 2 H 6 ( g ) +   CO 2   ( g )     C 2 H 4   ( g ) + CO ( g ) + H 2 O ( l )
C 2 H 6 ( g )     C 2 H 4   ( g ) + H 2   ( g )
CO 2   ( g ) +   H 2   ( g )       CO ( g ) + H 2 O ( l )
C 2 H 6 ( g ) +   2   CO 2   ( g )     CH 4   ( g ) + 3   CO ( g ) + H 2 O ( l )
Additionally, syngas (CO and H2) can likewise be used to produce oxygenated organic compounds, such as methanol, ethanol, or mixed higher alcohols, based on the side reactions of the conventional Fischer–Tropsch (FT) process. In other words, following a polymerization mechanism, CO is activated on metal (Ru, Ni, Fe or Co) or metal carbide adsorbed (CHx or OCHx, with x = 0–3) intermediates that will react by a sequence of consecutive coupling to generate C2+ products (CnHm or CnHmO) [61]. Therefore, ethanol can be obtained from syngas in conformity with Equation (8). Furthermore, as previously mentioned, besides from CO bond insertion, ethanol production can also be achieved from ethylene hydration, according to Equation (9) [43], which might involve the breakage of the alkene’s π and O-H bonds of the water and the formation of C-H and C-OH bonds.
2   CO   +   4 H 2     C 2 H 5 OH   +   H 2 O
C 2 H 4 +   H 2 O       C 2 H 5 OH
Building on the information above mentioned and assuming that no methane was generated and H2O was detected in the reactor after proper cooling, a theoretical global equation regarding the formation of ethanol from CO2 and C2H6 is proposed in Equation (10).
3   C 2 H 6 ( g ) +   4   CO 2   ( g )     4   CO ( g ) + H 2 O ( l ) + 3   C 2 H 5 OH ( g )
This reaction supposes that 3 moles of ethane react with 4 moles of CO2 to form 4 moles of CO and 3 moles of ethanol. However, in all the experiments, the [C2H6]:[CO2] molar ratio was 3:1, which might explain the non-appearance of CO among the reaction products. Moreover, given the high initial concentration of C2H6 comparatively to CO2, the non-oxidative dehydrogenation could have been favored. Notwithstanding, this hypothesis cannot be accurately confirmed since the C2H4 content was always below the μGC detection limit (<2 ppm). On the other hand, the fact that ethanol production was increased when O2 was present (Figure 10) might be related to the hydroformylation stem from the generated ethylene [8].
Based on the results discussed, a coherent mechanism for hybrid SrTiO3:RuO2:NiO catalyst towards the production of ethanol (EtOH) from CO2 and C2H6 is here proposed (Figure 11). As previously evidenced, near 60% of the ethanol has been produced under visible light illumination, where electron excitation in SrTiO3 UV-vis absorption is limited to the UV region. Hence, this photocatalyst’s photoresponse in the visible region can be attributed to the RuO2 and NiO nanoparticles’ optical absorption deposited on the SrTiO3. In this case, co-doping causes a charge difference resulting in the distribution of electrons across the Ru–O and Ni–O covalent bands. Meanwhile, photoinduced electrons (e) are easily promoted from the valence band (VB) to the conduction band (CB), creating holes (h+) in the VB. The excited electrons in the CB of the SrTiO3 are continuously transferred to adjacent atoms to maintain the neutrality of the metal oxide nanoparticles, that phenomenon was reported by the Schottky barrier theory. The synthesis gas is produced via CO2−assisted hydrogenation, in which case the electron reduces CO2 into intermediates, CO2− and HCOO, with an uncertain transition state. Then photoinduced electrons in the metal oxide sites combined with H+ reduce these intermediates, resulting in H2 and CO. On the other hand, holes in the VB of SrTiO3 are captured by surface-bound OH on the semiconductor to form ·OH radicals. These hydroxyl radicals can abstract a hydrogen atom from ethane to generate ethyl radicals, probably bonded to the surface. Simultaneously, ethane reforming occurs via the activated C–H bond and subsequent formation of the alkoxides and ethyl, which are adsorbed and oxidized via h+ or ·OH to an intermediate radical, converting to ethylene. Finally, these reaction intermediates when coupling ethyl and hydroxyl radicals, or through oxidation or hydration of ethylene result in ethanol formation.

3. Materials and Methods

3.1. Chemicals

Ruthenium chloride (RuCl3·H2O) with 36.96% (w/w) purity was obtained from Johnson Matthey, London, UK. Nickel chloride (NiCl2) with 99.99% (w/w) purity was provided by Aldrich, Saint Louis, MO, USA. Strontium titanate (SrTiO3) nanopowder (<100 nm particle size) with ≥99% (w/w) purity was supplied by Sigma-Aldrich, Saint Louis, MO, USA. Ethylene glycol (HOCH2CH2OH) with 99% (w/v) purity was purchased from Sigma-Aldrich, MO, USA. Ethanol absolute and acetone, 99.8% and 99.5 % (v/v), respectively, were supplied by Panreac AppliChem, Spain. Tetracyanoethylene with 98% (w/w) purity was acquired from Aldrich, Saint Louis, MO, USA. All chemicals were used as received without further purification. Ultrapure water was obtained from a Milli-Q IQ 7000 ultrapure-water system (18.2 MΩ cm at 25 °C, Merck, Darmstadt, Germany). For gas chromatography and reactants feeding system, the gas bottles of helium 5.0 (99.999%), nitrogen 2.8 (99.8%), oxygen 2.5 (99.5%), hydrogen 5.0 (99.999%), carbon dioxide 4.5 (99.995%), ethane 3.5 (99.95%) and synthetic air K 5.0 (99.999%) were supplied by Linde, Dublin, Ireland.

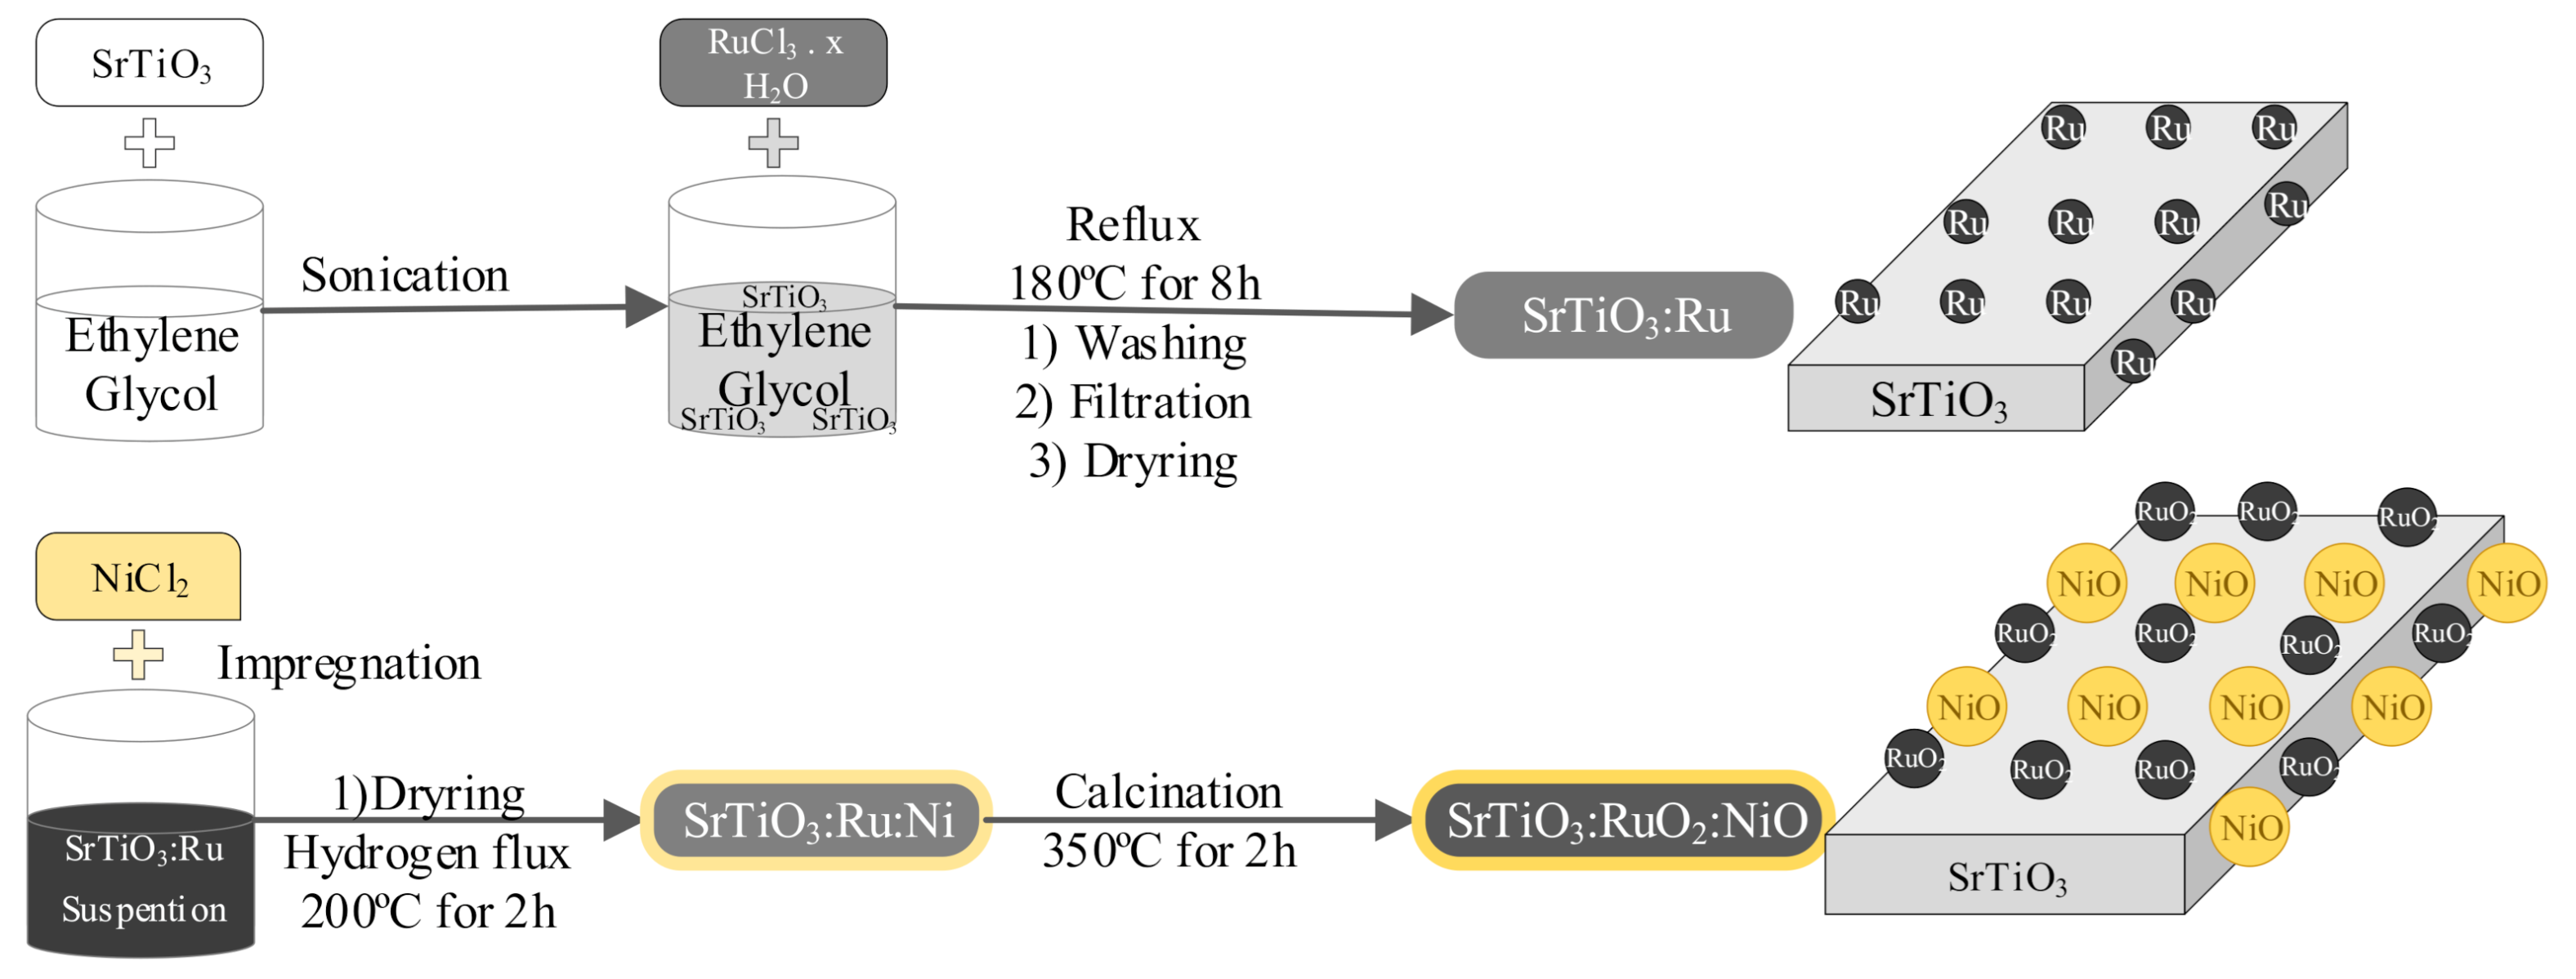
3.2. Preparation of the SrTiO3:RuO2:NiO Photocatalyst

Initially, different amounts of RuCl3.H2O (to obtain a final Ru content of 0.2, 0.4 and 0.8 wt.%) were added to a suspension of SrTiO3 nanopowder in ethylene glycol (5 mg mL−1), previously obtained by sonication at 700 W for 30 min, where Ru3+ was impregnated and reduced by reflux method at 180 °C, for 8 h, under continuous stirring (1000 rpm), as reported by Mateo et al. [21]. Then, SrTiO3-Ru nanoparticles were recovered by vacuum filtration (Nylon membranes, Membrane Solution MS®, Seattle, WA, USA) and further washed with a mixture of ultrapure water (1 L) and acetone (200 mL), and dried in an oven at 100 °C for 2-h. The actual concentration of Ru3+ in the SrTiO3-Ru nanopowder was estimated by ICP-OES, whose values are depicted in Table S1.
Afterward, NiCl2 was impregnated in SrTiO3-Ru nanoparticles (with Ru:Ni molar ratios of 1:0, 1:0.3, 1:1, and 1:2, based on the ICP-OES results). In this sense, 200 mg of SrTiO3-Ru nanopowder was dispersed in 10 mL of ultrapure water by sonication at 700 W for 15 min. Then, this dispersion was dried at 70 °C, under slow stirring, and when the solution volume halved, 5 mL of a NiCl3 solution (NiCl3 dissolved in ultrapure water) was added dropwise. The slow mixing was kept until complete evaporation of the water. Subsequently, SrTiO3-Ru-NiCl2 nanopowder was reduced under H2 atmosphere (100 mL min −1) at 200 °C for 2 h. Lastly, SrTiO3-Ru-Ni nanoparticles were oxidized by calcination at 350 °C for 3 h, under ambient atmosphere, to obtain the nanostructured SrTiO3-RuO2-NiO2 photocatalyst. The preparation procedure is summarized in Figure 1. The Ni concentration in the catalyst was also assessed by ICP-OES (Table S1).

3.3. Photocatalyst Characterization

The final photocatalyst composition in terms of Ru and Ni metals was determined by inductively coupled plasma-optical emission spectrometry (ICP-OES, Varian 715-ES, CA, USA) after aqua regia extraction. The best photocatalyst was also characterized by Raman spectroscopy, X-ray photoelectron spectroscopy (XPS), transition electron microscopy (TEM), energy-dispersive X-ray spectroscopy (EDS) mapping, X-ray diffraction (XRD), and UV-vis diffuse reflectance spectroscopy (DRS).
Raman spectroscopy analyses were carried out in a Horiba, Kyoto, Japan, Jobin YvonLabram HR UV–Visible–NIR (200–1600 nm) Raman Microscope Spectrometer, using a 632 nm laser as the excitation source. XPS was recorded on a SPECS spectrometer (SPECS, Berlin, Germany) with a Phoibos 150 9 MCD detector using a non-monochromatic X-ray source (Al and Mg) operating at 200 W, to compensate for any kind of charging effect, being the C1s binding energy peak at 284.6 eV used as a reference. TEM images and EDS mapping were recorded in a Philips CM300 FEG system (Philips, Amsterdam, The Netherlands) with 100 kV operating voltage. Dried samples were prepared onto a carbon-coated copper TEM grid. Lattice parameter measurements for SrTiO3 co-doped were performed by XRD analysis. The photocatalyst’s powder XRD pattern was recorded using a Philips (Amsterdam, The Netherlands) X’PERT diffractometer, equipped with a proportional detector and a secondary graphite monochromator. Data were collected stepwise over the 2θ ranges with an accumulation time of 20 s step−1. UV–vis DRS analysis in the range of 200–800 nm was recorded on a Cary 5000 spectrophotometer from Varian (CA, USA).

3.4. Experimental Procedure

Thermo-photo-assisted experiments were carried out in batch operation mode at gas-phase, using a photocatalytic apparatus entailing four main parts (see Figure S2): (i) a 51 mL pressurized cylindrical reaction vessel made of quartz glass and equipped with a temperature controlling system (≤200 °C) and a pressure gauge (≤2 bar); (ii) a 1000 W·m2 mercury-xenon lamp (visible light type) connected to a Lightningcure Spot LC8 light source (Hamamatsu, Japan), reproducing the solar light spectrum within 400 < λ < 700 nm; (iii) reactants feeding system with a regulator of high pressure (2° stadium); and (iv) an analytical system composed of one micro gas chromatograph (GC) provided with a thermal conductivity detector (TCD) and a GC provided with a flame ionization detector (FID). The μGC-TCD (Agilent 490 MicroGC, CA, USA) was equipped with two channels, both with independent TCD, using Ar as the carrier gas. One channel had a MolSieve 5A column (MS5A 10 m heated, injector, backflush) to analyze H2. The other had a Pore Plot Q (PPQ 10 m heated, injector, backflush) column to analyze CO2, CO, and C1-C4 hydrocarbons. The GC-FID (Varian 3900, CA, USA) was equipped with an HP-5 column (30 m length, 0.25 mm, inner diameter, and 0.25 μm film) and using argon as the carrier gas to analyze oxygenates, such as EtOH and diethyl ether.
The cylindrical quartz vessel (Figure S2) had an input and an output sealed by vacuum fittings and syringe valves (SV) provided with push buttons (PB), to allow the sampling of the gas from the reactor headspace using a gas syringe. The reactor also had an internal pressure meter (PM), working up to 2 bar. The heating system was composed of a fiberglass heating tape (FHT), placed around the reactor, and a temperature probe (TP), located between the reactor’s end and the FHT, both connected to a digital thermostat temperature controller (DTTC), able to control the temperature up to 200 °C.
Before each experiment, the reactor was washed five times with ultrapure water and dried at 200 °C. After cooling until room temperature, 20 mg of the photocatalyst, with the desired composition, was introduced in the reactor’s center. Then, the reactor inlet was connected to a gas bottle and a purging with C2H6 was performed for 5 min, keeping both valves open. Afterward, the reactor’s outlet was closed until the pressure increased by 2 bar and successively opened to eliminate any residual gas. This process was repeated 4 times. In the sequence, the intended gaseous proportions of C2H6 and CO2 were fed to the reactor with the outlet valve closed, reaching a pressure of 1.35 bar. Subsequently, the DTTC was connected to the reactor and programmed for 50 °C, 100 °C, 150 °C or 200 °C. Once the desired temperature was reached, 2 min were awaited until the pressure stabilized. Lastly, the initial sample was collected immediately before the reaction was initiated by turning on the illumination.

4. Conclusions

The heterogeneous thermo-photocatalysis induced by SrTiO3 co-doped with RuO2 and NiO has shown itself a promising process to convert CO2, the main greenhouse gas, and C2H6, the second main constituent of shale gas, into EtOH, a value-added chemical, under simulated sunlight at moderate temperature. In contrast with some traditional techniques that use these compounds at temperatures between 300 and 900 °C. The optimized SrTiO3:RuO2:NiO thermo-photocatalyst (0.8 wt.% Ru; [Ru]:[Ni] molar ratio of 1:1) exhibited the highest photocatalytic activity at 200 °C, under batch operation mode, achieving a maximum ethanol’s production rate of 85 μmol EtOH gcat−1 h−1, starting from a gas-phase mixture with a [CO2]:[C2H6] molar ratio of ca. 1:3.
The catalyst photoresponse towards EtOH generation can mainly be ascribed to the visible photons since UV radiation contributed only about 37% to the global reaction efficiency. This behavior is in good agreement with UV-Vis DRS characterization, where it was found that the double doping process increased the photocatalyst’s visible light absorption by decreasing its optical band gap energy. The absence of radiation and NiO on the photocatalyst’s surface resulted in no ethanol formation, and temperatures below 200 °C considerably decreased the reaction’s yield by more than 55%. Regrettably, the photocatalyst showed poor stability, as the decay on ethanol’s production was significant right after a 2nd use (>50%), reaching total inhibition after a 4th use. Mechanistic studies adding electron scavenger molecules suggested that the photogenerated electron-hole pairs’ charge separation indeed contributed to the thermo-photoconversion reaction. Moreover, it was inferred that the ethane non-oxidative dehydrogenation pathway towards EtOH synthesis was favored, considering that the molar ratio between C2H6 and CO2 was 3 to 1, when it should have been 3 to 4, taking into account the general equation proposed in this exploratory paper. In any case, more insights are needed regarding the feasibility of this process towards the intensification of the reaction between these underutilized gases aiming at the production of solar fuels.

Supplementary Materials

The following are available online at https://0-www-mdpi-com.brum.beds.ac.uk/article/10.3390/catal11040461/s1, Figure S1: Mass spectra of the by-products obtained from the thermo-photocatalytic reaction of CO2 with C2H6 over SrTiO3:RuO2:NiO catalyst, namely: (a) ethanol; and (b) diethyl ether. Experimental conditions: 20 mg of SrTiO3:RuO2:NiO; [Ru]:[Ni] = 1:1 (molar); Ru = 0.8 wt. %; PC2H6 = 1.01 bar; PCO2 = 0.35 bar; T = 200 °C and I = 1000 W m−2. Equipment: Agilent 5973 inert Gas Chromatograph/Mass Spectrometer; electronic ionization, positive ion mode, Figure S2: Schematic representation of the batch photocatalytic system, Table S1: Concentration of Ru and Ni elements (wt.%) in the photocatalyst assessed by ICP–OES analysis (after aqua regia extraction).

Author Contributions

Conceptualization, J.A. and H.G.; data curation, L.O.P. and T.F.C.V.S.; investigation, L.O.P.; methodology, J.A. and H.G.; resources, H.G.; supervision, R.J.E.M., R.A.R.B., V.J.P.V., T.F.C.V.S. and H.G.; validation, L.O.P.; visualization, L.O.P. and T.F.C.V.S.; writing—original draft, L.O.P. and T.F.C.V.S.; writing—review & editing, J.A., R.J.E.M., R.A.R.B., V.J.P.V., T.F.C.V.S. and H.G. All authors have read and agreed to the published version of the manuscript.

Funding

This work was financially supported by the Base Funding—UIDB/50020/2020 of the Associate Laboratory LSRE-LCM—funded by national funds through FCT/MCTES (PIDDAC). Larissa O. Paulista also wants to acknowledge for her doctoral fellowship (reference SFRH/BD/137639/2018), supported by FCT. Tânia F. C. V. Silva and Vítor J. P. Vilar acknowledge the FCT Individual Call to Scientific Employment Stimulus 2017 (CEECIND/01386/2017 and CEECIND/01317/2017, respectively). Josep Albero and Hermenegildo García are also grateful to the Spanish Ministry of Science and Innovation (RTI2018-098237-CO2-R1 and Severo Ochoa), Generalitat Valencia (Prometeo 2017/083) and European Union’s Horizon 2020 research and innovation programme under grant agreement No 862453, project FlowPhotochem, by financial contribution.

Conflicts of Interest

The authors declare no conflict of interest.

References

  1. Chang, X.; Wang, T.; Gong, J. CO2 photo-reduction: Insights into CO2 activation and reaction on surfaces of photocatalysts. Energy Environ. Sci. 2016, 9, 2177–2196. [Google Scholar] [CrossRef]
  2. Li, M.; Li, P.; Chang, K.; Wang, T.; Liu, L.; Kang, Q.; Ouyang, S.; Ye, J. Highly efficient and stable photocatalytic reduction of CO2 to CH4 over Ru loaded NaTaO3. Chem. Commun. 2015, 51, 7645–7648. [Google Scholar] [CrossRef] [PubMed]
  3. Niu, F.; Shen, S.; Zhang, N.; Chen, J.; Guo, L. Cobaloxime coenzyme catalyzing artificial photosynthesis for hydrogen generation over CdS nanocrystals. Appl. Catal. B-Environ. 2016, 199, 134–141. [Google Scholar] [CrossRef]
  4. Noureldin, M.M.B.; Elbashir, N.O.; Gabriel, K.J.; El-Halwagi, M.M. A Process Integration Approach to the Assessment of CO2 Fixation through Dry Reforming. ACS Sustain. Chem. Eng. 2015, 3, 625–636. [Google Scholar] [CrossRef]
  5. Börner, A.; Franke, R. Hydroformylation: Fundamentals, Processes, and Applications in Organic Synthesis; John Wiley & Sons: Hoboken, NJ, USA, 2016. [Google Scholar]
  6. Franke, R.; Selent, D.; Börner, A. Applied Hydroformylation. Chem. Rev. 2012, 112, 5675–5732. [Google Scholar] [CrossRef]
  7. Xie, Z.; Xu, Y.; Xie, M.; Chen, X.; Lee, J.H.; Stavitski, E.; Kattel, S.; Chen, J.G. Reactions of CO2 and ethane enable CO bond insertion for production of C3 oxygenates. Nat. Commun. 2020, 11, 1–8. [Google Scholar] [CrossRef]
  8. Myint, M.; Yan, B.; Wan, J.; Zhao, S.; Chen, J.G. Reforming and oxidative dehydrogenation of ethane with CO2 as a soft oxidant over bimetallic catalysts. J. Catal. 2016, 343, 168–177. [Google Scholar] [CrossRef] [Green Version]
  9. Skoufa, Z.; Heracleous, E.; Lemonidou, A.A. On ethane ODH mechanism and nature of active sites over NiO-based catalysts via isotopic labeling and methanol sorption studies. J. Catal. 2015, 322, 118–129. [Google Scholar] [CrossRef]
  10. Shen, Z.; Liu, J.; Xu, H.; Yue, Y.; Hua, W.; Shen, W. Dehydrogenation of ethane to ethylene over a highly efficient Ga2O3/HZSM-5 catalyst in the presence of CO2. Appl. Catal. A Gen. 2009, 356, 148–153. [Google Scholar] [CrossRef]
  11. Nair, V.; Muñoz-Batista, M.J.; Fernández-García, M.; Luque, R.; Colmenares, J.C. Thermo-Photocatalysis: Environmental and Energy Applications. ChemSusChem 2019, 12, 2098–2116. [Google Scholar] [CrossRef]
  12. Tu, W.; Zhou, Y.; Zou, Z. Photocatalytic Conversion of CO2 into Renewable Hydrocarbon Fuels: State-of-the-Art Accomplishment, Challenges, and Prospects. Adv. Mater. 2014, 26, 4607–4626. [Google Scholar] [CrossRef]
  13. Barber, J.; Tran, P.D. From natural to artificial photosynthesis. J. R. Soc. Interface R. Soc. 2013, 10. [Google Scholar] [CrossRef] [Green Version]
  14. Ola, O.; Maroto-Valer, M.M. Review of material design and reactor engineering on TiO2 photocatalysis for CO2 reduction. J. Photochem. Photobiol. C 2015, 24, 16–42. [Google Scholar] [CrossRef] [Green Version]
  15. Luo, C.; Zhao, J.; Li, Y.; Zhao, W.; Zeng, Y.; Wang, C. Photocatalytic CO2 reduction over SrTiO3: Correlation between surface structure and activity. Appl. Surf. Sci. 2018, 447, 627–635. [Google Scholar] [CrossRef]
  16. Shao, K.; Wang, Y.; Iqbal, M.; Lin, L.; Wang, K.; Zhang, X.; He, M.; He, T. Modification of Ag nanoparticles on the surface of SrTiO3 particles and resultant influence on photoreduction of CO2. Appl. Surf. Sci. 2018, 434, 717–724. [Google Scholar] [CrossRef]
  17. Kang, H.W.; Lim, S.N.; Park, S.B. Co-doping schemes to enhance H2 evolution under visible light irradiation over SrTiO3:Ni/M (M = La or Ta) prepared by spray pyrolysis. Int. J Hydrogen Energy 2012, 37, 5540–5549. [Google Scholar] [CrossRef]
  18. Kang, H.W.; Park, S.B. H2 evolution under visible light irradiation from aqueous methanol solution on SrTiO3: Cr/Ta prepared by spray pyrolysis from polymeric precursor. Int. J Hydrogen Energy 2011, 36, 9496–9504. [Google Scholar] [CrossRef]
  19. Takata, T.; Domen, K. Defect engineering of photocatalysts by doping of aliovalent metal cations for efficient water splitting. J. Phys. Chem. C 2009, 113, 19386–19388. [Google Scholar] [CrossRef]
  20. Niishiro, R.; Kato, H.; Kudo, A. Nickel and either tantalum or niobium-codoped TiO2 and SrTiO3 photocatalysts with visible-light response for H2 or O2 evolution from aqueous solutions. Phys. Chem. Chem. Phys. 2005, 7, 2241–2245. [Google Scholar] [CrossRef]
  21. Mateo, D.; Albero, J.; García, H. Titanium-Perovskite-Supported RuO2 Nanoparticles for Photocatalytic CO2 Methanation. Joule 2019, 3, 1949–1962. [Google Scholar] [CrossRef]
  22. Ola, O.; Mercedes Maroto-Valer, M. Role of catalyst carriers in CO2 photoreduction over nanocrystalline nickel loaded TiO2-based photocatalysts. J. Catal. 2014, 309, 300–308. [Google Scholar] [CrossRef]
  23. Li, Q.-S.; Domen, K.; Naito, S.; Onishi, T.; Tamaru, K. Photocatalytic synthesis and photodecomposition of ammonia over SrTiO3 and BaTiO3 based catalysts. Chem. Lett. 1983, 12, 321–324. [Google Scholar] [CrossRef]
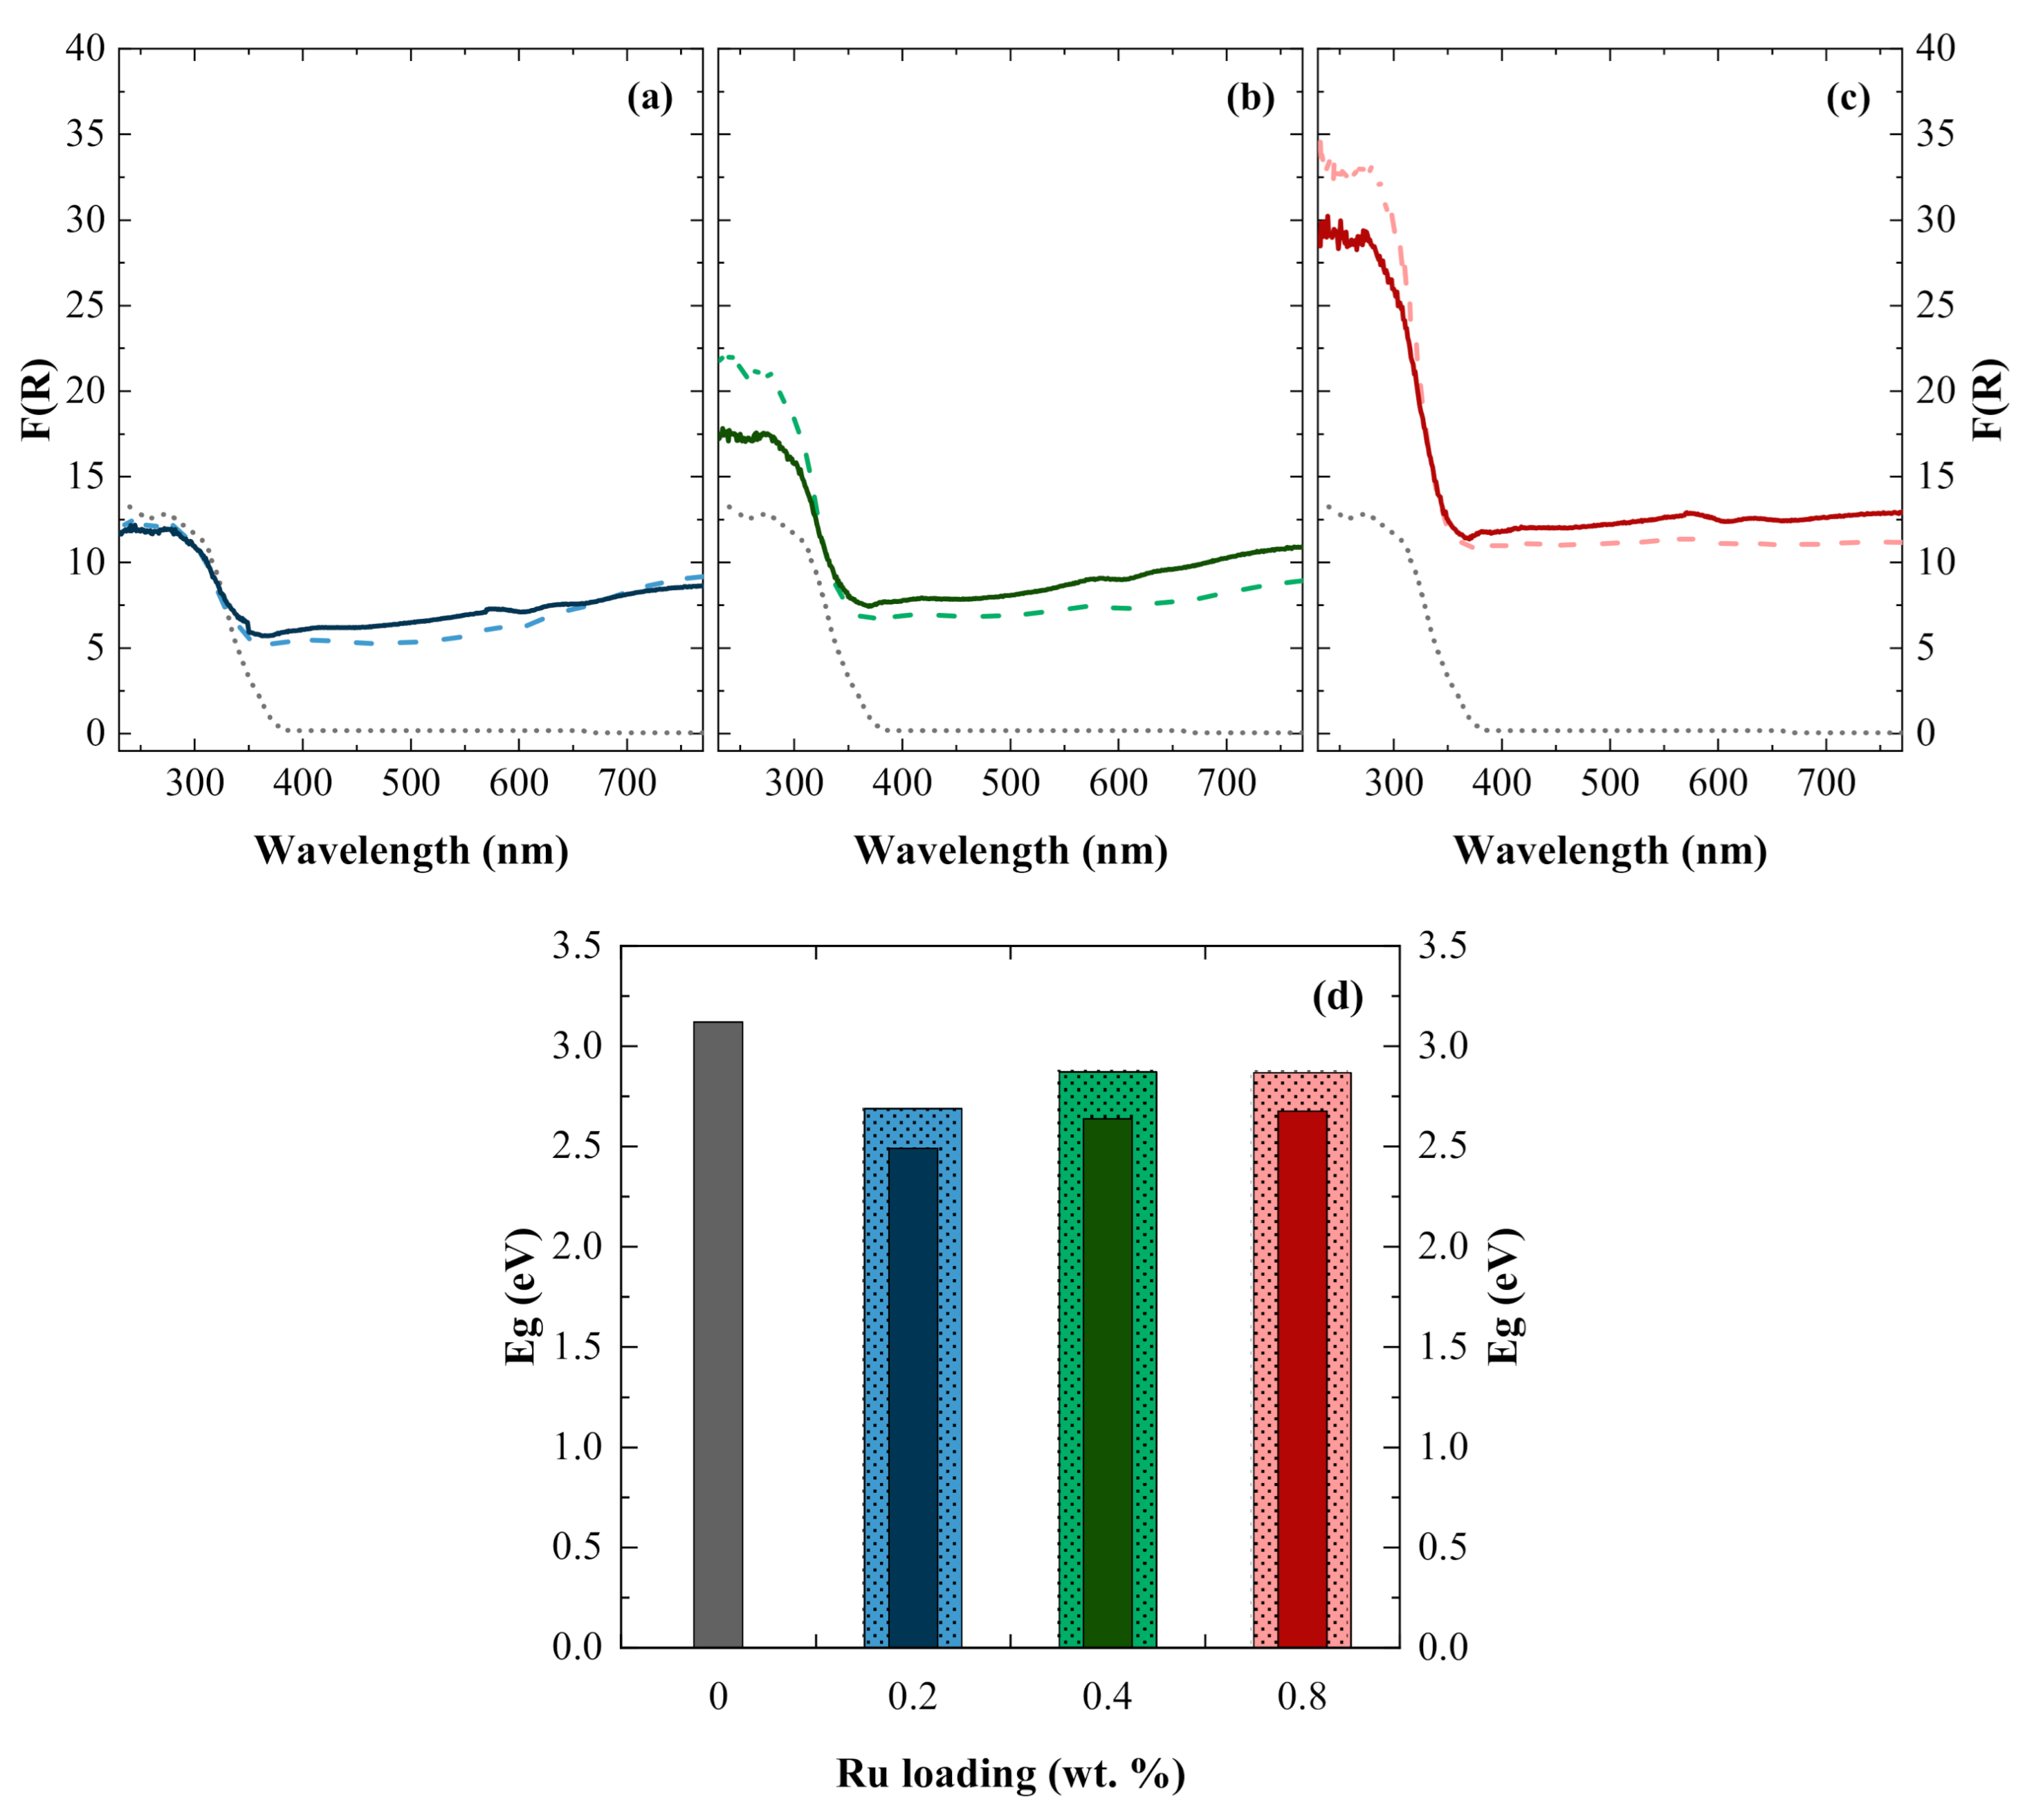
  24. Kubelka, P.; Munk, F. A contribution to the optics of pigments. Z. Tech. Phys. 1931, 12, 193. [Google Scholar]
  25. Zhang, C.; Jiang, N.; Xu, S.; Li, Z.; Liu, X.; Cheng, T.; Han, A.; Lv, H.; Sun, W.; Hou, Y. Towards high visible light photocatalytic activity in rare earth and N co-doped SrTiO3: A first principles evaluation and prediction. RSC Adv. 2017, 7, 16282–16289. [Google Scholar] [CrossRef] [Green Version]
  26. Ramya, E.; Rao, M.V.; Jyothi, L.; Rao, D.N. Photoluminescence and nonlinear optical properties of transition metal (Ag, Ni, Mn) doped ZnO nanoparticles. J. Nanosci. Nanotechnol. 2018, 18, 7072–7077. [Google Scholar] [CrossRef]
  27. García-Ramírez, P.; Ramírez-Morales, E.; Solis Cortazar, J.C.; Sirés, I.; Silva-Martínez, S. Influence of ruthenium doping on UV- and visible-light photoelectrocatalytic color removal from dye solutions using a TiO2 nanotube array photoanode. Chemosphere 2021, 267, 128925. [Google Scholar] [CrossRef]
  28. Mondal, A.; Giri, N.; Sarkar, S.; Majumdar, S.; Ray, R. Tuning the photocatalytic activity of ZnO by TM (TM = Fe, Co, Ni) doping. Mat. Sci. Semicon. Proc. 2019, 91, 333–340. [Google Scholar] [CrossRef]
  29. Jia, A.; Su, Z.; Lou, L.-L.; Liu, S. Synthesis and characterization of highly-active nickel and lanthanum co-doped SrTiO3. Solid State Sci. 2010, 12, 1140–1145. [Google Scholar] [CrossRef]
  30. Mitsui, T.; Nouma, S.; Landolt, B. Numerical Data and Functional Relation in Science and Technology: Crystal and Solid State Physics; New Series, Group 2I; Springer: Berlin/Heidelberg, Germany, 1982. [Google Scholar]
  31. Glazer, A. Simple ways of determining perovskite structures. Acta Crystallogr. A 1975, 31, 756–762. [Google Scholar] [CrossRef] [Green Version]
  32. Al-Shomar, S. Investigation the effect of doping concentration in Ruthenium-doped TiO2 thin films for solar cells and sensors applications. Mater. Res. Express. 2020, 7, 036409. [Google Scholar] [CrossRef]
  33. Langford, J.I.; Wilson, A. Scherrer after sixty years: A survey and some new results in the determination of crystallite size. J. Appl. Crystallogr. 1978, 11, 102–113. [Google Scholar] [CrossRef]
  34. Scherrer, P. Bestimmung der inneren Struktur und der Größe von Kolloidteilchen mittels Röntgenstrahlen. Kolloidchem. Ein Lehrb. 1912, 387–409. [Google Scholar] [CrossRef]
  35. Chekuri, R.D.; Tirukkovalluri, S.R. Synthesis of cobalt doped titania nano material assisted by gemini surfactant: Characterization and application in degradation of Acid Red under visible light irradiation. Sajog S. Afr. J. Chem. Eng. 2017, 24, 183–195. [Google Scholar] [CrossRef]
  36. Yahmadi, B.; Kamoun, O.; Alhalaili, B.; Alleg, S.; Vidu, R.; Kamoun Turki, N. Physical Investigations of (Co, Mn) Co-Doped ZnO Nanocrystalline Films. Nanomaterials 2020, 10, 1507. [Google Scholar] [CrossRef]
  37. Álvarez, M.A.; Bobadilla, L.F.; Garcilaso, V.; Centeno, M.A.; Odriozola, J.A. CO2 reforming of methane over Ni-Ru supported catalysts: On the nature of active sites by operando DRIFTS study. J. CO2 Util. 2018, 24, 509–515. [Google Scholar] [CrossRef]
  38. Vasquez, R.P. SrTiO3 by XPS. Surf. Sci. Spectra 1992, 1, 129–135. [Google Scholar] [CrossRef]
  39. Guedes, E.; Abud, F.; Martins, H.; Abbate, M.; Jardim, R.; Mossanek, R. Role of Ti-Ru interaction in SrTi0.5Ru0.5O3: Physical properties, x-ray spectroscopy, and cluster model calculations. Phys. Rev. B 2019, 100. [Google Scholar] [CrossRef]
  40. Mahala, C.; Basu, M. Nanosheets of NiCo2O4/NiO as efficient and stable electrocatalyst for oxygen evolution reaction. ACS Omega 2017, 2, 7559–7567. [Google Scholar] [CrossRef] [Green Version]
  41. Mayer, B.; Neumann, M. XPS satellites in transition metal oxides. J. Electron. Spectrosc. 1996, 81, 63–67. [Google Scholar] [CrossRef]
  42. Shi, J.; Hui, F.; Yuan, J.; Yu, Q.; Mei, S.; Zhang, Q.; Li, J.; Wang, W.; Yang, J.; Lu, J. Ru-Ti oxide based catalysts for HCl oxidation: The favorable oxygen species and influence of Ce additive. Catalysts 2019, 9, 108. [Google Scholar] [CrossRef] [Green Version]
  43. Yang, K.D.; Lee, C.W.; Jin, K.; Im, S.W.; Nam, K.T. Current status and bioinspired perspective of electrochemical conversion of CO2 to a long-chain hydrocarbon. J. Phys. Chem. Lett. 2017, 8, 538–545. [Google Scholar] [CrossRef]
  44. Zhang, M.; Yu, Y. Dehydration of ethanol to ethylene. Ind. Eng. Chem. 2013, 52, 9505–9514. [Google Scholar] [CrossRef]
  45. Oliveira, T.K.R.; Rosset, M.; Perez-Lopez, O.W. Ethanol dehydration to diethyl ether over Cu-Fe/ZSM-5 catalysts. Catal. Commun. 2018, 104, 32–36. [Google Scholar] [CrossRef]
  46. Schaaf, T.; Grünig, J.; Schuster, M.R.; Rothenfluh, T.; Orth, A. Methanation of CO2-storage of renewable energy in a gas distribution system. Energy Sustain. Soc. 2014, 4, 1–14. [Google Scholar] [CrossRef]
  47. Saladin, F.; Alxneit, I. Temperature dependence of the photochemical reduction of CO2 in the presence of H2O at the solid/gas interface of TiO2. J. Chem. Soc. Faraday Trans. 1997, 93, 4159–4163. [Google Scholar] [CrossRef]
  48. Moores, A.; Goettmann, F. The plasmon band in noble metal nanoparticles: An introduction to theory and applications. New J. Chem. 2006, 30, 1121–1132. [Google Scholar] [CrossRef]
  49. Devi, S.; Korake, P.; Achary, S.N.; Gupta, N.M. Genesis of enhanced photoactivity of CdS/Nix nanocomposites for visible-light-driven splitting of water. Int. J. Hydrogen Energy 2014, 39, 19424–19433. [Google Scholar] [CrossRef]
  50. Dai, W.; Xu, H.; Yu, J.; Hu, X.; Luo, X.; Tu, X.; Yang, L. Photocatalytic reduction of CO2 into methanol and ethanol over conducting polymers modified Bi2WO6 microspheres under visible light. Appl. Surf. Sci 2015, 356, 173–180. [Google Scholar] [CrossRef]
  51. Cheng, M.; Yang, S.; Chen, R.; Zhu, X.; Liao, Q.; Huang, Y. Visible light responsive CdS sensitized TiO2 nanorod array films for efficient photocatalytic reduction of gas phase CO2. Mol. Catal. 2018, 448, 185–194. [Google Scholar] [CrossRef]
  52. Panayotov, D.; Kondratyuk, P.; Yates, J. Photooxidation of a mustard gas simulant over TiO2− SiO2 mixed-oxide photocatalyst: Site poisoning by oxidation products and reactivation. Langmuir 2004, 20, 3674–3678. [Google Scholar] [CrossRef]
  53. Argyle, M.D.; Bartholomew, C.H. Heterogeneous catalyst deactivation and regeneration: A review. Catalysts 2015, 5, 145–269. [Google Scholar] [CrossRef] [Green Version]
  54. Fatiadi, A.J. Addition and cycloaddition reactions of tetracyanoethylene (TCNE) in organic chemistry. Synthesis 1987, 1987, 749–789. [Google Scholar] [CrossRef]
  55. Wang, V.C.C.; Can, M.; Pierce, E.; Ragsdale, S.W.; Armstrong, F.A. A Unified Electrocatalytic Description of the Action of Inhibitors of Nickel Carbon Monoxide Dehydrogenase. J. Am. Chem. Soc. 2013, 135, 2198–2206. [Google Scholar] [CrossRef] [PubMed] [Green Version]
  56. Bachmeier, A.; Hall, S.; Ragsdale, S.W.; Armstrong, F.A. Selective Visible-Light-Driven CO2 Reduction on a p-Type Dye-Sensitised NiO Photocathode. J. Am. Chem. Soc. 2014, 179–191. [Google Scholar] [CrossRef] [Green Version]
  57. Dey, G.R. Chemical Reduction of CO2 to Different Products during Photo Catalytic Reaction on TiO2 under Diverse Conditions: An Overview. J. Nat. Gas Chem. 2007, 16, 217–226. [Google Scholar] [CrossRef]
  58. Bergner, J.B.; Öberg, K.I.; Rajappan, M. Oxygen atom reactions with C2H6, C2H4, and C2H2 in ices. Astrophys. J. 2019, 874, 115. [Google Scholar] [CrossRef] [Green Version]
  59. DeMore, W.B. Reaction of O(1D) with hydrocarbons in liquid argon. J. Phys. Chem. 1969, 73, 391–395. [Google Scholar] [CrossRef]
  60. Zumdahl, S.S. Chemical Principles, 6th ed.; D. C. Heath: Lexington, MA, USA, 1992. [Google Scholar]
  61. Albero, J.; Peng, Y.; Garcia, H. Photocatalytic CO2 reduction to C2+ products. ACS Catal. 2020, 10, 5734–5749. [Google Scholar] [CrossRef]
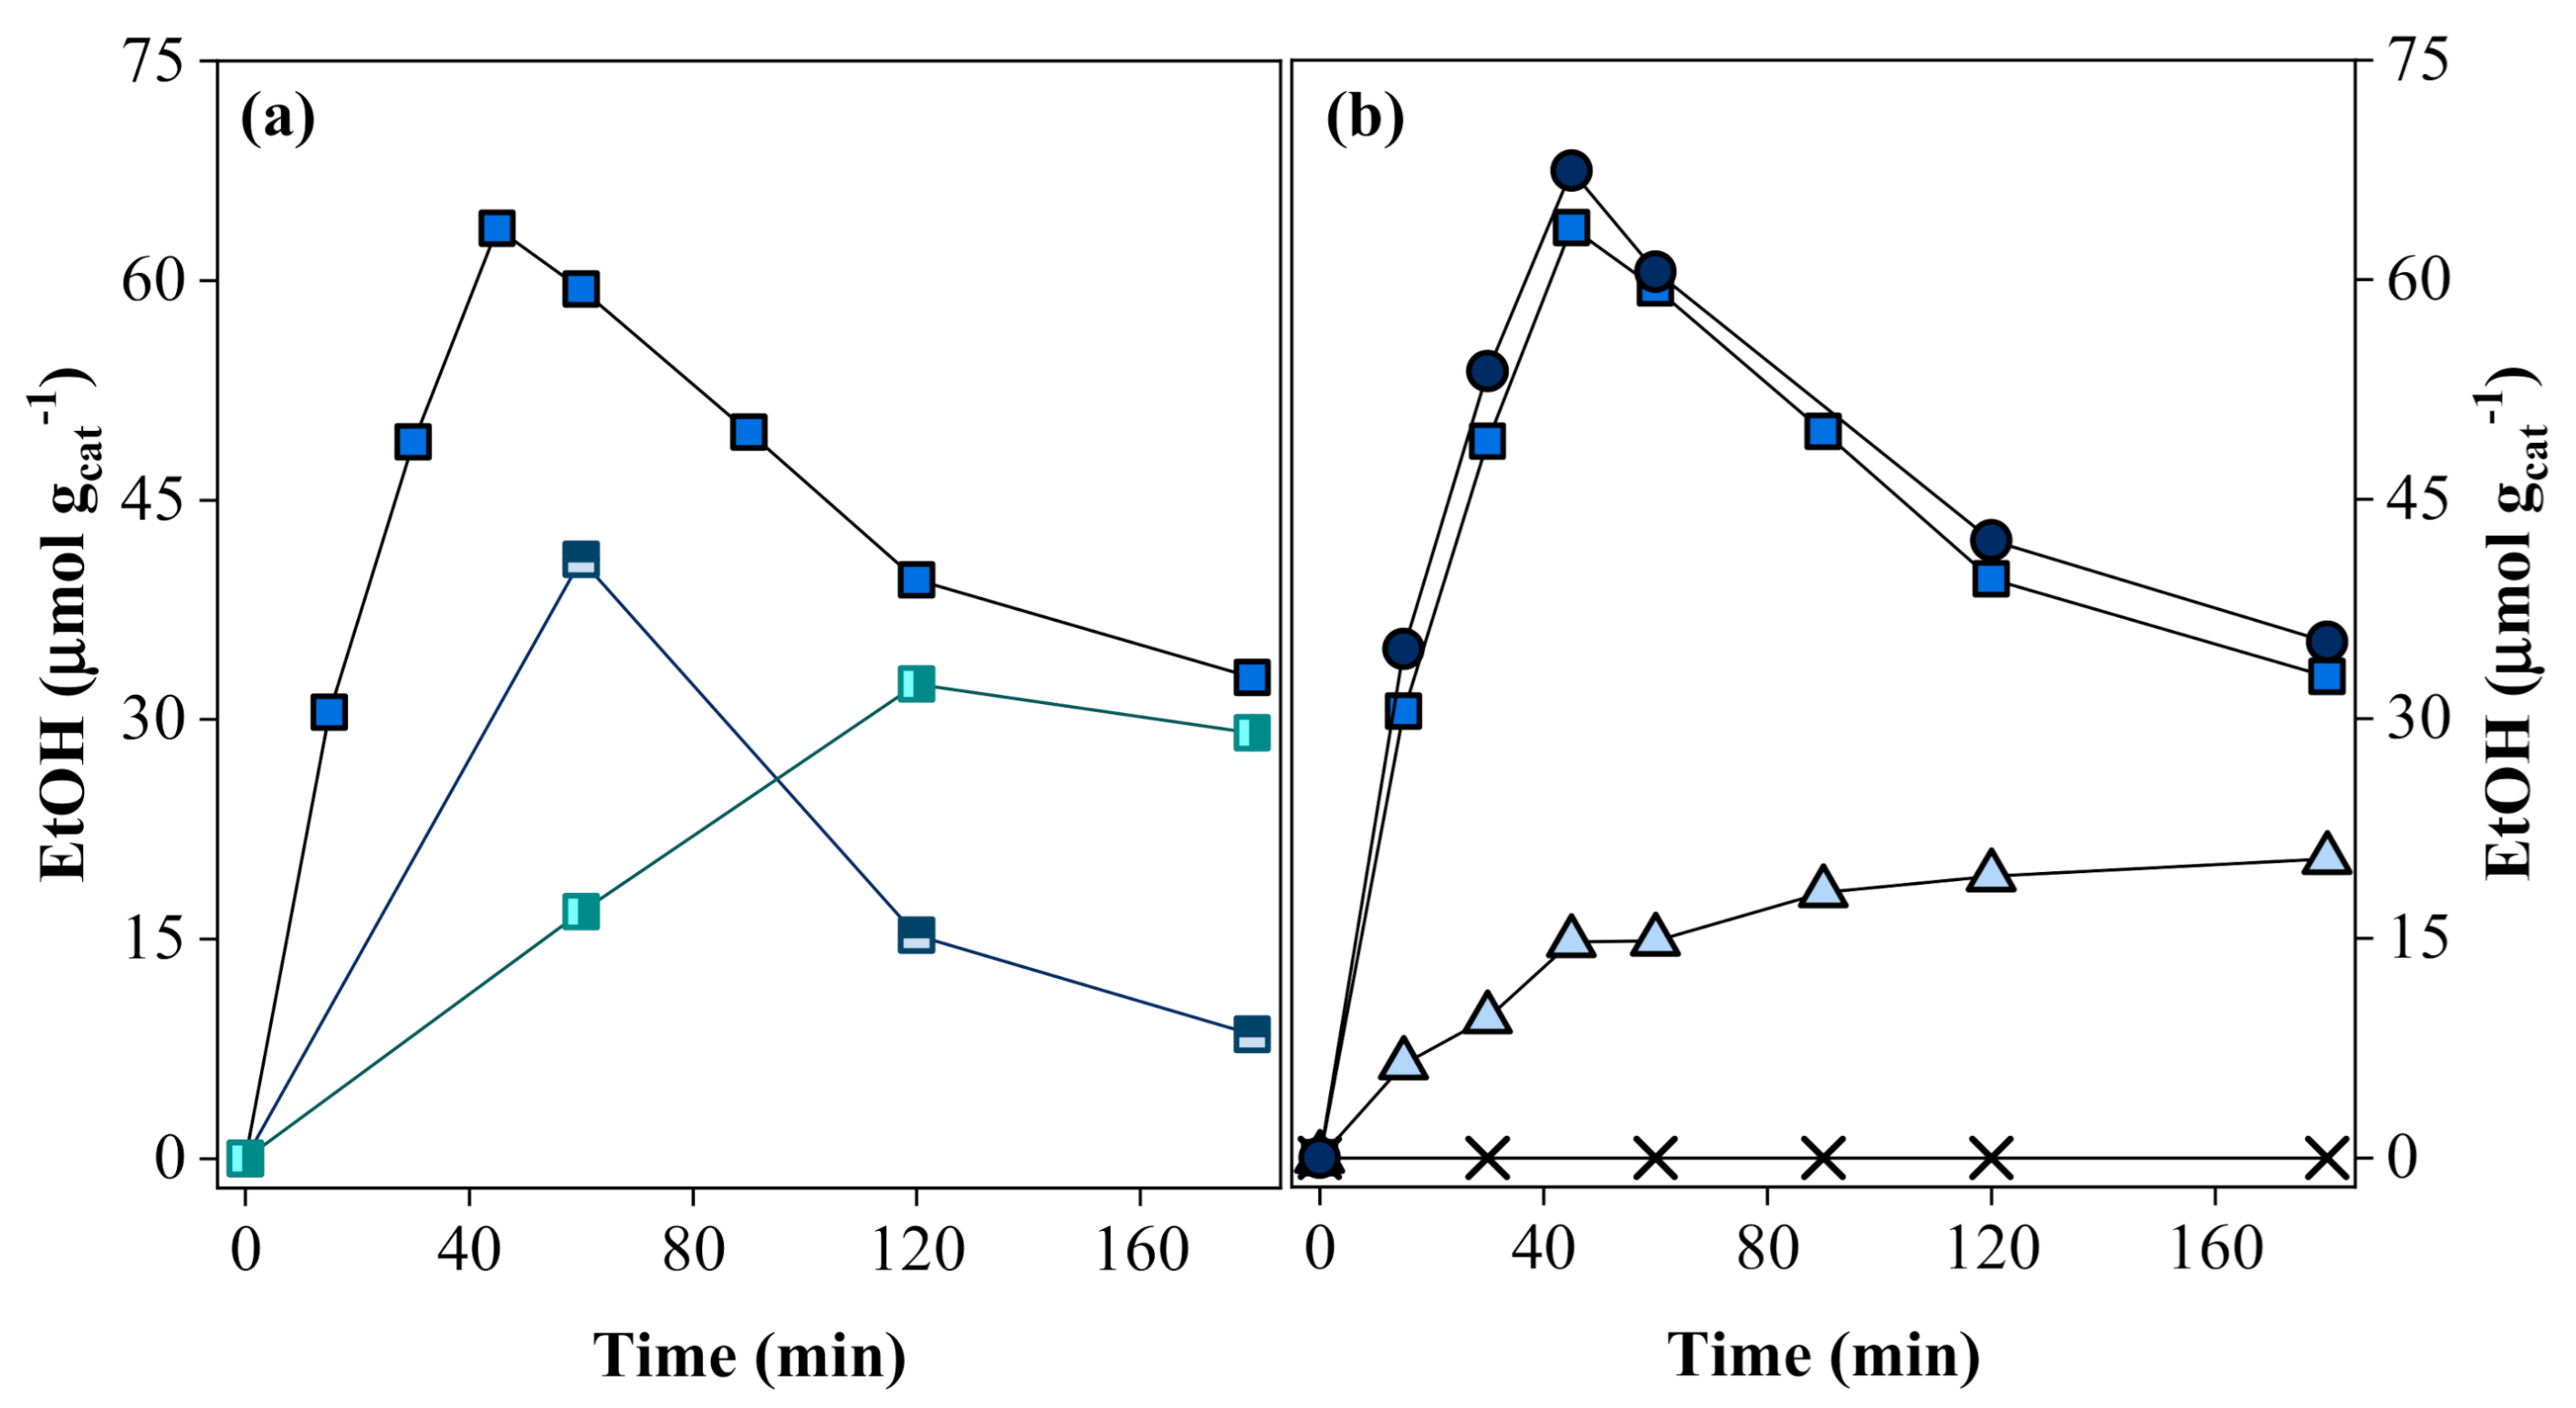
Figure 1. Schematic representation of the SrTiO2:RuO2:NiO photocatalyst preparation method.
Catalysts 11 00461 g001
Figure 2. (ac) UV-Vis diffuse reflectance spectra, represented as a Kubelka-Munk function of the reflectance—F(R), and (d) optical band gap energy (Eg) for undoped SrTiO3 (dotted lines, darker solid bar), Ru-doped SrTiO3 (dashed lines, patterned bars) and Ru and Ni co-doped SrTiO3 (solid lines, colored solid bars) photocatalysts, using Ru concentrations of (a) 0.2 wt. %, (b) 0.4 wt. %, and (c) 0.8 wt. % and a [Ru]:[Ni] molar ratio of 1:1.
Catalysts 11 00461 g002
Figure 3. XRD pattern and Raman spectrum (inset) for SrTiO3:RuO2:NiO photocatalyst (0.8 wt. % of Ru; [Ru]:[Ni] molar ratio of 1:1). XRD diffraction peaks corresponding to either SrTiO3 (*), RuO2 (°), and NiO (●).
Catalysts 11 00461 g003
Figure 4. EDS elemental mapping (Sr, Ti, O, Ru, Ni) and TEM images for SrTiO3:RuO2:NiO photocatalyst (0.8 wt. % of Ru; [Ru]:[Ni] molar ratio of 1:1).
Catalysts 11 00461 g004
Figure 5. High-resolution XPS spectra of the (a) Sr 3d, (b) C 1s + Ru 3d, (c) Ru 3p + Ti 2p, (d) O 1s, and (e) Ni 2p occupied states recorded for the SrTiO3:RuO2:NiO photocatalyst (0.8 wt.% of Ru; [Ru]:[Ni] molar ratio of 1:1), along with the respective fitting and deconvolution curves.
Catalysts 11 00461 g005
Figure 6. Evolution of the ethanol production from CO2 and C2H6 as a function of the photoreaction time, using different SrTiO3:RuO2:NiO photocatalyst compositions: (a) Ru loadings of 0.2 wt.% ( Catalysts 11 00461 i001), 0.4 wt.% ( Catalysts 11 00461 i002), and 0.8 wt.% ( Catalysts 11 00461 i003), keeping a [Ru]:[Ni] molar ratio of 1:1; (b) [Ru]:[Ni] molar ratios of 1:0 ( Catalysts 11 00461 i004), 1:0.3 ( Catalysts 11 00461 i005), 1:1 ( Catalysts 11 00461 i003), and 1:2 ( Catalysts 11 00461 i006), fixing the Ru content on 0.8 wt. %. Experimental conditions: PC2H6 = 1.01 bar; PCO2 = 0.35 bar; 20 mg of photocatalyst; T = 200 °C; and I = 1000 W m−2.
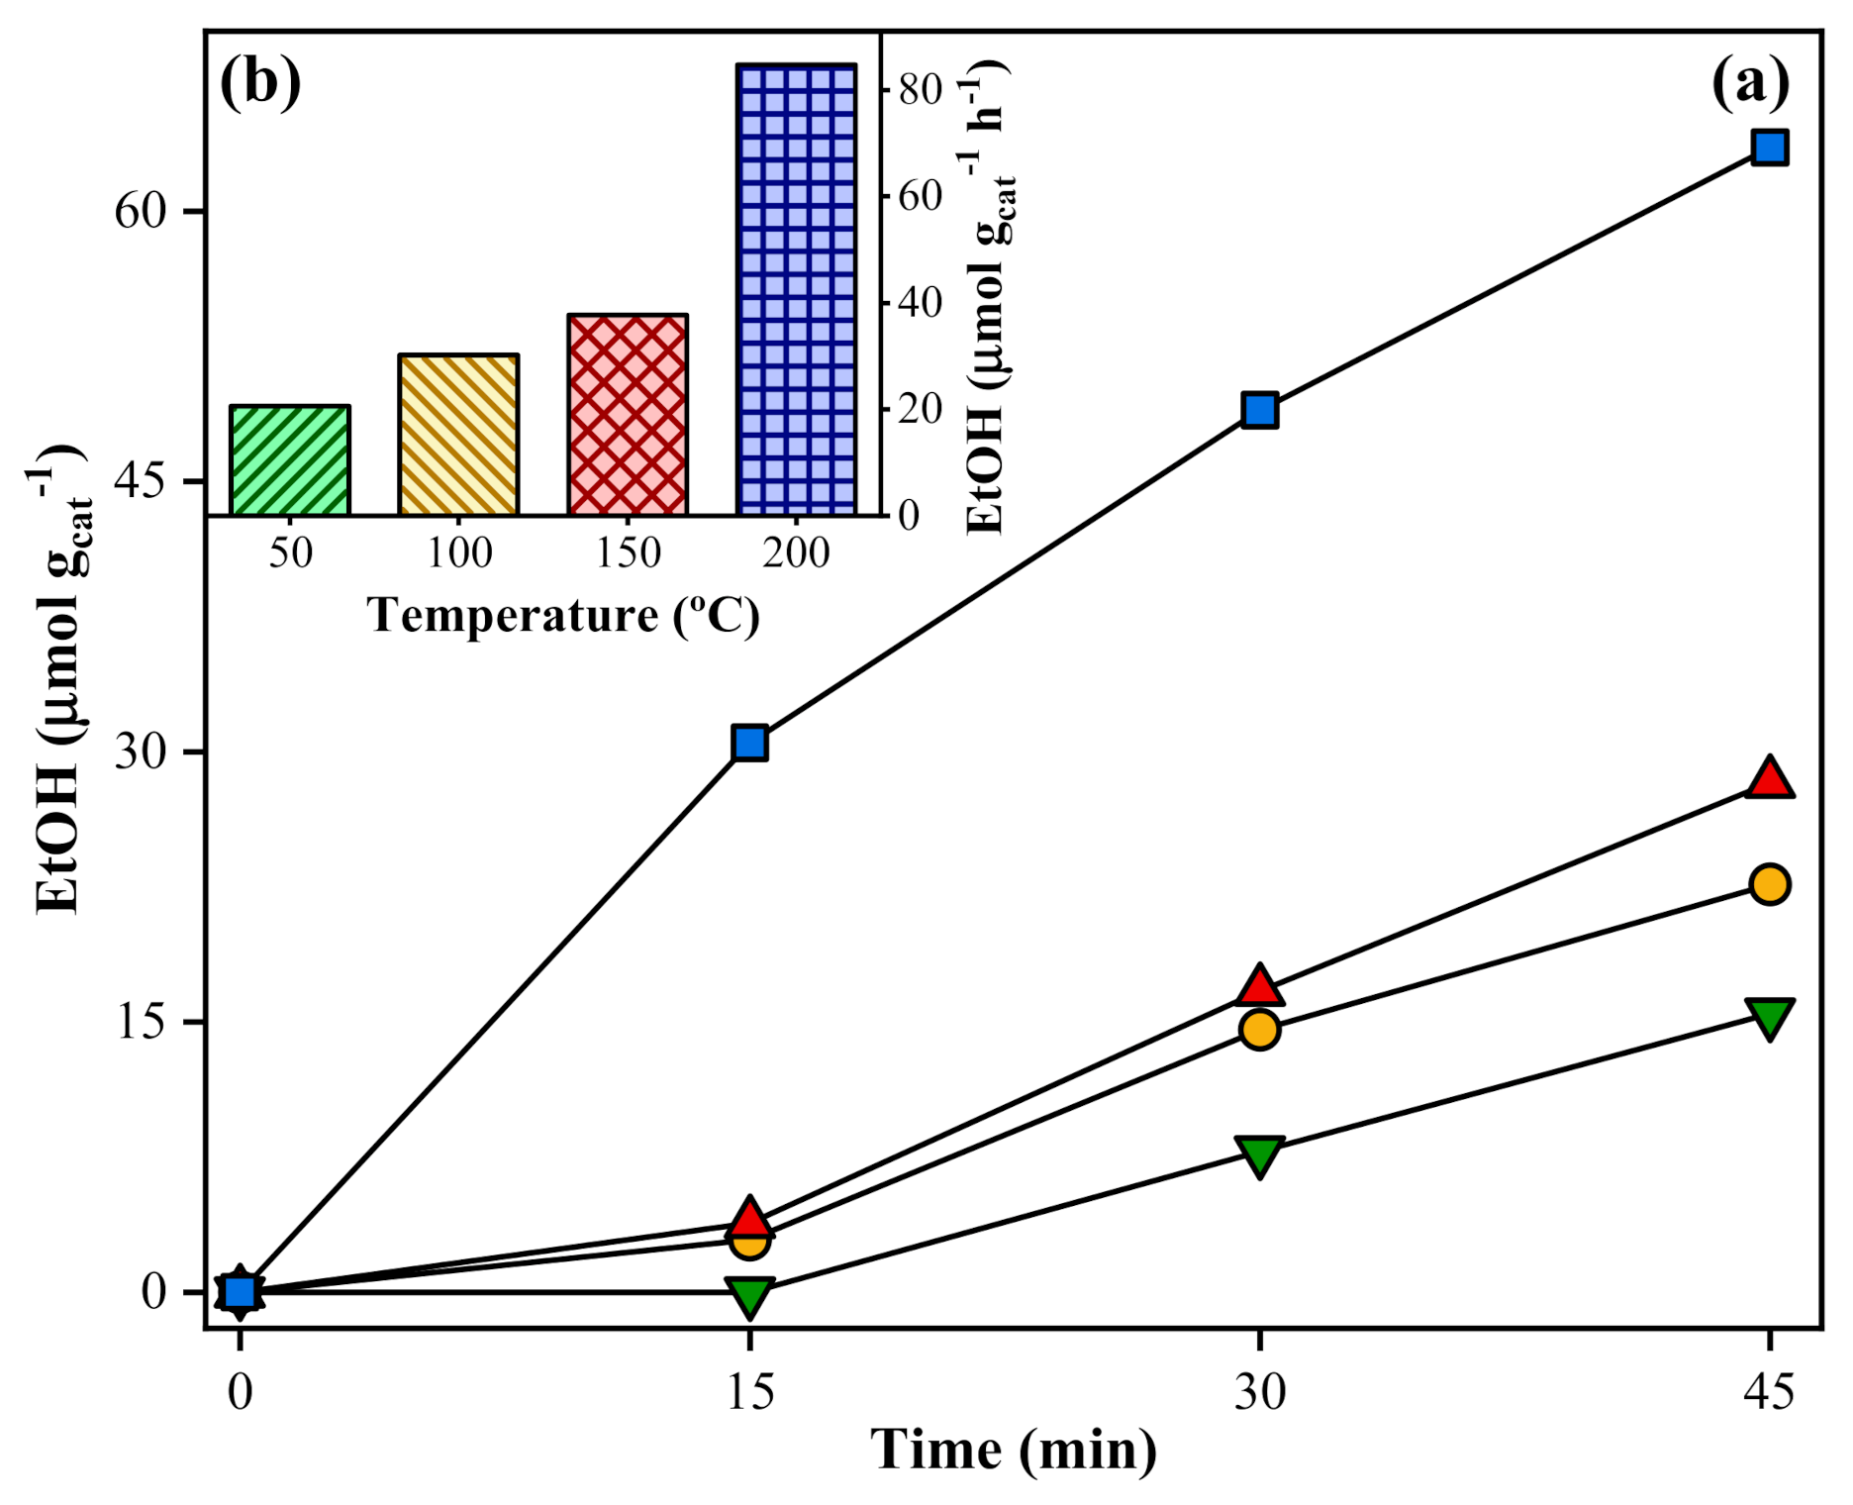
Catalysts 11 00461 g006
Figure 7. Evolution of the (a) ethanol production from CO2 and C2H6 as a function of photoreaction’s time and the respective (b) reaction rate (for the maximum production), at 50 °C ( Catalysts 11 00461 i007); 100 °C ( Catalysts 11 00461 i008); 150°C ( Catalysts 11 00461 i009), and 200°C ( Catalysts 11 00461 i010). Experimental conditions: 20 mg of SrTiO3:RuO2:NiO; [Ru]:[Ni] = 1:1 (molar); Ru = 0.8 wt. %; PC2H6 = 1.01 bar; PCO2 = 0.35 bar; and I = 1000 W m−2.
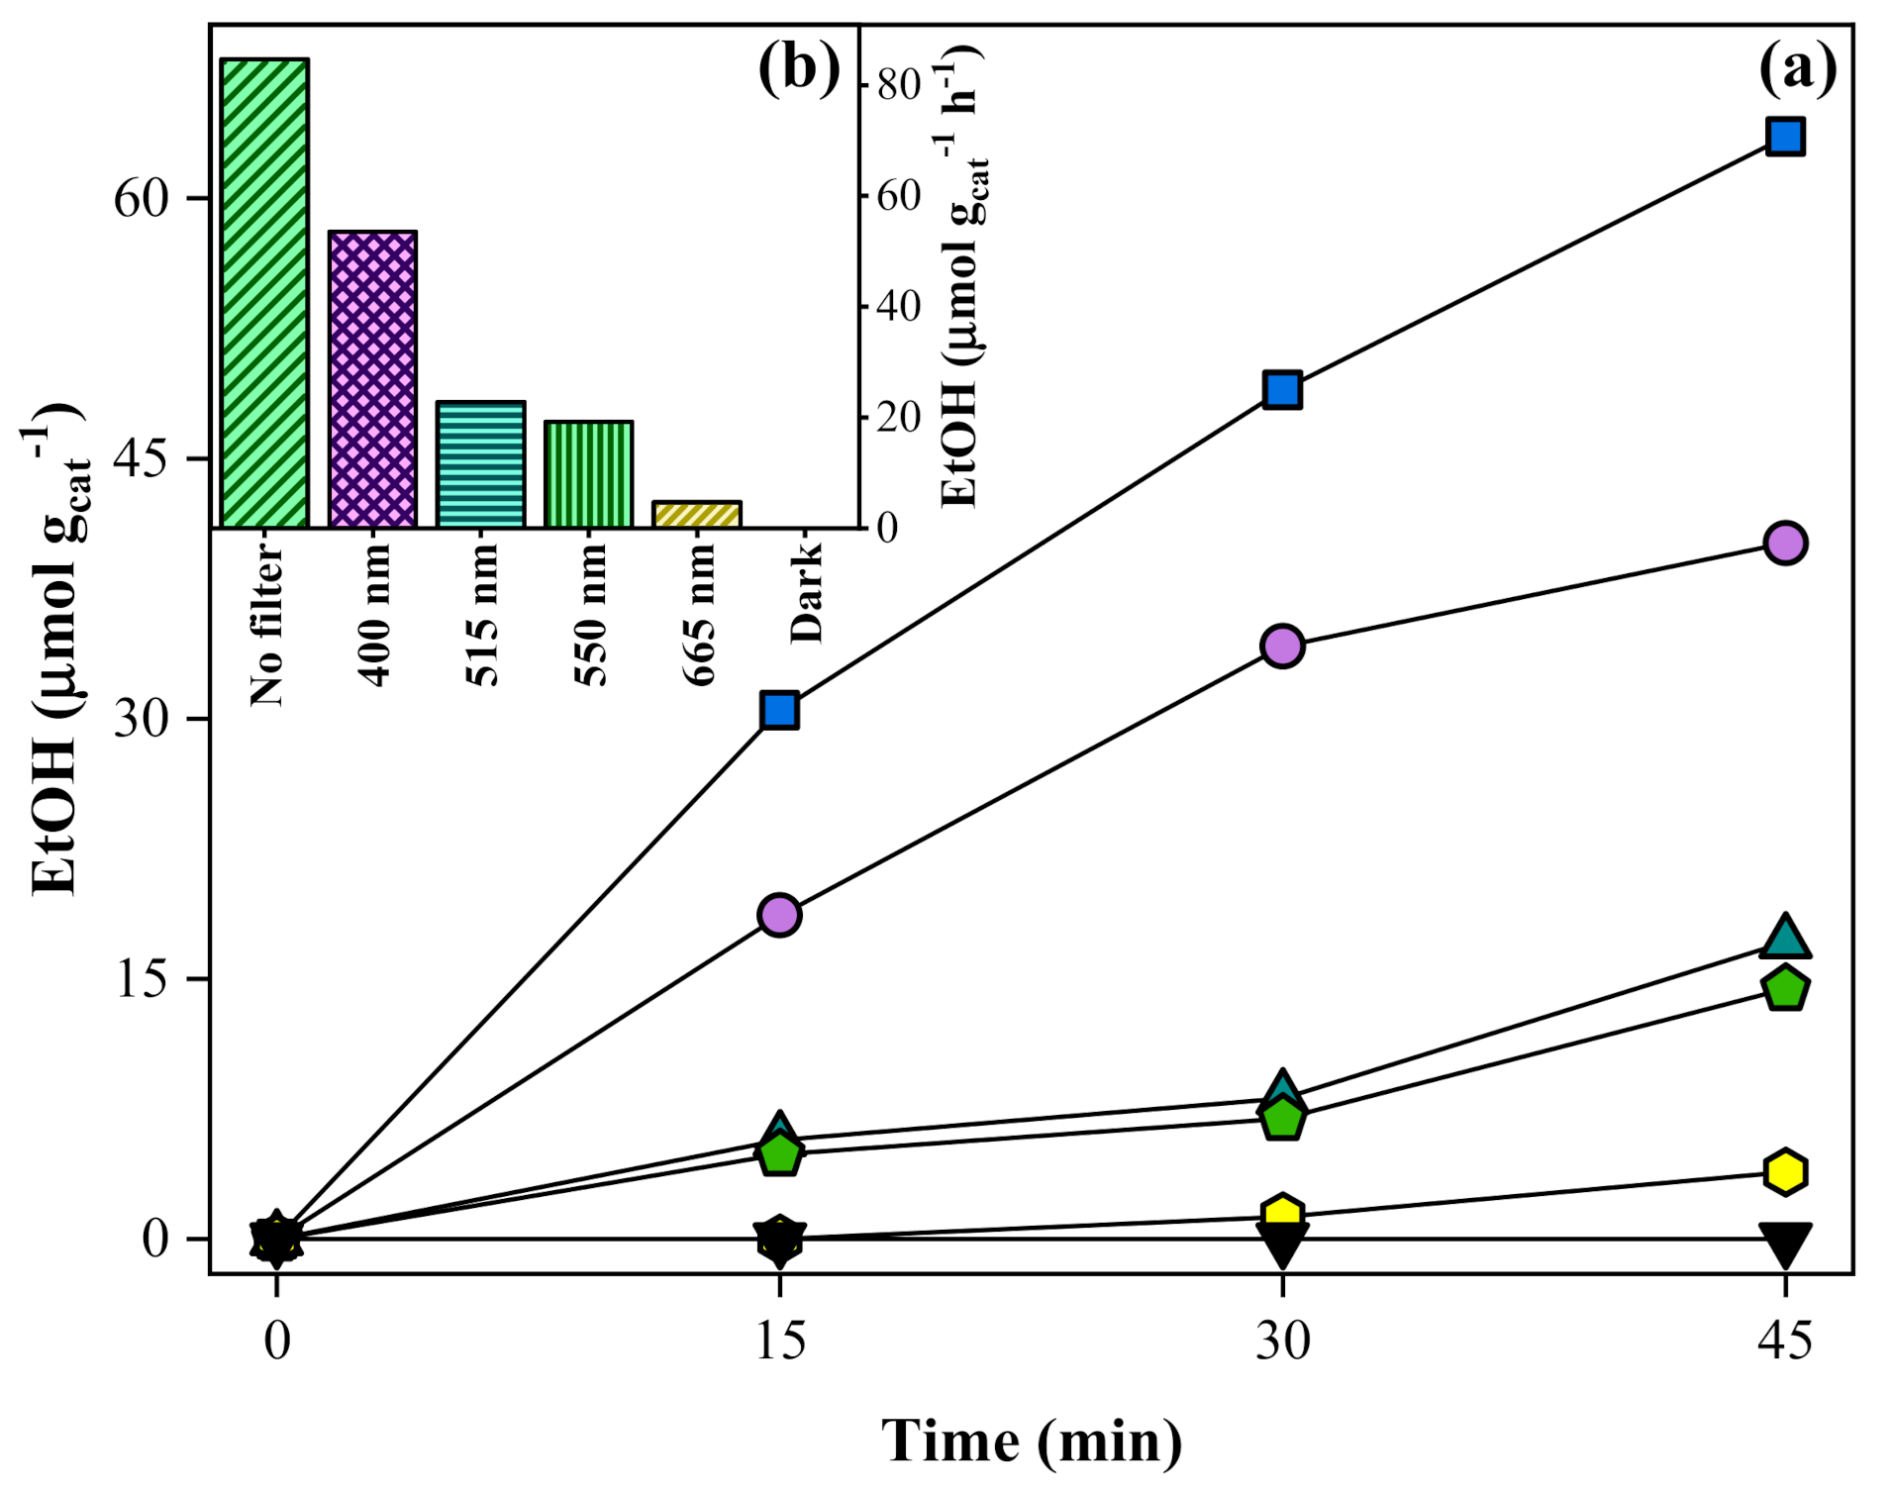
Catalysts 11 00461 g007
Figure 8. Evolution of the (a) ethanol production from CO2 and C2H6 over time and the respective (b) reaction rate (for the maximum production), as a measure of the catalyst photoresponse under full illumination (1000 W m2), using filters with different cut-offs: no filter ( Catalysts 11 00461 i011), 400 nm ( Catalysts 11 00461 i012), 515 nm ( Catalysts 11 00461 i013), 550 nm ( Catalysts 11 00461 i014), 665 nm ( Catalysts 11 00461 i015), and dark ( Catalysts 11 00461 i016, covering the photoreactor with aluminum foil). Experimental conditions: 20 mg of SrTiO3:RuO2:NiO; [Ru]:[Ni] = 1:1 (molar); Ru = 0.8 wt. %; PC2H6 = 1.01 bar; PCO2 = 0.35 bar; and T = 200 °C.
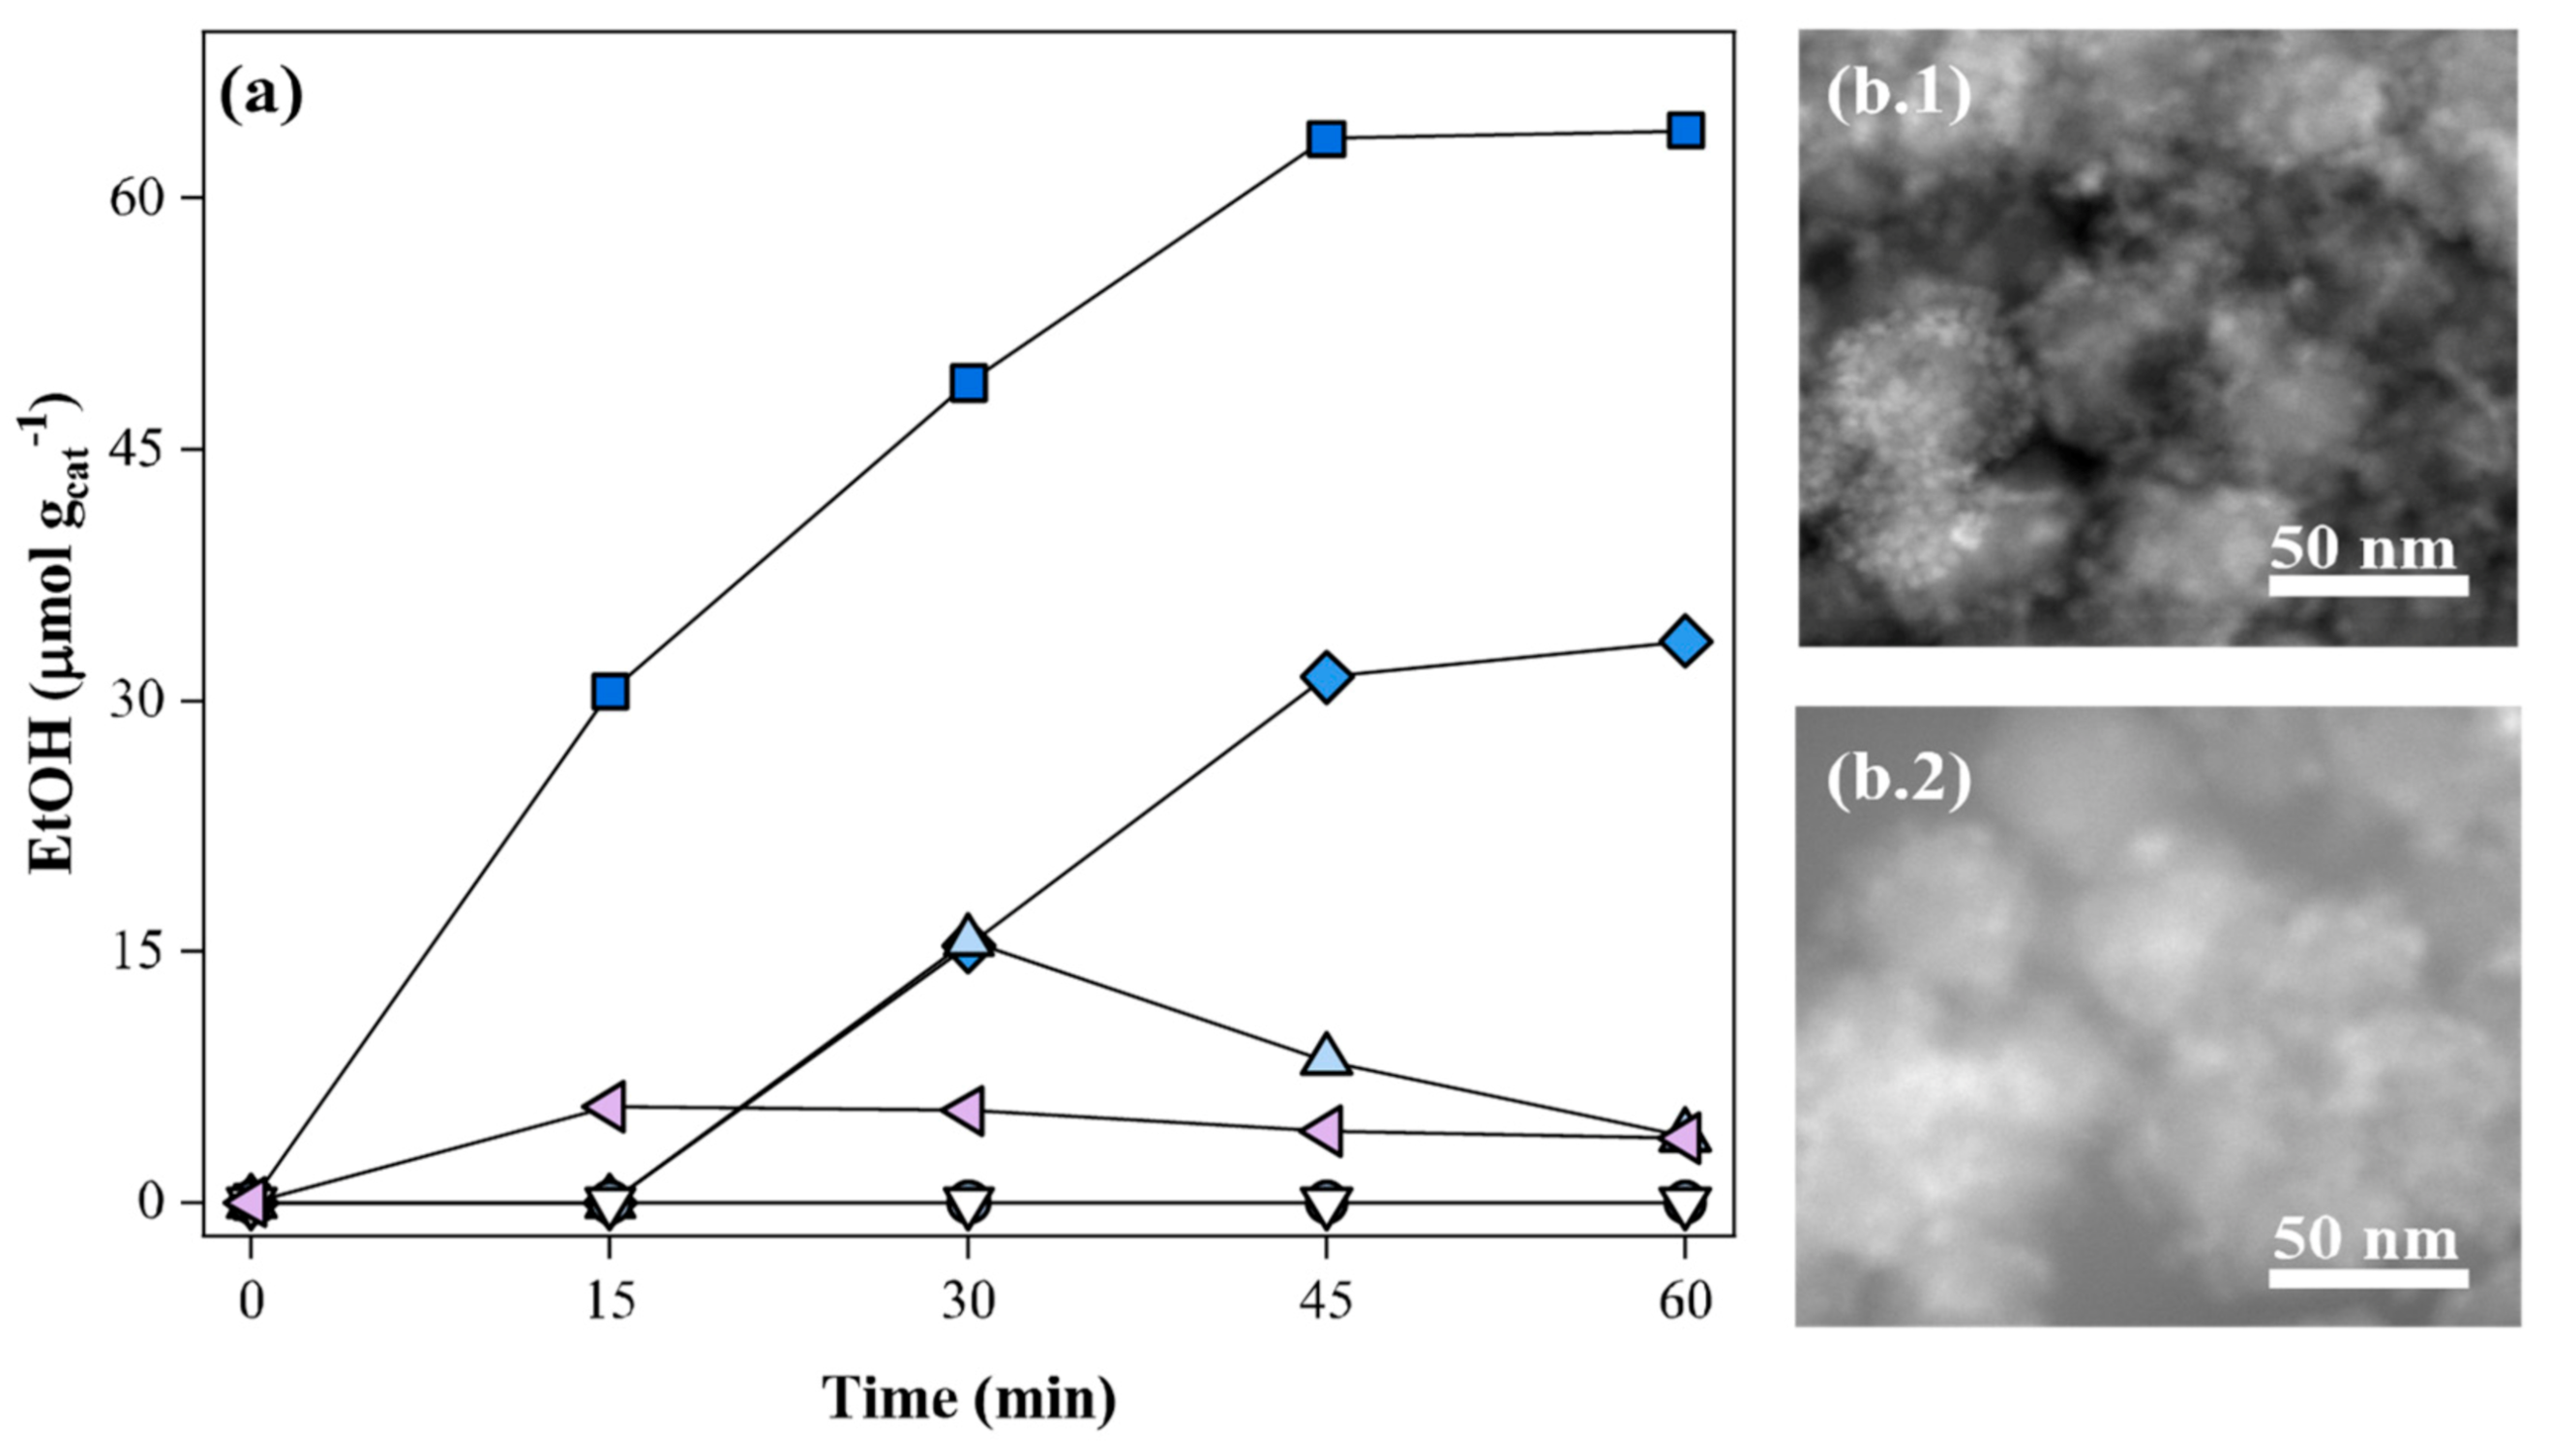
Catalysts 11 00461 g008
Figure 9. (a) Evolution of the ethanol production from CO2 and C2H6 as a function of photoreaction time, after (i) 1 cycle ( Catalysts 11 00461 i017), 2 cycles ( Catalysts 11 00461 i018), 3 cycles ( Catalysts 11 00461 i019) and 4 cycles ( Catalysts 11 00461 i020) of the photocatalyst use, and (ii) reactivation of the photocatalyst, resulting from the 4th cycle, with H2 flow ( Catalysts 11 00461 i021, at 200 °C for 2 h) or air-driven calcination ( Catalysts 11 00461 i022, at 350 °C for 2 h). Experimental conditions: 20 mg of SrTiO3:RuO2:NiO; [Ru]:[Ni] = 1:1 (molar); Ru = 0.8 wt. %; PC2H6 = 1.01 bar; PCO2 = 0.35 bar; T = 200 °C and I = 1000 W m−2. (b) TEM images of the (.1) fresh and (.2) inactivated photocatalyst (after the 4th use).
Catalysts 11 00461 g009
Figure 10. Evolution of the (a) ethanol production from CO2 and C2H6 as a function of photoreaction’s time and the respective (b) reaction rate (for the maximum production), in the absence ( Catalysts 11 00461 i023
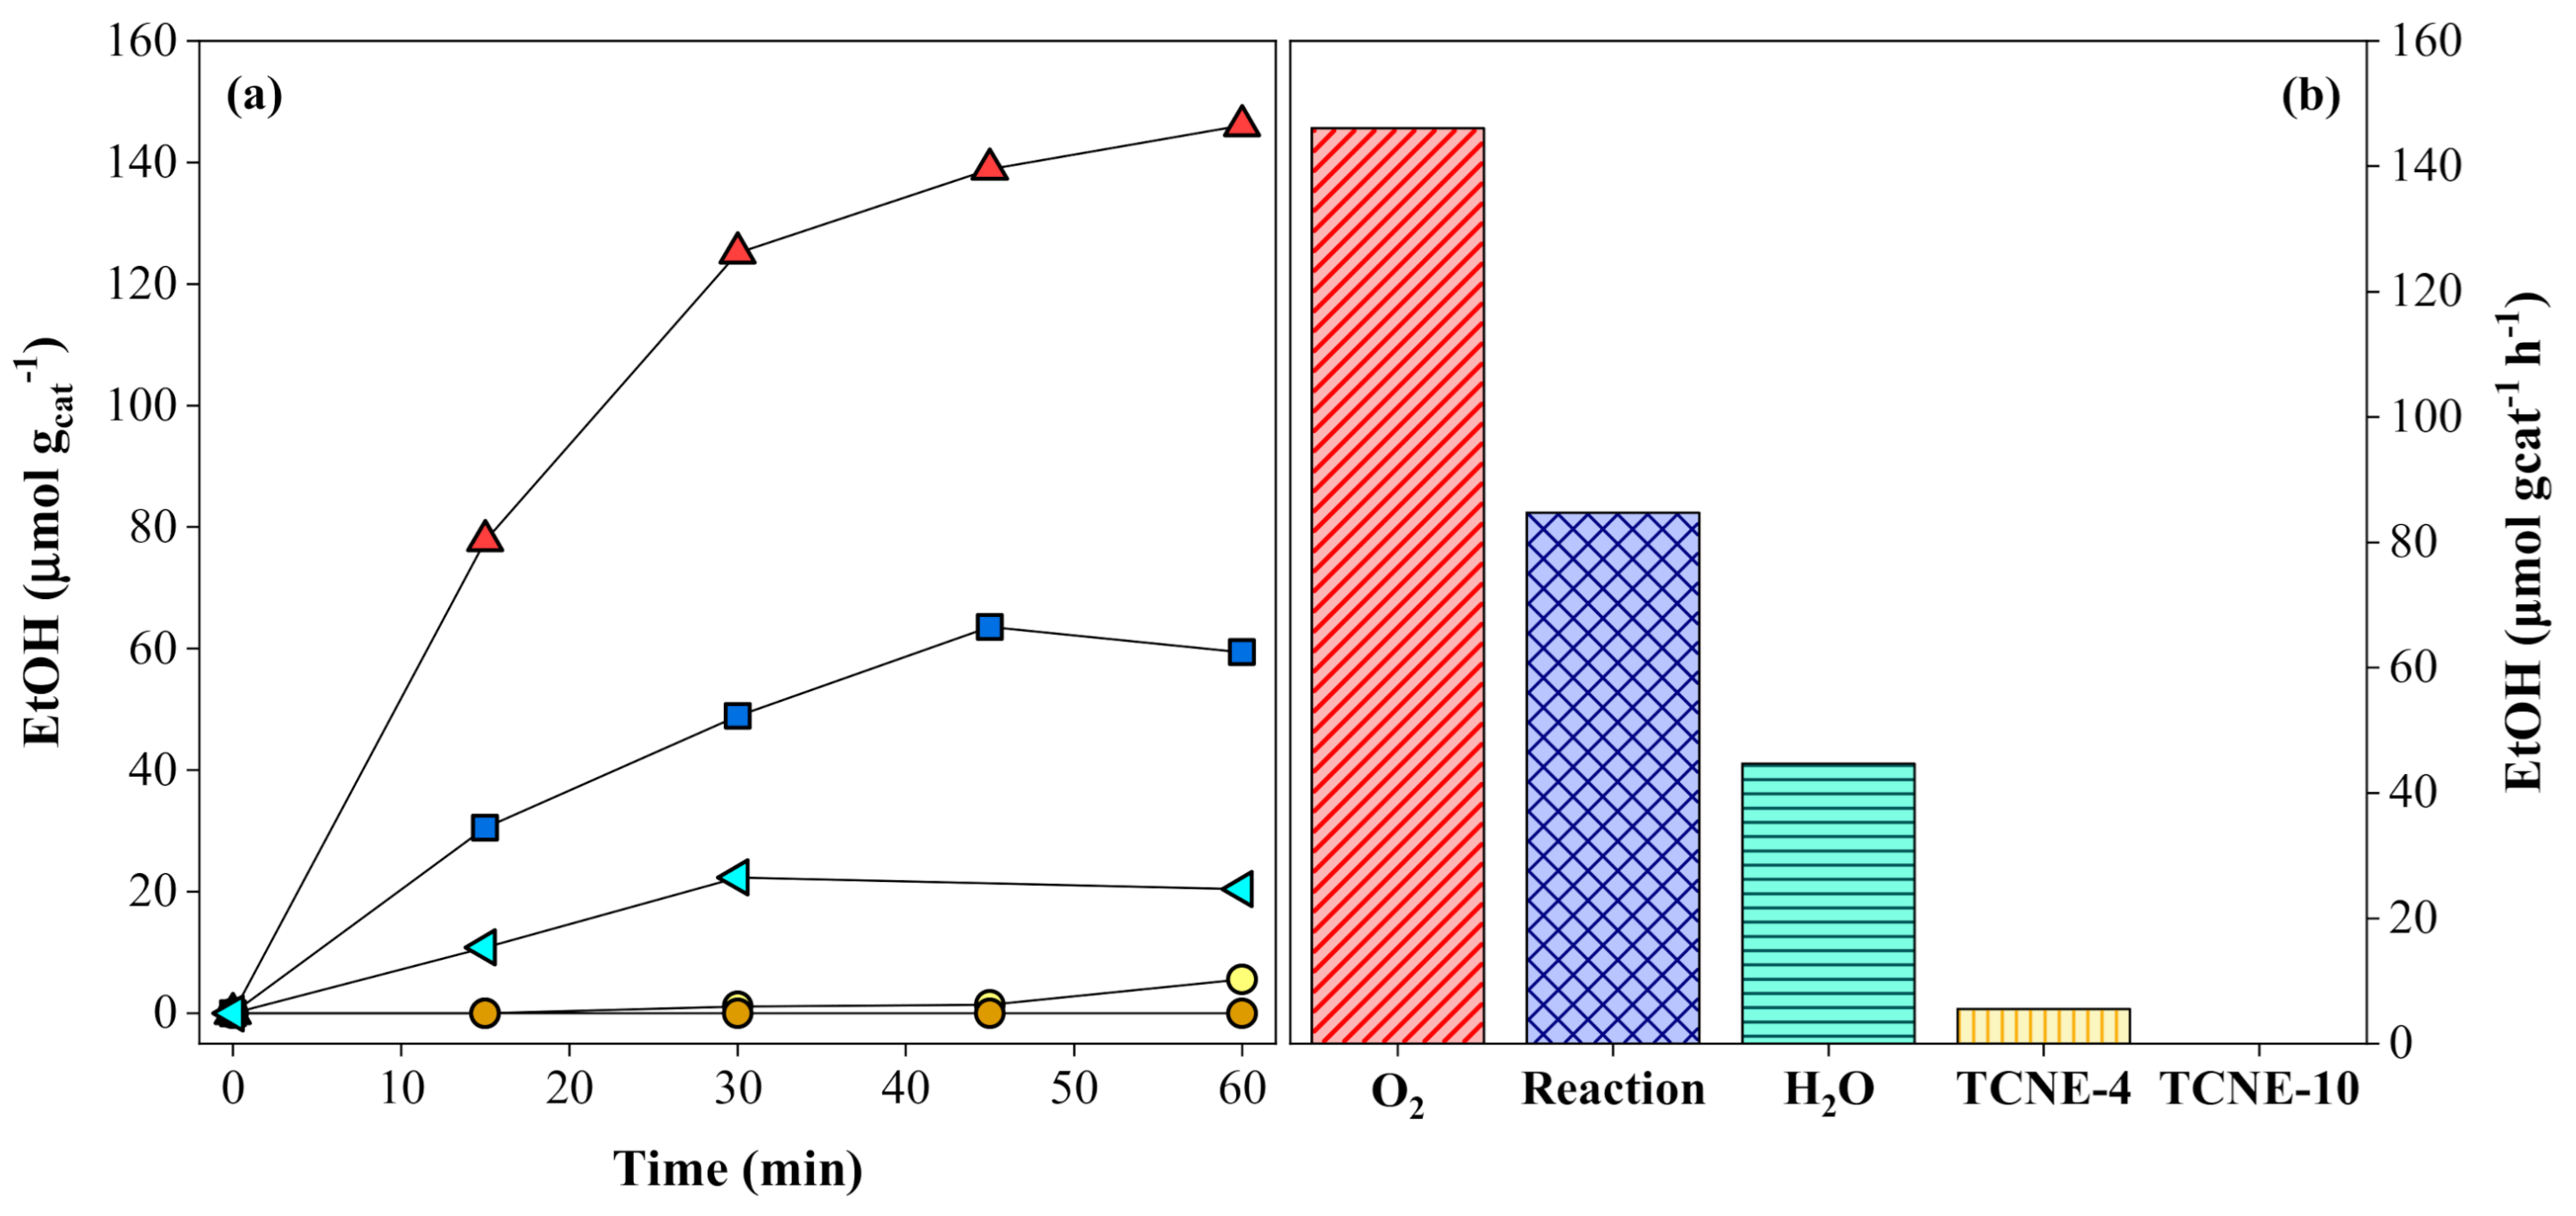
) and the presence of electron scavengers: 4 ( Catalysts 11 00461 i024) and 10 ( Catalysts 11 00461 i025) µmol of TCNE; 0.2 mmol of O2 ( Catalysts 11 00461 i026); or 0.3 µmol of H2O ( Catalysts 11 00461 i027). Experimental conditions: 20 mg of SrTiO3:RuO2:NiO; [Ru]:[Ni] = 1:1 (molar); Ru = 0.8 wt. %; PC2H6 = 1.01 bar; PCO2 = 0.35 bar; T = 200 °C and I = 1000 W m-2.
Catalysts 11 00461 g010
Figure 11. Possible reaction pathway and mechanism towards ethanol production, from CO2 and C2H6, on the surface of the hybrid SrTiO3:RuO2:NiO catalyst, by means of solar-driven heterogeneous thermo-photocatalysis.
Catalysts 11 00461 g011
Publisher’s Note: MDPI stays neutral with regard to jurisdictional claims in published maps and institutional affiliations.

