Article

The Effect of Mg and Zn Dopants on Pt/Al2O3 for the Dehydrogenation of Perhydrodibenzyltoluene

by
Rudaviro Garidzirai
1,
Phillimon Modisha
1,*,
Innocent Shuro
2,
Jacobus Visagie
3,
Pieter van Helden
3 and
Dmitri Bessarabov
1,*
1
HySA Infrastructure Centre of Competence, Faculty of Engineering, Potchefstroom Campus, North-West University, Private Bag X6001, Potchefstroom 2520, South Africa
2
Centre for Chemical Resource and Beneficiation, Faculty of Natural and Agricultural Science, Potchefstroom Campus, North-West University, Private Bag X6001, Potchefstroom 2520, South Africa
3
Sasol, Group Technology, 1 Klasie Havenga Road, Sasolburg 1947, South Africa
*
Authors to whom correspondence should be addressed.
Submission received: 5 March 2021 / Revised: 29 March 2021 / Accepted: 30 March 2021 / Published: 12 April 2021

Abstract

:
The effects of Mg and Zn dopants on the catalytic performance of Pt/Al2O3 catalyst were investigated for dehydrogenation of perhydrodibenzyltoluene (H18-DBT) as a liquid organic hydrogen carrier. Al2O3 supports were modified with Mg and Zn to produce Mg-Al2O3 and Zn-Al2O3 with a target loading of 3.8 wt.% for dopants. The modified supports were impregnated with chloroplatinic acid solution to produce the catalysts Pt/Al2O3, Pt/Mg-Al2O3 and Pt/Zn-Al2O3 of 0.5 wt.% Pt loading. Thereafter, the catalysts were characterised using inductively coupled plasma- optical emission spectrometry, scanning electron microscopy-energy dispersive X-ray spectroscopy, hydrogen temperature-programmed reduction, carbon-monoxide pulse chemisorption, ammonia temperature-programmed desorption, X-ray diffraction and transmission electron microscopy. The dehydrogenation experiments were performed using a horizontal plug flow reactor system and the catalyst time-on-stream was 22 h. Pt/Mg-Al2O3 showed the highest average hydrogen flowrate of 29 nL/h, while an average of 27 nL/h was obtained for both Pt/Al2O3 and Pt/Zn-Al2O3. This has resulted in a hydrogen yield of 80% for Pt/Mg-Al2O3, 71% for Pt/Zn-Al2O3 and 73% for Pt/Al2O3. In addition, the conversion of H18-DBT ranges from 99% to 92%, Pt 97–90% and 96–90% for Pt/Mg-Al2O3, Pt/Zn-Al2O3 and Pt/Al2O3, respectively. Following the latter catalyst order, the selectivity to dibenzyltoluene (H0-DBT) ranges from 78% to 57%, 75–51% and 71–45%. Therefore, Pt/Mg-Al2O3 showed improved catalytic performance towards dehydrogenation of H18-DBT.

1. Introduction

Dibenzyltoluene (H0-DBT) is known as one of the most promising liquid organic hydrogen carrier (LOHC) molecules due to its competitive hydrogen storage properties reported in the literature [1,2,3,4]. Remarkably, the infrastructure for fuel can be repurposed for storage and transportation of dibenzyltoluene-based LOHC at ambient conditions, because it has diesel-like properties. Hence, the application of dibenzyltoluene for reversible hydrogen storage has reached the commercial stage. However, it is important to further develop the highly active and stable catalysts with minimum by-product formation for the recyclability of the LOHC molecule. It is for this reason that we first discuss literature work, where the catalytic performance was improved by modification of the catalyst with Mg and Zn. Arguably, Pt/Al2O3 is the catalyst of choice for dehydrogenation of LOHC molecules. Modification of the Al2O3 support using Mg and Zn has been reported to enhance catalytic performance, strengthen metal–support interaction, change support acidity and improve metal dispersion [5,6,7,8]. For example, Zn modification on both Pt/Al2O3 and Pt/ZSM-5 catalysts showed improved catalytic performance for propane dehydrogenation [7,8,9,10].
Mg-doped Al2O3 also has excellent attributes, such as the ability to promote surface diffusion and prevent clustering/sintering by suppressing grain growth [6,11]. Some patents filed in the U.S. also confirm the catalyst improvement upon modification of alumina support with Mg [12,13,14]. In this case, Mg-modified alumina resisted sintering and agglomeration of the catalyst particles during production of syngas from light hydrocarbons [12]. The challenge is that optimum quantity of Mg is required because too much or too little amounts could have little effect, no effect or negative effect on the catalytic performance [15,16,17]. For example, Zhang et al. [18] investigated the dehydrogenation of iso-butane using PtSnMgK/Al2O3 with different Mg loadings (0.2–0.8 wt.%). The amount of 0.4 wt.% Mg decreased carbon deposition on catalysts, with increased reaction activity and stability. A further increase to 0.8 wt.% Mg drastically decreased both Pt dispersion and catalytic activity. Moreover, Arnby et al. [19] and Zhan et al. [20] also reported the same phenomena for Pt/Al2O3 and Pd/Al2O3 catalysts, respectively. Auer et al. [21] investigated the effect of trace amounts of sulphur on Pt/Al2O3 in the dehydrogenation of H18-DBT and found that 0.25 wt.% S improved the catalytic activity and reduced the formation of high boiling point by-products.
It is reported that Mg does not only reduce the acidity of Al2O3 support, but it also lowers the carbon deposition, which is known for catalyst deactivation [22,23,24]. Since the acidity of Al2O3 support could contribute to C–C cleavage of the hydrocarbon molecule [25], therefore the by-products produced from dehydrogenation of H18-DBT [26] could be a result of this. Based on the improvements reported in the literature, modification of the Al2O3 support is expected to change the chemical properties of the catalyst and to improve the catalytic performance. This could be a rewarding approach because the commonly used Pt/Al2O3 catalyst suffers from deactivation, which results in low catalytic activity for dehydrogenation of H18-DBT. In this work, we investigate the effect of Mg and Zn dopants on Pt/Al2O3 catalyst for the dehydrogenation of H18-DBT. This is done by first modifying the Al2O3 support using Mg and Zn precursors, followed by impregnation of Pt on the support. The catalysts are further characterised to determine the effect of modification on the physical and chemical properties.

2. Results and Discussion

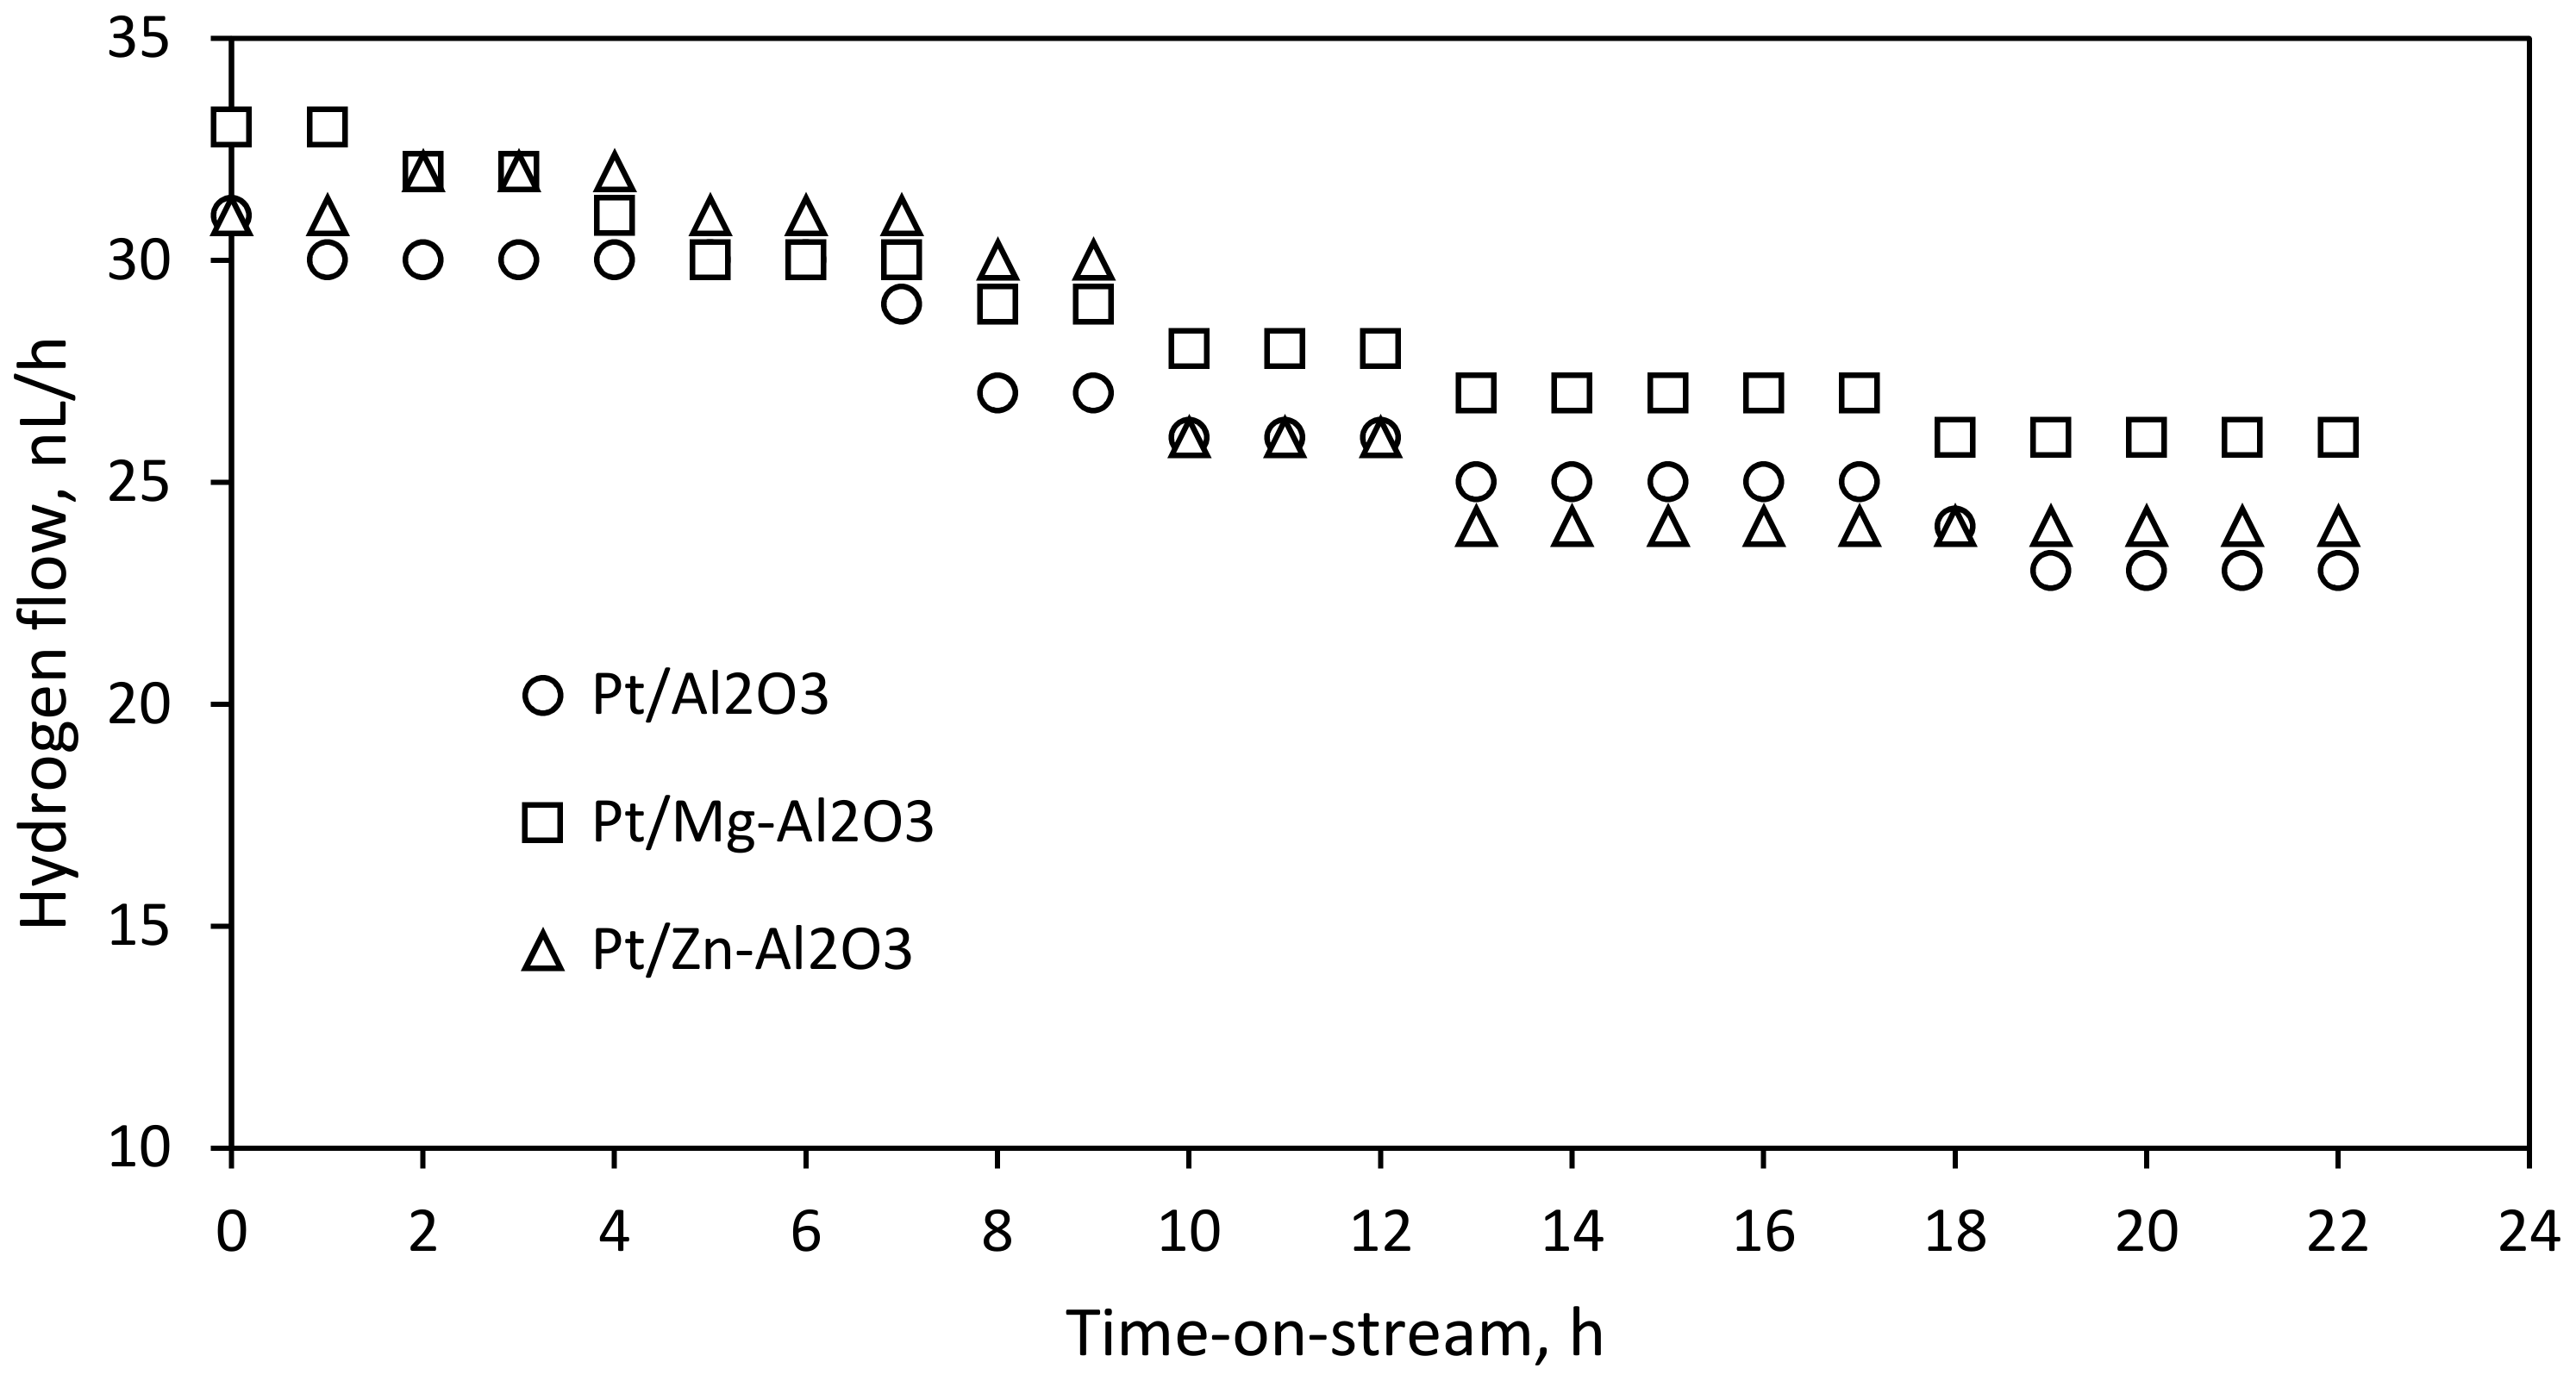
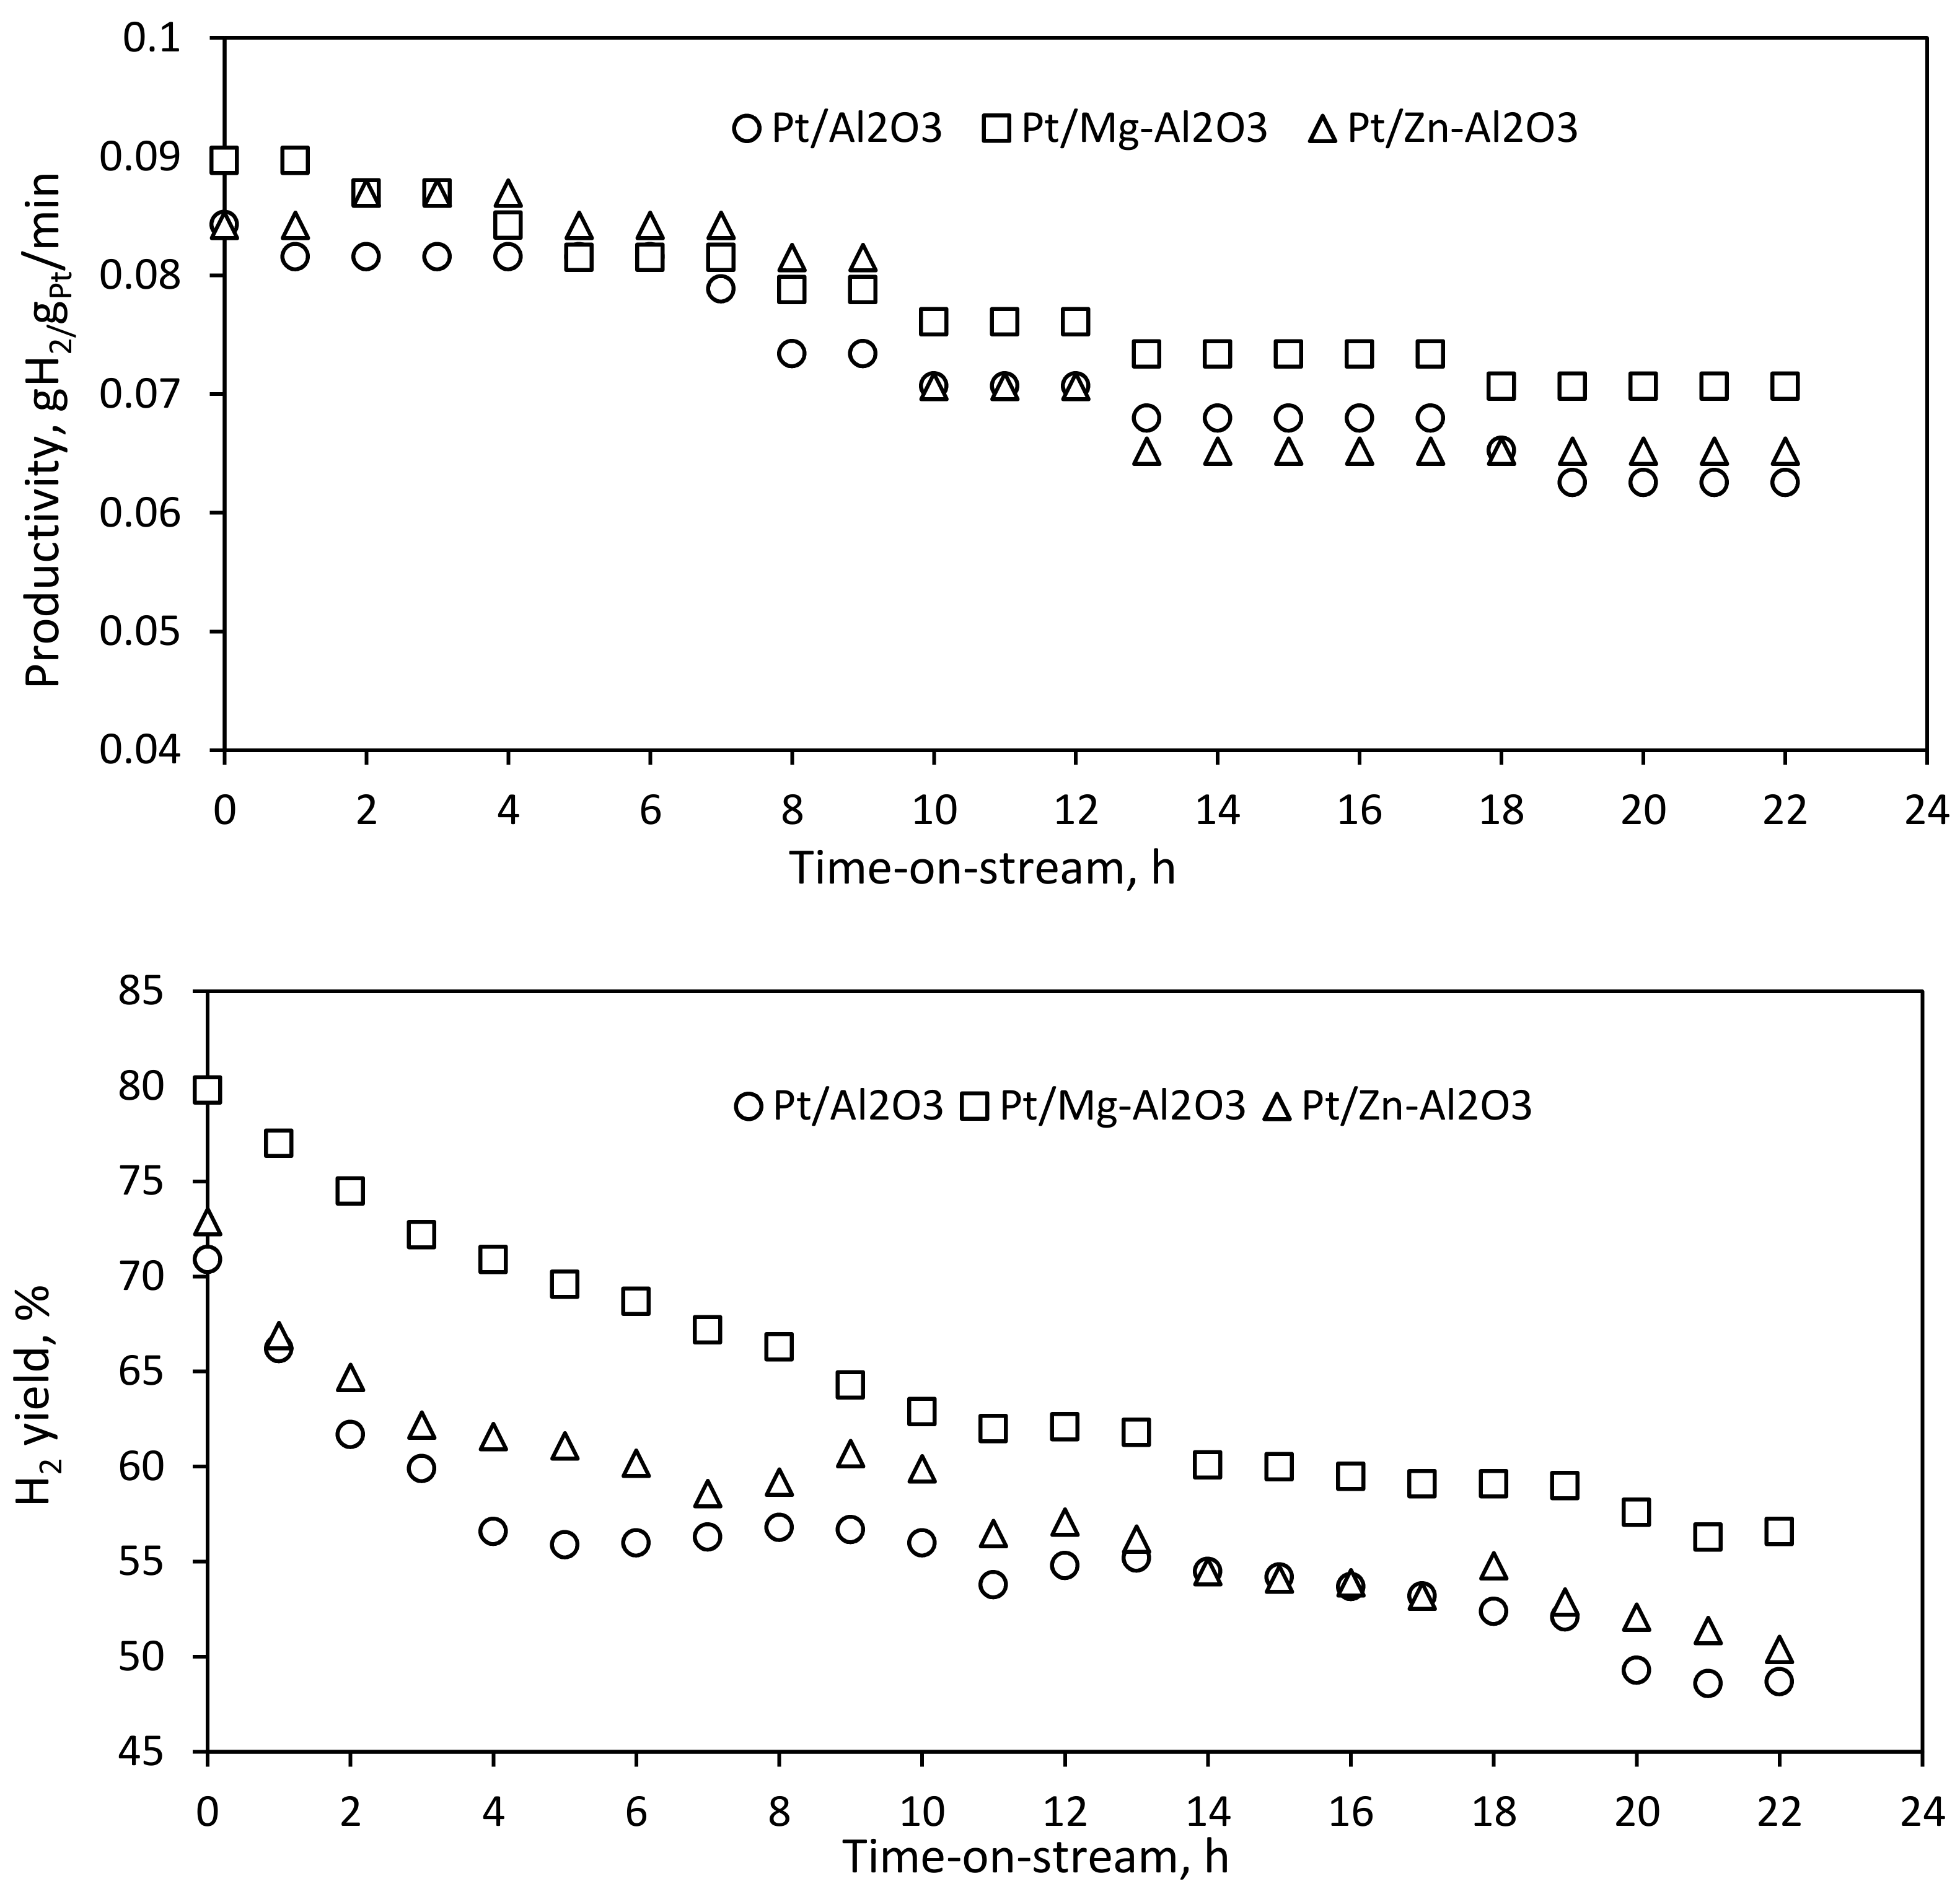
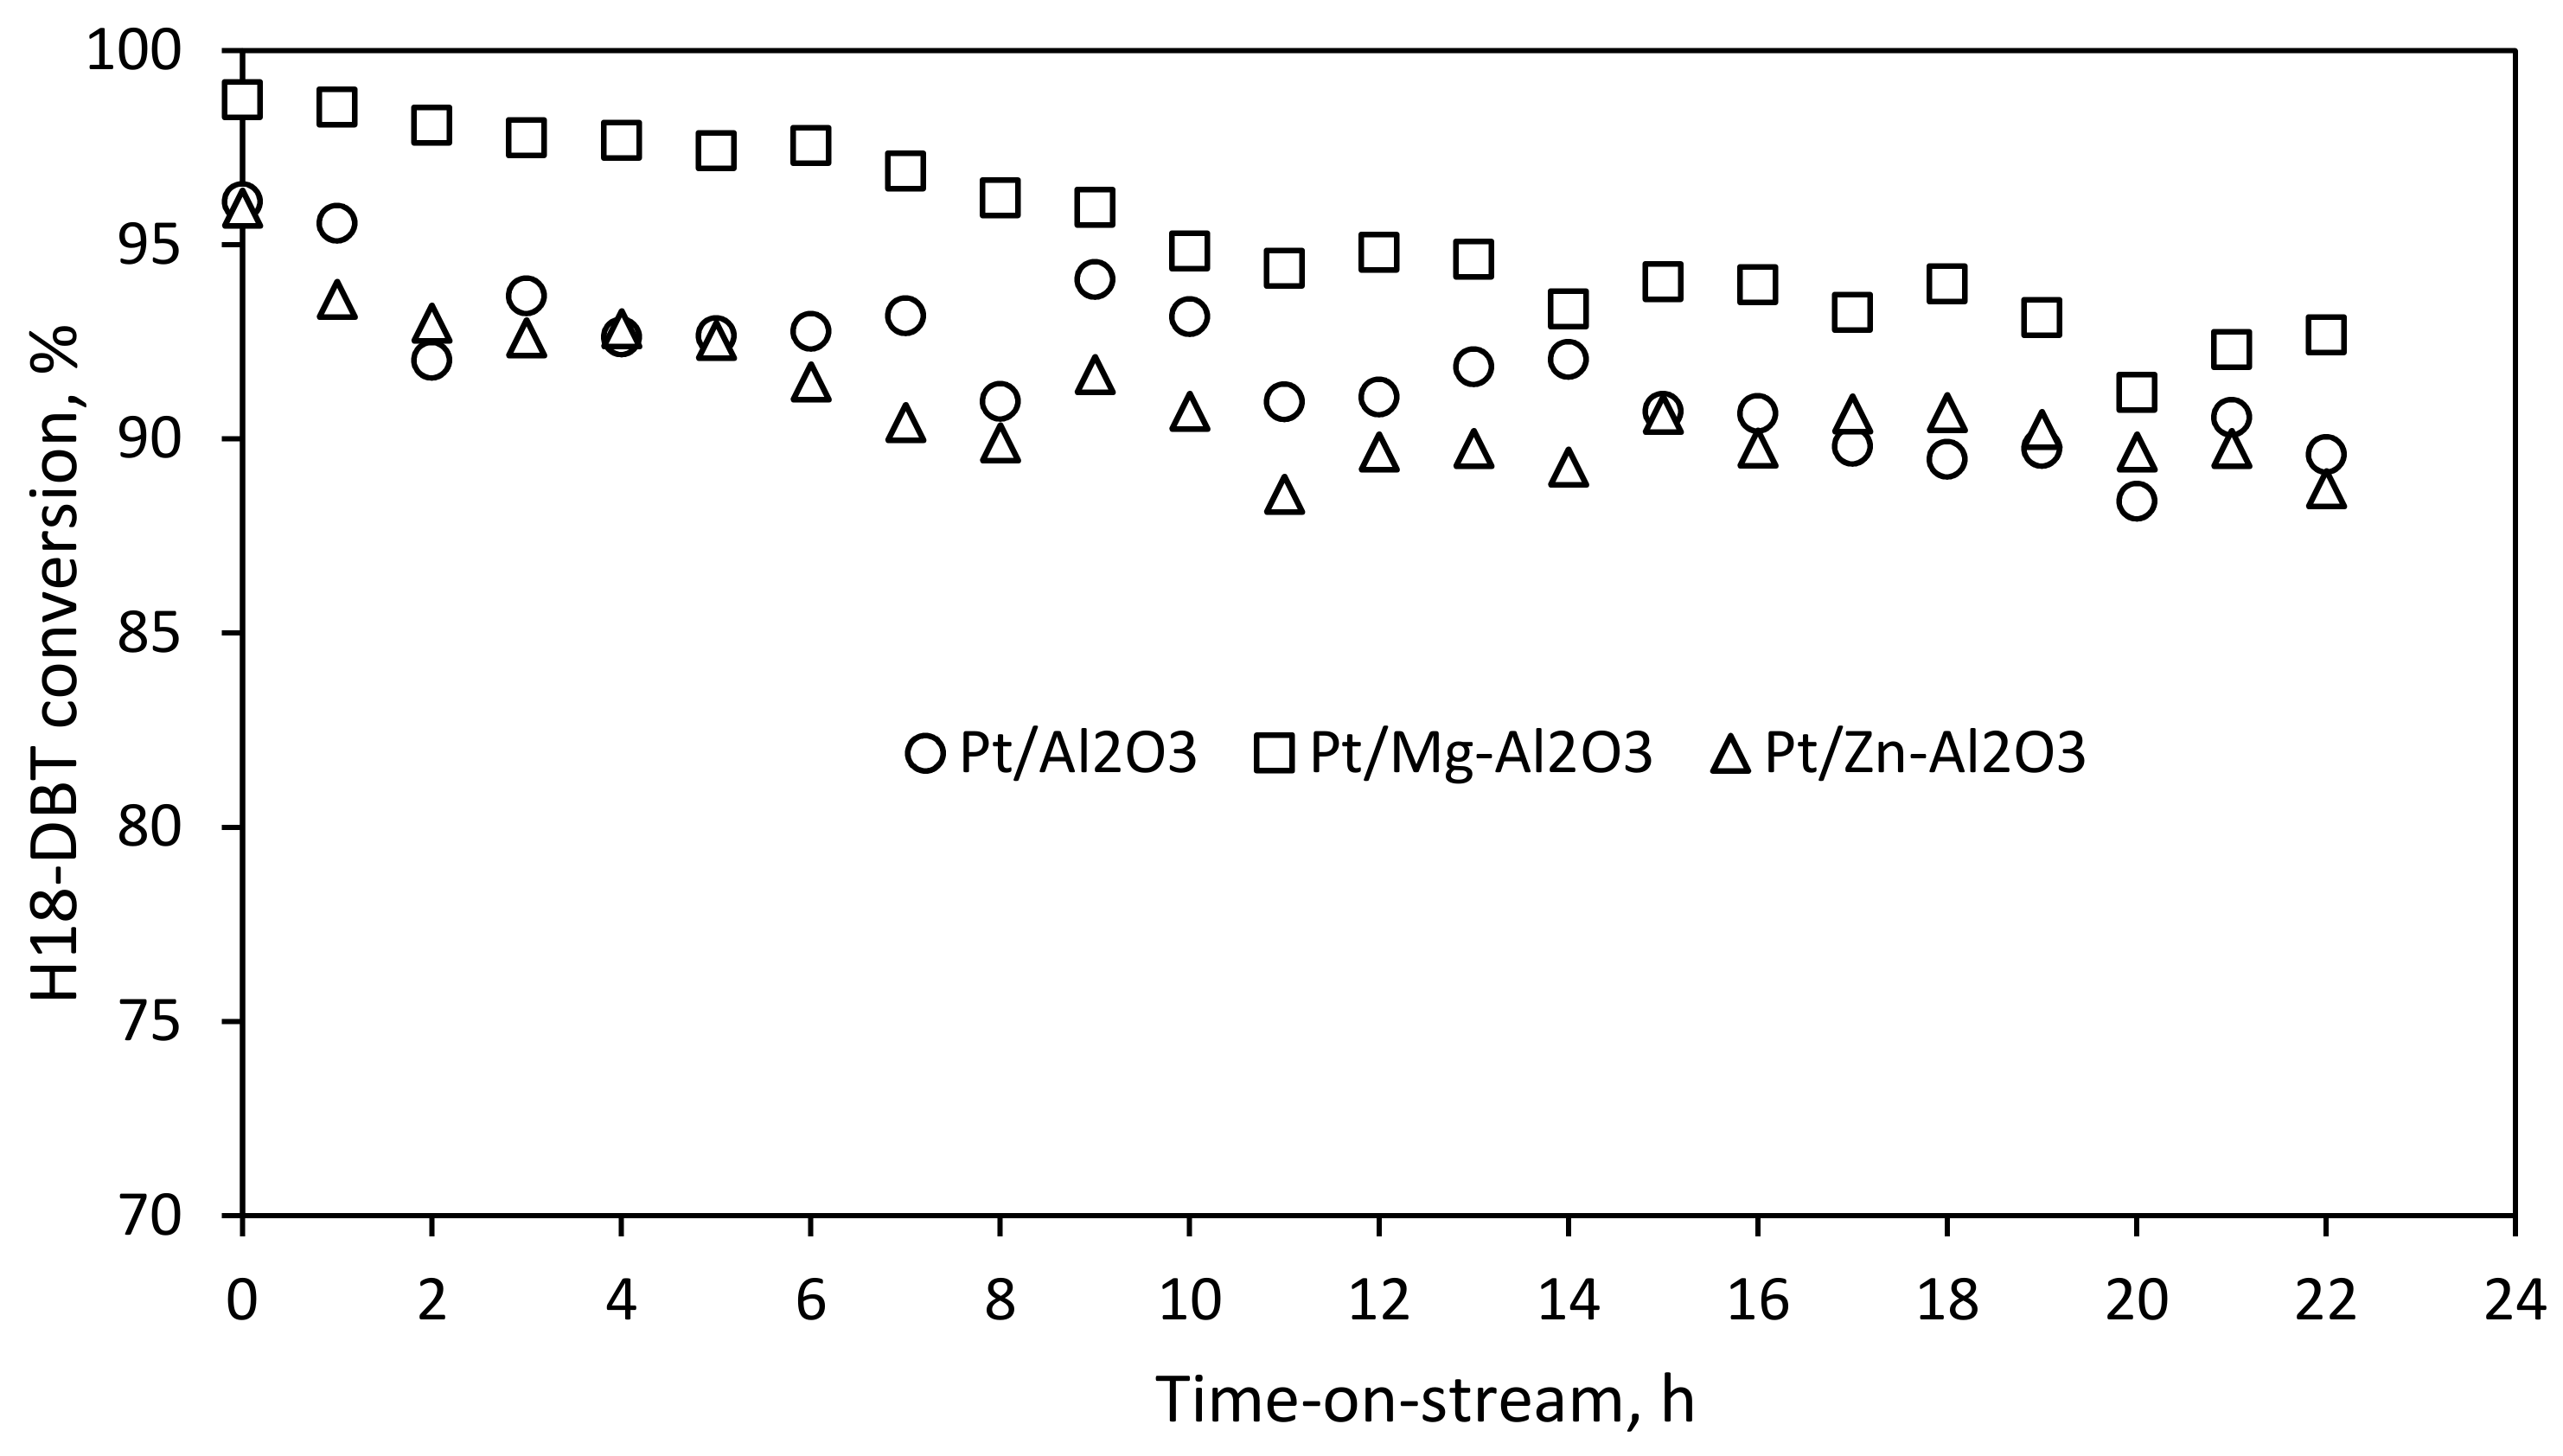
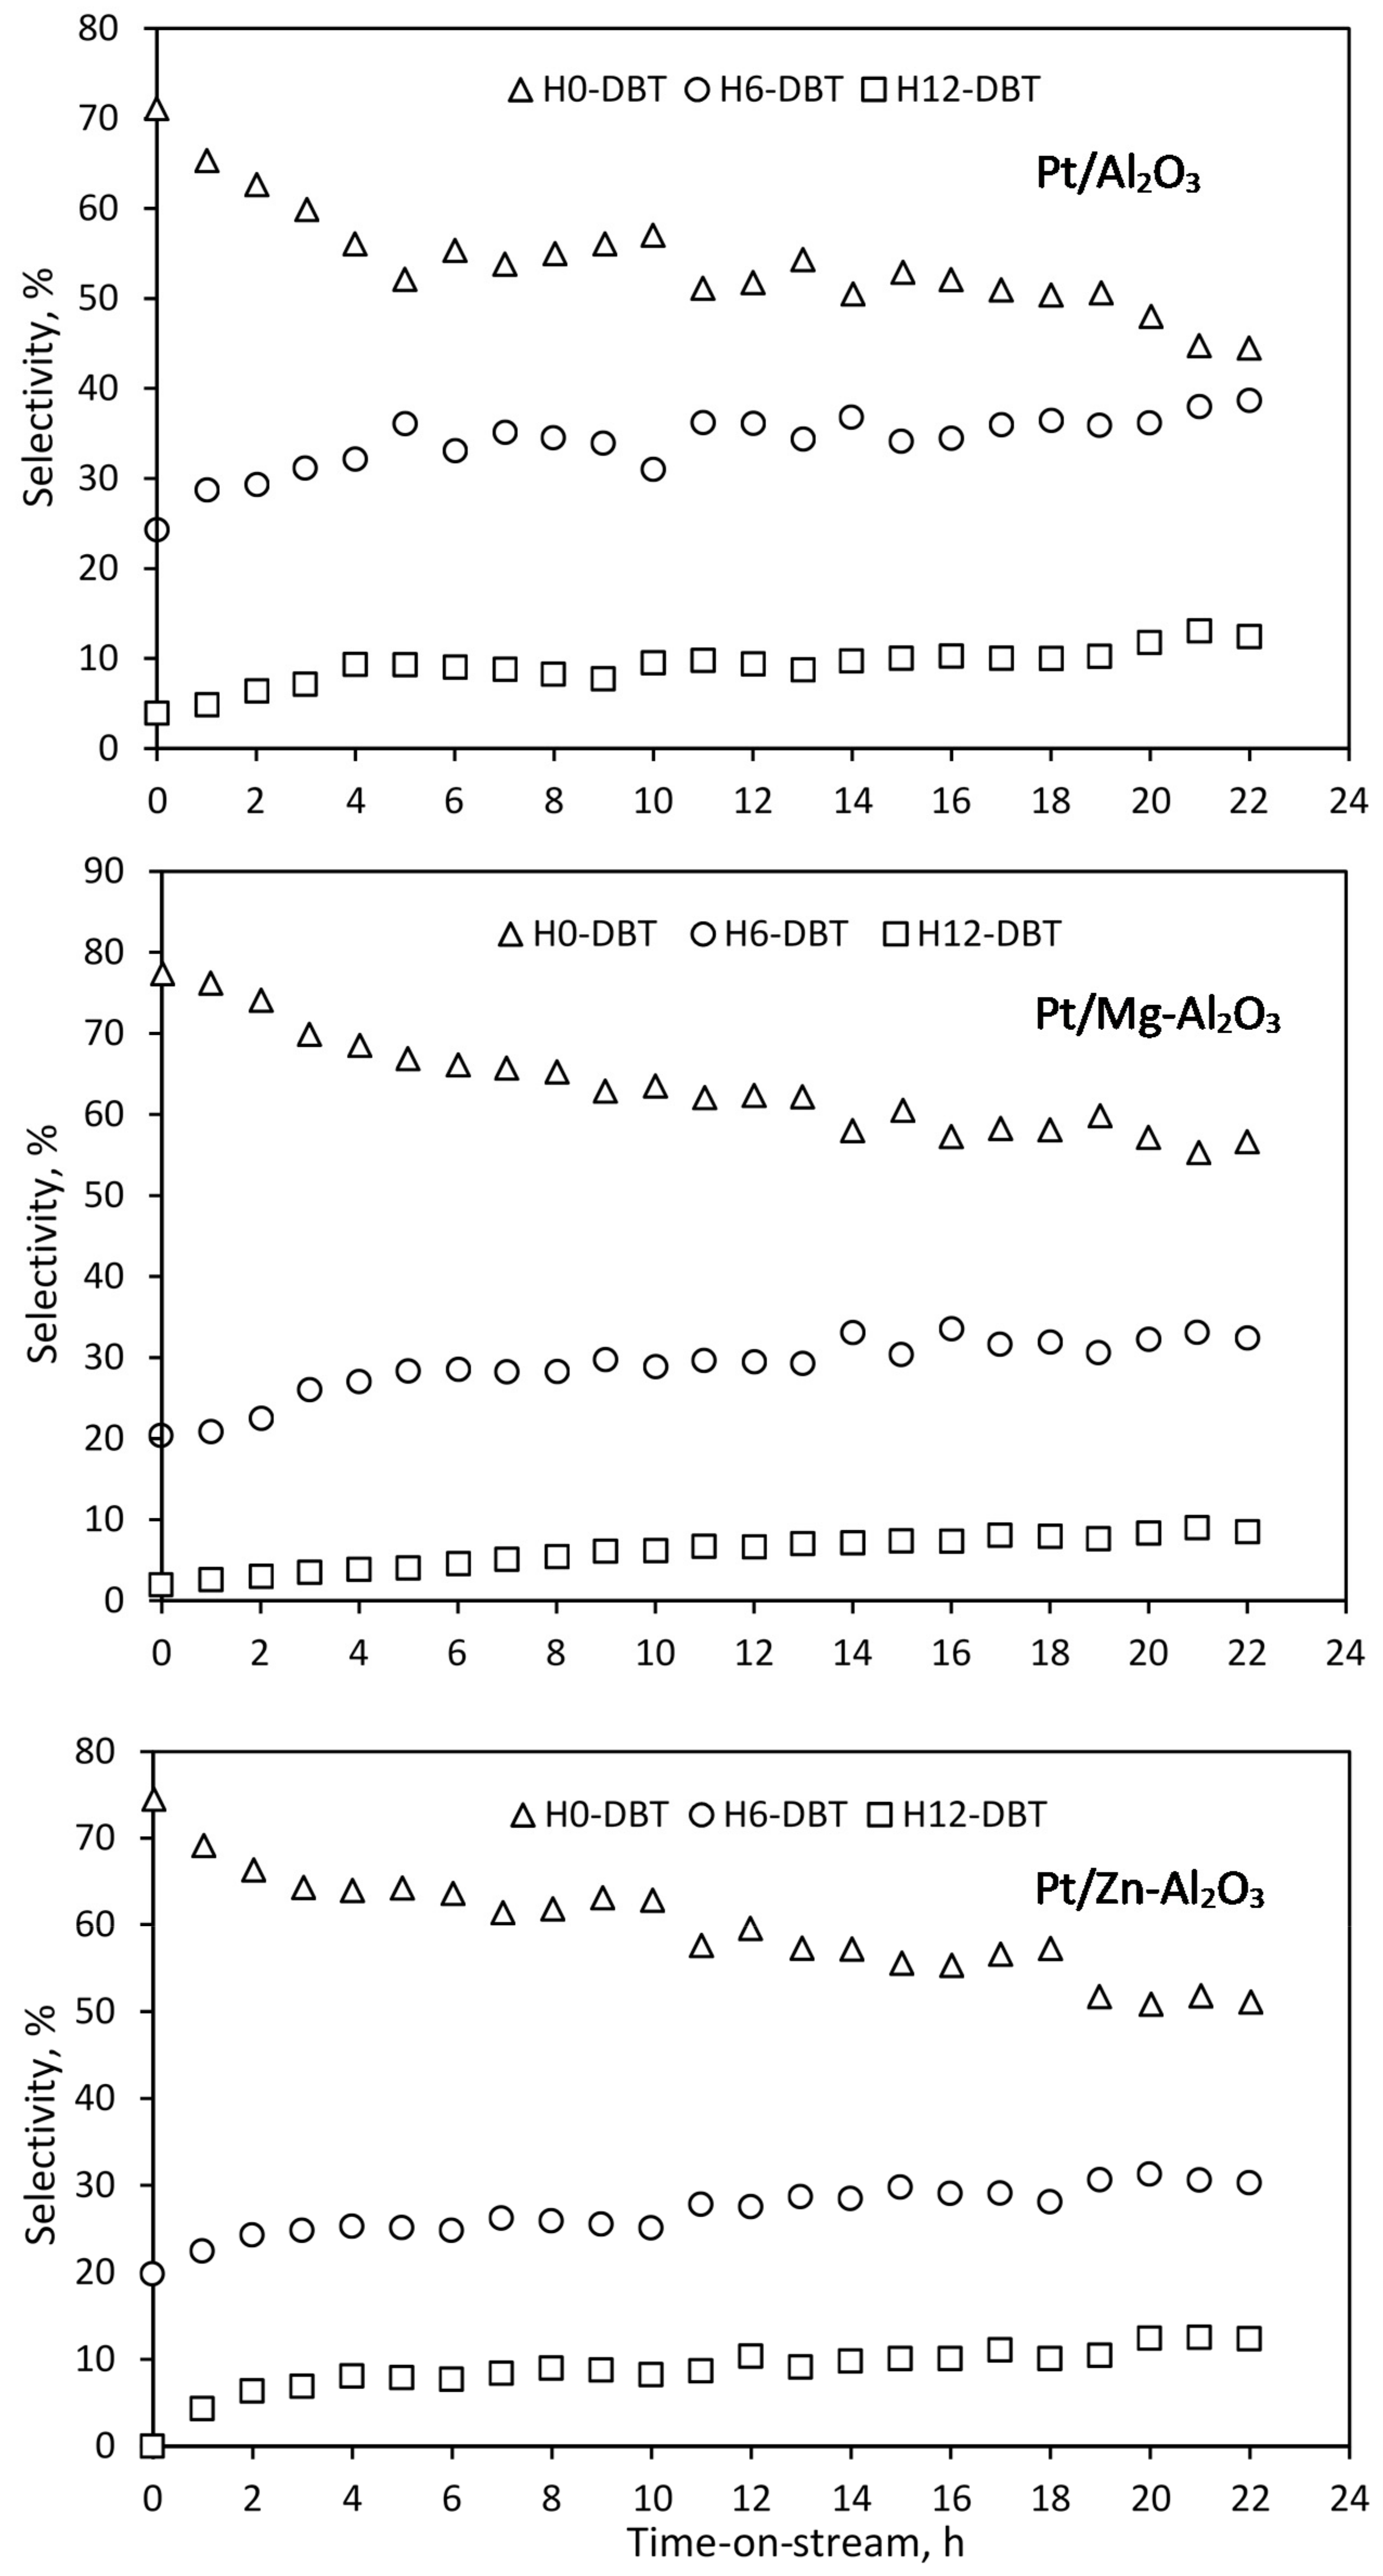
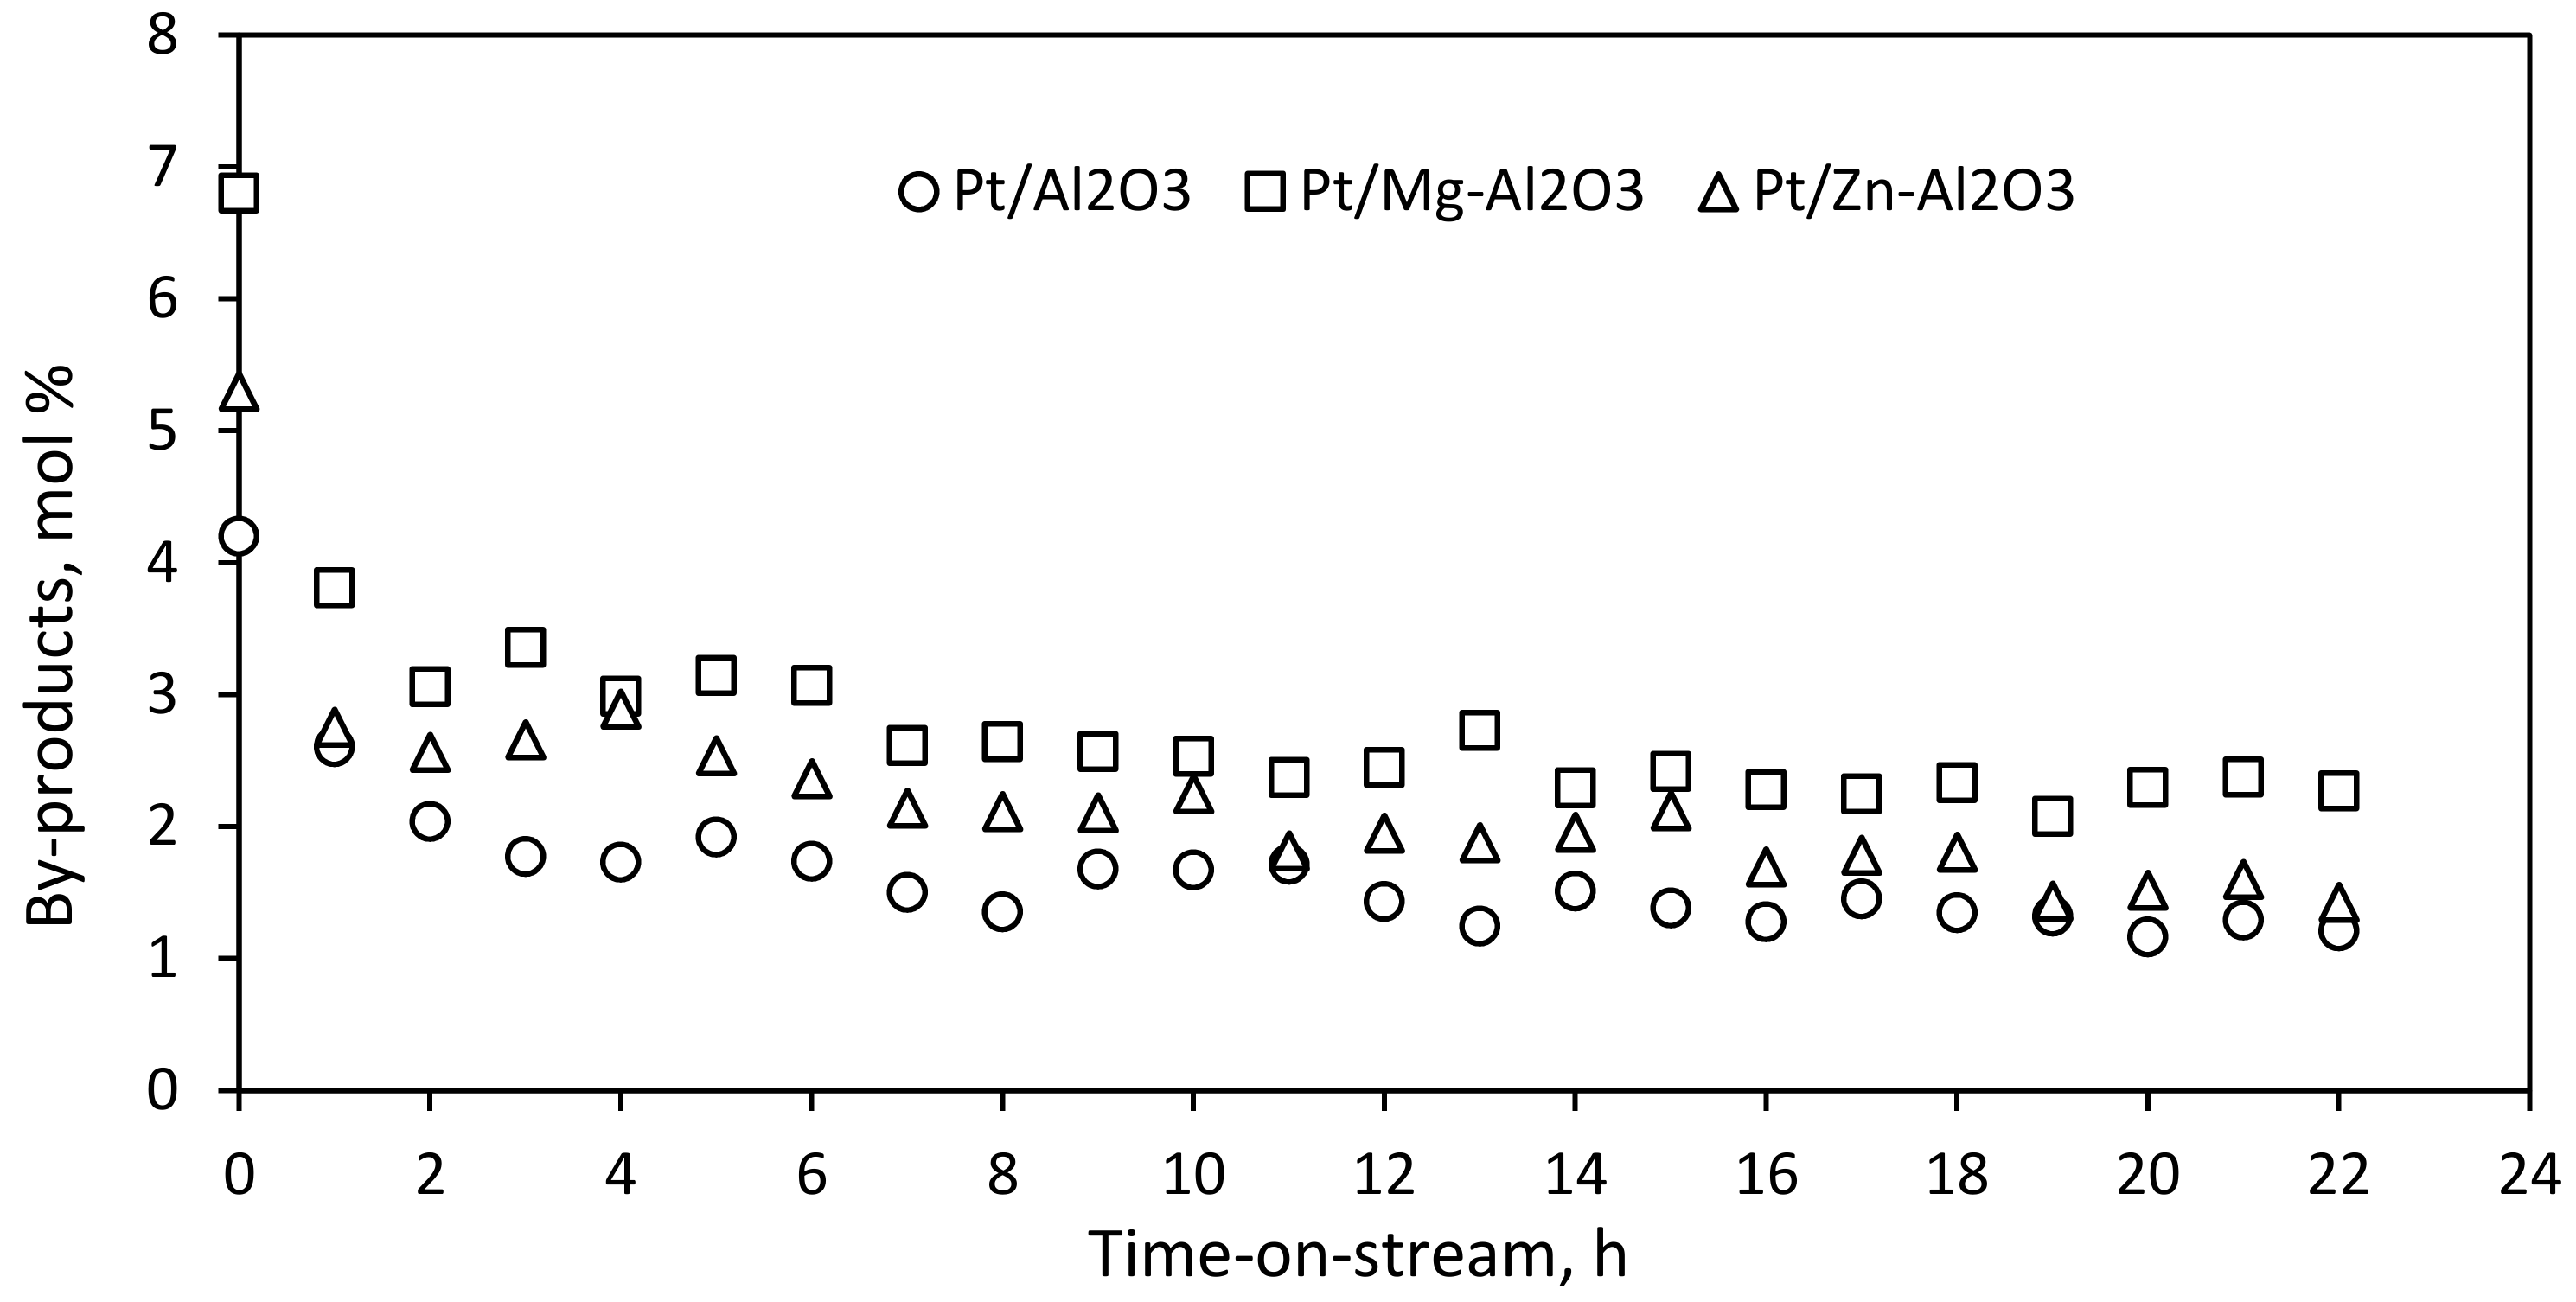
2.1. Catalytic Dehydrogenation Activity

It has been previously reported that dehydrogenation of H18-DBT follows the order H18-DBT‒3H2 → H12-DBT‒3H2 → H6-DBT‒3H2 → H0-DBT [25], as shown by Scheme 1. Where, H6-DBT and H12-DBT could be regarded as stable intermediates or partially dehydrogenated LOHCs. Dehydrogenation experiments are carried out to compare the performance of the various catalysts (Pt/Al2O3, Pt/Zn-Al2O3 and Pt/Mg-Al2O3) which were allowed to run for 22 h at constant reaction temperature. For all experiments, the weight hourly space velocity (WHSV) is 0.61 h−1. Figure 1 shows hydrogen flow rate (HFR) vs. catalyst time-on-stream for the dehydrogenation of H18-DBT. The Pt/Mg-Al2O3 catalyst had the highest initial HFR of 33 nL/h. Other catalysts (Pt/Al2O3 and Pt/Zn-Al2O3) had a similar initial HFR, 31 nL/h. For the first 12 h, the HFR was not stable, but after 13 h, the catalysts exhibited some stability (particularly Pt/Zn-Al2O3). However, in the cases of Pt/Zn-Al2O3 and Pt/Al2O3, the HFR decreased from 31 to ~24 nL/h. Overall, the Pt/Mg-Al2O3 catalyst had the highest activity and stability over a period of 22 h, and the HFR decreased from 33 to 26 nL/h. A similar trend was observed in Figure 2, where catalyst productivity is plotted against time-on-stream. A productivity of 0.1 gH2/gPt/min was observed for all catalysts. Furthermore, all catalysts here showed a declining trend in hydrogen yield over a period of 22 h, see Figure 2. The Pt/Mg-Al2O3 hydrogen yield decreased from 80% to 60%, whereas the Pt/Al2O3 and Pt/Zn-Al2O3 hydrogen yields decreased from 72% to 50% and 73‒51%, respectively. Therefore, Pt/Mg-Al2O3 improved the activity of un-doped Pt/Al2O3.
Figure 3 shows the H18-DBT conversion over Pt/Al2O3, Pt/Zn-Al2O3 and Pt/Mg-Al2O3, determined using single quadrupole mass spectrometer (GC-SQ-MS). During the dehydrogenation of H18-DBT, the intermediates H12-DBT and H6-DBT are formed, and they then also become dehydrogenated, until H0-DBT is the only product present. The conversion vs. time-on-stream plot in Figure 3 is based on the amount of H18-DBT present after the reaction. The catalyst Pt/Mg-Al2O3 had the highest initial conversion of 99%, followed by the Pt/Zn-Al2O3 and Pt/Al2O3 catalysts, with 97% and 96% conversions, respectively. After 22 h, the Pt/Mg-Al2O3 catalyst still exhibited a stable conversion of 92%, whilst the other catalysts exhibited slightly lower conversions. It is a fact that Mg improves reduction of Pt-oxide and this has led to higher metallic Pt concentration (active sites) on Pt/Mg-Al2O3 than that on Pt/Al2O3 and Pt/Zn-Al2O3 [18]. It is also known that Mg could increase the rate of Al2O3 grain densification by raising the diffusion coefficient [11]. Therefore, the larger the grain size, the larger the pores. This has an effect on minimizing the pore diffusion limitation. Hence, improved H18-DBT conversion is observed. As shown in Figure 3, the conversion difference between Pt/Al2O3 and Pt/Zn-Al2O3 catalyst is not that significant. Further optimisation of Zn loading could result in improved H18-DBT conversion.
Figure 4 shows the selectivity of catalysts towards H0-DBT, determined using GC-SQ-MS. The initial selectivity of Pt/Mg-Al2O3, Pt/Zn-Al2O3 and Pt/Al2O3 towards H0-DBT was 78%, 75% and 71%, respectively. Pt/Al2O3 was the least selective catalyst here, with a final selectivity of 45%, whereas Pt/Mg-Al2O3 was the most selective catalyst, with a final selectivity of 57%, after 22 h. It appeared that a less acidic catalyst favoured dehydrogenation and increased the selectivity, compared with highly acidic supports. Acidic sites of the support facilitate C–C breaking, and as a result, carbon becomes deposited on the catalyst surface [18]. Therefore, lowering the acidity of the support minimizes side reactions (C–C cracking). Thus, the high selectivity could be attributed to an effect of Mg to the adsorption of H0-DBT on the Pt surface and promoting the H0-DBT desorption.
Figure 4 also shows the selectivity of catalysts towards the intermediates: H12-DBT and H6-DBT. All catalysts here showed a decline in selectivity towards H0-DBT, but an increase towards the H6-DBT and H12-DBT intermediates. The decline in selectivity over time is due to the catalyst instability. Pt/Al2O3 selectivity towards H6-DBT increased from 24% to 39%, while that of H12-DBT increased from 5% to 10%. This is an indication that catalyst active sites are compromised by deactivation and over time, H6-DBT and H12-DBT become difficult to be dehydrogenated.
Figure 5 shows the total by-products formed during the dehydrogenation of H18-DBT. In the dehydrogenation of H18-DBT, the higher the catalytic activity, the more by-products are produced. These by-products are a combination of high- and low-boiling-point compounds [26]. Pt/Mg-Al2O3 showed the highest initial concentration of by-products (6.8 mol%), followed by Pt/Zn-Al2O3 (5.3 mol%) and Pt/Al2O3 (4.2 mol%). After 22 h, Pt/Mg-Al2O3 still produced the highest concentration of by-products (3.2 mol%). Despite the fact that Pt/Mg-Al2O3 is less acidic, a highly active catalyst produces more by-products because the Pt active sites promote C–C breaking by hydrogenolysis. Bocanegra et al. [27] have reported that Pt/MgAl2O4 has higher hydrogenolytic capacity than Pt/Zn-Al2O4.
The deactivation parameter, ΔX = (Xi − Xf)/Xi × 100, is calculated to determine the % deactivation over a reaction period of 22 h. Table 1 summarises the performance of the catalysts for dehydrogenation of H18-DBT. Pt/Mg-Al2O3 catalyst has the lowest deactivation parameter (ΔX = 6.1%) compared to Pt/Al2O3 (ΔX = 7.2%) and Pt/Zn-Al2O3 (ΔX = 7.3%). This is an indication of improvement as Mg-doped catalyst deactivation is lesser. Increasing the Mg loading could lower the deactivation parameter and thus improve the catalyst stability further. Bai and co-workers reported the same phenomena for Mg-doped PtSnNa/ZSM-5, where the deactivation parameter decreased from 10% to 7% [22].

2.2. Characterisation

The subsections below describe the results of experiments and procedures carried out to determine the following: Pt loading, catalyst composition, metal dispersion, metal reducibility, catalyst acidity, particle size distribution and the source of LOHC by-products.

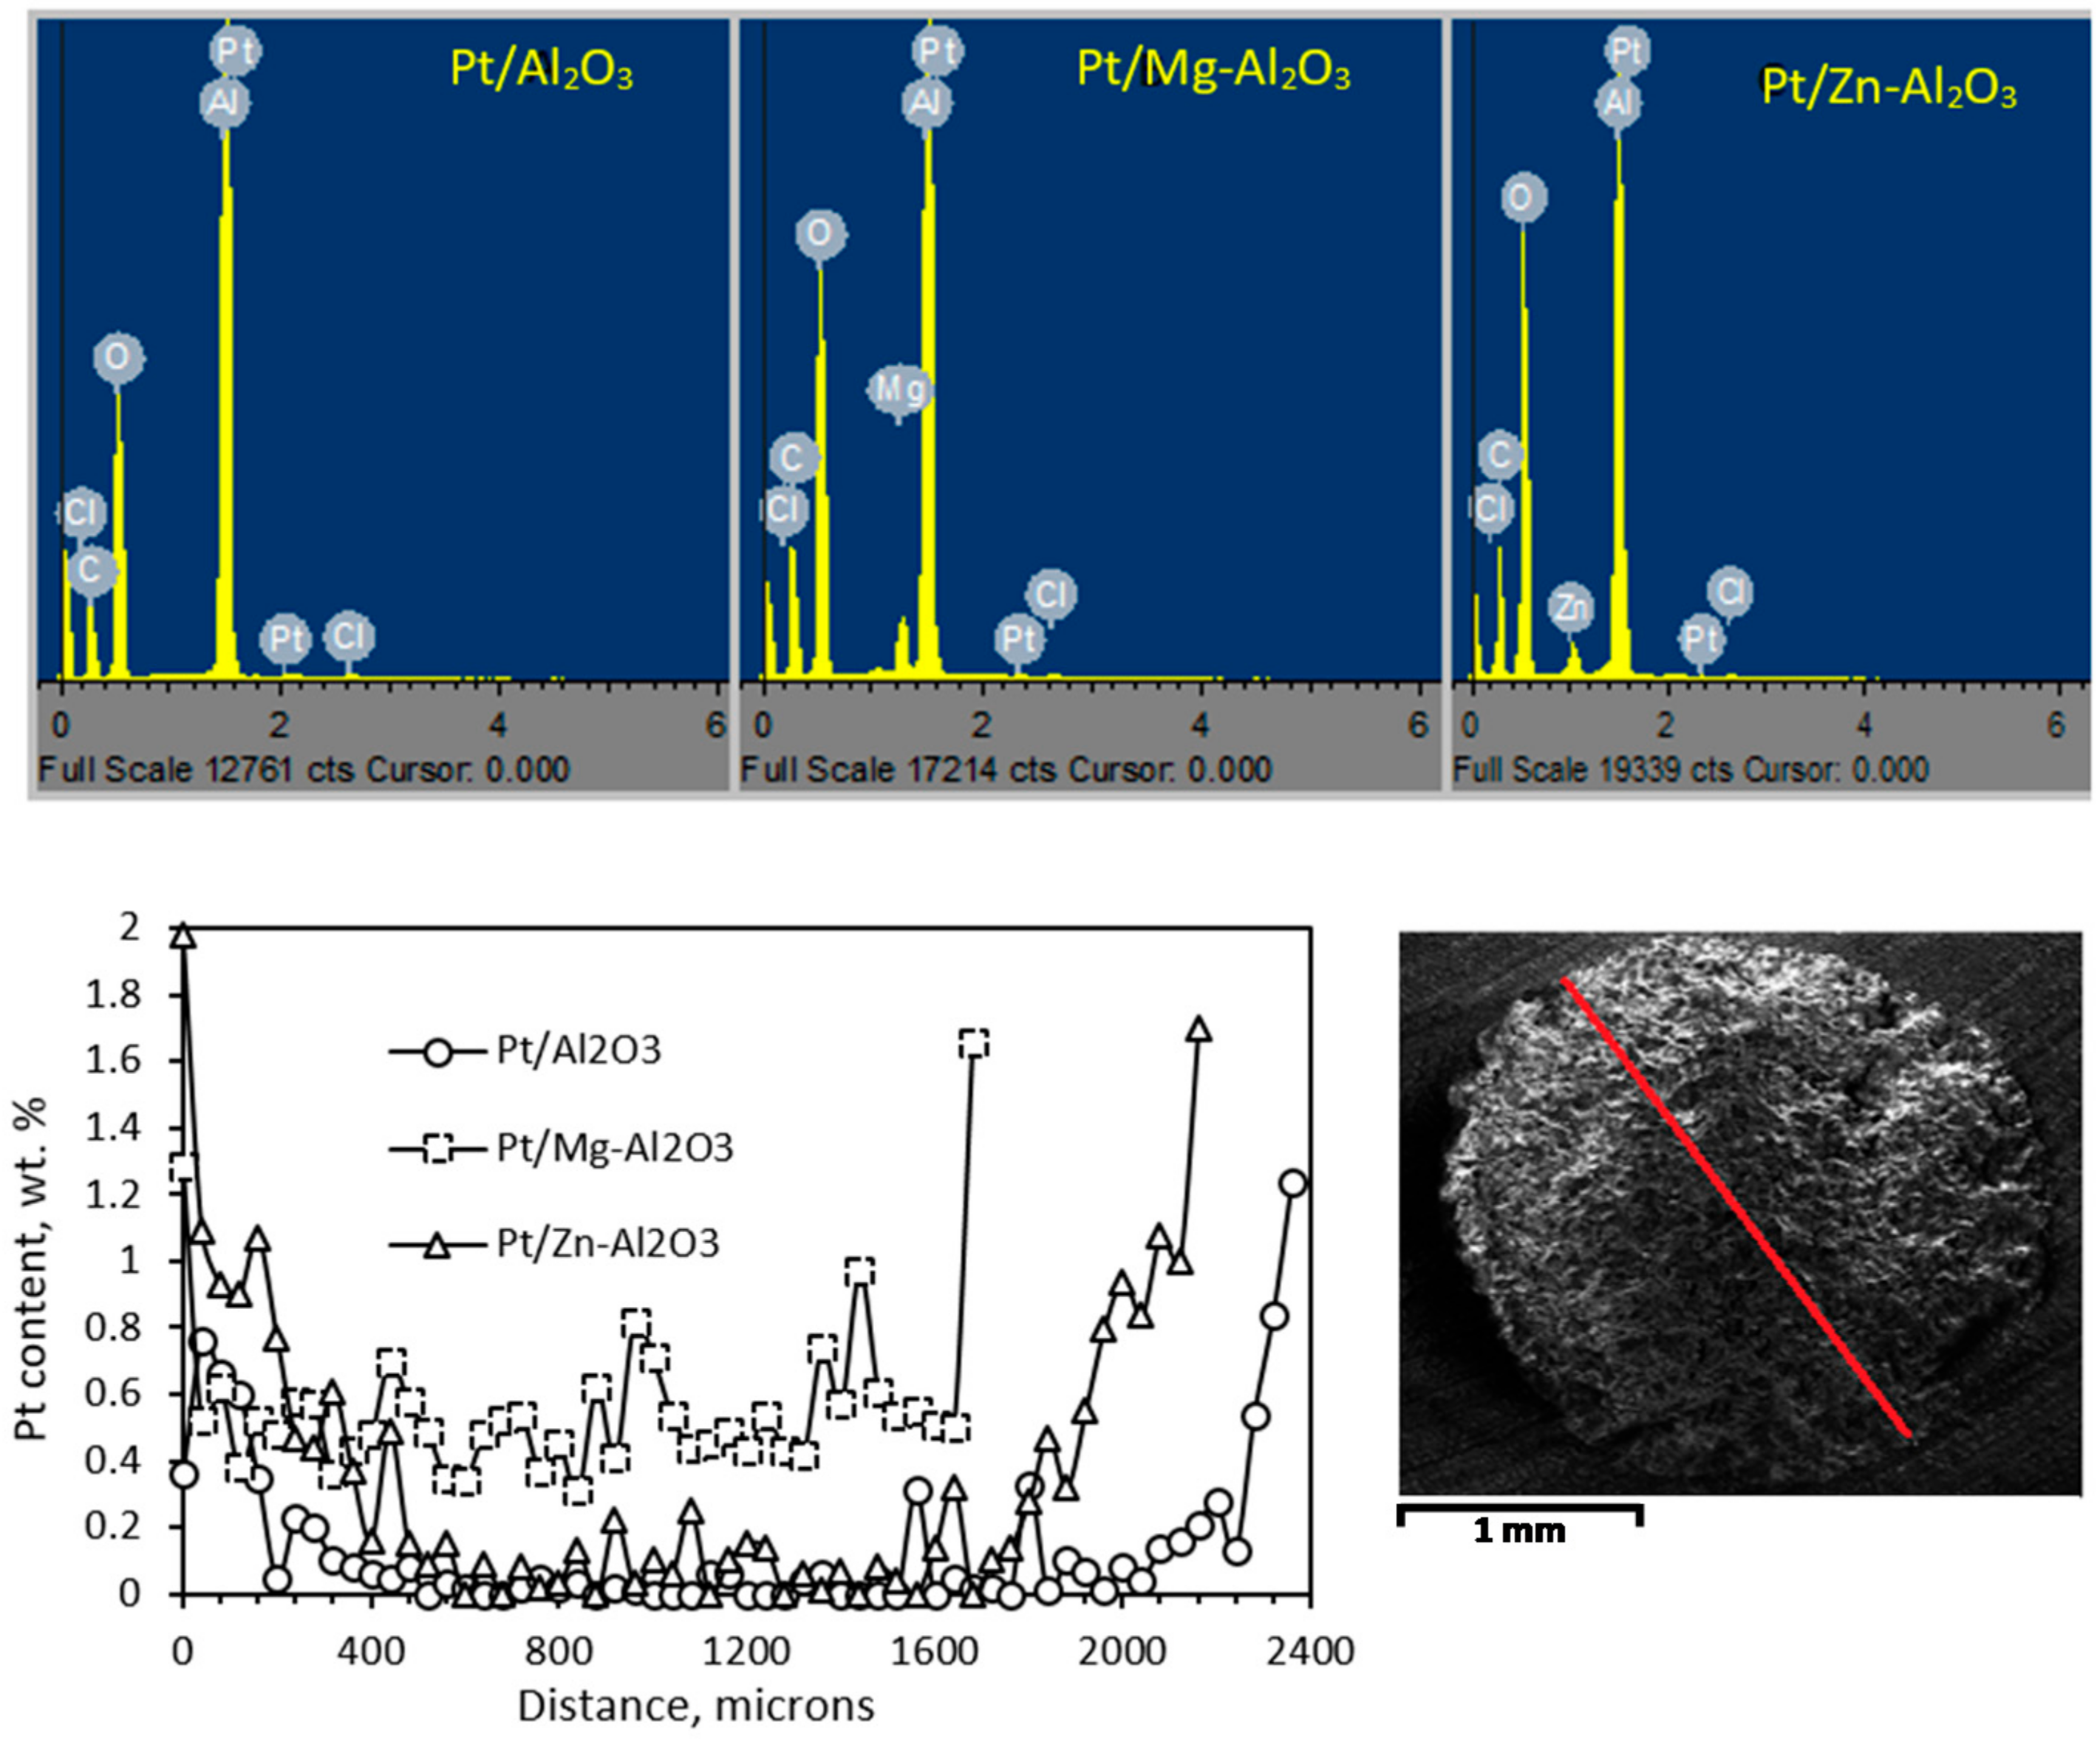
2.2.1. Inductively Coupled Plasma-Optical Emission Spectrometry (ICP-OES) and Scanning Electron Microscopy-Energy Dispersive X-ray Spectroscopy (SEM-EDS)

The target Pt loading for all catalysts was 0.5 wt. % Pt. The actual loadings confirmed by ICP-OES for Pt/Al2O3, Pt/Mg-Al2O3 and Pt/Zn-Al2O3 were 0.48, 0.49 and 0.48 wt.%, respectively (see Table 2). The target loading of Mg and Zn was 3.8 wt.%—the actual loadings were 3.89 and 3.44 wt.%, respectively.
SEM-EDS confirmed the presence of Pt, Mg and Zn in the reduced catalysts, as shown in Figure 6. Elemental line analysis indicated that the Mg-doped catalyst has the greatest amount of Pt distributed throughout the pellet. The Zn-doped and undoped catalysts exhibited an eggshell type of catalyst, where there is much Pt on the edges and little inside (<0.1% Pt). It is possible that Mg promotes the diffusion of the precursor solution during impregnation, hence Pt is distributed throughout the support. This is also consistent with the image in Figure 6, where the cross-sections of the pellets shows Pt distribution.

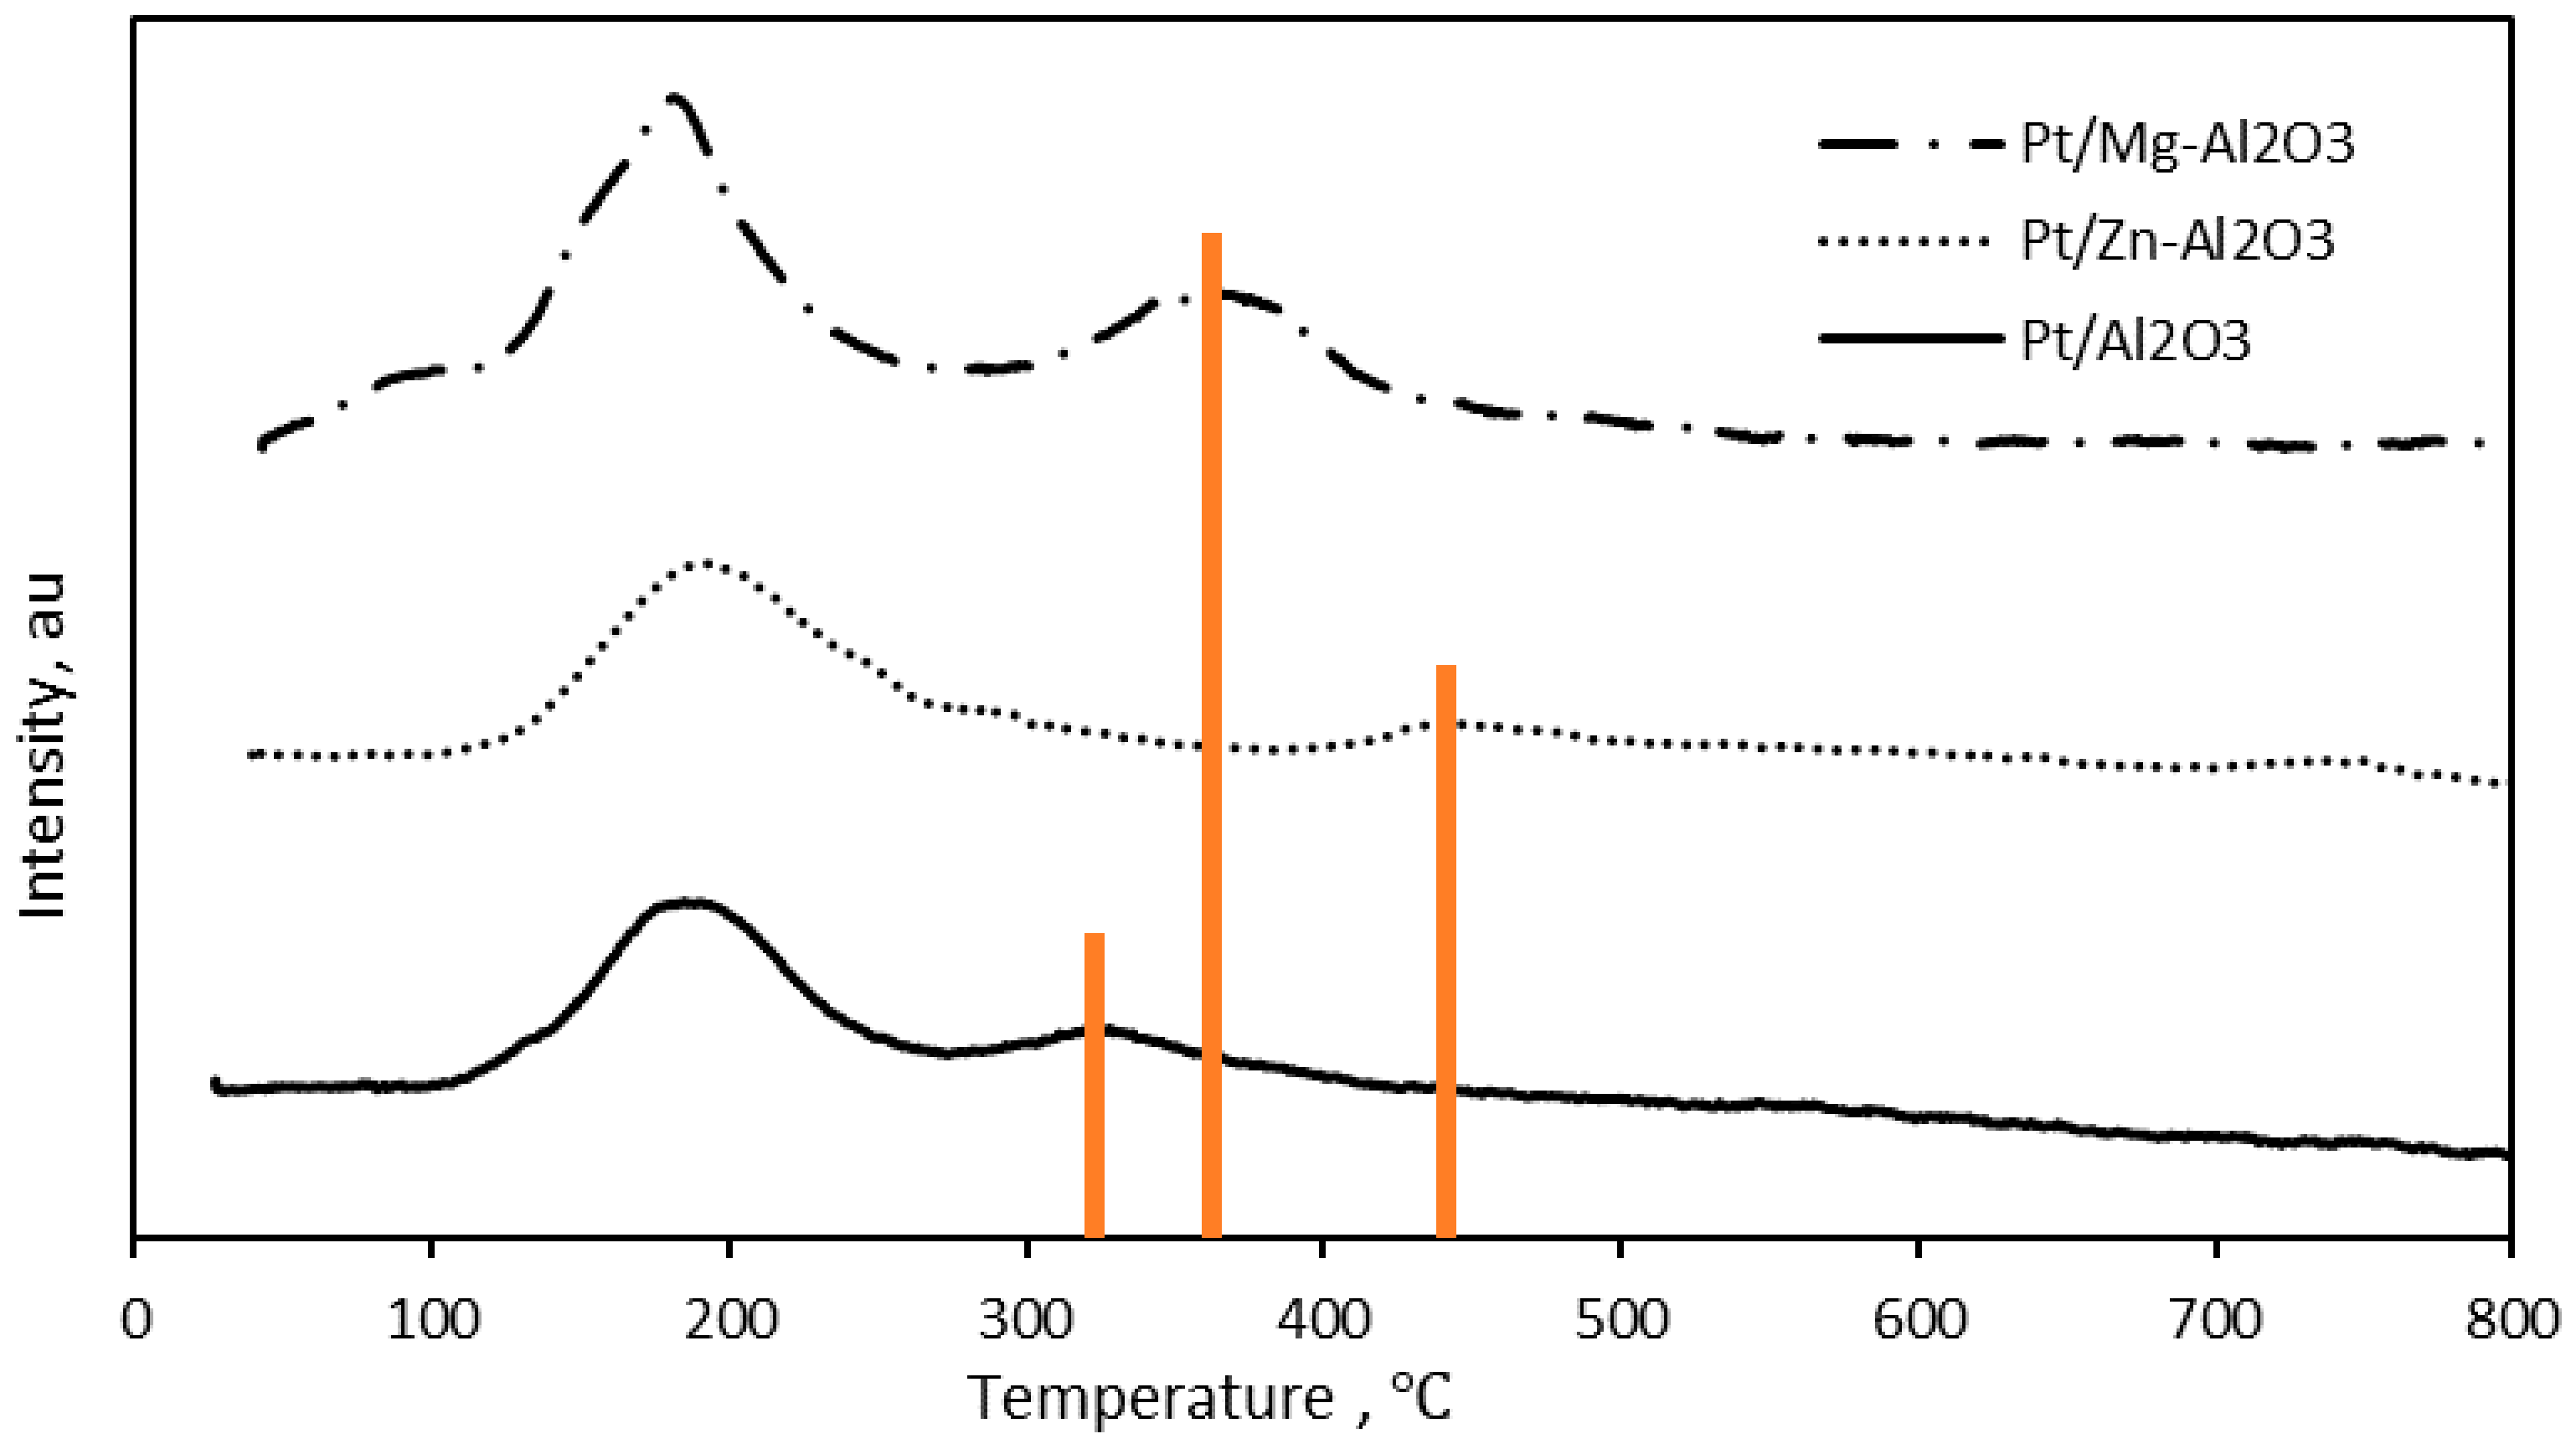
2.2.2. Hydrogen Temperature-Programmed Reduction (H2-TPR)

H2-TPR profiles showed broad and intense peaks at temperatures between 100 and 200 °C and small peaks at temperatures between 300 and 500 °C (see Figure 7). The first broad peaks were due to the reduction of PtO and PtO2 species weakly bonded to the surface of the support [28]. The second peak indicated strong support interaction with Pt, possibly leading to the formation of PtAl2O4 spinel species (formed during impregnation and calcination), which are difficult to reduce. It is interesting to note that the second peaks of the Mg- and Zn-doped Pt/Al2O3 shifted to higher temperatures, indicating the presence of stronger interactions with the support. Therefore, doped catalysts have stronger metal support interactions than non-doped Pt/Al2O3. This is known to prevent sintering of particles [6,7,11]. Furthermore, Kumar et al. [17] ascribed the increase or shift in reduction temperature of the Mg-doped catalyst to the weak electronegative bond between Mg and O2 in MgO, which causes the oxygen to preferably bond with Pt. Another possible reason could be the formation of Mg and Zn aluminates, which increase the reduction temperature. The following hydrogen consumptions for Pt/Al2O3, Pt/Mg-Al2O3 and Pt/Zn-Al2O3 were observed: 34, 64 and 55 μmol/g, respectively. The hydrogen consumption of 34 μmol/g for Pt/Al2O3 is close to the theoretical value (30.3 μmol/g) reported for the complete reduction of Pt4+ to Pt0 [29]. However, the consumption of Pt/Mg-Al2O3 and Pt/Zn-Al2O3 is higher than the stoichiometric value for reducing all platinum species. This increment could be possibly due to the reduction of impurities on the support [15,29].

2.2.3. CO Pulse Chemisorption
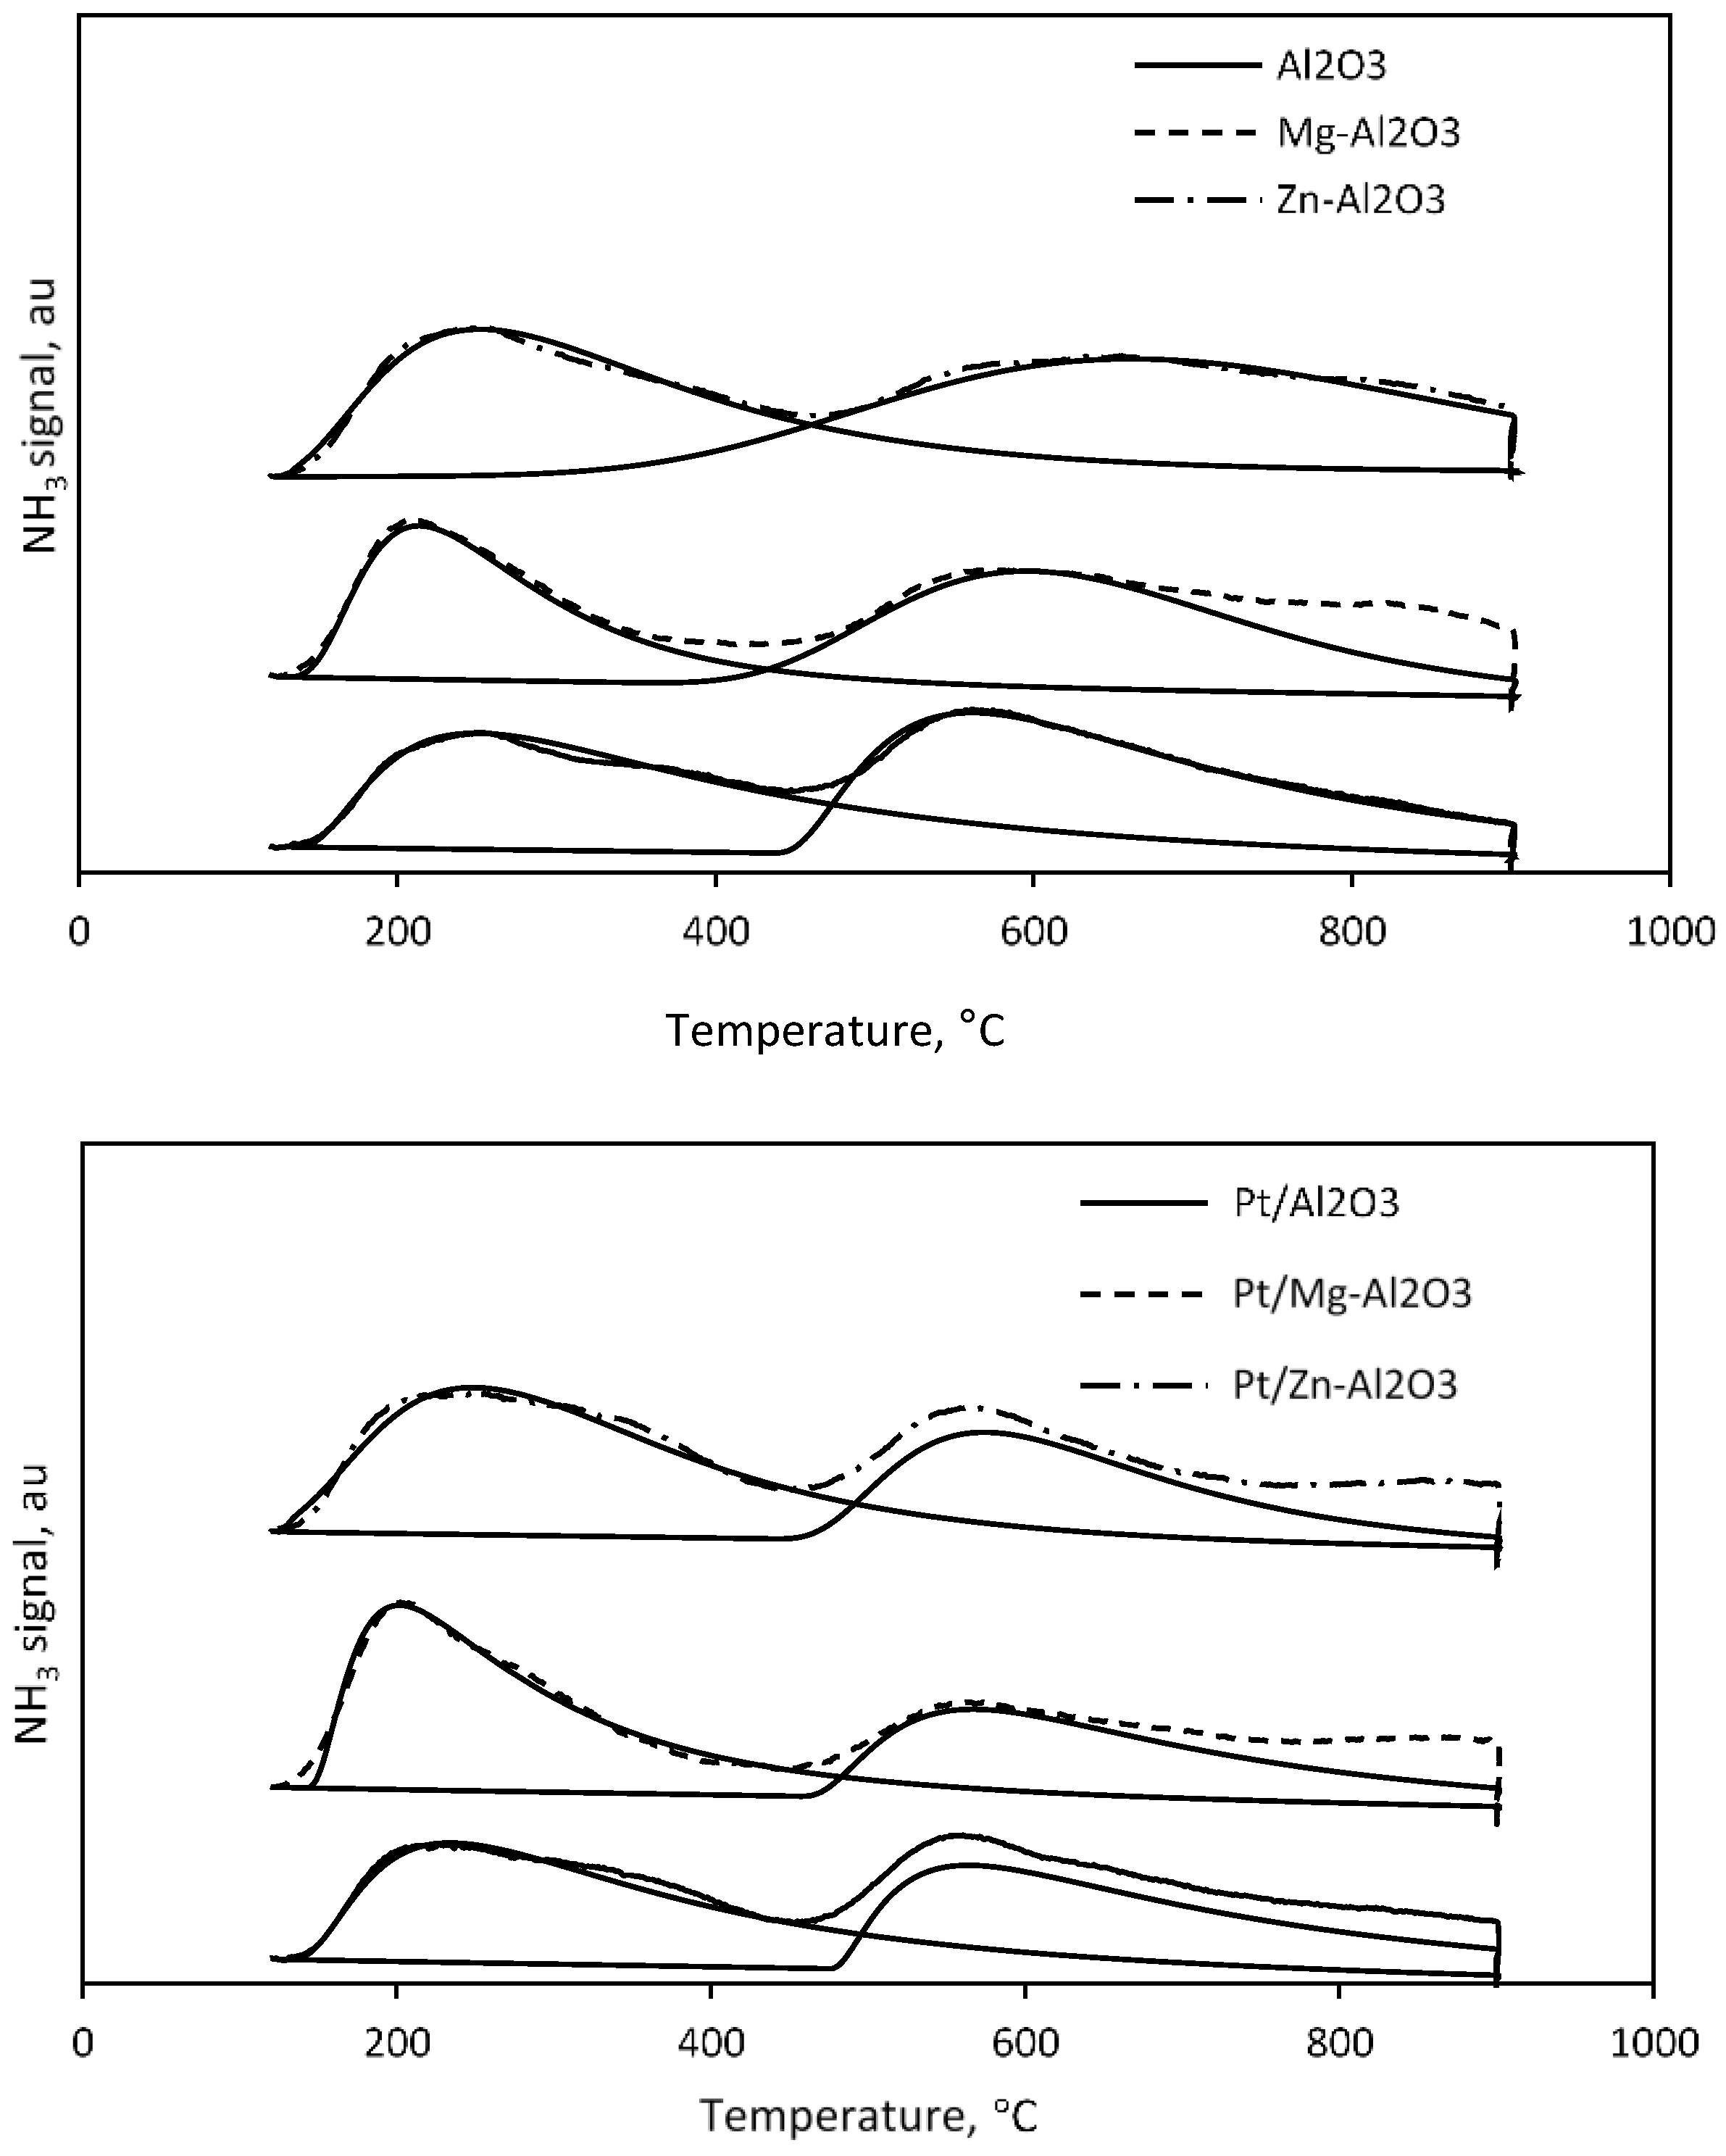
The addition of Mg and Zn dopants decreased the dispersion of Pt particles (see Table 3). A decrease in the metallic surface area and the formation of strongly bonded Pt complexes with doped Mg and Zn supports may have contributed to this. Strong metal–support interactions make it difficult for CO to absorb onto Pt due to fewer exposed active sites. There are, however, several reports that describe an increase in dispersion upon Mg doping [6,17]. Low dispersion of 34% for Pt/Mg-Al2O3 compared to 38% for Pt/Al2O3 can be ascribed to alteration of the adsorptive properties of Pt/Mg-Al2O3 when Pt reacts with basic sites of Mg [15,30]. Pt/Zn-Al2O3 had the lowest Pt dispersion, 23%, relatively close to values reported in the literature [17,31,32].
This could be due to the formation of Pt-Zn alloys and strong interactions that may not be active in CO chemisorption [29]. The elemental line scan in Figure 6 shows high Pt distribution throughout the Mg-doped catalyst (not an eggshell type) as opposed to the surface dispersion of Pt shown in Table 3.

2.2.4. NH3-TPD

NH3-TPD results are shown in Figure 8, including desorption profiles (dotted lines) and their respective deconvoluted peaks (solid lines) for the Al2O3 supports and Pt/Al2O3 catalysts. The first peak was at 200–250 °C and the second peak at 550–700 °C. The peaks are attributed to desorption of NH3 due to weak/intermediate acidic sites and strong acidic sites, which appear in the region of 200–400 °C and 400–550 °C respectively, for γ-Al2O3 [33,34,35,36]. Values for the acidity of supports and catalysts, determined by NH3-TPD, are tabulated in Table 4. Results show that Mg doping decreased the total acidity of Al2O3 from 0.63 to 0.40 mmol NH3/g, while Zn doping slightly increased it to 0.68 mmol NH3/g. The order of the total acidity of supports was Zn-Al2O3 > Al2O3 > Mg-Al2O3. The addition of Mg decreased the total acidity of alumina by 37%, whereas Zn increased it by 8%. Mg is inherently basic and leads to a decrease in the strength of strong acidic sites. According to Karnjanakom et al., increased acidity in Zn-doped alumina is due to the substitution of proton sites on the Al2O3 framework with the doping Zn species [37]. This substitution results in the regeneration of new proton sites on the support.

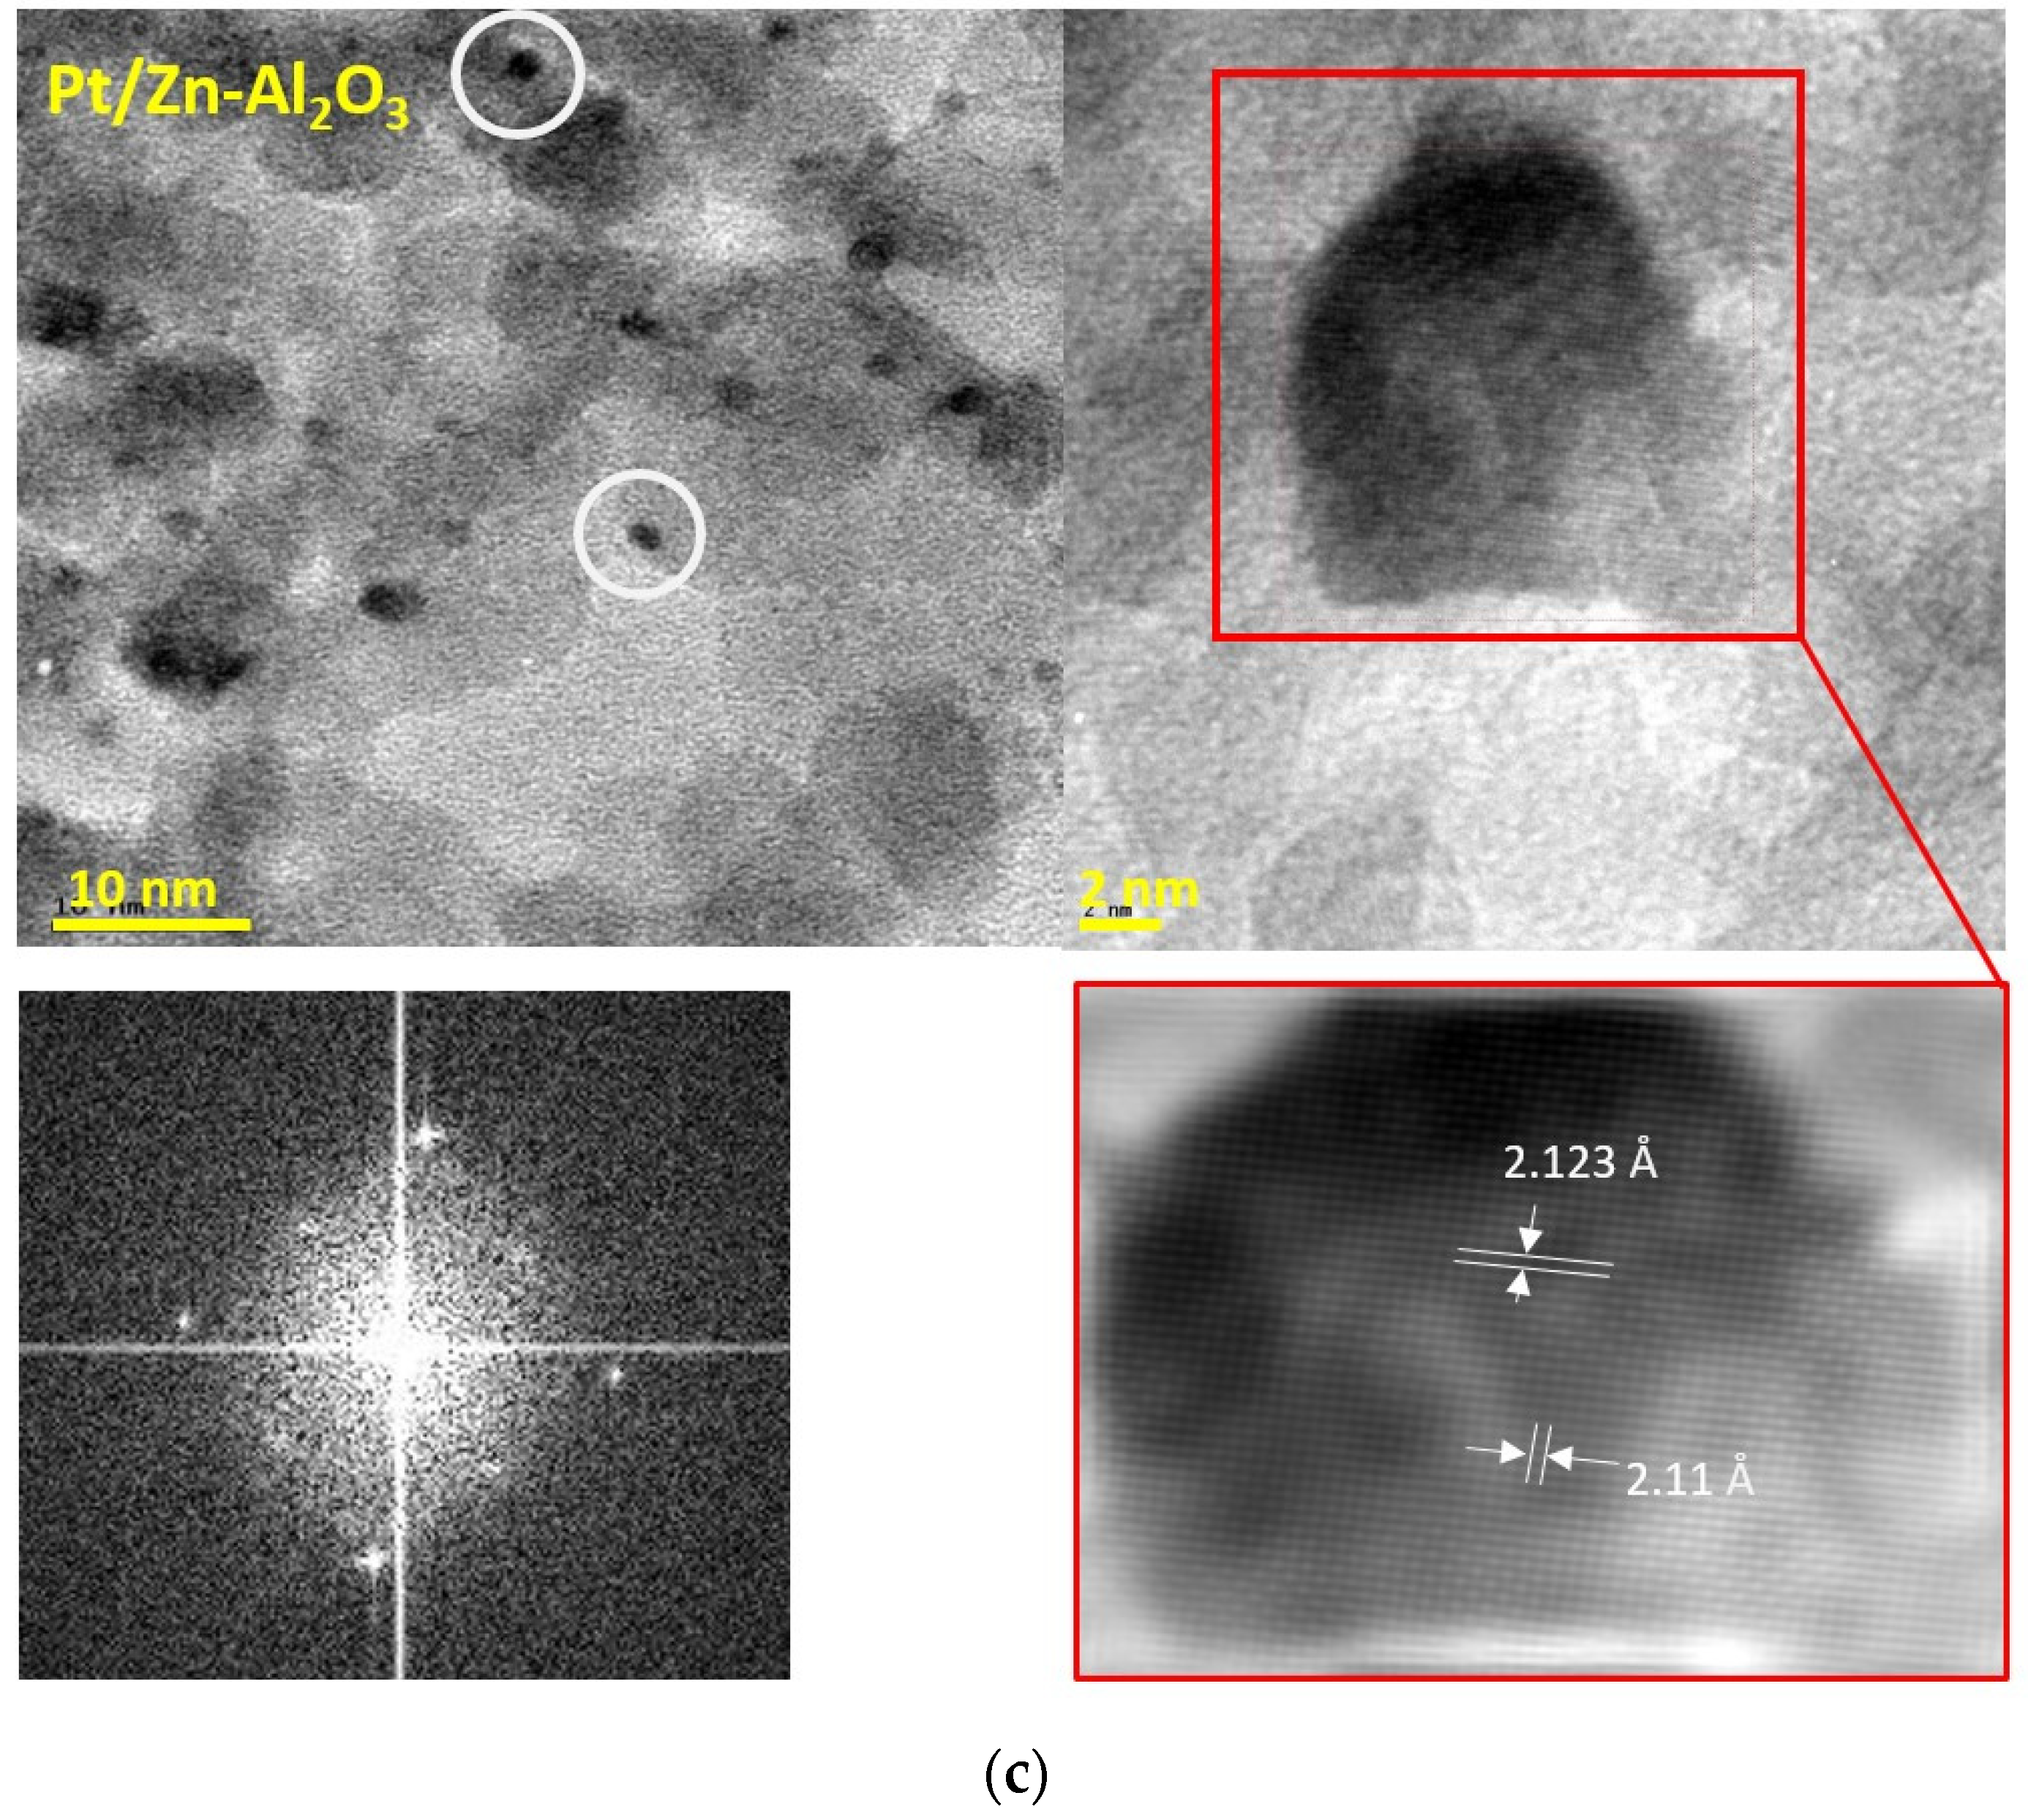
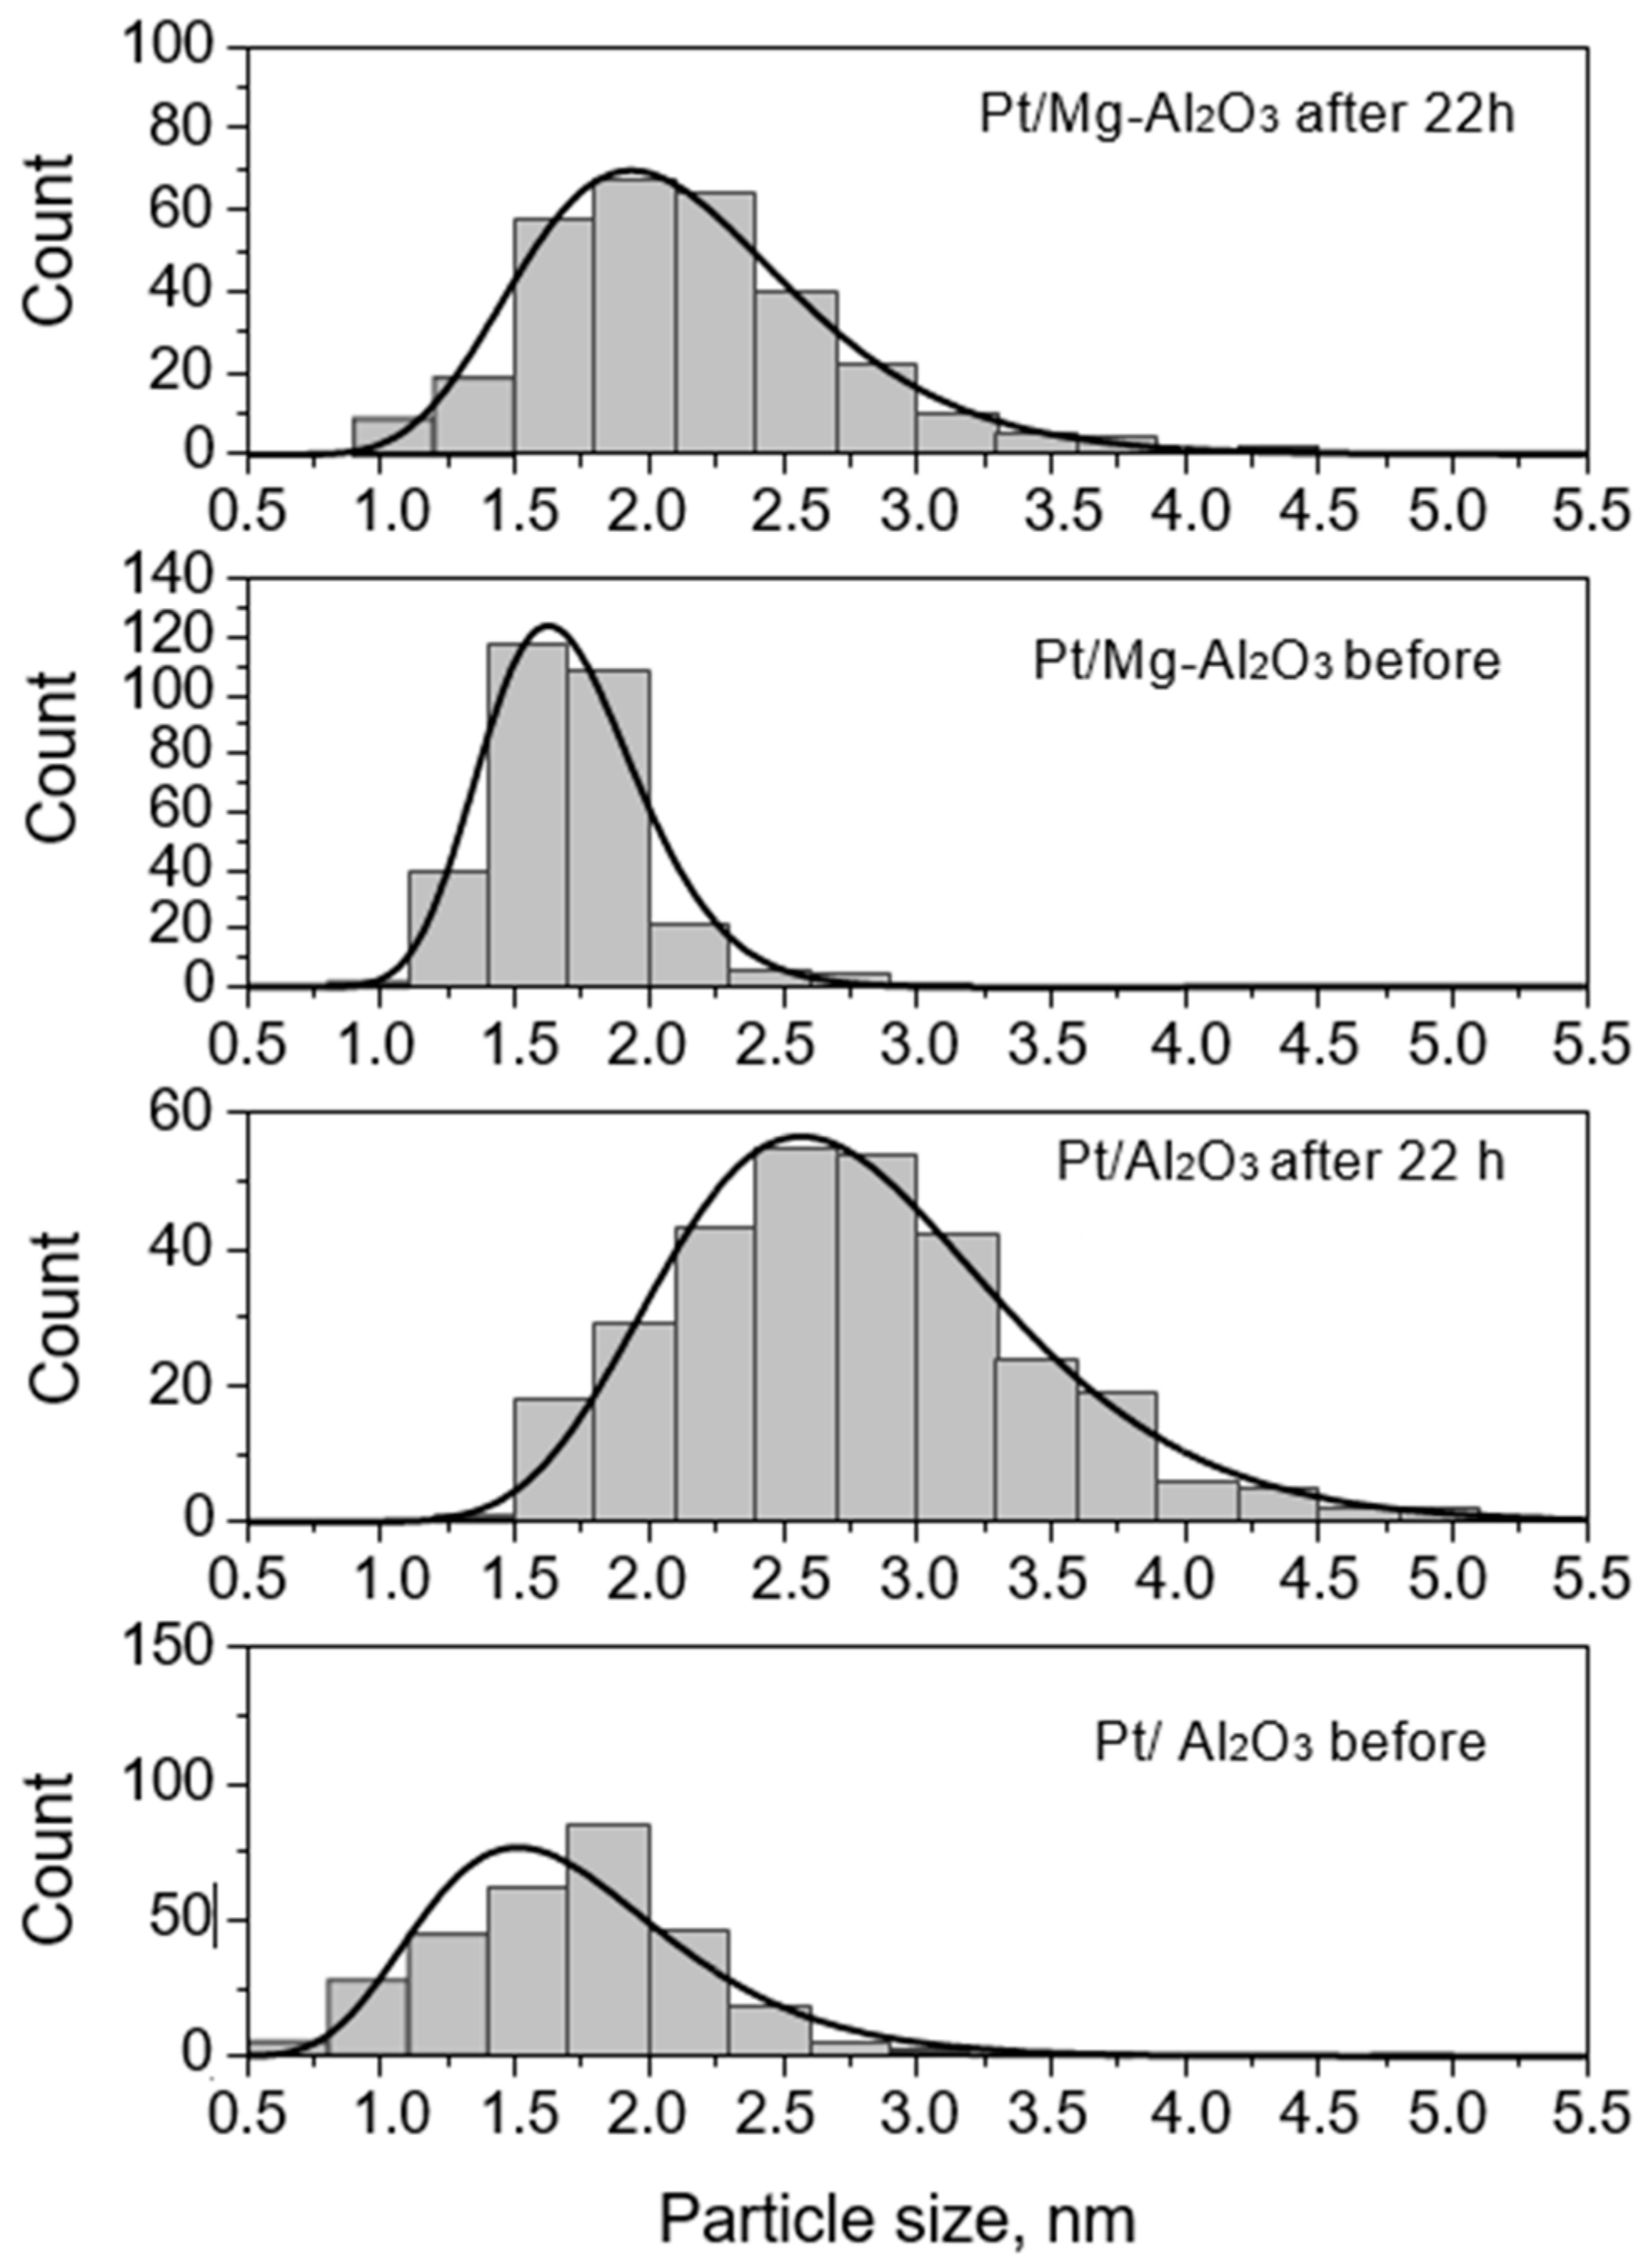
2.2.5. Transmission Electron Microscopy (TEM)

TEM images revealed the presence of Pt nanoparticles, as indicated by dark dispersed spherical particles, see Figure 9a–c. The measured d-spacing between the lattice fringes of the Pt/Al2O3 particles was 2.07 Å and 2.4 Å. These d-spacing values correspond to the (200) and (111) family of planes, respectively. Furthermore, we obtained a d-spacing of 2.4 Å for Pt/Mg-Al2O3 catalyst. Miyazawa et al. measured a d-spacing of 2.3 Å, corresponding to the (111) plane [38]. For the Pt/Zn-Al2O3 catalyst, we obtained the d-spacing values 2.11 and 2.12 Å. These d-spacing values correspond to the d-spacing reported by the Joint Committee on Powder Diffraction Standards (JCPDS) files for face-centred cubic Pt. Table 5 summarises the measured d-values from fast Fourier transform (FFT) analysis, the family of planes, which correspond to these spacings, and the error for the values reported in the literature.
The particle size diameter was obtained by measuring about 300 particles for each catalyst and fitting the plotted histograms using a log-normal distribution curve. The parameters of log-normal distribution (μ-lognormal mean and σ-lognormal standard deviation obtained after fitting the 300 particles) are used to calculate the actual mean (m) and mode (mo) of each catalyst using the equations below. The results are shown in Table 6.
[ m = e x p ( μ + σ 2 / 2 ) ]
[ m o = e x p μ σ 2 ]
The obtained mean particle size is in the range from 1.54 to 1.72 nm for fresh catalysts, and from 2.14 to 2.80 nm for catalysts which sustained 22 h of dehydrogenation, see Figure 10 and Table 6. However, Pt particles were not observed for the Pt/Zn-Al2O3 sample and it could be that Zn affects nucleation and growth of particles, as reported by Belskaya [10]. The slight increase in particle size after 22 h of dehydrogenation reaction is negligible and cannot be linked to Pt sintering since it occurs at temperatures above 300 °C. The discrepancy in the particle size obtained from CO chemisorption and TEM have been reported elsewhere [2,39].

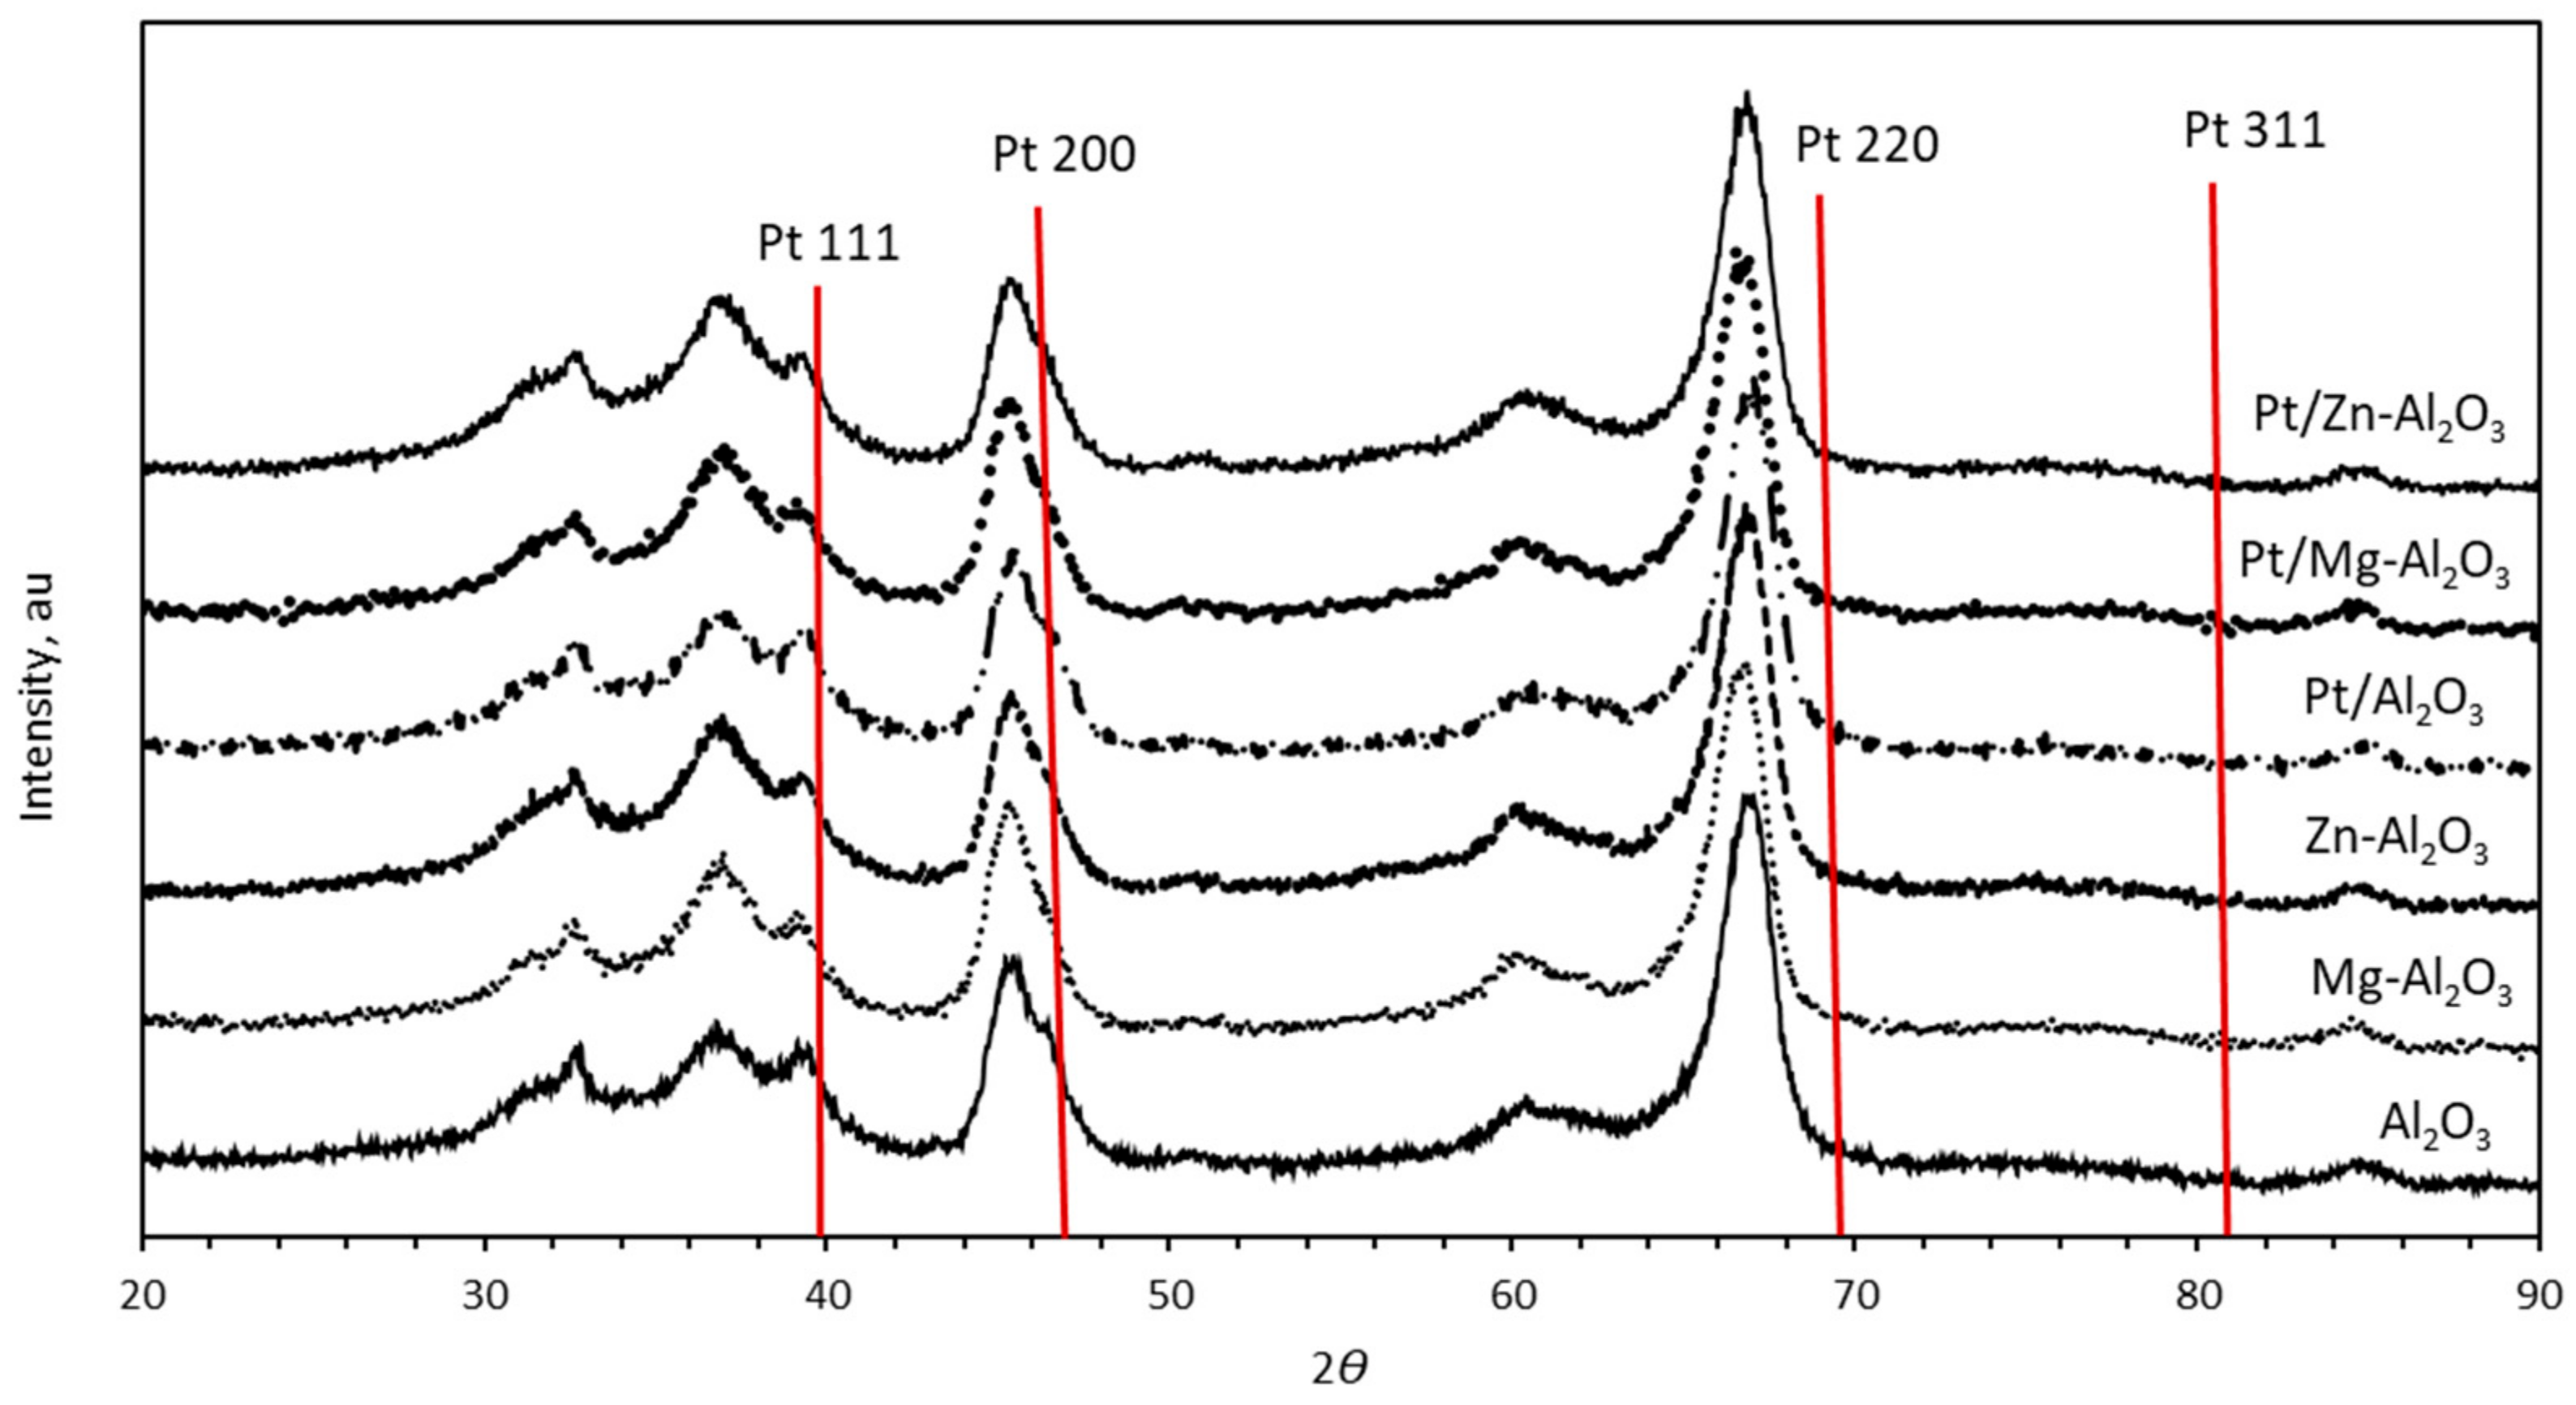
2.2.6. X-ray Diffraction (XRD)

Broad XRD peaks of pure alumina were detected at 32.5°, 37.0°, 38.9°, 45.0° and 67.5°. There was no difference between doped, undoped or Pt-loaded catalysts. This is because the Pt, Mg and Zn particles are small, and highly dispersed in the bulk alumina phase, and as such, they were undetectable by XRD. The positions at which the Pt peaks should be observed are shown as vertical lines in Figure 11. The Pt loading was too low to be detected by XRD. For the Mg- and Zn-doped catalysts, there was no clear evidence of the existence of Mg and Zn oxides or aluminates (MgAl2O4/ZnAl2O4) because their main peaks overlapped with those of alumina [8,40,41].

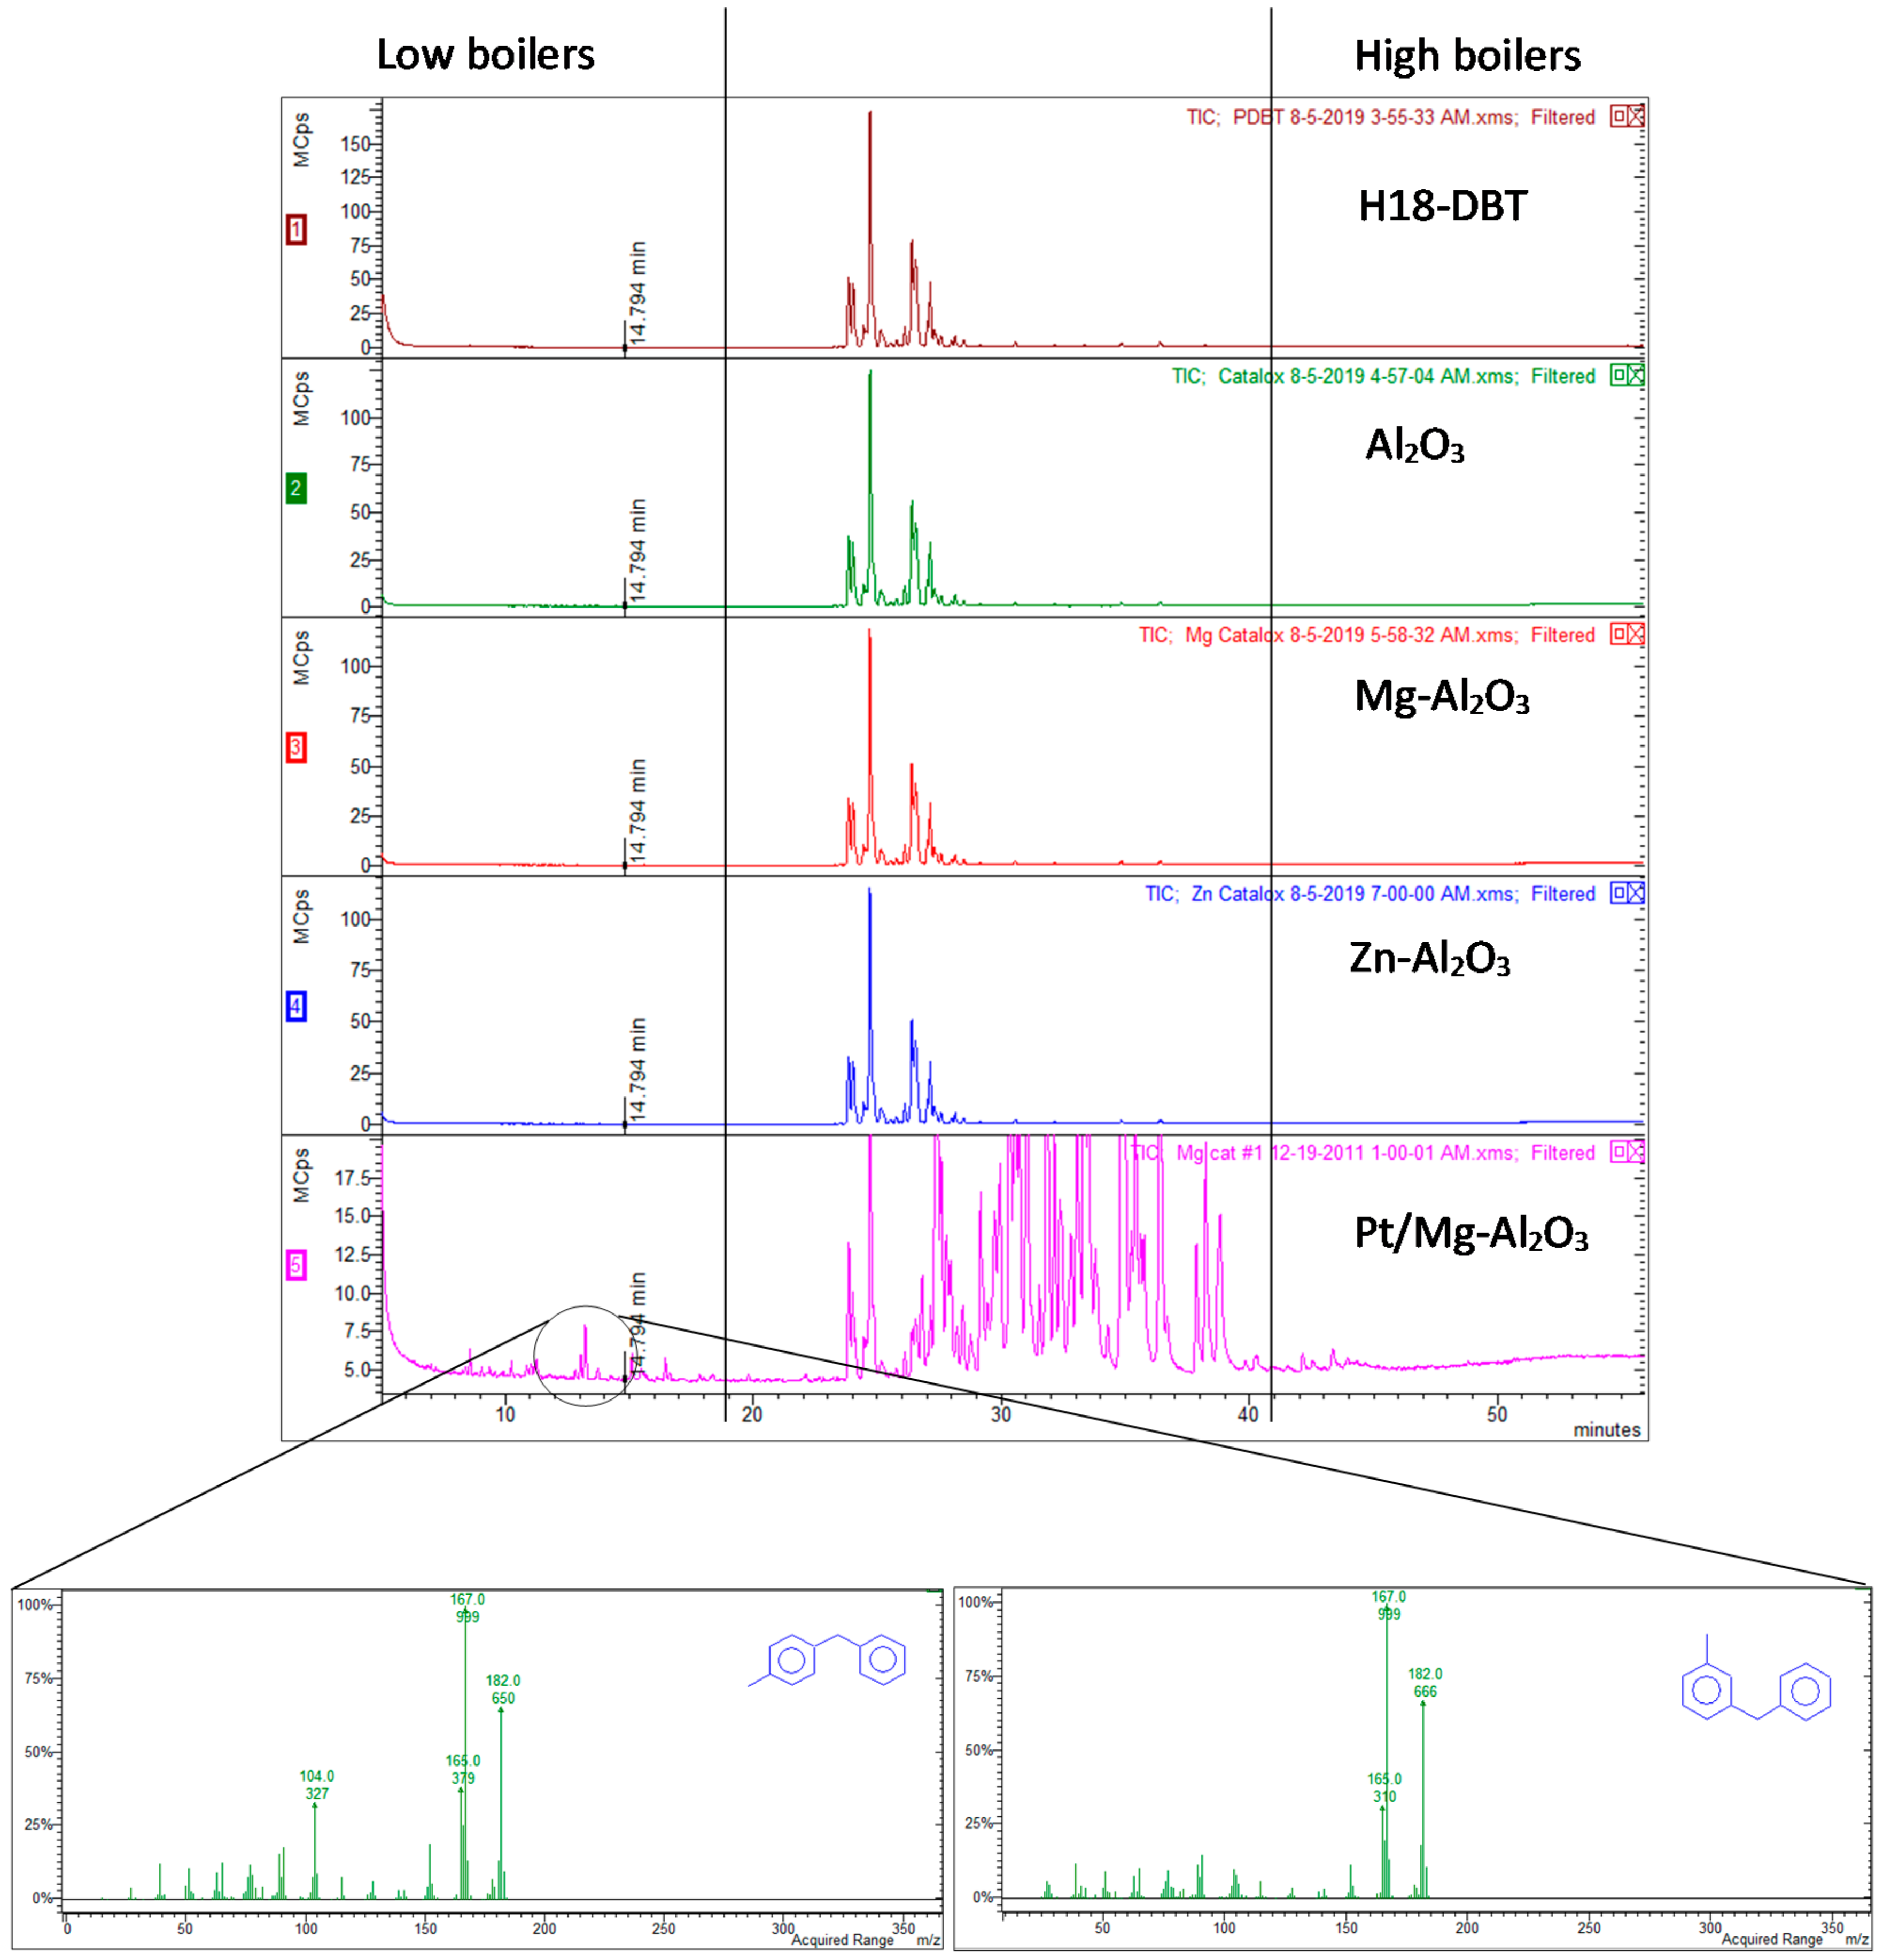
2.2.7. Characterisation of the Liquid Carrier Molecules

Here, we determined whether the by-products formed as a result of thermal cracking or by the nature of the support material or Pt catalyst. First, H18-DBT was heated without any catalyst or support material for 1.5 h at 300 °C. Second, in separate experiments, each support material (Al2O3, Mg-Al2O3 and Zn-Al2O3) was added to fresh H18-DBT and treated under the same conditions as mentioned above. Pt/Al2O3 catalyst was added at a later stage. The results did not indicate the presence of any by-products in the low and high boiler window of the spectrum when H18-DBT and all the supports were used (see Figure 12). However, by-products appeared when the catalyst was used. These by-products can be seen in Figure 12 as peaks in the low and high boiler region of the Pt/Mg-Al2O3 catalysts. This suggests that the operating conditions and support materials alone do not contribute to the formation of by-products, but the catalyst does. The aromatic molecules (H0-DBT) produced during dehydrogenation are susceptible to the acid sites of the support, which provides the cracking function. Hence, by-products were not seen in test of blank supports.

3. Experimental

3.1. Materials

Dibenzyltoluene was purchased from Sasol (Marl, Germany) under the trade name Marlotherm-SH and further hydrogenated, using a nickel-based catalyst in a packed fixed bed reactor system, to obtain H18-DBT with a degree of hydrogenation (doh) of 99%. The spherically shaped catalyst support pellets (Al2O3, Mg-Al2O3, Zn-Al2O3) of diameter in the range of 1–3 mm were supplied by Sasol, Johannesburg, South Africa. The Mg-Al2O3 and Zn-Al2O3 were prepared by modification of parent unmodified γ-Al2O3 used in this study. Hexachloroplatinic acid hydrate (38% Pt basis) was purchased from Sigma Aldrich (Schnelldorf, Germany). The following gases were supplied by Afrox, Johannesburg, South Africa: H2 (99.999%), N2 (99.999%), He (99.999%), Ar (99.999%), CO/He (10%), NH3/He (10%) and H2/Ar (10% H2). These gases were mainly used to supply the furnace setup and chemisorption equipment for catalyst processing and characterisation, respectively.

3.2. Catalyst Preparation

Chloroplatinic acid solution (0.025 M) was prepared by adding hexachloroplatinic acid hydrate (powder form) to deionised water. The solution was added to each alumina support to produce 0.5 wt.% Pt loading. A Büchi Rotavapor® R300 was used to evaporate water from pellets. The heating bath was set at 50 °C while the evaporating flask was under 46 mbar vacuum pressure and rotating at a speed of 40 rpm. An oven (Espec SU-221) was set at 120 °C to dry the pellets for a period of 4 h. Thereafter, pellets were calcined at 350 °C (ramp rate = 5 °C/min) in a stream of air (150 mL/min) for 5 h, using a furnace from Carbolite, UK. The calcined catalysts were reduced in a stream of 10% H2/Ar (50 mL/min) over periods of 4 h at 350, 400 and 450 °C for Pt/Al2O3, Pt/Mg-Al2O3 and Pt/Zn-Al2O3, respectively.

3.3. Catalyst Characterisation

3.3.1. Catalyst

The catalyst loading was confirmed by inductively coupled plasma–optical emission spectrometry (ICP-OES), using an Agilent 5110 ICP-OES instrument and the ICP Expert software. Catalysts were crushed and leached for 24 h, using a mixture of H2O2 and HCl (ratio 1:10) at 60 °C. The leachate was then analysed for the presence of Pt, Mg and Zn.
An ammonia temperature-programmed desorption (NH3-TPD) experiment was performed to measure the acidity of the support and catalyst samples using an Auto-Chem II 2910 chemisorption analyser (Micromeritics, Norcross, GA, USA). Samples of 0.1 g of each catalyst were loaded in a U-type quartz sample tube. The analysis gas used was 10% NH3/He. First, samples were pre-treated at 500 °C for 1 h under a He stream (30 mL/min). This was followed by saturation with NH3 at 120 °C. A thermal conductivity detector provided quantitative measurements of NH3 desorption in the temperature range of 100–900 °C, and a ramp rate of 10 °C/min.
Scanning electron microscopy (SEM) imaging was carried out using a FEI Quanta 250 field emission gun scanning electron microscope (ThermoFisher Scientific, Waltham, MA, USA), operating at an accelerating voltage of 15 kV. Energy-dispersive X-ray spectroscopy (EDS) line analysis was carried out using the Oxford Inca software. Line point samples were taken at an equidistance of 40 µm. All samples were coated with carbon using a magnetron sputtering, to allow conduction between the sample and a beam of electrons from the SEM-EDS instrumentation. The samples were then embedded in resin (conditions: 121 °C, 290 bar, 20 min), using a PR-10 Mounting Press (Leco, MI, USA). After mounting, the samples were cut to expose the pellets’ cross-sectional area, as indicated in Figure 13.
Powder X-ray diffraction (XRD) analysis was performed using a D8-Advance all-purpose X-ray diffractometer (Bruker, Karlsruhe, Germany), operated in a locked coupled mode, with Cu-Kα radiation (λ = 1.5406 Å) at 40 kV tube voltage and 40 mA tube current. The measurements were within the range 2θ (0–90°) and a position-sensitive Lynx-Eye detector was used. Diffraction data were recorded at a speed of 0.5 s/step, which is equivalent to 92 s/step for a scintillation counter.

3.3.2. Analysis of LOHC Molecule

Analysis of the LOHC molecule was performed using gas chromatography coupled to a single quadrupole mass spectrometer system (GC-SQ-MS) (Scion, Goes, The Netherlands). The system was equipped with a CP-8400 autosampler, a GS-Tek GsBP-50 + MS column (length 30 m, internal diameter 0.25 mm, film thickness 0.25 μm) and a single quadrupole mass spectrometer. Helium of 99.999% purity was used as a carrier gas. To perform liquid analyses, samples of the reaction mixture were drawn from the reactor and diluted with hexane (1:100 wt./wt.), and 1 μL aliquots of each sample were injected, at a split ratio of 1:100.

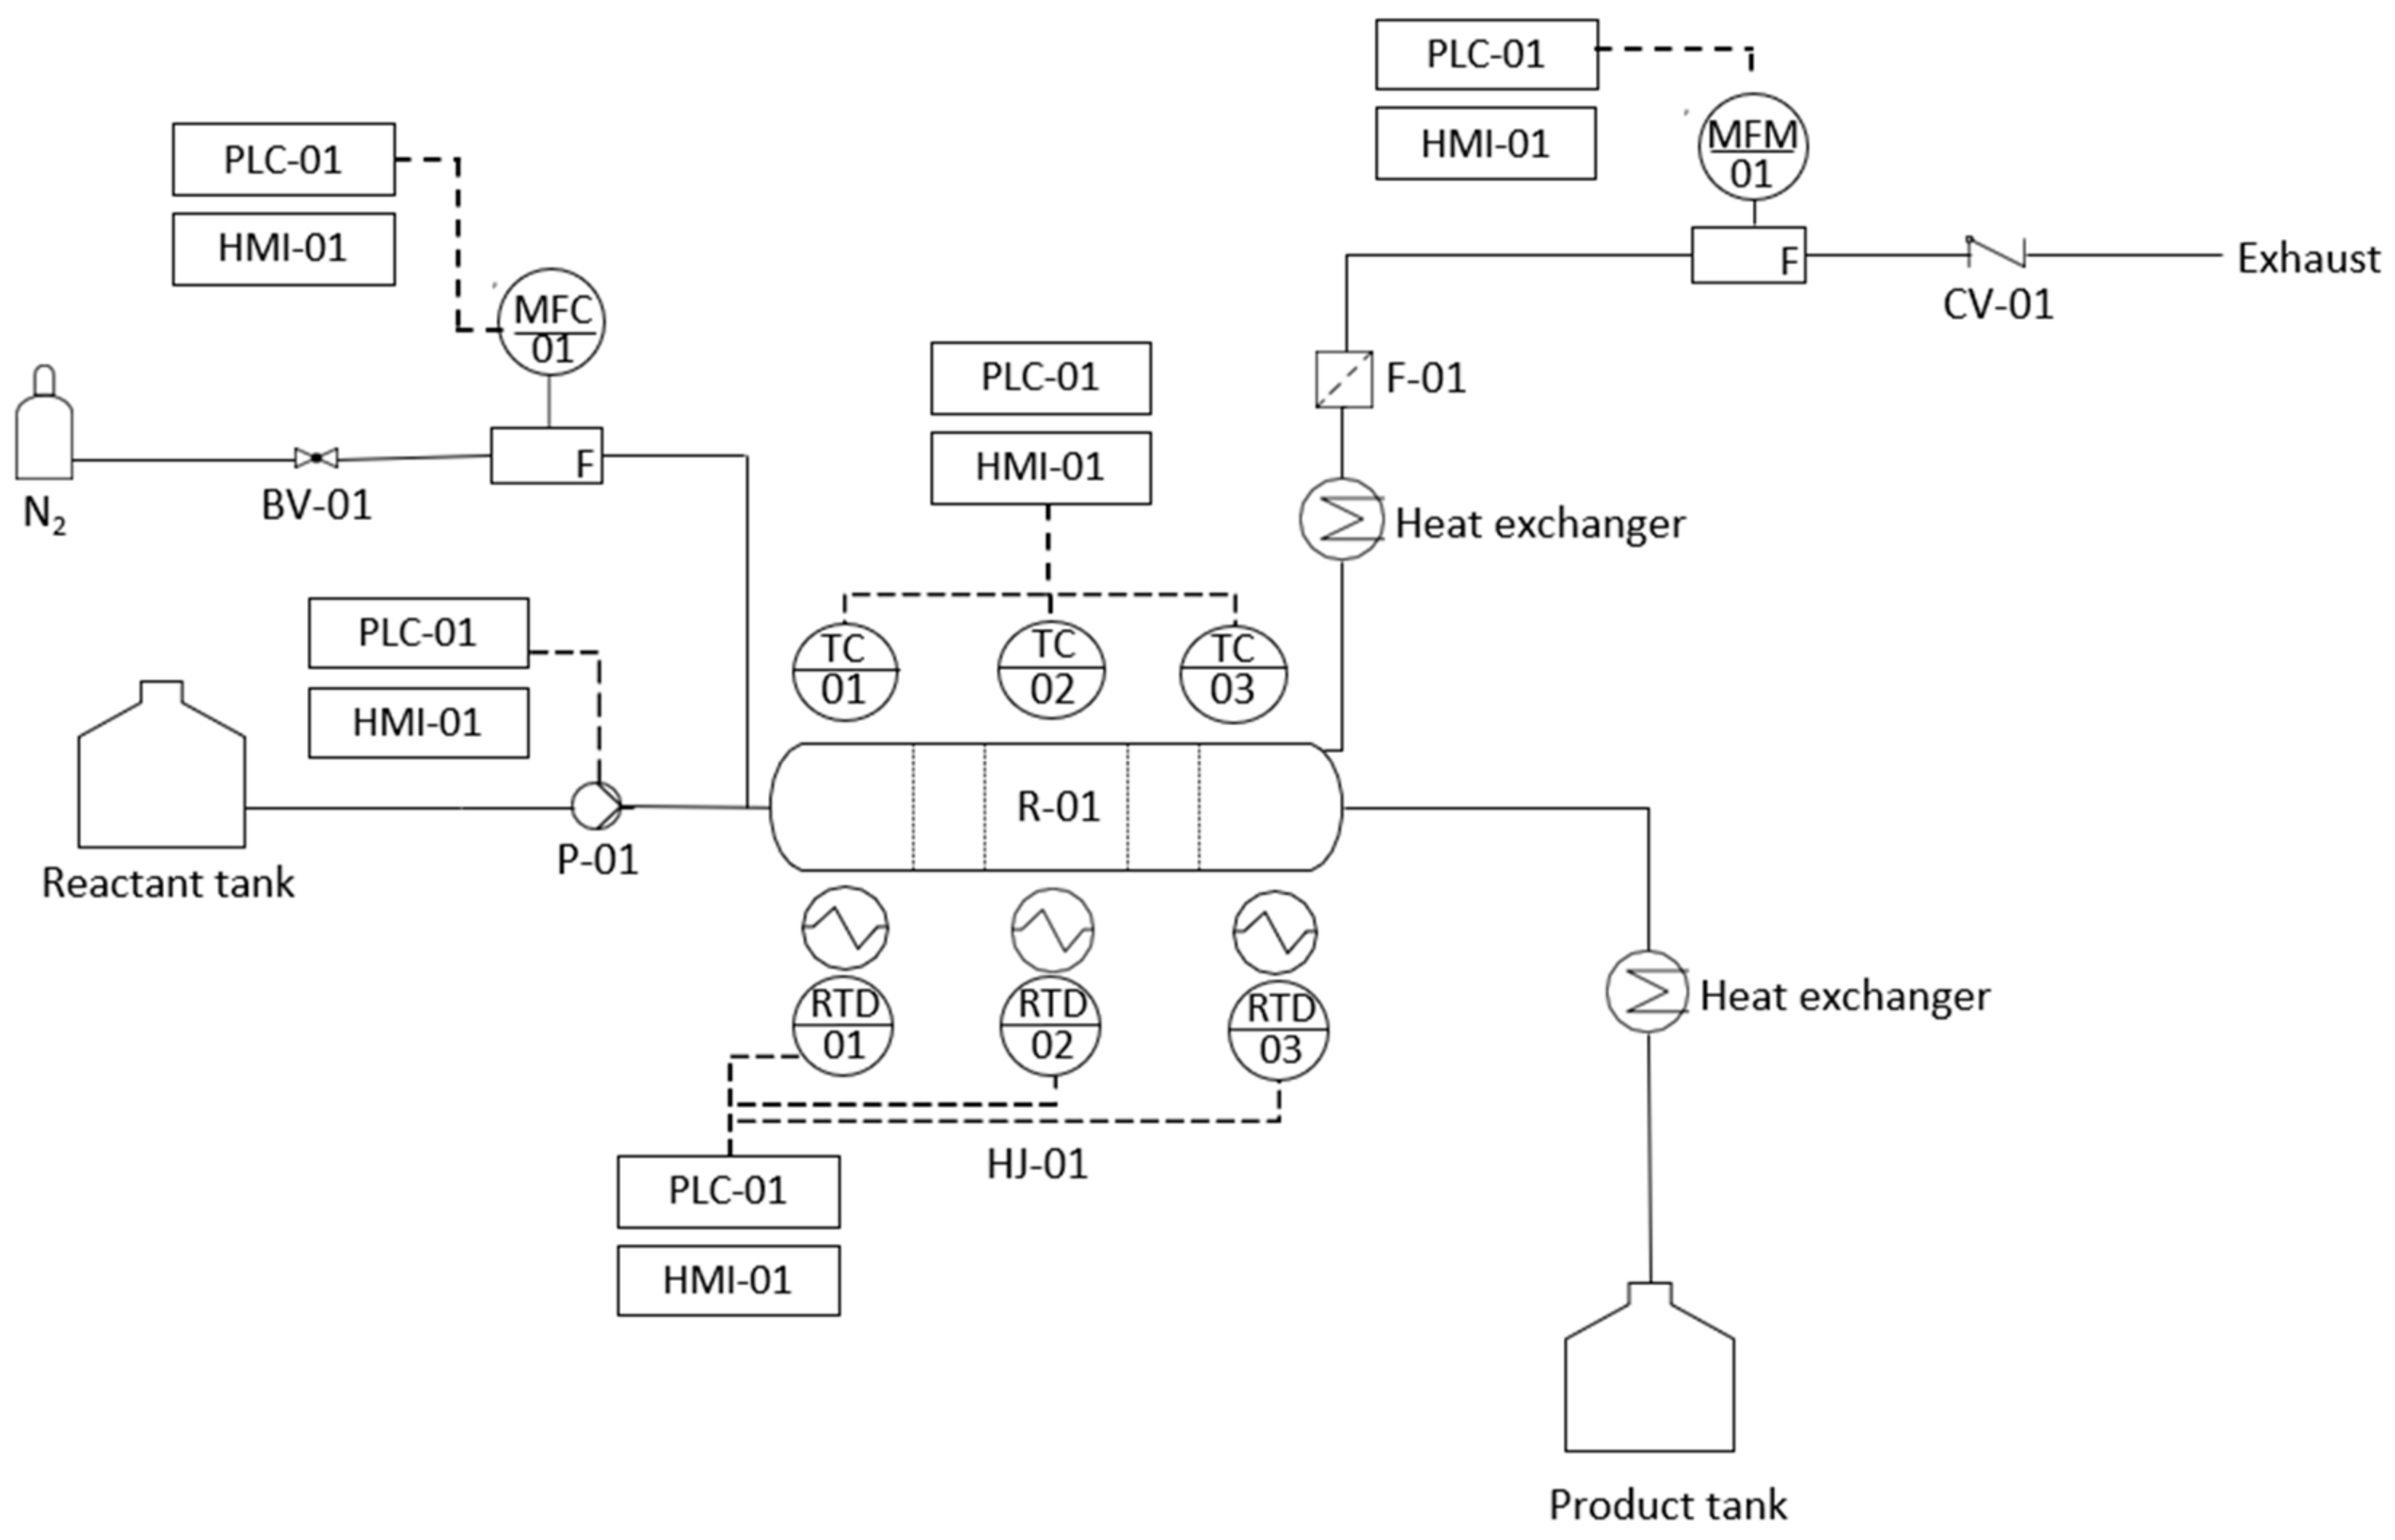
3.4. Dehydrogenation Activity Tests

Dehydrogenation of H18-DBT was performed using a system comprising of a horizontally oriented plug flow reactor made of quartz glass, see Figure 14. Prior to dehydrogenation experiments, the system is purged with nitrogen to remove air. Hydrogen-rich molecule (H18-DBT, >99% doh) is pumped into the reactor using a peristaltic pump (Medorex TL/150). The reactor is divided into three zones: (i) pre-heating zone packed with inert particles, (ii) reaction zone packed catalyst pellets and (iii) cooling zone packed with inert particles. An electrical heating jacket with three heating zones was used to supply heat and a thermocouple with the corresponding measurement points was centred horizontally through the reactor. During dehydrogenation reaction, the spent LOHC molecule from the reactor is cooled before reaching the product tank. Furthermore, the spent LOHC required for analysis is sampled before the product tank. Hydrogen gas passes through a cooling condenser and a carbon filter prior flow measurement by a mass flow meter (EL-Flow F11B-500-AGD-22V, Bronkhorst; flow range 0.16 to 3.5 nL/min; accuracy ± 0.5% Reading. This dehydrogenation system is controlled by Siemens PLC and for all experiments, a constant feed flow (1.3 mL/min) and reaction temperature (300 °C) were used.
The catalyst productivity (P), H2-yield, conversion (X) and selectivity (S) are calculated using the following equations:
P = mH2/mpt.t
H2-yield = [VH2 released/VH2 max] × 100
XH18-DBT = [mol H18-DBT (in) − mol H18-DBT (out))/(mol H18-DBT (in))] × 100
SH0-DBT = [(mol H0-DBT)/(mol H0-DBT + mol H12-DBT + mol H6-DBT + mol by-products)] × 100
where mH2 is the mass of released hydrogen, mpt is mass of platinum, t is time in minutes, VH2 released is the volume of hydrogen released and VH2 max is the theoretical maximum amount of hydrogen stored in H18-DBT.

4. Conclusions

The addition of Mg and Zn dopants strengthened metal–support interaction, decreased Pt particle size and dispersion and changed the acidity of supports. Pt/Mg-Al2O3 showed improved catalytic performance when compared to Pt/Zn-Al2O3 and Pt/Al2O3 catalysts, and the higher the reaction activity, the higher the amounts of by-products. This is because the higher the catalytic activity, the more aromatic molecules are produced, and these aromatic molecules are susceptible to the acid sites of the support, which provides the cracking function. Furthermore, the formation of by-products could be facilitated by the hydrogenolytic effect of Pt/Mg-Al2O3. The improved activity of Pt/Mg-Al2O3 can be attributed to the fact that Mg improves reduction of Pt-oxide and this has led to higher metallic Pt concentration (active sites) on Pt/Mg-Al2O3 than that on Pt/Al2O3 and Pt/Zn-Al2O3. The Al2O3 grain size could be densified by Mg addition, and the larger the grain size, the larger the pores. This has an effect on minimizing the pore diffusion limitation and increasing the catalytic activity.

Author Contributions

Conceptualisation, J.V. and P.v.H.; Data curation, R.G.; Formal analysis, P.M.; Funding acquisition, J.V., P.v.H. and D.B.; Resources, I.S.; Supervision, D.B.; Writing—original draft, R.G.; Writing—review and editing, P.M. All authors have read and agreed to the published version of the manuscript.

Funding

Financial support from Sasol and Department of Science and Innovation (DSI) through KP5 Program, as well as NRF (grant no. 104687 and 119004) is gratefully acknowledged.

Data Availability Statement

The data supporting the findings of this study are available within the article.

Acknowledgments

We express special gratitude to Lia Van Zyl of Sasol South Africa for providing necessary logistics.

Conflicts of Interest

There are no conflict of interest to declare.

References

  1. Modisha, P.M.; Ouma, C.N.; Garidzirai, R.; Wasserscheid, P.; Bessarabov, D. The prospect of hydrogen storage using liquid organic hydrogen carriers. Energy Fuels 2019, 33, 2778–2796. [Google Scholar] [CrossRef]
  2. Modisha, P.; Gqogqa, P.; Garidzirai, R.; Ouma, C.N.M.; Bessarabov, D. Evaluation of catalyst activity for release of hydrogen from liquid organic hydrogen carriers. Int. J. Hydrogen Energy 2019, 44, 21926–21935. [Google Scholar] [CrossRef]
  3. Bessarabov, D.; Human, G.; Kruger, A.J.; Chiuta, S.; Modisha, P.M.; Du Preez, S.P.; Oelofse, S.P.; Vincent, I.; Van Der Merwe, J.; Langmi, H.W.; et al. South African hydrogen infrastructure (HySA infrastructure) for fuel cells and energy storage: Overview of a projects portfolio. Int. J. Hydrogen Energy 2017, 42, 13568–13588. [Google Scholar] [CrossRef]
  4. Ouma, C.N.; Modisha, P.; Bessarabov, D. Insight into the adsorption of a liquid organic hydrogen carrier, perhydro-i-dibenzyltoluene (i = m, o, p), on Pt, Pd and PtPd planar surfaces. RSC Adv. 2018, 8, 31895–31904. [Google Scholar] [CrossRef] [Green Version]
  5. Amende, M.; Kaftan, A.; Bachmann, P.; Brehmer, R.; Preuster, P.; Koch, M.; Wasserscheid, P.; Libuda, J. Regeneration of LOHC dehydrogenation catalysts: In-situ IR spectroscopy on single crystals, model catalysts, and real catalysts from UHV to near ambient pressure. Appl. Surf. Sci. 2016, 360, 671–683. [Google Scholar] [CrossRef]
  6. Ballarini, A.; Basile, F.; Benito, P.; Bersani, I.; Fornasari, G.; de Miguel, S.; Maina, S.C.P.; Vilella, J.; Vaccari, A.; Scelza, O.A. Platinum supported on alkaline and alkaline earth metal-doped alumina as catalysts for dry reforming and partial oxidation of methane. Appl. Catal. A Gen. 2012, 433–434, 1–11. [Google Scholar] [CrossRef]
  7. Yu, C.; Xu, H.; Ge, Q.; Li, W. Properties of the metallic phase of zinc-doped platinum catalysts for propane dehydrogenation. J. Mol. Catal. A Chem. 2007, 266, 80–87. [Google Scholar] [CrossRef]
  8. Buitrago-Sierra, R.; Ruiz-Martínez, J.; Serrano-Ruiz, J.C.; Rodríguez-Reinoso, F.; Sepúlveda-Escribano, A. Ethanol steam reforming on Ni/Al2O3 catalysts: Effect of addition of Zn and Pt. J. Colloid Interface Sci. 2012, 383, 148–154. [Google Scholar] [CrossRef]
  9. Zhang, Y.; Zhou, Y.; Huang Li Zhou, S.; Sheng, X.; Wang, Q.; Zhang, C. Structure and catalytic properties of the Zn-modified ZSM-5 supported platinum catalyst for propane dehydrogenation. Chem. Eng. J. 2015, 270, 352–361. [Google Scholar] [CrossRef]
  10. Belskaya, O.B.; Stepanova, L.N.; Gulyaeva, T.I.; Erenburg, S.B.; Trubina, S.V.; Kvashnina, K.; Nizovskii, A.I.; Kalinkin, A.V.; Zaikovskii, V.I.; Bukhtiyarov, V.I.; et al. Zinc influence on the formation and properties of Pt/Mg(Zn)AlOx catalysts synthesised from layered hydroxides. J. Catal. 2016, 341, 13–23. [Google Scholar] [CrossRef]
  11. Berry, A.K.; Harmer, M.P. Effect of MgO solute on microstructure development in Al2O3. J. Am. Ceram. Soc. 1986, 69, 143–149. [Google Scholar] [CrossRef]
  12. Clavenna, L.R.; Davis, S.M.; Fiato, R.A.; Say, G.R. Structurally Modified Alumina Supports, and Heat Transfer Solids for High Temperature Fluidized Bed Reactions. U.S. Patent 5,395,406, 7 March 1995. Available online: https://patents.google.com/patent/US5395406A/en (accessed on 17 January 2021).
  13. Zhou, Y.; Davis, S.M. Dehydrogenation Catalysts and Process for Preparing the Catalysts. U.S. Patent 5,219,816, 15 June 1993. Available online: https://patents.google.com/patent/US5219816A/en (accessed on 17 January 2021).
  14. Biniwale, R.B.; Pande, J.V.; Shukla, A. Process for the Storage Delivery of Hydrogen Using Catalyst. U.S. Patent 9,005,571, 14 April 2015. Available online: https://patents.google.com/patent/US9005571B2/en (accessed on 17 January 2021).
  15. Martins, A.R.; Santos, L.; Patrício, C.; Javier, R.; Grau, M.; do Carmo Rangel, M. Hydrogen production on alumina-supported platinum catalysts. J. Mol. Catal. A Chem. 2017, 429, 1–9. [Google Scholar] [CrossRef]
  16. Escobar, J.; Barrera, M.C.; Santes, V.; Terrazas, J.E. Naphthalene hydrogenation over Mg-doped Pt/Al2O3. Catal. Today 2017, 296, 197–204. [Google Scholar] [CrossRef]
  17. Kumar, M.; Aberuagba, F.; Gupta, J.K.; Rawat, K.S.; Sharma, L.D.; Dhar, G.M. Temperature-programmed reduction and acidic properties of molybdenum supported on MgO-Al2O3 and their correlation with catalytic activity. J. Mol. Catal. A Chem. 2004, 213, 217–223. [Google Scholar] [CrossRef]
  18. Zhang, Y.; Zhou, Y.; Wan, L.; Xue, M.; Duan, Y.; Liu, X. Effect of magnesium addition on catalytic performance of PtSnK/γ-Al2O3 catalyst for iso-butane dehydrogenation. Fuel Process. Technol. 2011, 92, 1632–1638. [Google Scholar] [CrossRef]
  19. Arnby, K.; Törncrona, A.; Skoglundh, M. Influence of ammonia on CO and methanol oxidation over Pt/γ-Al2O3 catalysts modified by Mg. Appl. Catal. B Environ. 2004, 49, 51–59. [Google Scholar] [CrossRef]
  20. Zhan, Y.Y.; Liang, K.A.; Zhou, Y.C.; Cai, G.H.; Chen, C.Q.; Jiang, L.L. Pd/Al2O3 catalysts modified with Mg for catalytic combustion of methane: Effect of Mg/Al mole ratios on the supports and active PdOx formation. J. Fuel Chem. Technol. 2019, 47, 1235–1244. [Google Scholar] [CrossRef]
  21. Auer, F.; Blaumeiser, D.; Bauer, T.; Bösmann, A.; Szesni, N.; Libuda, J.; Wasserscheid, P. Boosting the activity of hydrogen release from liquid organic hydrogen carrier systems by sulfur-additives to Pt on alumina catalysts. Catal. Sci. Technol. 2019, 9, 3537–3547. [Google Scholar] [CrossRef]
  22. Bai, L.; Zhou, Y.; Zhang, Y.; Liu, H.; Sheng, X. Effect of magnesium addition to PtSnNa/ZSM-5 on the catalytic properties in the dehydrogenation of propane. Ind. Eng. Chem. Res. 2009, 48, 9885–9891. [Google Scholar] [CrossRef]
  23. Shi, J.; Zhou, Y.; Zhang, Y.; Zhou, S.; Zhang, Z.; Kong, J.; Guo, M. Synthesis of magnesium-modified mesoporous Al2O3 with enhanced catalytic performance for propane dehydrogenation. J. Mater. Sci. 2014, 49, 5772–5781. [Google Scholar] [CrossRef]
  24. Xue, M.W.; Zhou, Y.M.; Zhang, Y.W.; Huang, L.; Duan, Y.Z. Effects of Mg addition on catalytic performance of PtNa/Sn-ZSM-5 in propane dehydrogenation. Acta Phys. Chim. Sin. 2012, 28, 928–934. [Google Scholar]
  25. Posner, G.H. Organic Reactions at Alumina Surfaces. Angew. Chem. Int. Ed. Engl. 1978, 17, 487–496. [Google Scholar] [CrossRef]
  26. Modisha, P.M.; Jordaan, J.H.; Bösmann, A.; Wasserscheid, P.; Bessarabov, D. Analysis of reaction mixtures of perhydro-dibenzyltoluene using two-dimensional gas chromatography and single quadrupole gas chromatography. Int. J. Hydrogen Energy 2018, 43, 5620–5636. [Google Scholar] [CrossRef]
  27. Bocanegra, S.A.; Guerrero-Ruiz, A.; de Miguel, S.R.; Scelza, O.A. Performance of PtSn catalysts supported on MAl2O4 (M: Mg or Zn) in n-butane dehydrogenation: Characterisation of the metallic phase. Appl. Catal. A Gen. 2004, 277, 11–22. [Google Scholar] [CrossRef]
  28. Park, J.E.; Kim, B.B.; Park, E.D. Propane combustion over Pt/Al2O3 catalysts with different crystalline structures of alumina. Korean J. Chem. Eng. 2015, 32, 2212–2219. [Google Scholar] [CrossRef]
  29. Aguilar-Ríos, G.; Valenzuela, M.; Salas, P.; Armendáriz, H.; Bosch, P.; Del Toro, G.; Silva, R.; Bertín, V.; Castillo, S.; Ramírez-Solís, A.; et al. Hydrogen interactions and catalytic properties of platinum–tin supported on zinc aluminate. Appl. Catal. A Gen. 1995, 127, 65–75. [Google Scholar] [CrossRef]
  30. Bensaddik, A.; Mouaddib, N.; Pitchon, V.; Garin, F.; Maire, G.; Krawczyk, M. Promoting effect of zinc in DeNOx reaction over Pt/AI2O3. Catalysis and Automotive Pollution Control IV. Stud. Surf. Sci. Catal. 1998, 116, 265–274. [Google Scholar] [CrossRef]
  31. Consonni, M.; Jokic, D.; Murzin, Y.D.; Touroude, R. High performances of Pt/ZnO catalysts in selective hydrogenation of crotonaldehyde. J. Catal. 1999, 188, 165–175. [Google Scholar] [CrossRef]
  32. Berteau, P.; Delmon, B. Modified aluminas: Relationship between activity in 1-butanol dehydration and acidity measured by NH3-TPD. Catal. Today 1989, 5, 121–137. [Google Scholar] [CrossRef]
  33. Gutiérrez-Alejandrea, A.; González-Cruza, M.; Trombettab, M.; Buscab, G.; Ramíreza, J. Characterisation of alumina-titania mixed oxide supports: Part II: Al2O3-based supports. Microporous Mesoporous Mater. 1998, 23, 265–275. [Google Scholar] [CrossRef]
  34. Shi, Y.; Li, X.; Rong, X.; Gu, B.; Wei, H.; Sun, C. Influence of support on catalytic properties of Pt-Sn-K/θ-Al2O3 for propane dehydrogenation. RSC Adv. 2017, 7, 19841–19848. [Google Scholar] [CrossRef] [Green Version]
  35. Stanislaus, A.; Absi-Halabi, M.; Al-Doloma, K. Effect of phosphorous on the acidity of γ-alumina and on the thermal stability of γ-alumina supported nickel-molybdenum hydrotreating catalysts. Appl. Catal. A Gen. 1988, 39, 239–253. [Google Scholar] [CrossRef]
  36. Laniecki, M.; Małecka-Grycz, M.; Domka, F. Water–gas shift reaction over sulfided molybdenum catalysts: I. Alumina, titania and zirconia-supported catalysts. Appl. Catal. A Gen. 2000, 196, 293–303. [Google Scholar] [CrossRef]
  37. Karnjanakom, S.; Bayu, A.; Hao, X.; Kongparakul, S.; Samart, C.; Abudula, A.; Guan, G. Selectively catalytic upgrading of bio-oil to aromatic hydrocarbons over Zn, Ce or Ni-doped mesoporous rod-like alumina catalysts. J. Mol. Catal. A Chem. 2016, 421, 235–244. [Google Scholar] [CrossRef]
  38. Miyazawa, K.; Yoshitake, M.; Tanaka, Y. HRTEM analyses of the platinum nano-particles prepared on graphite particles using coaxial arc plasma deposition. J. Nanopart. Res. 2017, 19, 191–199. [Google Scholar] [CrossRef]
  39. Kirilin, A.V.; Hasse, B.; Tokarev, A.V.; Kustov, L.M.; Baeva, G.N.; Bragina, G.O.; Stakheev, A.Y.; Rautio, A.R.; Salmi, T.; Etzold, B.J.; et al. Aqueous-phase reforming of xylitol over Pt/C and Pt/TiC-CDC catalysts: Catalyst characterization and catalytic performance. Catal. Sci. Technol. 2014, 4, 387–401. [Google Scholar] [CrossRef] [Green Version]
  40. Zhang, H.; Wan, H.; Zhao, Y.; Wang, W. Effect of chlorine elimination from Pt-Sn catalyst on the behavior of hydrocarbon reconstruction in propane dehydrogenation. Catal. Today 2019, 330, 85–91. [Google Scholar] [CrossRef]
  41. Bai, Q.; Li, D.; He, L.; Xiao, H.; Sui, N.; Liu, M. Solvent-free selective hydrogenation of o-chloronitrobenzene to o-chloroaniline over alumina supported Pt nano-particles. Prog. Nat. Sci. Mater. Int. 2015, 25, 179–184. [Google Scholar] [CrossRef] [Green Version]
Scheme 1. The reaction pathway for dehydrogenation of perhydrodibenzyltoluene (H18-DBT).
Catalysts 11 00490 sch001
Figure 1. Hydrogen flow rate vs. time-on-stream for dehydrogenation of H18-DBT over 22 h. Reaction parameters: Pt loading 0.5 wt.%, H18-DBT degree of hydrogenation (doh) 99.6%, reaction temperature 300 °C, feed flow 1.3 mL/min, catalyst mass 110 g, weight hourly space velocity 0.61 h−1.
Catalysts 11 00490 g001
Figure 2. Catalyst productivity and hydrogen yield vs. time-on-stream for dehydrogenation of H18-DBT over 22 h. Reaction parameters: Pt loading 0.5 wt.%, H18-DBT doh 99.6%, reaction temperature 300 °C, feed flow 1.3 mL/min, catalyst mass 110 g, weight hourly space velocity 0.61 h−1.
Catalysts 11 00490 g002
Figure 3. Conversion of H18-DBT vs. time-on-stream over 22 h of dehydrogenation. Reaction parameters: Pt loading 0.5 wt.%, H18-DBT doh 99.6%, reaction temperature 300 °C, feed flow 1.3 mL/min, catalyst mass 110 g, weight hourly space velocity 0.61 h−1.
Catalysts 11 00490 g003
Figure 4. Selectivity of the catalysts to H0-DBT, H6-DBT and H12 DBT over 22 h time-on-stream. Reaction parameters: Pt loading 0.5 wt.%, H18-DBT doh 99.6%, reaction temperature 300 °C, feed flow 1.3 mL/min, catalyst mass 110 g, weight hourly space velocity 0.61 h−1.
Catalysts 11 00490 g004
Figure 5. Amounts of by-products obtained over 22 h of catalyst time-on-stream. Reaction parameters: Pt loading 0.5 wt.%, H18-DBT doh 99.6%, reaction temperature 300 °C, feed flow 1.3 mL/min, catalyst mass 110 g, weight hourly space velocity 0.61 h−1.
Catalysts 11 00490 g005
Figure 6. Elemental line scan analysis showing Pt distribution at 40-micron equidistance.
Catalysts 11 00490 g006
Figure 7. Hydrogen temperature-programmed reduction (H2-TPR) profiles of the calcined catalysts.
Catalysts 11 00490 g007
Figure 8. NH3-TPD profiles of Al2O3 supports and Pt/Al2O3 catalysts.
Catalysts 11 00490 g008
Figure 9. (a). TEM images, nanoparticles’ size distribution histograms and FFT images of the Pt/Al2O3 catalyst. (b). TEM images, nanoparticles’ size distribution histograms and FFT images of the Pt/Mg-Al2O3 catalyst. (c). TEM images, nanoparticles’ size distribution histograms and FFT images of the Pt/Zn-Al2O3 catalyst.
Catalysts 11 00490 g009aCatalysts 11 00490 g009b
Figure 10. Platinum nanoparticles’ size distribution before and after dehydrogenation, experiments carried out at 300 °C for 22 h using a fixed bed reactor.
Catalysts 11 00490 g010
Figure 11. X-ray diffraction (XRD) patterns of catalysts and alumina supports.
Catalysts 11 00490 g011
Figure 12. The chromatograms of H18-DBT heated at 300 °C for 90 min with and without support, and a representative chromatogram and mass spectrometry (MS) spectra showing low boiling point by-products of Pt/Mg-Al2O3 catalyst. National Institute of Standards and Technology (NIST) 17 mass spectral library was used to identify the compounds.
Catalysts 11 00490 g012
Figure 13. Exposed cross-sectional areas of catalysts, for scanning electron microscopy-energy dispersive X-ray spectroscopy (SEM-EDS) line analysis.
Catalysts 11 00490 g013
Figure 14. Process flow diagram of the fixed-bed reactor dehydrogenation unit.
Catalysts 11 00490 g014
Table 1. Summary of catalysts’ performance for dehydrogenation of H18-DBT.
CatalystXiXfSiSfYiYfΔX
Pt/Al2O39790714572497.2
Pt/Mg-Al2O39993775780606.1
Pt/Zn-Al2O39689745173517.3
Xi and Xf = initial and final conversion (%), Si and Sf = initial and final selectivity (%), Yi and Yf = initial and final yield (%), ΔX = deactivation parameter (%).
Table 2. Metal loadings and elemental composition of the catalysts determined using inductively coupled plasma-optical emission spectrometry (ICP-OES).
CatalystTarget Pt Loading (wt.%)Actual Loading (wt.%)
PtMgZn
Pt/Al2O30.50.48 --
Pt/Mg-Al2O30.50.49 3.89-
Pt/Zn-Al2O30.50.48 -3.44
Table 3. TPR and CO pulse chemisorption of the catalysts.
CatalystPt Dispersion, %Active Particle Diameter, nm Metallic Surface Area, m2/g sampleH2 Consumption, µmol/g
Pt/Al2O3383.00.4734
Pt/Mg-Al2O3343.30.4264
Pt/Zn-Al2O3235.00.2855
Table 4. The acidity of supports and catalysts, determined by NH3-TPD.
Catalyst/SupportTemperature, °CTotal Acidity, mmol NH3/gcatPeak Fraction
ABAB
Al2O32515620.630.450.55
Mg-Al2O32145970.400.430.57
Zn-Al2O32526590.680.440.56
Pt/Al2O32365660.480.520.48
Pt/Mg-Al2O32025650.410.560.44
Pt/Zn-Al2O32505750.490.600.40
A = first peak, B = second peak.
Table 5. d-Spacing values from fast Fourier transform (FFT) measurements and Joint Committee on Powder Diffraction Standards (JCPDS).
hklMeasured d-Value, ÅJCPDS d-Value, ÅError, %
1112.122.266
2002.111.968
2.075.6
Table 6. Log-normal distribution parameters for mean and mode calculations of Pt nanoparticles obtained by transmission electron microscopy (TEM) before and after 22 h dehydrogenation reaction.
CatalystµσMeanMode
Before reaction
Pt/Al2O30.500.301.721.51
Pt/Mg-Al2O30.520.181.701.62
Pt/Zn-Al2O30.410.211.541.44
After 22 h dehydrogenation
Pt/Al2O31.000.242.802.57
Pt/Mg-Al2O30.730.252.141.93
Pt/Zn-Al2O3----
Publisher’s Note: MDPI stays neutral with regard to jurisdictional claims in published maps and institutional affiliations.

