Article

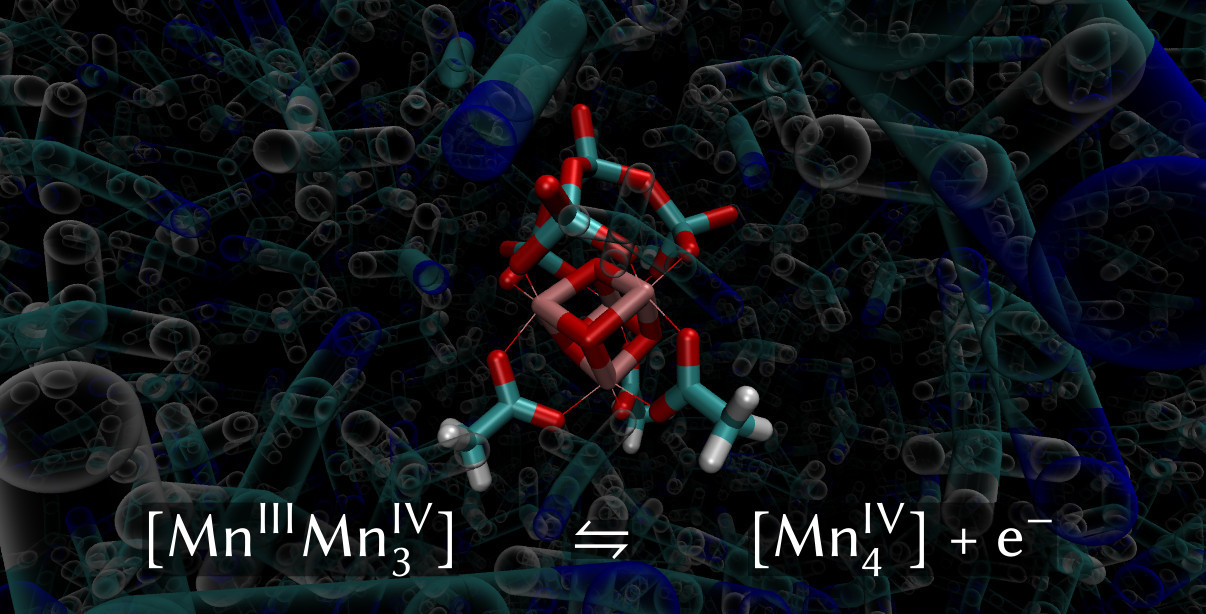
A Force Field for a Manganese-Vanadium Water Oxidation Catalyst: Redox Potentials in Solution as Showcase

by
Gustavo Cárdenas
1,†,
Philipp Marquetand
1,2,
Sebastian Mai
1,* and
Leticia González
1,2
1
Institute of Theoretical Chemistry, Faculty of Chemistry, University of Vienna, Währinger Straße 17, 1090 Vienna, Austria
2
Vienna Research Platform on Accelerating Photoreaction Discovery, University of Vienna, Währinger Str. 17, 1090 Wien, Austria
*
Author to whom correspondence should be addressed.
Current address: Chemistry Department, Universidad Autónoma de Madrid, Calle Francisco Tomás y Valiente, 7, 28049 Madrid, Spain.
Submission received: 16 March 2021 / Revised: 6 April 2021 / Accepted: 8 April 2021 / Published: 13 April 2021

Abstract

:
We present a molecular mechanics force field in AMBER format for the mixed-valence manganese vanadium oxide cluster [Mn 4 V 4 O 17 (OAc) 3 ] 3 —a synthetic analogue of the oxygen-evolving complex that catalyzes the water oxidation reaction in photosystem II—with parameter sets for two different oxidation states. Most force field parameters involving metal atoms have been newly parametrized and the harmonic terms refined using hybrid quantum mechanics/molecular mechanics reference simulations, although some parameters were adapted from pre-existing force fields of vanadate cages and manganese oxo dimers. The characteristic Jahn–Teller distortions of d 4 Mn III ions in octahedral environments are recovered by the force field. As an application, the developed parameters have been used to calculate the redox potential of the [Mn III Mn 3 IV ] ⇌ [Mn 4 IV ]+e half-reaction in acetonitrile by means of Marcus theory.

Graphical Abstract

1. Introduction

There is a large consensus among scientists that global warming threatens life on Earth as we know it [1]. To lower CO 2 emissions that contribute to global warming, fossil fuels need to be replaced by sustainable energy sources such as sunlight [2]. Artificial photosynthesis—photochemically driven water splitting [3]—is emerging as a promising and clean technology to convert sunlight into a storable energy form. Devices for this task consist of several components, where the water oxidation catalyst is among the most critical ones [4,5,6,7,8,9].
In natural photosynthesis, the oxidation of water oxygen is enabled by a metalloenzyme [8], called the oxygen-evolving complex (OEC). The active center of the OEC contains an oxo-manganese, cubane-like structure with a Ca 2 + ion occupying one of the vertices. Due to the extremely high efficiency displayed by this catalyst (with a turn-over number of about 600,000 and a turn-over frequency of 30–90 s 1 according to the literature [10,11]), there have been major efforts in attempting to understand the mechanism of the overall water oxidation catalytic cycle, including the nature of the intermediates that participate in that mechanism [12,13,14,15,16].
The outstanding efficiency of the natural OEC makes it an appealing model for the development of analogous artificial water oxidation catalysts (WOCs). Based on this idea, several synthetic WOCs based on metal oxide clusters—polyoxometalates (POMs)—have shown promising catalytic activities towards the water oxidation reaction [5,6,7,8,10]. In these POM-based WOCs, typical transition metal complexes are either rare transition metals like Ru or Ir [5], or earth-abundant metals like W, Mo, Ni, Co, Fe, or Mn [7].
One very interesting synthetic WOC is the mixed valence manganese vanadium oxide cluster [Mn 4 V 4 O 17 (OAc) 3 ] 3 (“MnV WOC” in the following) that was reported in 2016 [17]. It was shown to catalyze water oxidation in acetonitrile in combination with a photosensitizer in a reasonably fast (turn-over frequency of 1.75 s 1 ) and stable (turn-over number of about 1150) manner. In order to further stabilize the MnV WOC and to control its interaction with the photosensitizer, it was suggested to embed the MnV WOC within a tailor-made block copolymer matrix [18,19].
Computational modeling of the reaction mechanism and other processes of the MnV WOC in such a complex heterogeneous medium is a challenging task. Unlike many computational studies on POM catalysts [20,21] that perform stationary calculations in the gas phase or using implicit continuum solvation models [22,23], such a complex environment requires proper sampling of the molecule’s phase space through molecular dynamics methods and over rather long time scales. For this, one essential ingredient is a set of force field (FF) parameters for the manganese-vanadium WOC, to be used with standard molecular modeling packages like AMBER [24]. The goal of the present manuscript is to report such an FF for the MnV WOC with FF parameter sets for its two oxidation states [Mn III Mn 3 IV ] and [Mn 4 IV ]. We also validate the FF parameters by computing the reduction potential for the [Mn III Mn 3 IV ] ⇌ [Mn 4 IV ]+e half-reaction by means of Marcus theory.

2. Theory

This section documents the main working equations used in the parametrization of the FF for the MnV WOC and for the computation of the reduction potential.

2.1. Force Field Parameters

The general FF form implemented in the AMBER [24] package consists of a sum of harmonic potentials for bond stretching and angle bending, plus a truncated Fourier series for describing dihedral torsions, and the nonbonded Lennard–Jones and pairwise electrostatic potential functions, as described by the following equation [24]:
V AMBER = i n bonds K r , i ( r i r i , eq ) 2 + i n angles K α , i ( α i α i , eq ) 2 + i n dihedrals V i 1 + cos ( n i ϕ i γ i ) + i < j n atoms ε i ε j r i , min + r j , min 2 r i j 12 2 r i , min + r j , min 2 r i j 6 + i < j n atoms q i q j 4 π ε 0 r i j .
This expression is explained in more detail in Section S1 in the Supporting Information (SI).
In the present work, the initial guesses for the harmonic bond and angle parameters ( r i , eq , K r , i , α i , eq , K α , i ) were obtained by using data from quantum mechanics/molecular mechanics (QM/MM) reference trajectories (see Section 3.2), and fitting each of the bond and angle distributions obtained to a Boltzmann distribution of the form:
ρ i = N exp E i k B T ,
where N is a normalization constant, k B is the Boltzmann constant, and T is the temperature. The energy E i can be represented with the harmonic oscillator expression
E i = K i ( X i X i , eq ) 2 .
Here, X i , eq indicates either the bond or the angle equilibrium value ( r i , eq , α i , eq ), depending on the considered parameter. Within this framework, each bond (angle) distribution is, in practice, fitted to a Gaussian curve, so that the equilibrium bond (angle) would correspond to the average of the distribution and the force constant K i would be associated with its width (i.e., the standard deviation σ ) as
K i = k B T σ 2 .
We note that this approach neglects a factor arising from the Jacobian of the Cartesian-to-internal coordinate transformation, see, for example, Ref. [25]. However, as we use Equations (2)–(4) only to obtain the initial parameter set (before refinement), omission of this factor does not affect the accuracy of our final parameters.

2.2. Redox Potentials

In the present work, we focus on the [Mn III Mn 3 IV ]/[Mn 4 IV ] redox couple, whose oxidation process is given by
[ Mn III Mn 3 IV ] [ Mn 4 IV ] + e ,
which can be schematically represented as
R O + e ,
in which R and O represent the reduced ([Mn III Mn 3 IV ]) and the oxidized ([Mn 4 IV ]) states, respectively. In general, the redox potential of the reaction shown in Equation (6) is determined from the Gibbs free energy of reaction Δ G R O as follows:
E R O = Δ G ref Δ G R O n F ,
where Δ G ref is the Gibbs free energy difference for the redox reaction in the reference electrode, n is the number of exchanged electrons, and F is the Faraday constant.
The approach adopted in the present work for calculating Δ G R O is based on the methodology first proposed by Warshel [26,27] and applied to one-electron half-reactions of complex systems in the last few years (e.g., see Refs. [28,29,30]). The starting point is the following equation:
Δ G R O = Δ A R O + p Δ V R O ,
in which Δ A R O is the Helmholtz free energy of oxidation, p is the pressure, and V is the volume of the system. In the case in which the oxidation reaction is followed by small structural changes, the volume difference can be neglected, and therefore the Gibbs free energy Δ G R O (obtained at constant pressure) can be assumed to be equal to the Helmholtz free energy Δ A R O (obtained at constant volume). Although Δ A R O , in principle, depends on the canonical partition functions for the oxidized and the reduced states, it can be shown that Δ A R O can be calculated from the distribution of vertical energy gaps between the two states [27]:
Δ E R O ( { R N } ) = E O ( { R N } ) E R ( { R N } ) .
Here, { R N } is a geometry sampled from a given trajectory. Thus, depending on whether { R N } corresponds to a geometry of the reduced or of the oxidized species, Δ E R O ( { R N } ) indicates the ionization energy (IE) or the electron affinity (EA) correspondingly. With this expression for Δ E R O ( { R N } ) , Δ A R O is given by [31]:
Δ A R O = k B T ln e Δ E R O ( { R N } ) k B T R = + k B T ln e Δ E R O ( { R N } ) k B T O ,
where R indicates an average over all geometries sampled from the trajectory of the reduced state, and O is the analogue for the oxidized state. This expression can be further simplified by applying Marcus theory [32,33,34], in which it is assumed that the solvent responds linearly to a change in the solute. As a consequence, the distributions of the vertical energy gaps Δ E R O ( { R N } ) for both the reduced and the oxidized species—that is, the distributions of the IEs and the EAs, respectively—will be Gaussian functions, and their standard deviations will be the same. Hence, the Helmholtz free energy difference expression (Equation (10)) can be simplified as follows:
Δ A R O = 1 2 Δ E R O R + Δ E R O O .
Equation (11) is the working equation for the determination of the Gibbs free energy of oxidation in the present work. Δ E R O R and Δ E R O O are the average IE and the average EA, respectively.
Within the linear response regime, the reorganization energy λ from Marcus theory can also be computed from the average IE and EA [28,29,30]:
λ = 1 2 Δ E R O R Δ E R O O .
Additional estimates of the reorganization energy for R and O can be obtained directly from the standard deviations of the IE and EA distributions:
λ R / O = σ R / O 2 2 k B T ,
where σ R or σ O are the standard deviations of the distributions of vertical energy gaps for the R trajectory (IE distribution) or for the O trajectory (EA distribution). If the three estimates for the reorganization energy ( λ , λ R , λ O ) do not agree, this indicates a deviation from the Marcus regime. Using the “Q-model” developed by Matyushov and Voth [35,36], one can compute an error estimate for the free energy [30]:
δ Δ A corr = λ R ( λ R λ O ) ( 2 λ + λ O ) 2 ( 2 λ + λ R ) 2 .

3. Computational Details

In this section, we describe the details of the different steps performed. The first step consists of ab initio calculations to optimize the equilibrium geometries and extract partial charges. The second step is the construction of the system from solute, solvent, and counter ions, and to compute two hybrid QM/MM molecular dynamics (MD) trajectories as references to fit the FF parameters. The parameters were manually improved and iteratively based on the comparison between the QM/MM MD trajectory and MM MD trajectories generated with the current FF parameters. With the final set of parameters, the reduction potential was computed.

3.1. Reference Ab Initio Calculations

The geometries of [Mn III Mn 3 IV ] and [Mn 4 IV ] were optimized at the U-BP86 [37,38] level of theory (a high-spin configuration was adopted throughout), using the ZORA-def2-TZVP basis set for the description of the Mn, V, O atoms, and the ZORA-def2-SVP basis set for the C and H atoms [39,40]. The ZORA relativistic Hamiltonian [40,41,42] was used to account for scalar relativistic effects. Empirical dispersion correction effects were introduced through Grimme’s D3 correction [43]. Tight convergence criteria were used throughout the geometry optimizations. The Mulliken charges of the final converged calculation were used as the partial charges within the FF. These calculations were performed with the ORCA 4.0.1 [44,45] software.
The combination of U-BP86, ZORA, and D3 dispersion correction was previously shown to describe geometries of first-row transition metal complexes very well [14,46,47]. Furthermore, as a GGA functional, U-BP86 allows for very efficient calculations that are beneficial for the expensive QM/MM reference trajectories. We note that this level of theory is, in principle, not consistent with the electronic structure used for parametrizing the generalized AMBER force field (GAFF) [48] that we use for describing the solvent. However, the GAFF methodology—which uses Hartree–Fock and Møller-Plesset second-order perturbation theory—was never designed for complicated inorganic compounds like POMs, and in fact, preliminary Hartree–Fock calculations did not even converge for the MnV WOC. Hence, we believe that a description of this molecule through DFT will lead to more accurate FF parameters and also to more realistic solute–solvent interactions than an approach using Hartree–Fock or Møller-Plesset perturbation theory.

3.2. QM/MM MD Reference Simulations

In order to refine the FF parameters for [Mn III Mn 3 IV ] and [Mn 4 IV ], we first produced two QM/MM MD trajectories to serve as a reference. These simulations were performed by using the AMBER 17 [49] package for describing the nuclear motion, along with its interface with the Terachem [50,51] package for the electronic structure calculations. The total system consisted of the MnV WOC, one (two) Na + counterion(s) for the oxidized (reduced) species, and 2300 acetonitrile molecules in a periodic cubic box with a side length of about 58 Å. This solvent was chosen in order to mimic the experimental conditions [17] that employ dry acetonitrile as a solvent for the electrochemical measurements. Before the QM/MM simulations, the system was first minimized, heated to 300 K (NVT ensemble, Langevin thermostat), and equilibrated to a pressure of 1 bar (NPT ensemble, Berendsen barostat) over 120 ps using MM MD with the initial set of FF parameters (see below) and by imposing a force constant of 200 kcal mol 1 Å 2 on the MnV WOC. This equilibration was followed by a 5 ps QM/MM unconstrained equilibration and a production phase of another 5 ps, using the same conditions. From the last 5 ps, we extracted 100 equidistant snapshots to generate the distributions of bond lengths and angles for use with Equation (4) and as a reference for the refinement of the harmonic terms. A time step of 0.2 fs was used for classical MD runs, whereas a 0.5 fs time step was used for the QM/MM calculations.
In the QM/MM MD calculations, the QM region contained the [Mn III Mn 3 IV ] or [Mn 4 IV ] molecule (46 atoms) and was treated with the U-BP86 [37,38] level of theory. The Mn and V atoms were described by the LANL2DZ effective core potential basis set [52,53,54], whereas the C, H, and O atoms were described by the def2-SVP [39] basis set. The acetonitrile molecules and the counterions were described with GAFF [48] in the same way as in the classical MM MD simulations, see below. It was previously shown that GAFF describes this particular solvent very well [55,56]. In order to account for the electrostatic interactions between the QM nuclei and the MM point charges that enter the Hamiltonian, a cutoff of 10 Å was applied.

3.3. MM MD Simulations

The same setup of the system as the one described above for the QM/MM MD simulations has been used for the classical MM MD simulations. These simulations have been performed using the GPU accelerated version of the AMBER 17 [24] package, again using the GAFF force field [48] for the acetonitrile solvent molecules and the Na + counterions, and the newly parametrized FF for [Mn III Mn 3 IV ] or [Mn 4 IV ]. Minimization, heating, and equilibration were performed as described above. A 500 ps unconstrained equilibration was performed prior to the 10 ns production phase, from which 100 snapshots were sampled (every 100 ps) to compute bond lengths and angles, which were then compared to the QM/MM distributions for refining the FF parameters. A time step of 0.2 fs was used throughout. The 100 snapshots of the final MM MD trajectories were also used to compute Mulliken spin populations (to analyze the stability of the electronic wave function), using the same level of theory as used in the QM/MM MD trajectory.

3.4. Parameter Setup

The FF presented in this paper reuses a few atom types and parameters from GAFF [48] (although we do not follow the GAFF parametrization methodology because it is not designed for describing POMs), whereas the parameters involving Mn, V, and O atoms were specifically adapted to the MnV WOC. Here, we focus our attention on finding reasonable bond and angle parameters for the [Mn III Mn 3 IV ] and [Mn 4 IV ] molecules. As in these complexes, the bonds and angles involving the Mn atoms are strongly dependent on the electronic structure of the molecule (through the Jahn–Teller effect), we estimate that many of the provided parameters require careful reconsideration when adapting our FF parameters for similar POM molecules.
The following choices for the FF parameters were made in this work. (i) The partial charges q i for the MnV WOC were obtained as Mulliken charges from the ab initio calculations (Section 3.1). (ii) The Lennard–Jones parameters were taken from AMBER for Mn, O, C, H, and Na + [57,58], whereas the parameters for V were adapted from Ref. [59]. (iii) Dihedral terms do not play a large role due to the rigidness of the polyoxometalate structure and were adapted from the literature [59,60] or taken from GAFF for the acetate ligands.
Initial guesses for the bond and angle parameters (iv) of the molecule were either taken from the literature [59,60] or from the bond length/angle averages of the QM/MM MD trajectory. The force constants for bonds were computed from the QM/MM bond distributions and Equation (4). The angle force constants were kept at the initial values. With the full set of parameters (i–iv), an MM MD run was performed as described in Section 3.3, and the bond and angle distributions computed. From a comparison of the QM/MM MD and MM MD distributions, the bond and angle parameters were refined, and a new MM MD simulation was carried out. This procedure was repeated iteratively until the root-mean-square deviations (RMSDs) of the average bond lengths and angles (between MM MD and QM/MM MD) were below 0.02 Å or 2 degrees, respectively.
The final set of parameters is presented in Section S1 in the SI, and is also given in the Supplementary Materials in AMBER format. The absolute deviations of average bond lengths and angles between QM/MM MD trajectories and MM MD trajectories are presented in Section S2 in the SI.
We note that besides manual refinement of FF parameters, as carried out here, there are also a large number of automatic procedures available in the literature, for example, the Seminario method [61]. Although the prospect of automatic parametrization is promising, preliminary tests showed that the Seminario method cannot be easily applied to the MnV WOC with its complicated and uncommon connectivity. The FF parameters that we obtained in this way performed significantly worse than the manually refined parameters, which is why we focus only on the latter in this work. Other possible alternatives to obtaining FFs for challenging systems include QM-derived FFs [62,63] and machine-learning-based potentials [64,65].

3.5. Redox Potential Calculations

To compute the redox potential of the [Mn III Mn 3 IV ]/[Mn 4 IV ] pair, we performed two more MM MD simulations. We used the same setup and preparation steps as described above, but the production run was extended to 100 ns (0.2 fs time step). The MnV complex was described by the final versions of the newly developed FF. From each of the two trajectories, we extracted 2000 snapshots (at 50 ps intervals).
At each of the 4000 snapshots, we carried out single point calculations for the [Mn 4 IV ] wave function (charge −1 and multiplicity 13) and the [Mn III Mn 3 IV ] wave function (charge −2 and multiplicity 14). These calculations were both carried out at the U-BP86 [37,38] and U-B3LYP [66] levels of theory, employing the ZORA-SVP basis set to reduce the high computational cost. As before, we applied the ZORA relativistic Hamiltonian and the D3 correction. The surrounding point charges were included in the calculation through the AMBER-ORCA QM/MM interface [67]. Here, no periodic boundary conditions were applied, and all MM point charges in the primary simulation cell (13801 or 13802 point charges per calculation) were included in all calculations. Prior to the single point calculations, the solute was imaged to the center of the simulation cell. For the interested reader, the strong influence of the point charge placement on the obtained energy gaps is documented in Section S3 in the SI.
Finally, the vertical energy gaps were extracted from the results, resulting in four distributions { Δ E R O U - BP 86 } R , { Δ E R O U - BP 86 } O , { Δ E R O U - B 3 LYP } R , and { Δ E R O U - B 3 LYP } O . From the averages, we computed the values for Δ A [29] according to Equations (11) and (8) (neglecting the volume difference term). The reorganization energies λ , λ R , and λ O were computed from Equations (12) and (13). The final value of the reduction potential was computed using Equation (7), where Δ G ref was 4.998 eV, which is the absolute electrode potential of the ferrocenium/ferrocene (Fc + /Fc) reference electrode [68]. Error estimates were obtained from Equation (14).
The two QM/MM MD trajectories that were simulated were not employed for the reduction potential calculations. As documented in Section S4 in the SI, the short simulation time of the QM/MM MD trajectories precludes proper sampling of the solvent around the MnV WOC. Whereas the 100 ns MM MD trajectories can uniformly sample the first solvation shell, in the 5 ps QM/MM MD trajectories, the solvent is restricted to configurations that are too close to the final geometry from the equilibration run. Preliminary calculations showed that this essentially “frozen” solvent leads to a strong bias in the computed energy gaps, and therefore to a very inaccurate redox potential.

4. Results

In the following, we discuss the implications of the catalyst structure on the atom type labeling, the quality of the force field with respect to accurate bond lengths and angles, and the computed redox potentials.

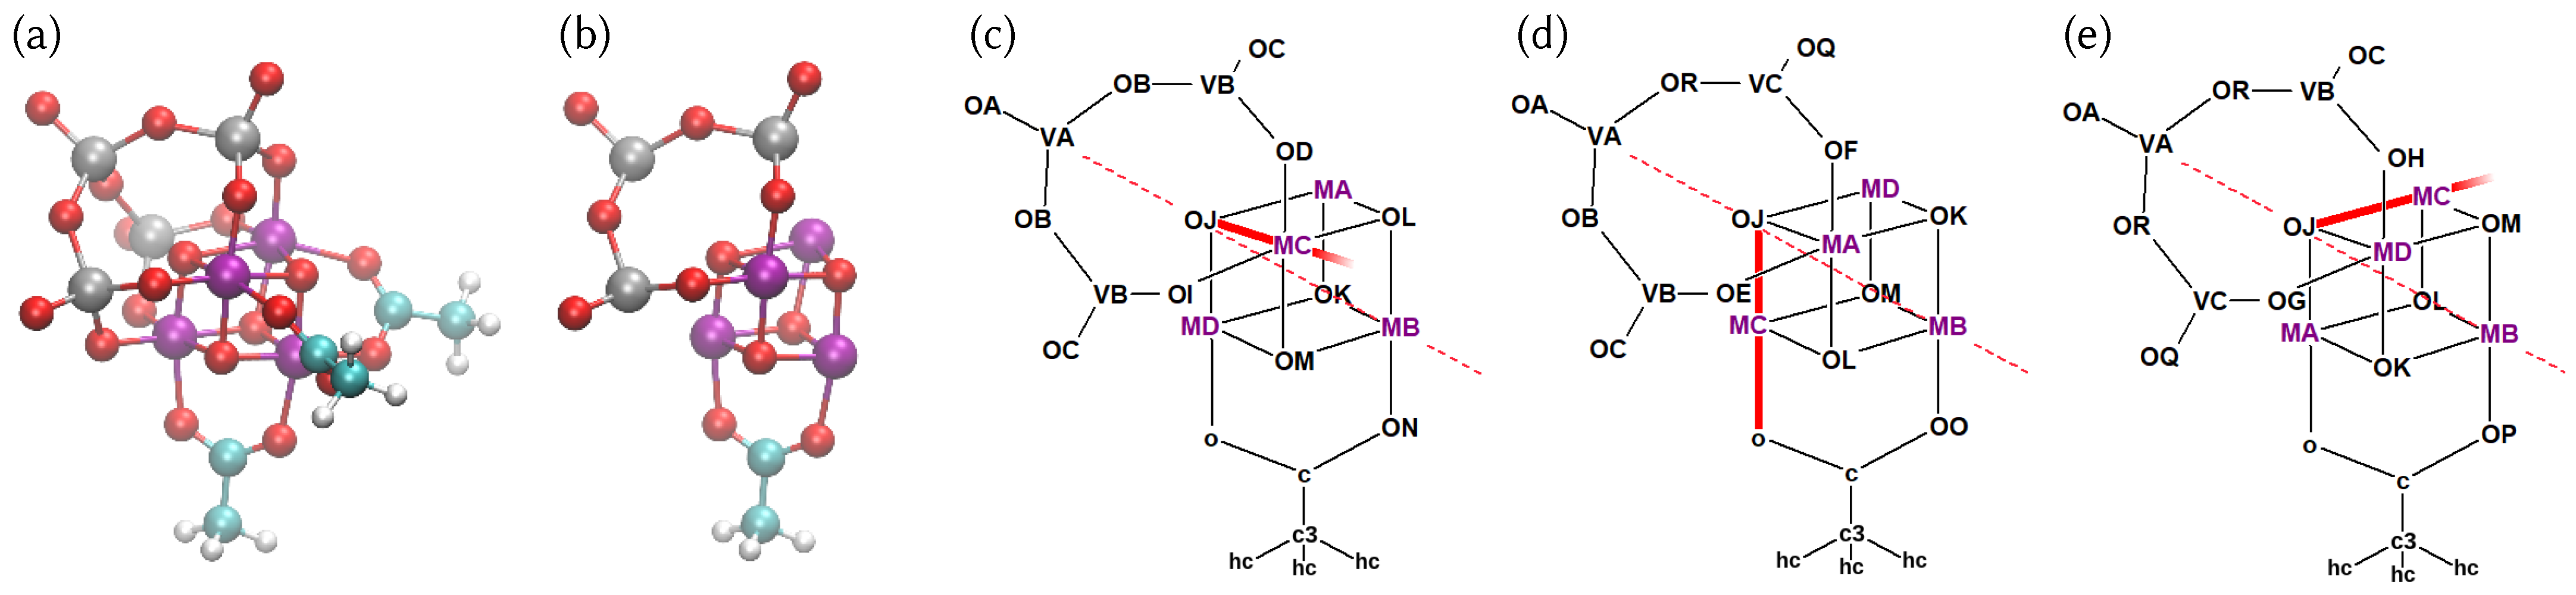
4.1. Structure of the Catalyst and Atom Type Labeling

The full three-dimensional structure of the MnV WOC is shown in Figure 1a. The complex features the [Mn 4 O 4 ] cubane core, three bridging acetate ligands—each of them μ 2 -bound to the apical Mn center and one of the three other Mn atoms—and a tripoidal [V 4 O 13 ] ligand. A subset of the atoms is shown in Figure 1b in such a way that no atom is occluded.
The entire molecule consists of 46 atoms, but like in many other FFs, not every atom necessarily requires its own independent set of FF parameters. Hence, here we use the concept of “atom types” like in GAFF [48] to define our FF parameters, where atoms with the same atom type label (e.g., “MA” or “c3”) use the same parameters. The assignment of these atom type labels is shown in Figure 1c–e. Here, to avoid occlusion, we only show part of the connectivity network in each of the three panels. The panels can be obtained by a rotation of the entire molecule by 120 degrees (or 240 degrees) before the occluded atoms are deleted. Note that some of these atom types were directly reused from GAFF (atom types c, c3, hc, and o in the acetate ligands) and those atom type labels are written in lower case, as is customary in GAFF. Conversely, all newly defined atom type labels are upper case to not clash with the ones already present in GAFF.
The [Mn 4 IV ] structure presents an idealized C 3 v symmetry, where the rotation axis passes through the apical Mn, the opposite oxygen atom, and the central V=O group. This ideal symmetry of the reactant is, however, dependent on the local oxidation states of the manganese atoms. In particular, Mn III centers have a d 4 configuration that leads to a characteristic distorted octahedral coordination induced by the Jahn–Teller effect [14]. This will lead to strongly differing bond lengths for Mn III and Mn IV , thus lowering the symmetry of the system. To support lower symmetry than C 3 v in our topology, we have assigned different atom types to the Mn and O atoms in the cubane, and to most atoms in the vanadate. As the acetate geometry is virtually unaffected by the oxidation state of the cubane, different atom types for the acetates were not necessary and we directly reused the lower case GAFF atom types c, c3, hc, and o.
The Mn atoms are labeled as MA, MB, MC, and MD, where MB is the apical Mn atom bound to all three acetate ligands, and MA, MC, and MD are ideally symmetry equivalent. The cubane oxygen atoms are labelled as OJ, OK, OL, and OM, where OJ is opposite to the apical MB and OK, OL, and OM are symmetry equivalent. The apical V atom is VA, the other ones are VB and VC. The vanadate oxygens were labeled OA, OC, and OQ for the V=O groups; OB and OR for the V–O–V bridges; and OD, OE, OF, OG, OH, OI for the V–O–Mn bridges. For the acetates, we have kept the GAFF nomenclature, except that we assigned new labels (ON, OO, OP) to the oxygen atoms bound to MB, in order to enable unequal bond parameters with that atom (i.e., in order to avoid three MB–o bonds that could not be parametrized independently).

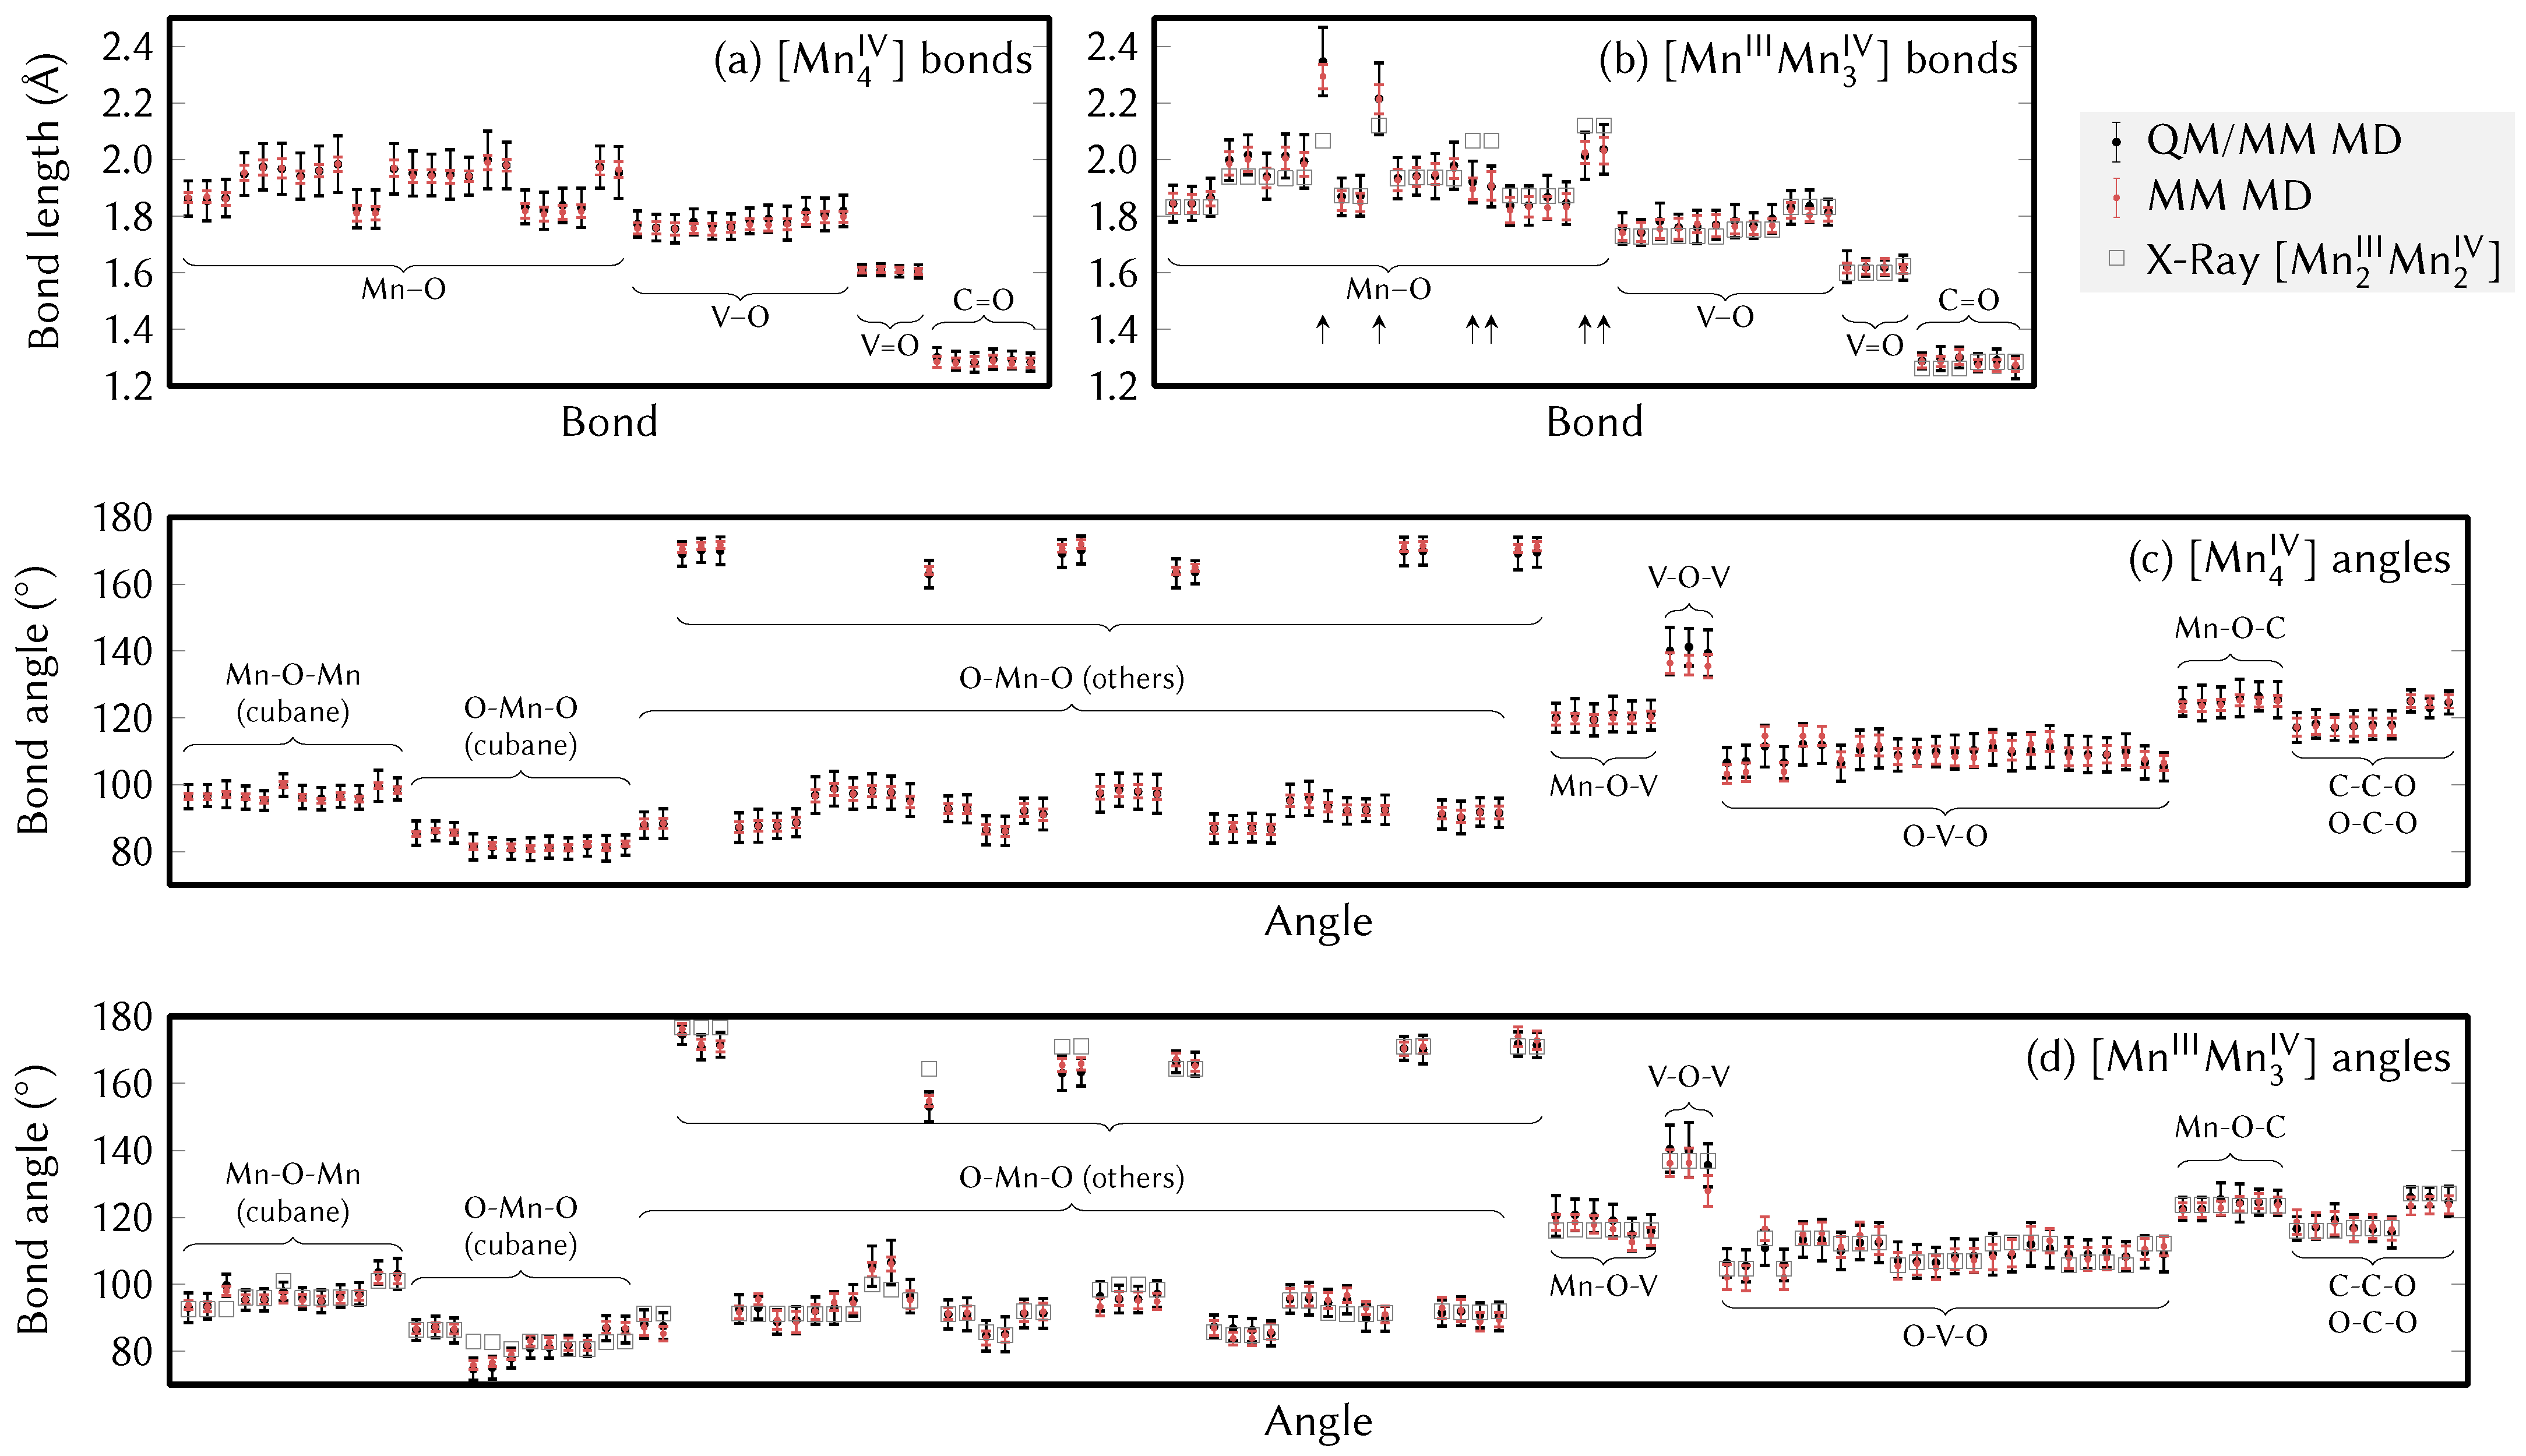
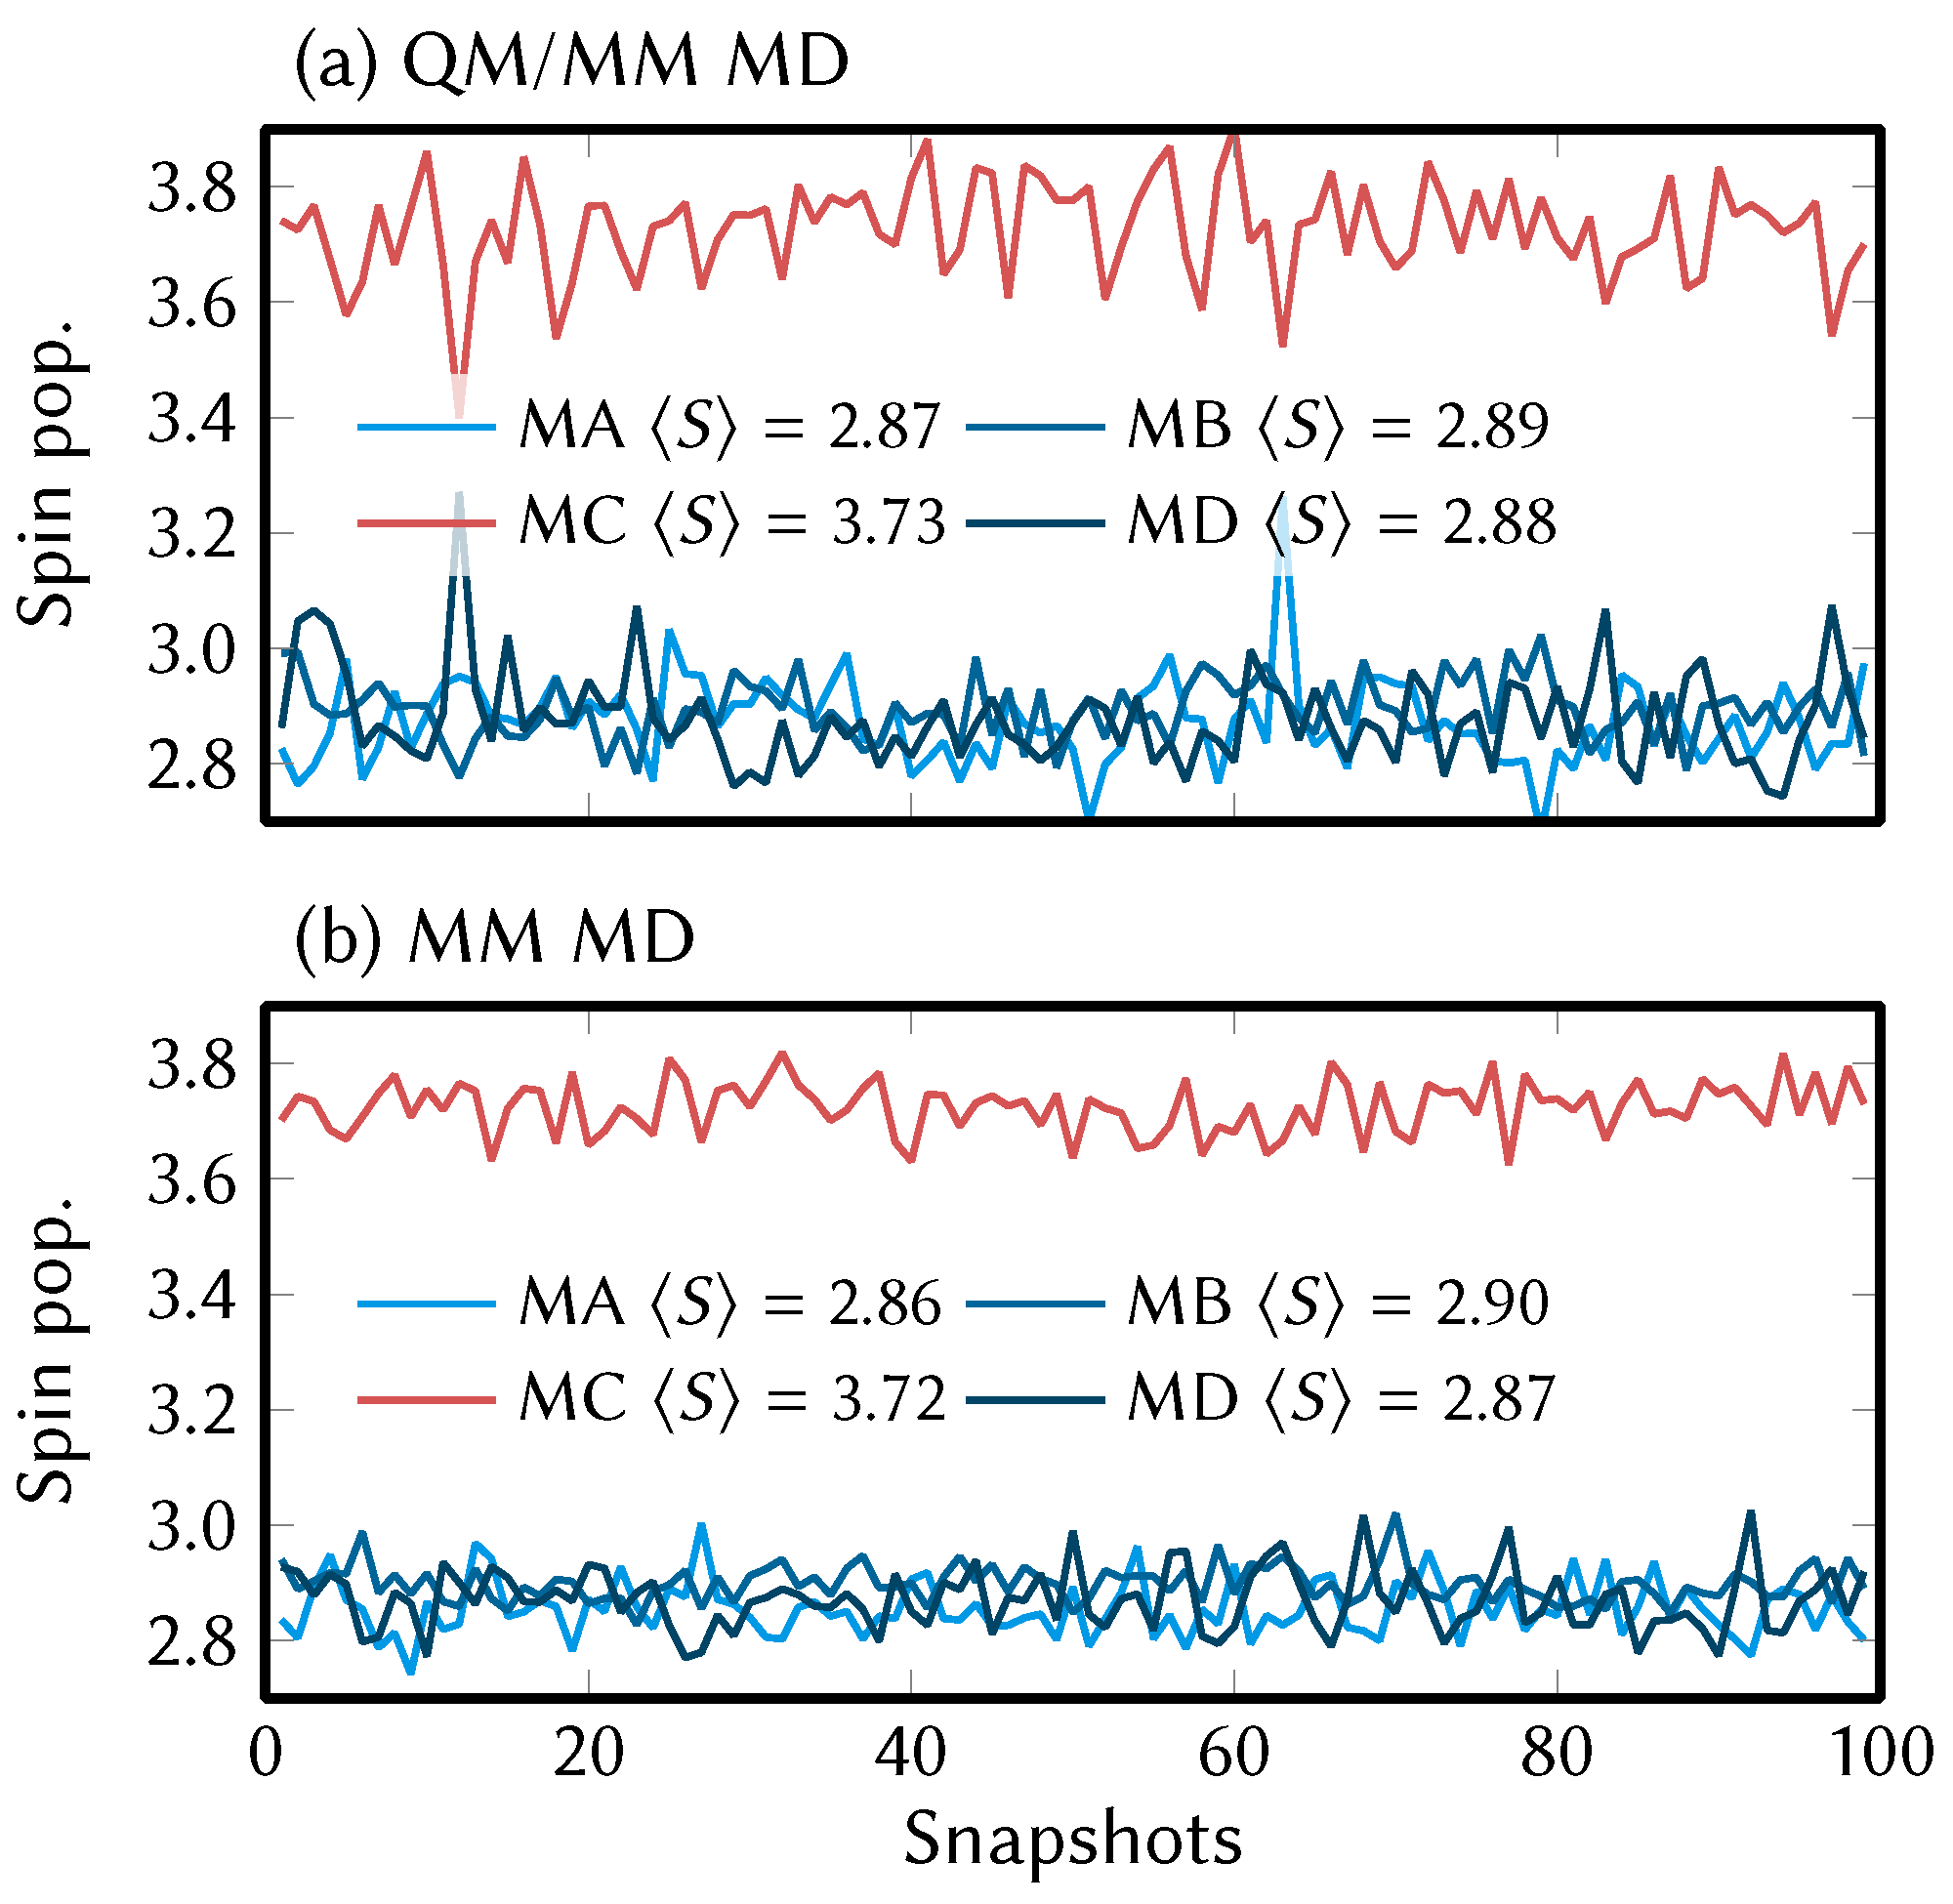
4.2. Force Field Parameters and Geometries

In order to check the accuracy of the final FF parameter set, we present the averages and standard deviations of all bond lengths and angles in Figure 2. Panels (a) and (b) show the data for the bond lengths (for [Mn 4 IV ] and [Mn III Mn 3 IV ], respectively). The RMSD between QM/MM MD and MM MD of the bond lengths is 0.011 Å for [Mn 4 IV ] (largest deviation 0.025 Å) and 0.016 Å for [Mn III Mn 3 IV ] (largest deviation 0.054 Å). The bond angle data are shown likewise in panels (c) and (d) of Figure 2. There, the RMSD is 1.2 degrees for [Mn 4 IV ] (largest deviation 5.4 degrees) and 1.8 degrees for [Mn III Mn 3 IV ] (largest deviation 7.7 degrees). This is sufficiently good for a qualitative (and possibly quantitative) description of the dynamics of the MnV WOC, as we will scrutinize below.
Notably, most of the average bond lengths calculated from both the MM MD and the QM/MM MD trajectories are in good agreement with the experimental values of the [Mn 2 III Mn 2 IV ] pristine catalyst obtained from X-ray crystal diffraction [17], even though they correspond to different oxidation states. This is shown in Figure 2b using the grey rectangles. The only significant deviations between X-ray bond lengths and computed bond lengths can be seen in six of the Mn–O bonds (these are MA–o, MC–o, MD–o, MA–OJ, MC–OJ, MD–OJ, marked by arrows in Figure 2b), due to the different oxidation states. Excluding those bond lengths, the largest deviations between X-ray data and the [Mn III Mn 3 IV ] MM MD trajectory are 0.07 Å, where the RMSD is 0.03 Å.
The disagreement of the mentioned six bond lengths—identified as the three coordination axes OJ–MA–o, OJ–MC–o, and OJ–MD–o (see Figure 1)—strikingly shows the effect of the local oxidation state on the coordination sphere. Here, in the crystal structure, all six of those bonds are notably longer than the other Mn–O bonds. On the contrary, in the [Mn III Mn 3 IV ] MD results, two bonds (left-most arrows in Figure 2b) are very long, whereas the other four are only slightly longer than other Mn–O bonds. These differences can be explained by the Jahn–Teller effect and valence localization.
In Figure 3 we present the Mulliken spin populations of the [Mn III Mn 3 IV ] complex at the 100 snapshots along the reference QM/MM MD trajectory and the MM MD trajectory with the final parameter set. As can be seen, at our level of theory, the MnV WOC shows a valence localization of the oxidation states, where the atoms MA, MB, and MD are in oxidation state +IV (indicated by about 2.9 unpaired electrons) and atom MC is in oxidation state +III (about 3.7 unpaired electrons). The different oxidation states are the reason for the different bond lengths shown in Figure 2b; the MC–o and MC–OJ bonds (indicated by the left-most arrows) are strongly elongated, whereas the equivalent bonds of MA and MD are not. Interestingly, the oxidation states remain localized for the entire length of the QM/MM MD trajectory (including the QM/MM part of the equilibration) over 10 ps. For the much longer MM MD trajectories, the oxidation states also remain localized, although it can be expected that this is due to the fact that the FF parameters enforce the Jahn–Teller axis to remain at OJ–MC–o.
The finding of localized electronic states is in agreement with results on comparable manganese oxygen clusters like the natural OEC [14,69]. The reason why the crystal structure indicates delocalization of the oxidation state (evidenced by the equal OJ–Mn–o bond lengths) could be that there is a small activation barrier that needs to be overcome to move an electron from Mn III to Mn IV . Thus, on microscopic time scales, there is valence localization, but over macroscopic time scales, the three equivalent Mn atoms are, on average, in oxidation state ( 3 + 4 + 4 ) / 3 = 3.67 in [Mn III Mn 3 IV ], with the apical Mn atom being formally in oxidation state 4. This agrees reasonably well with the results of Schwarz et al. [17] using the bond valence sum method [70,71], who assigned (for [Mn 2 III Mn 2 IV ]) a value of 3.4 to the MA, MC, and MD atoms and 4.3 to the MB (apical) atom.
The angle parameters were tuned in a similar manner as the bond parameters, but only the equilibrium angles were refined with the average values of the QM/MM MD reference trajectories. As presented in Figure 2c,d, there is very good agreement between the QM/MM MD and the MM MD trajectory, showing differences of at most 7.8 degrees, a value which is within the order of magnitude of the standard deviations observed. The largest deviations from the X-ray diffraction values (rectangles in Figure 2d) can again be explained by the valence localization of the Mn III oxidation state and the ensuing Jahn–Teller distortions. The good agreement of the angles after adaptation of the equilibrium angle parameters made it unnecessary to further adjust the angle force constants, which were therefore kept as used the initial set of parameters (Table S2 in the SI).
As shown in Figure 2, in most cases the standard deviation (the width of the distribution of bond lengths or angles) is smaller than the QM/MM MD counterpart, despite the refinement procedure described above. Although the force constants could in principle be manually modified in an attempt to match the broadness of the bond length distribution obtained, this is not trivial, as smaller force constants will make the bonds weaker and thus will likely lead to larger deviations of the averages. To match both averages and standard deviations would likely require some numerical or analytic procedure that also compensates for the intramolecular Coulomb interactions, like the force matching procedure [72,73]. Additionally, the narrower distributions in the MM MD trajectory might be partially due to the use of harmonic spring forces in the FF, which is suitable for small displacements but fails to describe the anharmonic potential energy surface for larger displacements [74].

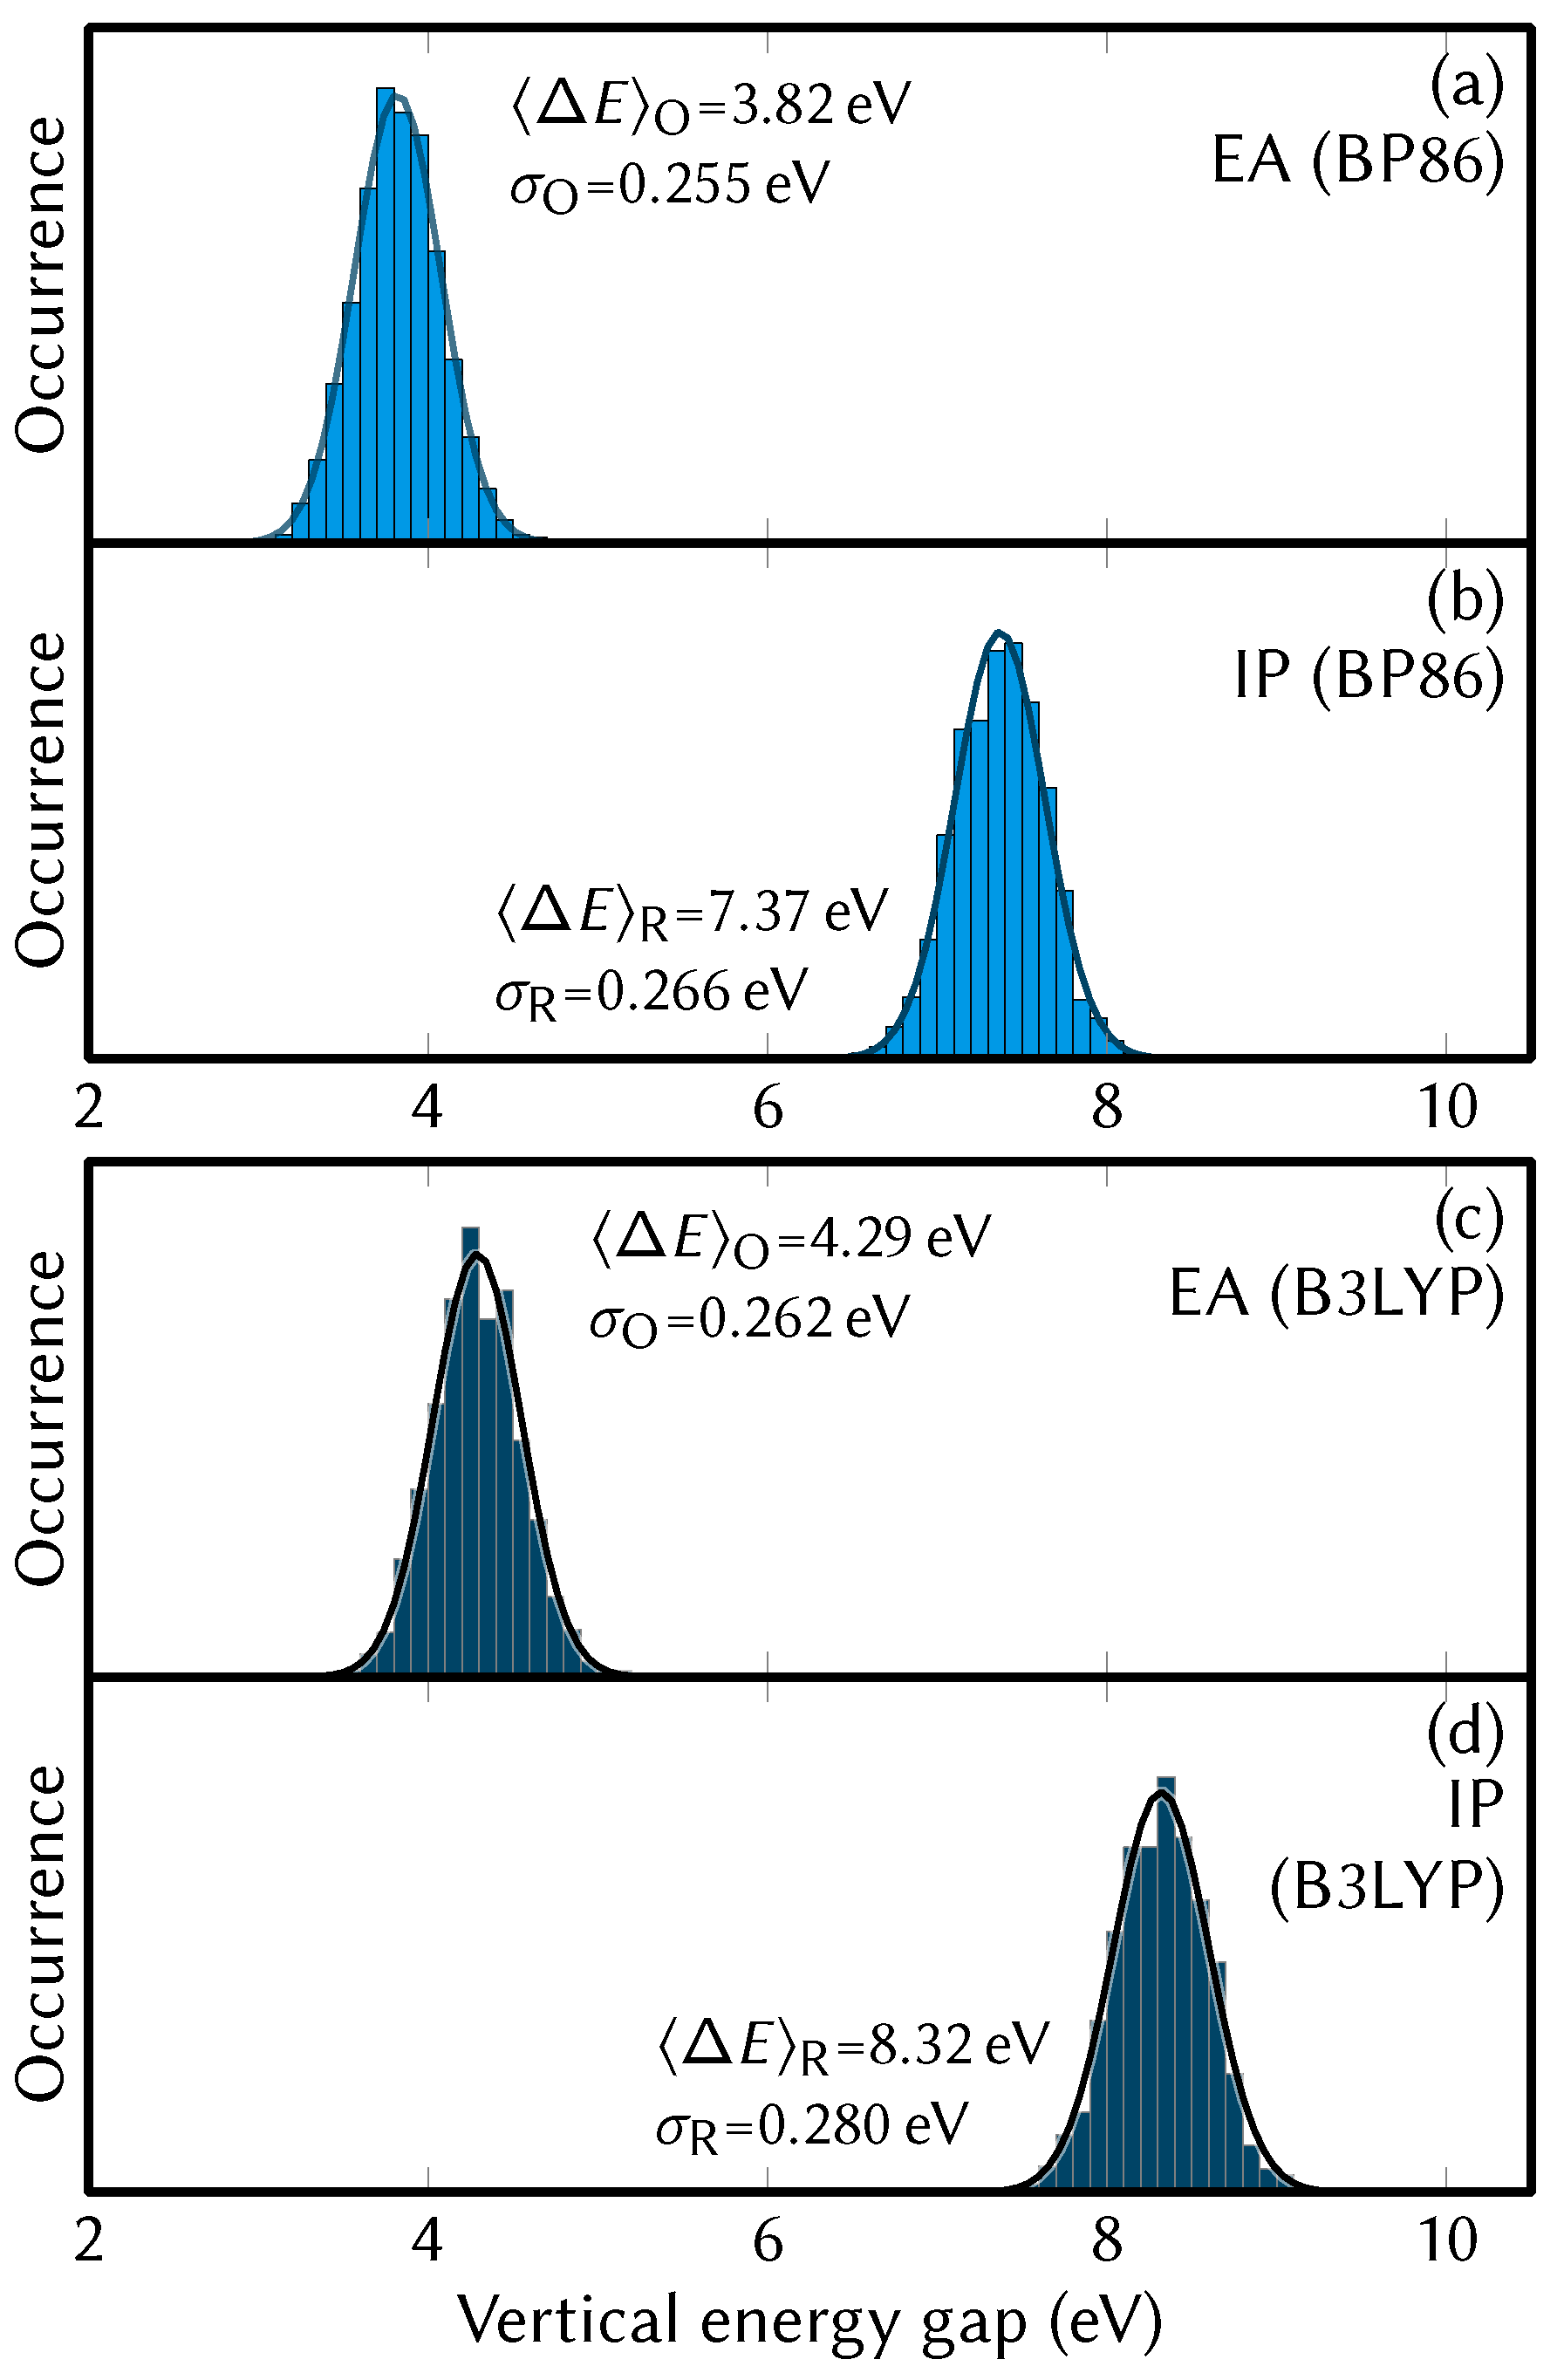
4.3. Energy Distributions and Redox Potentials

The calculation of the redox potential for the redox couple [Mn III Mn 3 IV ]/[Mn 4 IV ] is based on two 100 ns MM MD trajectories (one for the reduced and one for the oxidized species), from which 2000 snapshots each were sampled and single point SCF calculations were performed. Prior to the single point calculation, the solute was positioned at the center of the simulation cell and then all point charges from the primary cell were considered in the computation. The vertical ionization energies and electron affinities were computed as energy differences between the SCF energies of the two single point calculations at the same geometry.
The distributions of vertical energy gaps obtained from the single point calculations are shown in Figure 4, whereas the derived results are collected in Table 1. The absolute redox potential Δ A R O computed from Equation (11) was + 5.59 eV for BP86 and + 6.31 eV for B3LYP. The reorganization energy can be computed in three different ways, either from the half difference of the average energy gaps ( λ ), or from the standard deviations of the energy gaps ( λ O and λ R ). The degree of agreement between these three values offers a way to judge whether the reaction follows the linear response Marcus regime and, hence, whether the equations given in Section 2 are applicable. As the different reorganization energy estimates differ among themselves, we used the so-called Q-model approach [35,36] to verify our results. The error estimates from this model, Equation (14), are satisfyingly small, being only 0.015 eV for BP86 and 0.025 eV for B3LYP. The final reduction potential of the [Mn III Mn 3 IV ] ⇌ [Mn 4 IV ]+e half reaction is then computed from Equation (7), using the value of + 4.998 eV as the absolute redox potential of the Fc + /Fc reference electrode [68] that was employed by Schwarz et al. [17]. The corresponding uncertainty was estimated as 1 2 ( σ O + σ R ) + | δ Δ A corr | .
Thus, the reduction potential of the [Mn III Mn 3 IV ] ⇌ [Mn 4 IV ]+e half-reaction is found to be + 0.59 ± 0.28 V (BP86) or + 1.31 ± 0.30 V (B3LYP). These values can be compared to the experimental value of + 1.1 eV determined by cyclic voltammetry with the same reference electrode [17]. Here, multiple error sources might explain the differences between experimental and computed values. First, the neglected p Δ V R O term in Equation (8), is probably insignificant, as the box volumes of the two MM trajectories are identical to within 0.03 standard deviations. However, there might be small contributions to the uncertainty from entropic contributions due to the triply degenerate Jahn–Teller configurations that are not taken into account in our FF and from spin coupling effects.
Second, formally the probability distributions in Figure 4 are not entirely correct, as the MM Hamiltonian used for sampling and the QM/MM Hamiltonian used to calculate the energy gaps are not the same, and their probability distributions will differ to some extent [75,76,77]. To check to which extent this can introduce a bias in our results, we investigated how much the MM and QM/MM potential energies deviate from each other and and whether the vertical energy gaps depend on this deviation. As we show in Section S5 in the SI, the MM and QM/MM potential energies show deviations of a few kcal/mol. However, the vertical energy gap distributions do not depend on the potential energy deviations, showing that sampling with the MM Hamiltonians most likely did not introduce a significant bias into the distributions of the vertical energy gaps. Hence, for the sake of statistical convergence of the histograms in Figure 4 we omit unbiasing here, as was also done occasionally in the past when MM-based sampling and QM/MM computation of the energy gaps were combined to compute redox potentials [78]. Further improvement of the sampling could be achieved in future work by relaxing each MM snapshot with short QM/MM trajectories, a procedure that is sometimes called “switching” [77]. This might especially help in alleviating the fact that the harmonic terms in our optimized FF are systematically too stiff.
Third, although the accuracy of the FF might introduce some bias, based on the comparison of our results with two different density functionals—the GGA functional BP86 and the hybrid functional B3LYP—it appears that the electronic structure level of theory has an even stronger influence on the final result. Here, apparently the exact exchange in the B3LYP functional reduces the self-interaction error and thus stabilizes the reduced species relative to the oxidized species, which increases the energy gaps and thus shifts the reduction potential to more positive values. From the comparison with the experimental value, B3LYP provides a more accurate estimate of the reduction potential (BP86 is off by about 0.4 eV, B3LYP by about 0.2 eV). However, it seems that B3LYP overshoots these electronic effects. Hence, some more elaborate density functional, and probably a larger electronic basis set, might be necessary to obtain the right balance between electronic correlation and exchange, although such investigation of electronic structure effects goes beyond the scope of the present work.
Finally, a comment on the importance of proper solvent sampling is on order here. Besides the MM MD trajectories, in preliminary calculations we also attempted to compute the reduction potential from the snapshots of the QM/MM MD trajectories. Using the BP86 functional, the final reduction potential based on a subset of QM/MM MD snapshots was found to be 1.10 ± 0.42 V (against the Fc + /Fc electrode), far away from the experimental value of + 1.1 V and the values based on MM MD ( + 0.59 V or + 1.31 V, see Table 1). As shown in Section S4 in the SI, one of the most important differences between the QM/MM MD and MM MD simulations is the accomplished solvent sampling, which is most likely the reason for the large differences in the resulting reduction potentials. This illustrates that proper solvent sampling—requiring long time scales—is mandatory for redox potential computations like the ones presented here. Naturally, such long time scales and uniform solvent sampling can be achieved using MM FFs, showing that an accurate FF is of large importance for future atomistic simulations of the embedding of the MnV WOC in block copolymer matrices.

5. Conclusions

We have developed a force field in AMBER format for a manganese vanadium oxide synthetic analogue of the oxygen evolving complex, which catalyzes the water splitting reaction in nature. In particular, we reported on two sets of force field parameters for the two oxidation states involved in the [Mn III Mn 3 IV ] ⇌ [Mn 4 IV ]+e oxidation reaction that precedes the water oxidation reaction [17] in this catalyst.
Initial force field parameters were obtained by combining pre-existing force fields of polyoxovanadate cages [59], high-valent manganese dimers [60], and ab initio calculations. This force field was refined by tuning the equilibrium values and the force constants of the bond and angle potentials, using the distributions of bonds and angles obtained from reference QM/MM MD trajectories. It was observed that the refined force field parameters properly describe the axial Jahn–Teller distortion characteristic of a d 4 Mn III center in an octahedral ligand field. Furthermore, we found that along the dynamics, according to the Mulliken spin populations and the bond lengths of the bonds involved in that geometrical distortion, no valence change or electron transfer occurred—hinting at valence localization in this complex. In general, good agreement of bond lengths and angles between the MM MD, QM/MM MD, and (with exceptions) the X-ray structure [17] was found.
The redox potential of the [Mn III Mn 3 IV ]⇌ [Mn 4 IV ]+e oxidation reaction was calculated by applying a protocol originally proposed by Warshel and coworkers [26,27], in which the Gibbs free energy of oxidation was approximated as the Helmholtz free energy (Equation (11)), calculated as the average between the average ionization energy and the average electron affinity. Using two different density functionals, we computed the reduction potential to be + 0.59 ± 0.28 V (BP86) or + 1.31 ± 0.30 V (B3LYP). Although these results are in reasonable agreement with the experimental value of + 1.1 eV [17], it appears that the chosen electronic structure level of theory has a strong influence on the results. Importantly, we also found that qualitative agreement with experimental values requires extensive sampling of the solvent shell around the MnV WOC, as it can currently only be achieved with MM force fields but not with QM/MM methods. We thus expect the presented force field parameters to enable reasonable atomistic simulations of challenging polyoxometalate complexes.

Supplementary Materials

The following are available online at https://0-www-mdpi-com.brum.beds.ac.uk/article/10.3390/catal11040493/s1: Full tables with all used force field parameters. Deviations between MM MD and QM/MM MD. Influence of point charge placement on the vertical energy gaps. Sampling of solvent distribution with MM MD and QM/MM MD. Effect of different MM and QM/MM potential energy surfaces on the vertical energy gaps.

Author Contributions

Conceptualization, G.C., P.M. and L.G.; methodology, G.C.; investigation, G.C.; formal analysis, S.M.; validation, S.M.; data curation, S.M.; writing—original draft preparation, G.C.; writing—review and editing, S.M.; visualization, S.M.; supervision, P.M. and L.G.; project administration, L.G.; funding acquisition, L.G. All authors have read and agreed to the published version of the manuscript.

Funding

This research was funded by the Deutsche Forschungsgemeinschaft (DFG) project number 364549901 (TRR234 “CataLight”) and by the Austrian Science Fund (FWF) project number I3987 (“CataLight”).

Data Availability Statement

The data that support the findings of this study are available from the corresponding author upon reasonable request.

Acknowledgments

The authors acknowledge allocation of computational resources from the Vienna Scientific Cluster (VSC), and Pedro A. Sánchez-Murcia and David Hernández-Castillo for fruitful discussions.

Conflicts of Interest

The authors declare no conflict of interest.

References

  1. Hagedorn, G.; Kalmus, P.; Mann, M.; Vicca, S.; den Berge, J.V.; van Ypersele, J.P.; Bourg, D.; Rotmans, J.; Kaaronen, R.; Rahmstorf, S.; et al. Concerns of young protesters are justified. Science 2019, 364, 139–140. [Google Scholar] [CrossRef] [PubMed] [Green Version]
  2. Cook, T.R.; Dogutan, D.K.; Reece, S.Y.; Surendranath, Y.; Teets, T.S.; Nocera, D.G. Solar energy supply and storage for the legacy and nonlegacy worlds. Chem. Rev. 2010, 110, 6474–6502. [Google Scholar] [CrossRef] [PubMed]
  3. Tachibana, Y.; Vayssieres, L.; Durrant, J.R. Artificial photosynthesis for solar water-splitting. Nat. Photonics 2012, 6, 511–518. [Google Scholar] [CrossRef]
  4. Berardi, S.; Drouet, S.; Francàs, L.; Gimbert-Suriñach, C.; Guttentag, M.; Richmond, C.; Stoll, T.; Llobet, A. Molecular artificial photosynthesis. Chem. Soc. Rev. 2014, 43, 7501–7519. [Google Scholar] [CrossRef]
  5. Kärkäs, M.D.; Verho, O.; Johnston, E.V.; Åkermark, B. Artificial photosynthesis: Molecular systems for catalytic water oxidation. Chem. Rev. 2014, 114, 11863–12001. [Google Scholar] [CrossRef]
  6. Blakemore, J.D.; Crabtree, R.H.; Brudvig, G.W. Molecular catalysts for water oxidation. Chem. Rev. 2015, 115, 12974–13005. [Google Scholar] [CrossRef] [PubMed]
  7. Roger, I.; Shipman, M.A.; Symes, M.D. Earth-abundant catalysts for electrochemical and photoelectrochemical water splitting. Nat. Rev. Chem. 2017, 1, 0003. [Google Scholar] [CrossRef]
  8. Matheu, R.; Garrido-Barros, P.; Gil-Sepulcre, M.; Ertem, M.Z.; Sala, X.; Gimbert-Suriñach, C.; Llobet, A. The development of molecular water oxidation catalysts. Nat. Rev. Chem. 2019, 3, 331–341. [Google Scholar] [CrossRef]
  9. Gao, D.; Trentin, I.; Schwiedrzik, L.; González, L.; Streb, C. The reactivity and stability of polyoxometalate water oxidation electrocatalysts. Molecules 2019, 25, 157. [Google Scholar] [CrossRef] [Green Version]
  10. Limburg, B.; Bouwman, E.; Bonnet, S. Molecular water oxidation catalysts based on transition metals and their decomposition pathways. Coord. Chem. Rev. 2012, 256, 1451–1467. [Google Scholar] [CrossRef]
  11. Vinyard, D.J.; Brudvig, G.W. Progress toward a molecular mechanism of water oxidation in photosystem II. Annu. Rev. Phys. Chem. 2017, 68, 101–116. [Google Scholar] [CrossRef]
  12. Kok, B.; Forbush, B.; Mcgloin, M. Cooperation of charges in photosynthetic O2 evolution–I. A linear four step mechanism. Photochem. Photobiol. 1970, 11, 457–475. [Google Scholar] [CrossRef] [PubMed]
  13. Åhrling, K.A.; Peterson, S.; Styring, S. An oscillating manganese electron paramagnetic resonance signal from the S0 state of the oxygen evolving complex in photosystem II. Biochemistry 1997, 36, 13148–13152. [Google Scholar] [CrossRef] [PubMed]
  14. Krewald, V.; Retegan, M.; Cox, N.; Messinger, J.; Lubitz, W.; DeBeer, S.; Neese, F.; Pantazis, D.A. Metal oxidation states in biological water splitting. Chem. Sci. 2015, 6, 1676–1695. [Google Scholar] [CrossRef] [PubMed] [Green Version]
  15. Lubitz, W.; Chrysina, M.; Cox, N. Water oxidation in photosystem II. Photosynth. Res. 2019, 142, 105–125. [Google Scholar] [CrossRef] [PubMed] [Green Version]
  16. Cox, N.; Pantazis, D.A.; Lubitz, W. Current understanding of the mechanism of water oxidation in photosystem II and its relation to XFEL data. Annu. Rev. Biochem. 2020, 89, 795–820. [Google Scholar] [CrossRef] [Green Version]
  17. Schwarz, B.; Forster, J.; Goetz, M.K.; Yücel, D.; Berger, C.; Jacob, T.; Streb, C. Visible-light-driven water oxidation by a molecular manganese vanadium oxide cluster. Angew. Chem. Int. Ed. 2016, 55, 6329–6333. [Google Scholar] [CrossRef]
  18. Romanenko, I.; Rajagopal, A.; Neumann, C.; Turchanin, A.; Streb, C.; Schacher, F.H. Embedding molecular photosensitizers and catalysts in nanoporous block copolymer membranes for visible-light driven hydrogen evolution. J. Mater. Chem. A 2020, 8, 6238–6244. [Google Scholar] [CrossRef]
  19. Nabiyan, A.; Schulz, M.; Neumann, C.; Dietzek, B.; Turchanin, A.; Schacher, F.H. Photocatalytically active block copolymer hybrid micelles from double hydrophilic block copolymers. Eur. Polym. J. 2020, 140, 110037. [Google Scholar] [CrossRef]
  20. Quiñonero, D.; Kaledin, A.L.; Kuznetsov, A.E.; Geletii, Y.V.; Besson, C.; Hill, C.L.; Musaev, D.G. Computational studies of the geometry and electronic structure of an all-inorganic and homogeneous tetra-Ru-polyoxotungstate catalyst for water oxidation and its four subsequent one-electron oxidized forms. J. Phys. Chem. A 2010, 114, 535–542. [Google Scholar] [CrossRef]
  21. Soriano-López, J.; Musaev, D.G.; Hill, C.L.; Galán-Mascarós, J.R.; Carbó, J.J.; Poblet, J.M. Tetracobalt-polyoxometalate catalysts for water oxidation: Key mechanistic details. J. Catal. 2017, 350, 56–63. [Google Scholar] [CrossRef] [Green Version]
  22. Klamt, A.; Schüürmann, G. COSMO: A new approach to the dielectric screening in solvents with explicit expressions for the screening energy and its gradient. J. Chem. Soc. Perkin Trans. 2 1993, 799. [Google Scholar] [CrossRef]
  23. Scalmani, G.; Frisch, M.J. Continuous surface charge polarizable continuum models of solvation. I. General formalism. J. Chem. Phys. 2010, 132, 114110. [Google Scholar] [CrossRef] [PubMed]
  24. Case, D.A.; Cheatham, T.E.; Darden, T.; Gohlke, H.; Luo, R.; Merz, K.M.; Onufriev, A.; Simmerling, C.; Wang, B.; Woods, R.J. The AMBER biomolecular simulation programs. J. Comput. Chem. 2005, 26, 1668–1688. [Google Scholar] [CrossRef] [Green Version]
  25. Boresch, S.; Karplus, M. The Jacobian factor in free energy simulations. J. Chem. Phys. 1996, 105, 5145–5154. [Google Scholar] [CrossRef]
  26. Warshel, A. Dynamics of reactions in polar solvents. Semiclassical trajectory studies of electron-transfer and proton-transfer reactions. J. Phys. Chem. 1982, 86, 2218–2224. [Google Scholar] [CrossRef]
  27. King, G.; Warshel, A. Investigation of the free energy functions for electron transfer reactions. J. Chem. Phys. 1990, 93, 8682–8692. [Google Scholar] [CrossRef]
  28. Blumberger, J.; Tavernelli, I.; Klein, M.L.; Sprik, M. Diabatic free energy curves and coordination fluctuations for the aqueous Ag+/Ag2+ redox couple: A biased Born-Oppenheimer molecular dynamics investigation. J. Chem. Phys. 2006, 124, 064507. [Google Scholar] [CrossRef] [PubMed]
  29. Diamantis, P.; Gonthier, J.F.; Tavernelli, I.; Röthlisberger, U. Study of the redox properties of singlet and triplet tris(2,2′-bipyridine) ruthenium(II) ([Ru(bpy)3]2+) in aqueous solution by full quantum and mixed quantum/classical molecular dynamics simulations. J. Phys. Chem. B 2014, 118, 3950–3959. [Google Scholar] [CrossRef]
  30. Diamantis, P.; Tavernelli, I.; Rothlisberger, U. Redox properties of native and damaged DNA from mixed quantum mechanical/molecular mechanics molecular dynamics simulations. J. Chem. Theory Comput. 2020, 16, 6690–6701. [Google Scholar] [CrossRef]
  31. Zwanzig, R.W. High-temperature equation of state by a perturbation method. I. Nonpolar gases. J. Chem. Phys. 1954, 22, 1420–1426. [Google Scholar] [CrossRef]
  32. Marcus, R.A. On the theory of oxidation-reduction reactions involving electron transfer. I. J. Chem. Phys. 1956, 24, 966–978. [Google Scholar] [CrossRef] [Green Version]
  33. Marcus, R.A. On the theory of oxidation-reduction reactions involving electron transfer. III. Applications to data on the rates of organic redox reactions. J. Chem. Phys. 1957, 26, 872–877. [Google Scholar] [CrossRef] [Green Version]
  34. Marcus, R.A. On the theory of electron-transfer reactions. VI. Unified treatment for homogeneous and electrode reactions. J. Chem. Phys. 1965, 43, 679–701. [Google Scholar] [CrossRef] [Green Version]
  35. Matyushov, D.V.; Voth, G.A. Modeling the free energy surfaces of electron transfer in condensed phases. J. Chem. Phys. 2000, 113, 5413. [Google Scholar] [CrossRef]
  36. Small, D.W.; Matyushov, D.V.; Voth, G.A. The theory of electron transfer reactions: What may be missing? J. Am. Chem. Soc. 2003, 125, 7470–7478. [Google Scholar] [CrossRef]
  37. Perdew, J.P. Density-functional approximation for the correlation energy of the inhomogeneous electron gas. Phys. Rev. B 1986, 33, 8822–8824. [Google Scholar] [CrossRef] [PubMed]
  38. Becke, A.D. Density-functional exchange-energy approximation with correct asymptotic behavior. Phys. Rev. A 1988, 38, 3098–3100. [Google Scholar] [CrossRef]
  39. Weigend, F.; Ahlrichs, R. Balanced basis sets of split valence, triple zeta valence and quadruple zeta valence quality for H to Rn: Design and assessment of accuracy. Phys. Chem. Chem. Phys. 2005, 7, 3297–3305. [Google Scholar] [CrossRef]
  40. Pantazis, D.A.; Chen, X.Y.; Landis, C.R.; Neese, F. All-electron scalar relativistic basis sets for third-row transition metal atoms. J. Chem. Theory Comput. 2008, 4, 908–919. [Google Scholar] [CrossRef]
  41. van Lenthe, E.; Baerends, E.J.; Snijders, J.G. Relativistic regular two–component Hamiltonians. J. Chem. Phys. 1993, 99, 4597–4610. [Google Scholar] [CrossRef]
  42. van Lenthe, E.; Baerends, E.J.; Snijders, J.G. Relativistic total energy using regular approximations. J. Chem. Phys. 1994, 101, 9783–9792. [Google Scholar] [CrossRef]
  43. Grimme, S. Density functional theory with London dispersion corrections. WIREs Comput. Mol. Sci. 2011, 1, 211–228. [Google Scholar] [CrossRef]
  44. Neese, F. The ORCA program system. WIREs Comput. Mol. Sci. 2012, 2, 73–78. [Google Scholar] [CrossRef]
  45. Neese, F. Software update: The ORCA program system, version 4.0. WIREs Comput. Mol. Sci. 2017, 8, e1327. [Google Scholar] [CrossRef]
  46. Ames, W.; Pantazis, D.A.; Krewald, V.; Cox, N.; Messinger, J.; Lubitz, W.; Neese, F. Theoretical evaluation of structural models of the S2 state in the oxygen evolving complex of photosystem II: Protonation states and magnetic interactions. J. Am. Chem. Soc. 2011, 133, 19743–19757. [Google Scholar] [CrossRef]
  47. Neese, F. Prediction of molecular properties and molecular spectroscopy with density functional theory: From fundamental theory to exchange-coupling. Coord. Chem. Rev. 2009, 253, 526–563. [Google Scholar] [CrossRef]
  48. Wang, J.; Wolf, R.M.; Caldwell, J.W.; Kollman, P.A.; Case, D.A. Development and testing of a general AMBER force field. J. Comput. Chem. 2004, 25, 1157–1174. [Google Scholar] [CrossRef]
  49. Case, D.A.; Cerutti, D.S.; Cheatham, T.E., III; Darden, T.A.; Duke, R.E.; Giese, T.J.; Gohlke, H.; Goetz, A.W.; Greene, D.; Homeyer, N.; et al. AMBER 2017. Available online: http://ambermd.org/ (accessed on 21 April 2017).
  50. Ufimtsev, I.S.; Martinez, T.J. Quantum chemistry on graphical processing units. 3. Analytical energy gradients, geometry optimization, and first principles molecular dynamics. J. Chem. Theory Comput. 2009, 5, 2619–2628. [Google Scholar] [CrossRef]
  51. Titov, A.V.; Ufimtsev, I.S.; Luehr, N.; Martinez, T.J. Generating efficient quantum chemistry codes for novel architectures. J. Chem. Theory Comput. 2012, 9, 213–221. [Google Scholar] [CrossRef]
  52. Dunning, T.H.; Hay, P.J. Gaussian basis sets for molecular calculations. In Methods of Electronic Structure Theory; Springer: New York, NY, USA, 1977; pp. 1–27. [Google Scholar] [CrossRef]
  53. Hay, P.J.; Wadt, W.R. Ab initio effective core potentials for molecular calculations. Potentials for the transition metal atoms Sc to Hg. J. Chem. Phys. 1985, 82, 270–283. [Google Scholar] [CrossRef]
  54. Song, C.; Wang, L.P.; Martínez, T.J. Automated code engine for graphical processing units: Application to the effective core potential integrals and gradients. J. Chem. Theory Comput. 2015, 12, 92–106. [Google Scholar] [CrossRef] [PubMed] [Green Version]
  55. Caleman, C.; van Maaren, P.J.; Hong, M.; Hub, J.S.; Costa, L.T.; van der Spoel, D. Force field benchmark of organic liquids: Density, enthalpy of vaporization, heat capacities, surface tension, isothermal compressibility, volumetric expansion coefficient, and dielectric constant. J. Chem. Theory Comput. 2011, 8, 61–74. [Google Scholar] [CrossRef] [PubMed]
  56. Roy, D.; Kovalenko, A. Application of the approximate 3D-reference interaction site model (RISM) molecular solvation theory to acetonitrile as solvent. J. Phys. Chem. B 2020, 124, 4590–4597. [Google Scholar] [CrossRef] [PubMed]
  57. Joung, I.S.; Cheatham, T.E. Molecular dynamics simulations of the dynamic and energetic properties of alkali and halide ions using water-model-specific ion parameters. J. Phys. Chem. B 2009, 113, 13279–13290. [Google Scholar] [CrossRef] [Green Version]
  58. Li, P.; Roberts, B.P.; Chakravorty, D.K.; Merz, K.M. Rational design of particle mesh Ewald compatible Lennard-Jones parameters for +2 metal cations in explicit solvent. J. Chem. Theory Comput. 2013, 9, 2733–2748. [Google Scholar] [CrossRef] [Green Version]
  59. Menke, C.; Diemann, E.; Müller, A. Polyoxovanadate clusters and cages: Force-field parameterization. J. Mol. Struct. 1997, 436-437, 35–47. [Google Scholar] [CrossRef]
  60. Manchanda, R.; Zimmer, M.; Brudvig, G.W.; Crabtree, R.H. A modified MM2 force field for high-valent di-μ-oxo manganese dimers. J. Mol. Struct. 1994, 323, 257–266. [Google Scholar] [CrossRef]
  61. Seminario, J.M. Calculation of intramolecular force fields from second-derivative tensors. Int. J. Quantum Chem. 1996, 60, 1271–1277. [Google Scholar] [CrossRef]
  62. Grimme, S. A general quantum mechanically derived force field (QMDFF) for molecules and condensed phase simulations. J. Chem. Theory Comput. 2014, 10, 4497–4514. [Google Scholar] [CrossRef]
  63. Brunken, C.; Reiher, M. Self-parametrizing system-focused atomistic models. J. Chem. Theory Comput. 2020, 16, 1646–1665. [Google Scholar] [CrossRef] [PubMed] [Green Version]
  64. Unke, O.T.; Chmiela, S.; Sauceda, H.E.; Gastegger, M.; Poltavsky, I.; Schütt, K.T.; Tkatchenko, A.; Müller, K.R. Machine learning force fields. Chem. Rev. 2021. [Google Scholar] [CrossRef]
  65. Westermayr, J.; Marquetand, P. Machine learning for electronically excited states of molecules. Chem. Rev. 2020. [Google Scholar] [CrossRef]
  66. Becke, A.D. Density-functional thermochemistry. III. The role of exact exchange. J. Chem. Phys. 1993, 98, 5648–5652. [Google Scholar] [CrossRef] [Green Version]
  67. Götz, A.W.; Clark, M.A.; Walker, R.C. An extensible interface for QM/MM molecular dynamics simulations with AMBER. J. Comput. Chem. 2013, 35, 95–108. [Google Scholar] [CrossRef] [PubMed] [Green Version]
  68. Namazian, M.; Lin, C.Y.; Coote, M.L. Benchmark calculations of absolute reduction potential of ferricinium/ferrocene couple in nonaqueous solutions. J. Chem. Theory Comput. 2010, 6, 2721–2725. [Google Scholar] [CrossRef]
  69. Cox, N.; Retegan, M.; Neese, F.; Pantazis, D.A.; Boussac, A.; Lubitz, W. Electronic structure of the oxygen-evolving complex in photosystem II prior to O–O bond formation. Science 2014, 345, 804–808. [Google Scholar] [CrossRef] [PubMed]
  70. Brese, N.E.; O’Keeffe, M. Bond-valence parameters for solids. Acta Crystallogr. Sect. B 1991, 47, 192–197. [Google Scholar] [CrossRef]
  71. Brown, I.D. Recent developments in the methods and applications of the bond valence model. Chem. Rev. 2009, 109, 6858–6919. [Google Scholar] [CrossRef] [PubMed] [Green Version]
  72. Ercolessi, F.; Adams, J.B. Interatomic potentials from first-principles calculations: The force-matching method. Europhys. Lett. 1994, 26, 583–588. [Google Scholar] [CrossRef] [Green Version]
  73. Maurer, P.; Laio, A.; Hugosson, H.W.; Colombo, M.C.; Rothlisberger, U. Automated parametrization of biomolecular force fields from quantum mechanics/molecular mechanics (QM/MM) Simulations through force matching. J. Chem. Theory Comput. 2007, 3, 628–639. [Google Scholar] [CrossRef]
  74. Barbatti, M.; Sen, K. Effects of different initial condition samplings on photodynamics and spectrum of pyrrole. Int. J. Quantum Chem. 2016, 116, 762–771. [Google Scholar] [CrossRef] [Green Version]
  75. Blumberger, J. Free energies for biological electron transfer from QM/MM calculation: Method, application and critical assessment. Phys. Chem. Chem. Phys. 2008, 10, 5651. [Google Scholar] [CrossRef] [PubMed]
  76. König, G.; Hudson, P.S.; Boresch, S.; Woodcock, H.L. Multiscale free energy simulations: An efficient method for connecting classical MD simulations to QM or QM/MM free energies using non-Boltzmann Bennett reweighting schemes. J. Chem. Theory Comput. 2014, 10, 1406–1419. [Google Scholar] [CrossRef]
  77. Hudson, P.S.; Woodcock, H.L.; Boresch, S. Use of interaction energies in QM/MM free energy simulations. J. Chem. Theory Comput. 2019, 15, 4632–4645. [Google Scholar] [CrossRef] [PubMed]
  78. Hu, L.; Farrokhnia, M.; Heimdal, J.; Shleev, S.; Rulíšek, L.; Ryde, U. Reorganization energy for internal electron transfer in multicopper oxidases. J. Phys. Chem. B 2011, 115, 13111–13126. [Google Scholar] [CrossRef] [PubMed] [Green Version]
Figure 1. (a) 3D structure of the MnV WOC featuring the three symmetry equivalent acetate ligands (bottom, right, and front) and the tripodal [V 4 O 13 ] ligand (left, top, and back). (b) Simplified version of the structure of the MnV WOC, in which only the full [Mn 4 O 4 ] cubane core, one acetate ligand, and a portion of the [V 4 O 13 ] ligand are shown to avoid occlusion. To define the FF parameters, each atom is assigned an “atom type label”, such that atoms with the same label will use the same FF parameters but atoms with different labels can be assigned independent parameters. The assignment of atom types is shown in panels (ce), where each panel shows a different subset of the entire connectivity network to avoid occlusion. The three panels are related by a 120 or 240 degree rotation of the entire molecule, before occluded atoms are removed. See the text for further discussion of the atom type labeling. The Jahn–Teller axis OJ–MC–o present in [Mn III Mn 3 IV ] is highlighted as a red bold line in panels (ce).
Catalysts 11 00493 g001
Figure 2. Comparison of the bond and angle averages (dots) and standard deviations (error bars) between the QM/MM MD reference trajectory (black) and the MM MD trajectory with the final FF parameters (red). Panels (a,b) show the averages and standard deviations of the bond lengths, whereas panels (c,d) show the corresponding data for the bond angles. In (b,d), rectangles show the bond lengths from X-ray crystallography for comparison [17]. Bond lengths discussed in the text are marked with arrows in (b).
Catalysts 11 00493 g002
Figure 3. Mulliken spin populations of all Mn atoms in [Mn III Mn 3 IV ] along the QM/MM MD trajectory (a) and the MD trajectory (b). Here, MC is the Mn III atom. The spin populations were computed at the same level of theory as the reference QM/MM MD trajectories.
Catalysts 11 00493 g003
Figure 4. Distribution of vertical energy gaps from the trajectory snapshots at the BP86/def2-SVP level of theory. Panel (a) shows the gaps from the oxidized species (electron affinities), (b) shows the gaps from the reduced species (ionization energies). Panels (c,d) show the same data, but obtained at the B3LYP/def2-SVP level of theory.
Catalysts 11 00493 g004
Table 1. Results of the reduction potential computation (all in eV, except E R O in V) for MnV WOC using BP86 and B3LYP, based on 2000 snapshots from two MM MD trajectories.
PropertyBP86B3LYP
— from Figure 4
Δ E O 3.82 4.29
Δ E R 7.37 8.32
σ O 0.255 0.262
σ R 0.266 0.280
— Derived —
Δ A R O from Equation (11) 5.59 6.31
λ from Equation (12) 1.78 2.02
λ O from Equation (13) 1.26 1.33
λ R from Equation (13) 1.37 1.52
δ Δ A corr from Equation (14) 0.015 0.025
E R O from Equations (7) and (8) + 0.59 ± 0.28 + 1.31 ± 0.30
Publisher’s Note: MDPI stays neutral with regard to jurisdictional claims in published maps and institutional affiliations.

