Article

Optimizing Temperature Treatment of Copper Hollow Fibers for the Electrochemical Reduction of CO2 to CO

1
College of Engineering, University of Baghdad, Aljadria, Baghdad 47024, Iraq
2
Photocatalytic Synthesis Group, MESA+ Institute for Nanotechnology, Faculty of Science and Technology, University of Twente, P.O. Box 217, 7500 AE Enschede, The Netherlands
3
Films in Fluids Group—Membrane Science and Technology Cluster, University of Twente, P.O. Box 217, 7500 AE Enschede, The Netherlands
*
Authors to whom correspondence should be addressed.
Submission received: 2 April 2021 / Revised: 20 April 2021 / Accepted: 20 April 2021 / Published: 29 April 2021
(This article belongs to the Special Issue Catalysis for CO2 Conversion)

Abstract

:
Copper hollow fibers were prepared via dry-wet spinning of a polymer solution of N-methylpyrrolidone, Polyetherimide, Polyvinyl Pyrolidone, and copper particles of sizes in the range of 1–2 µm. To remove template molecules and to sinter the copper particles, the time of calcination was varied in a range of 1–4 h at 600 °C. This calcination temperature was determined based on Thermal Gravimetric Analysis (TGA), showing completion of hydrocarbon removal at this temperature. Furthermore, the temperature of the subsequent treatment of the fibers in a flow of 4% H2 (in Ar) was varied in the range of 200 °C to 400 °C, at a fixed time of 1 h. Temperature programmed reduction experiments (TPR) were used to analyze the hydrogen treatment. The Faradaic Efficiency (FE) towards CO in electrochemical reduction of CO2 was determined at −0.45 V vs. RHE (Reversible Hydrogen Electrode), using a 0.3 M KHCO3 electrolyte. A calcination time of 3 h at 600 °C and a hydrogen treatment temperature of 280 °C were found to induce the highest FE to CO of 73% at these constant electrochemical conditions. Optimizing oxidation properties is discussed to likely affect porosity, favoring the CO2 gas distribution over the length of the fiber, and hence the CO2 reduction efficiency. Treatment in H2 in the range of 250 to 300 °C is proposed to affect the content of residual (subsurface) oxygen in Cu, which leads to favorable properties on the nanoscale.

1. Introduction

The penetration of renewable electricity into the chemical industry provides potential for the development of electrochemical synthesis and storage methods [1,2]. Of particular interest is the electrochemical reduction of CO2. [3,4,5,6,7,8]. Au and Ag electrodes have been reported the best performing in the reduction of CO2 to CO [6,8], while some studies indicate Au electrodes can produce formate when the surface is functionalized with thiol-tethered ligands [9]. Cu has been identified as a versatile metal, allowing production of a variety of products in electrochemical reduction of CO2, including (oxidized) hydrocarbons [8,10,11]. To obtain high current densities for reduction of CO2, mass transfer of CO2 to the electrode surface should be optimized. Recently, Sargent and coworkers reported an electrode composition allowing very high Faradaic Efficiency towards ethylene [12]. In such gas diffusion configuration, CO2 is flown by the catalyst-electrolyte-interface, collecting gas phase products of reaction in the gas-flow. Some of us have recently reported the design of copper hollow fiber electrodes [13], which also provide high mass-transfer rates per volume, but now by a flow-through configuration [14]. Copper hollow fiber electrodes demonstrate excellent Faradaic Efficiency in conversion of CO2 to CO at optimized applied potential [13]. These Cu hollow fibers have been further modified by deposition of (nano)particles of e.g., Sn to promote electrochemical reduction of CO2 to formate [15], and can also be made of Ti [16] or Cu-Al alloy with perspective for applications in electrochemistry [16,17].
The present study is focused on the optimization of the high-temperature treatment of copper-based hollow fibers prepared by spinning of a mixture of N-methylpyrrolidone, polyetherimide, polyvinylpyrrolidone and copper particles of sizes in the range of 1–2 µm. Heat treatment is required to remove the polymer and to sinter the copper(oxide) particles to provide mechanical strength and porosity [13]. Subsequent reduction of copper oxide by hydrogen is needed to obtain high electrical conductance, and to prepare the active, ex-oxygen phase of Cu. The effect of very relevant temperature treatments on the performance of the hollow fibers have not been previously analyzed in detail, nor been optimized. Here, it is demonstrated that the electrochemical performance of the copper fibers prepared at different times of calcination, and temperature of treatment in hydrogen, show significant differences in performance, which is correlated to fiber morphology and porosity [17], as well as to the absence or presence of oxide after high temperature reduction, respectively.

2. Results

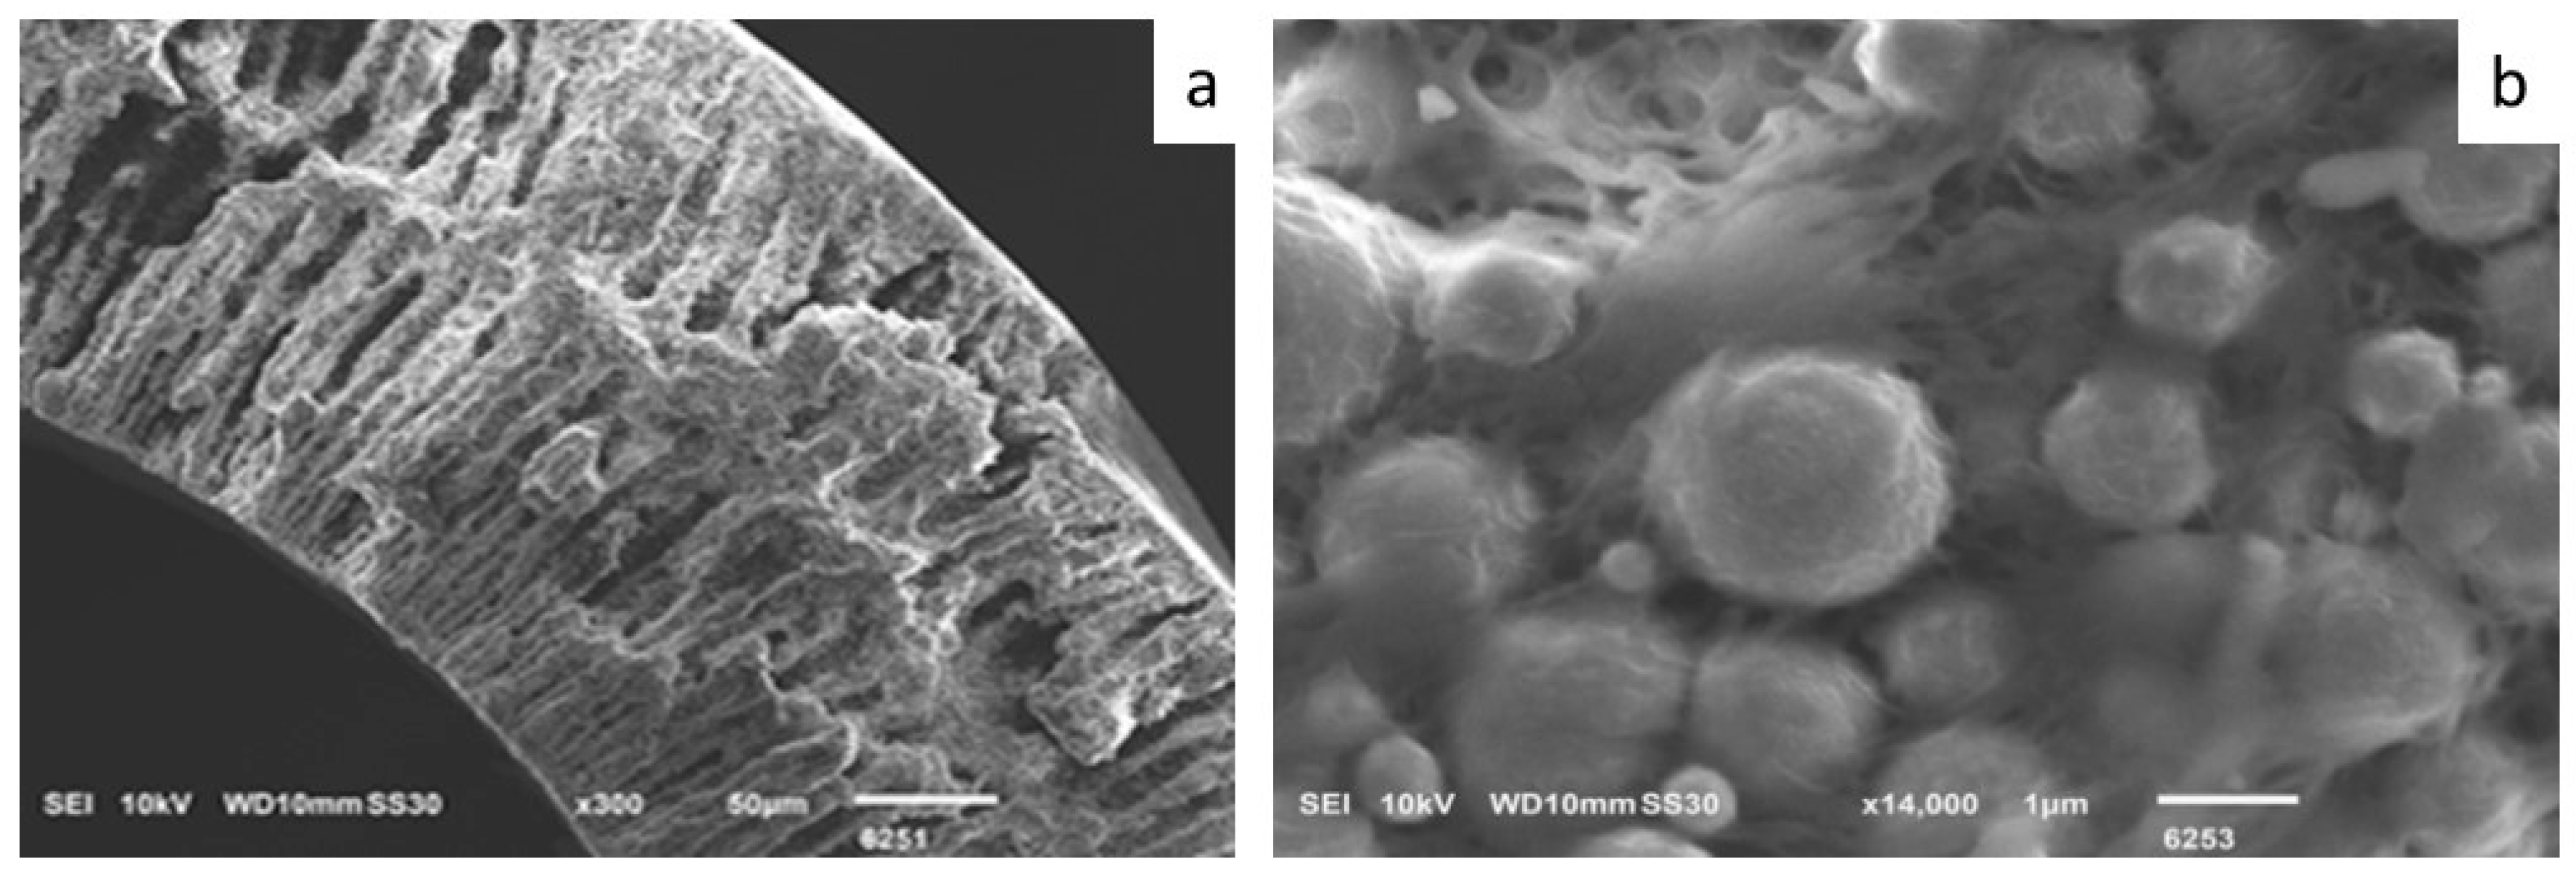
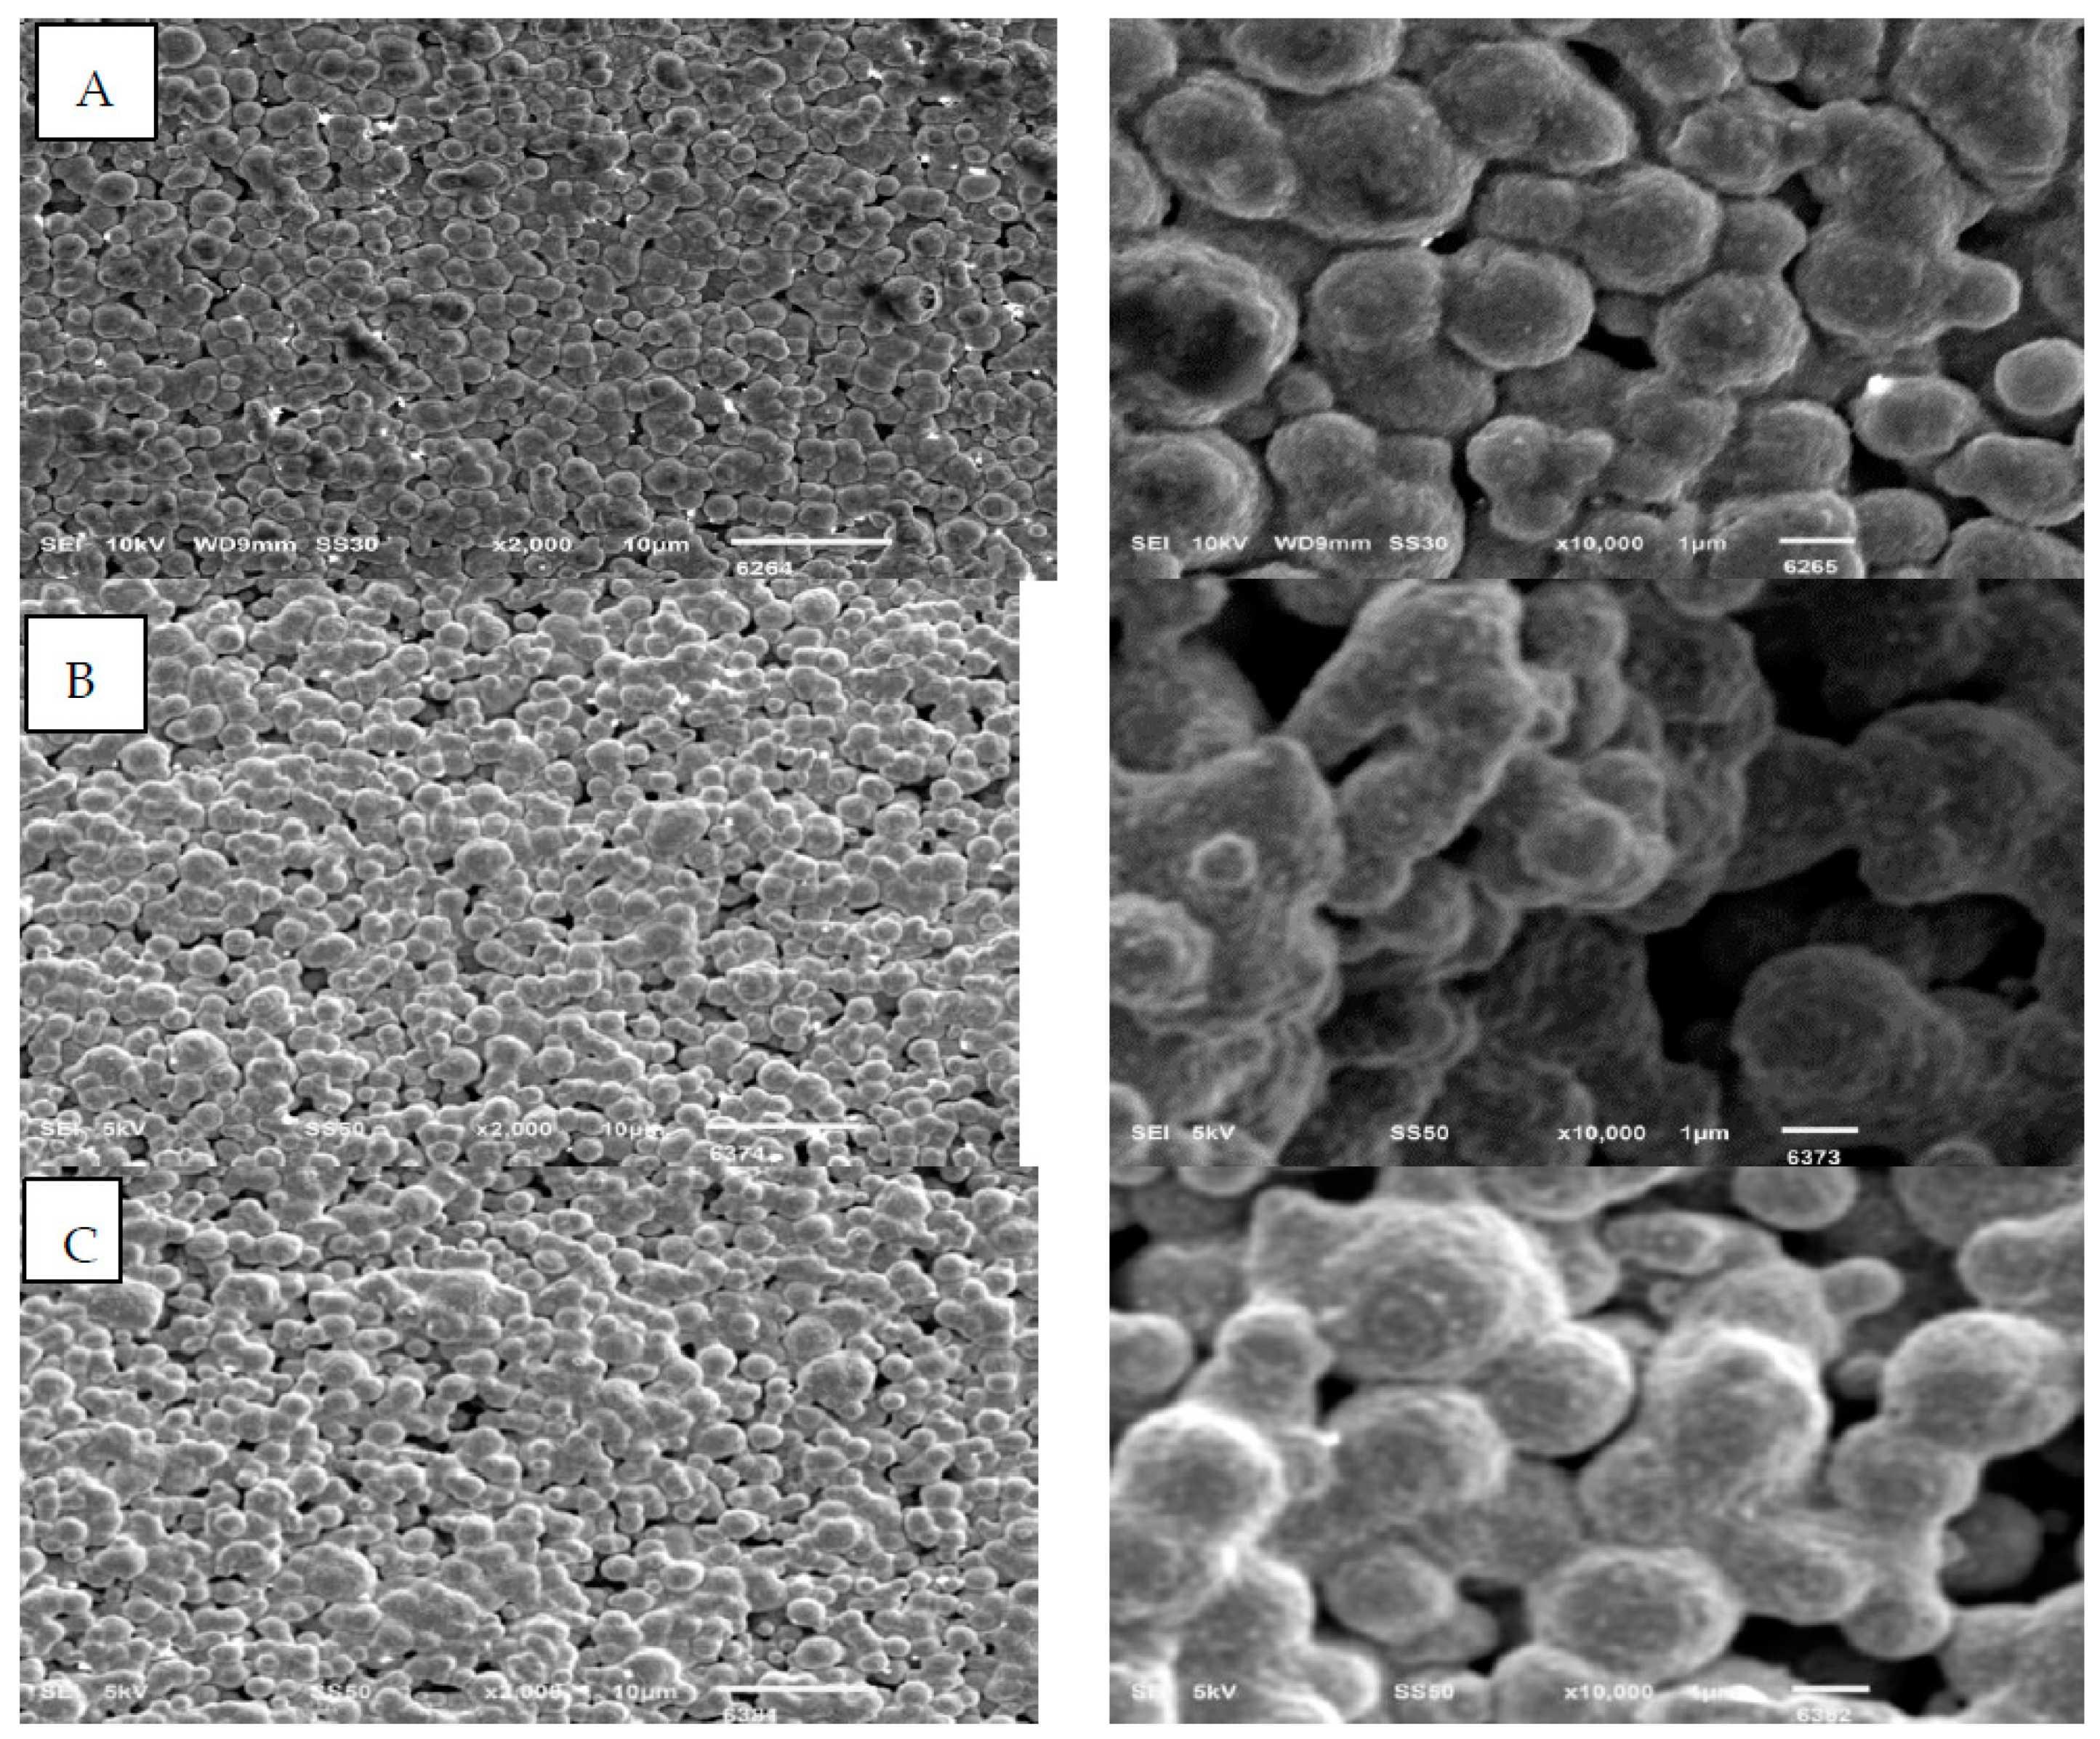
2.1. Morphology of the Fibers after Spinning
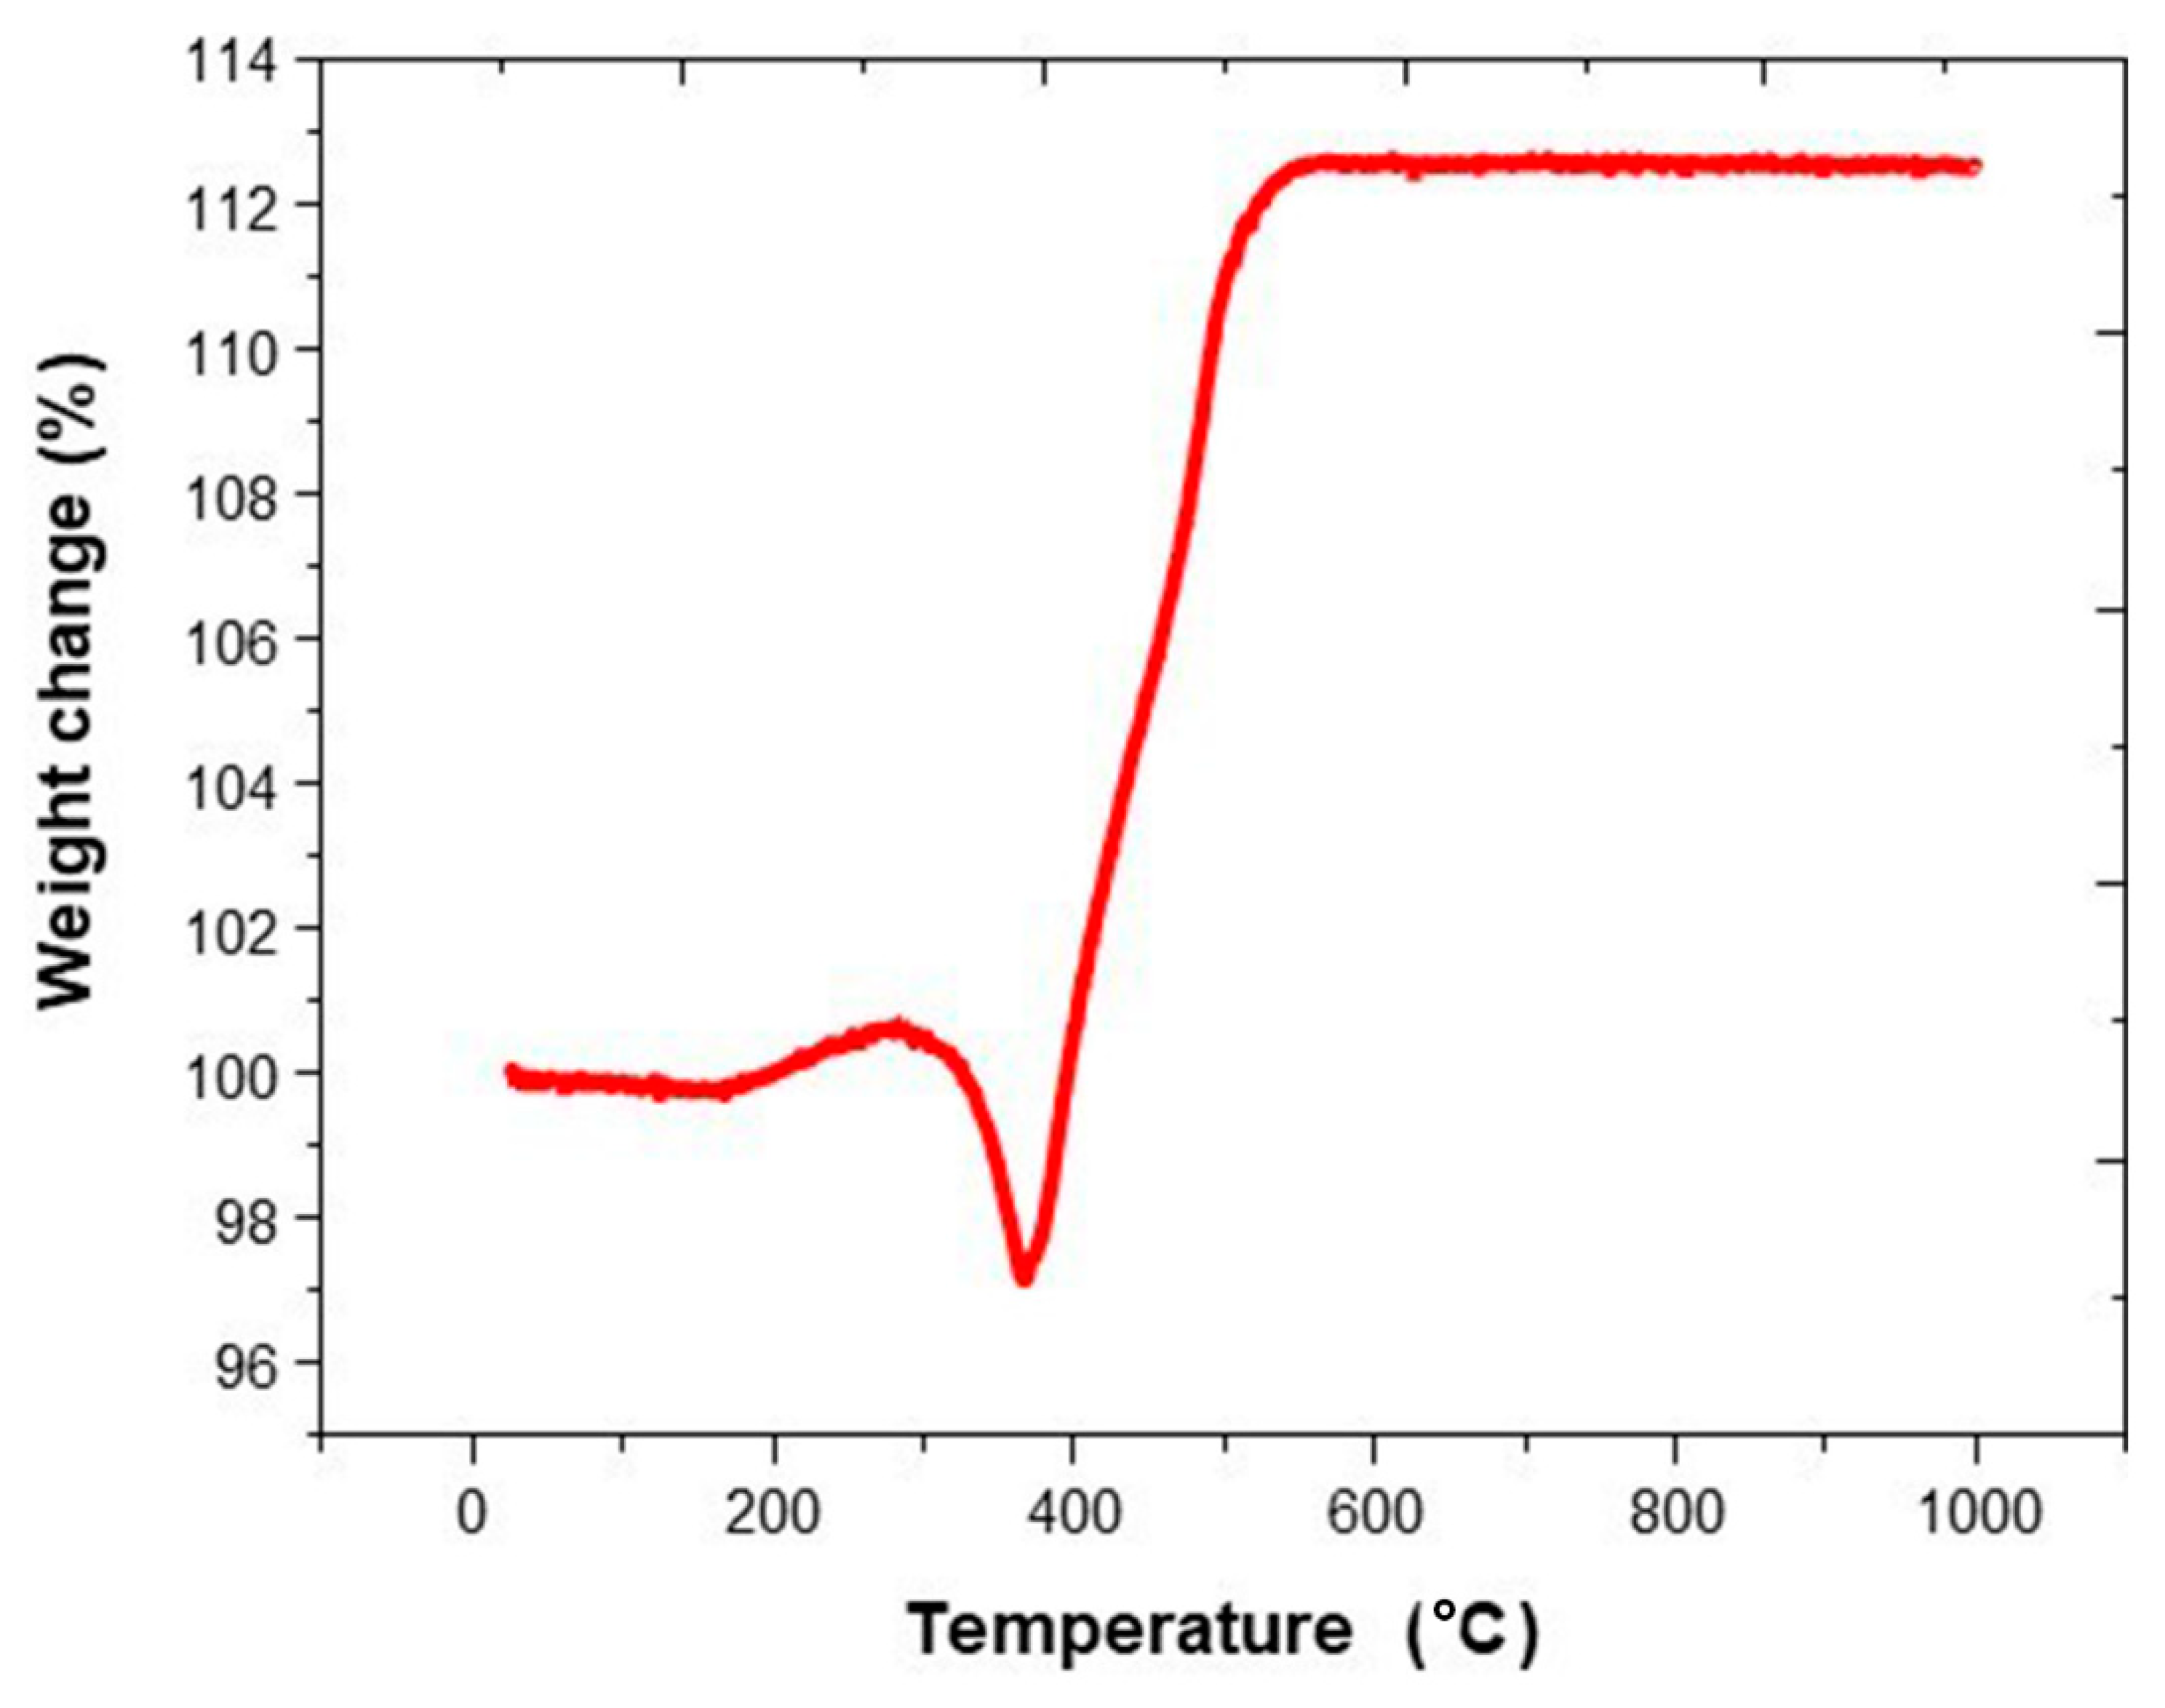
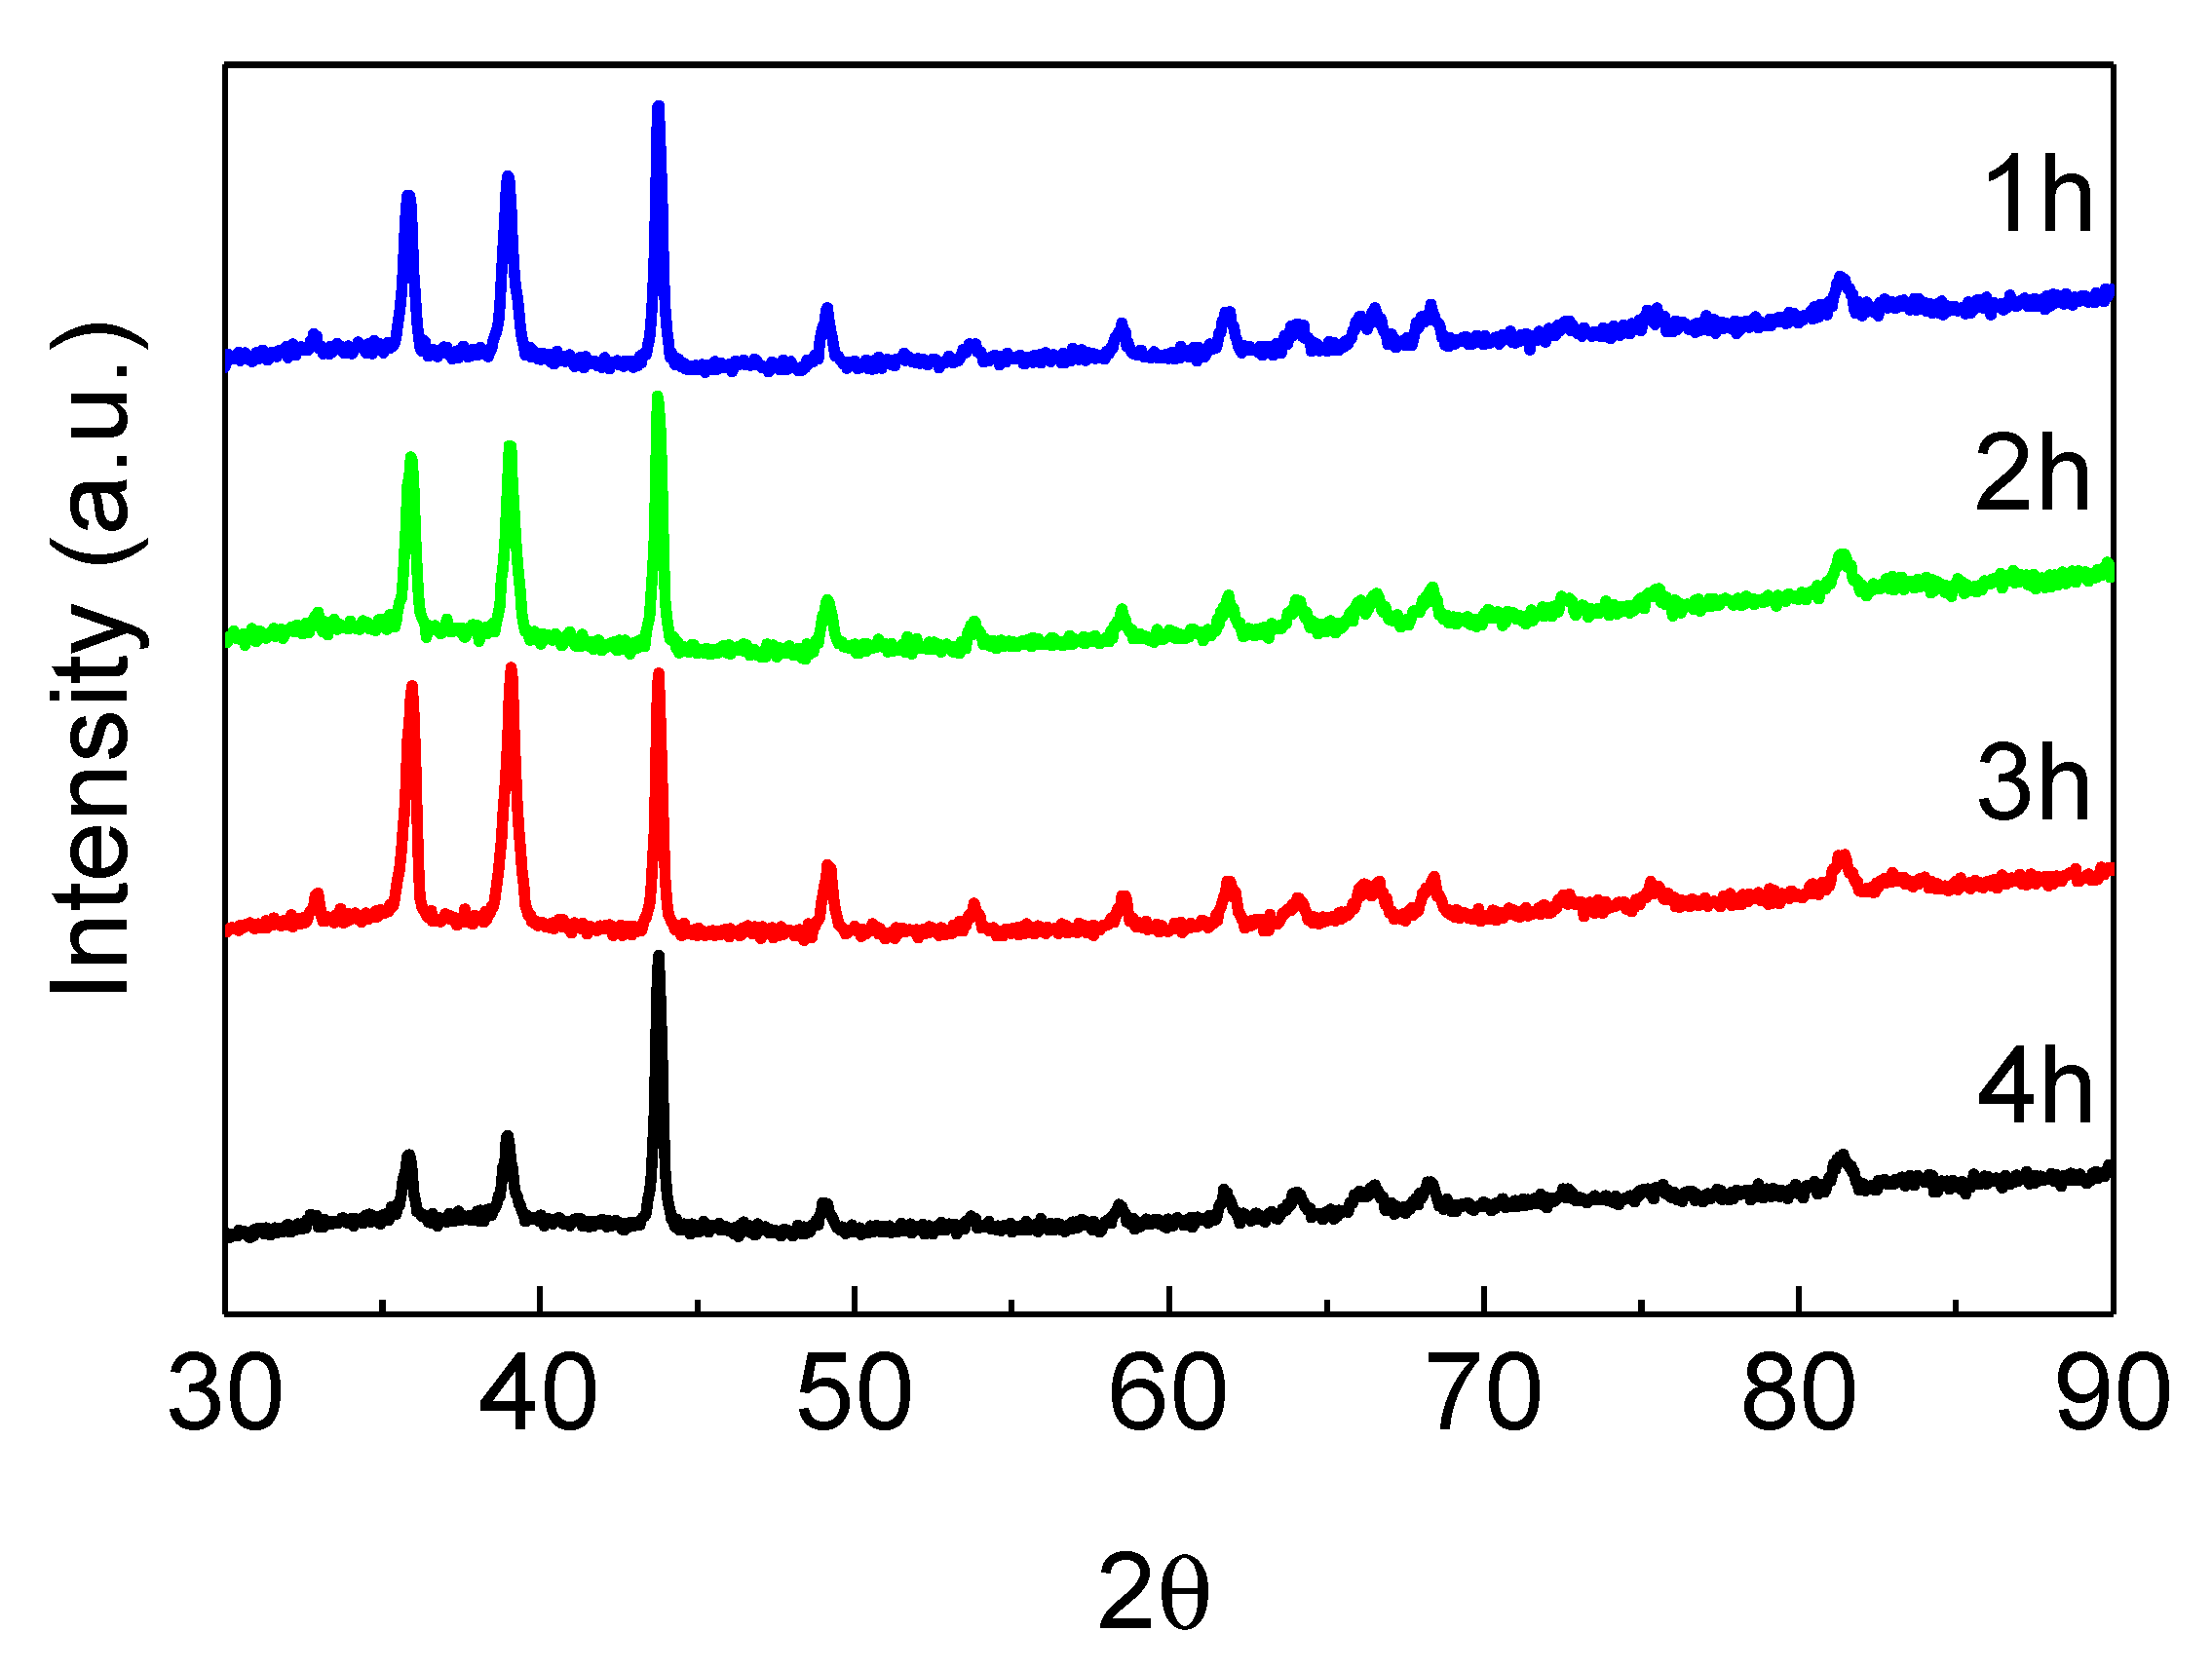
Figure 1a shows a SEM image of one of the fibers at low magnification, demonstrating the porosity of the wall, containing large channels of macro-porosity close to the inner and outer wall, separated by more dense domains. The average outer diameter, inner diameter, and thickness of the wall were measured to be 1.7, 1.2, and 0.3 mm, respectively, with an accuracy of 0.05 mm. Figure 1b shows more detail of the copper particles (spherical shape) located near the outer surface of the fiber, which are clearly contained and encapsulated in the polymer matrix.

2.2. Calcination

Thermogravimetric analysis (TGA) of the as prepared copper hollow fiber in the temperature range of 25 to 1000 °C shows temperature-induced transformations (Figure 2). Starting at approximately 200 °C, oxidation of the Cu particles is initiated to form CuO. Between the temperatures of 300–380 °C a decrease in weight is apparent (negative peak amounting to about 3%). This indicates the oxidative removal of the polymer, which is superimposed on continuous oxidation of the copper particles. Between 550–1000 °C weight changes are no longer apparent, demonstrating that 600 °C is sufficient to remove most of the polymer by oxidation, and Cu particles are fully oxidized to CuO. Therefore, this temperature was chosen to further investigate the effect of calcination time on the degree of sintering of the Cu (oxide) particles.
X-Ray diffraction patterns of the black hollow fiber after calcination at 600 °C for 1, 2, 3 and 4 h reveal major reflections of CuO (JCPDS 45-0937) (See Figure A1). Although after 4 h, differences in relative intensity can be noted in comparison to calcination at shorter times, indicative of changes in preferred crystal orientation, it can be concluded that the oxidation of Cu to CuO is indeed complete after 1 h of treatment at 600 °C, in agreement with the TGA data of Figure 2.
Rodriguez, et al. [18] investigated whether exothermic oxidation of metallic copper particles occurs in one step, or in two consecutive steps through the intermediate Cu2O. Since (traces of) Cu2O could not be detected by XRD, even after short calcination times at 600 °C, we assume CuO forms directly through oxidation of Cu particles. This is also in agreement with a study by Zhu et al. [19], who stated that CuO grains grow directly and fast at the temperatures applied in the present study.
The apparent structural parameters of the hollow fibers (outer diameter, inner diameter, and wall thickness) do not show significant changes (Figure A2) when the time of calcination is longer. The SEM images after oxidation (Figure A3) show that besides the removal of the polymer and oxidation of the Cu particles, sintering occurs. The main difference seems to be the increased amount of particles in one, sintered agglomerate, when the calcination time is extended from 1 to 4 h. We assume this will lead to less, but bigger pores from which the gas can be transported through the outer wall, as is apparent from the images taken of the outer wall at low magnification.

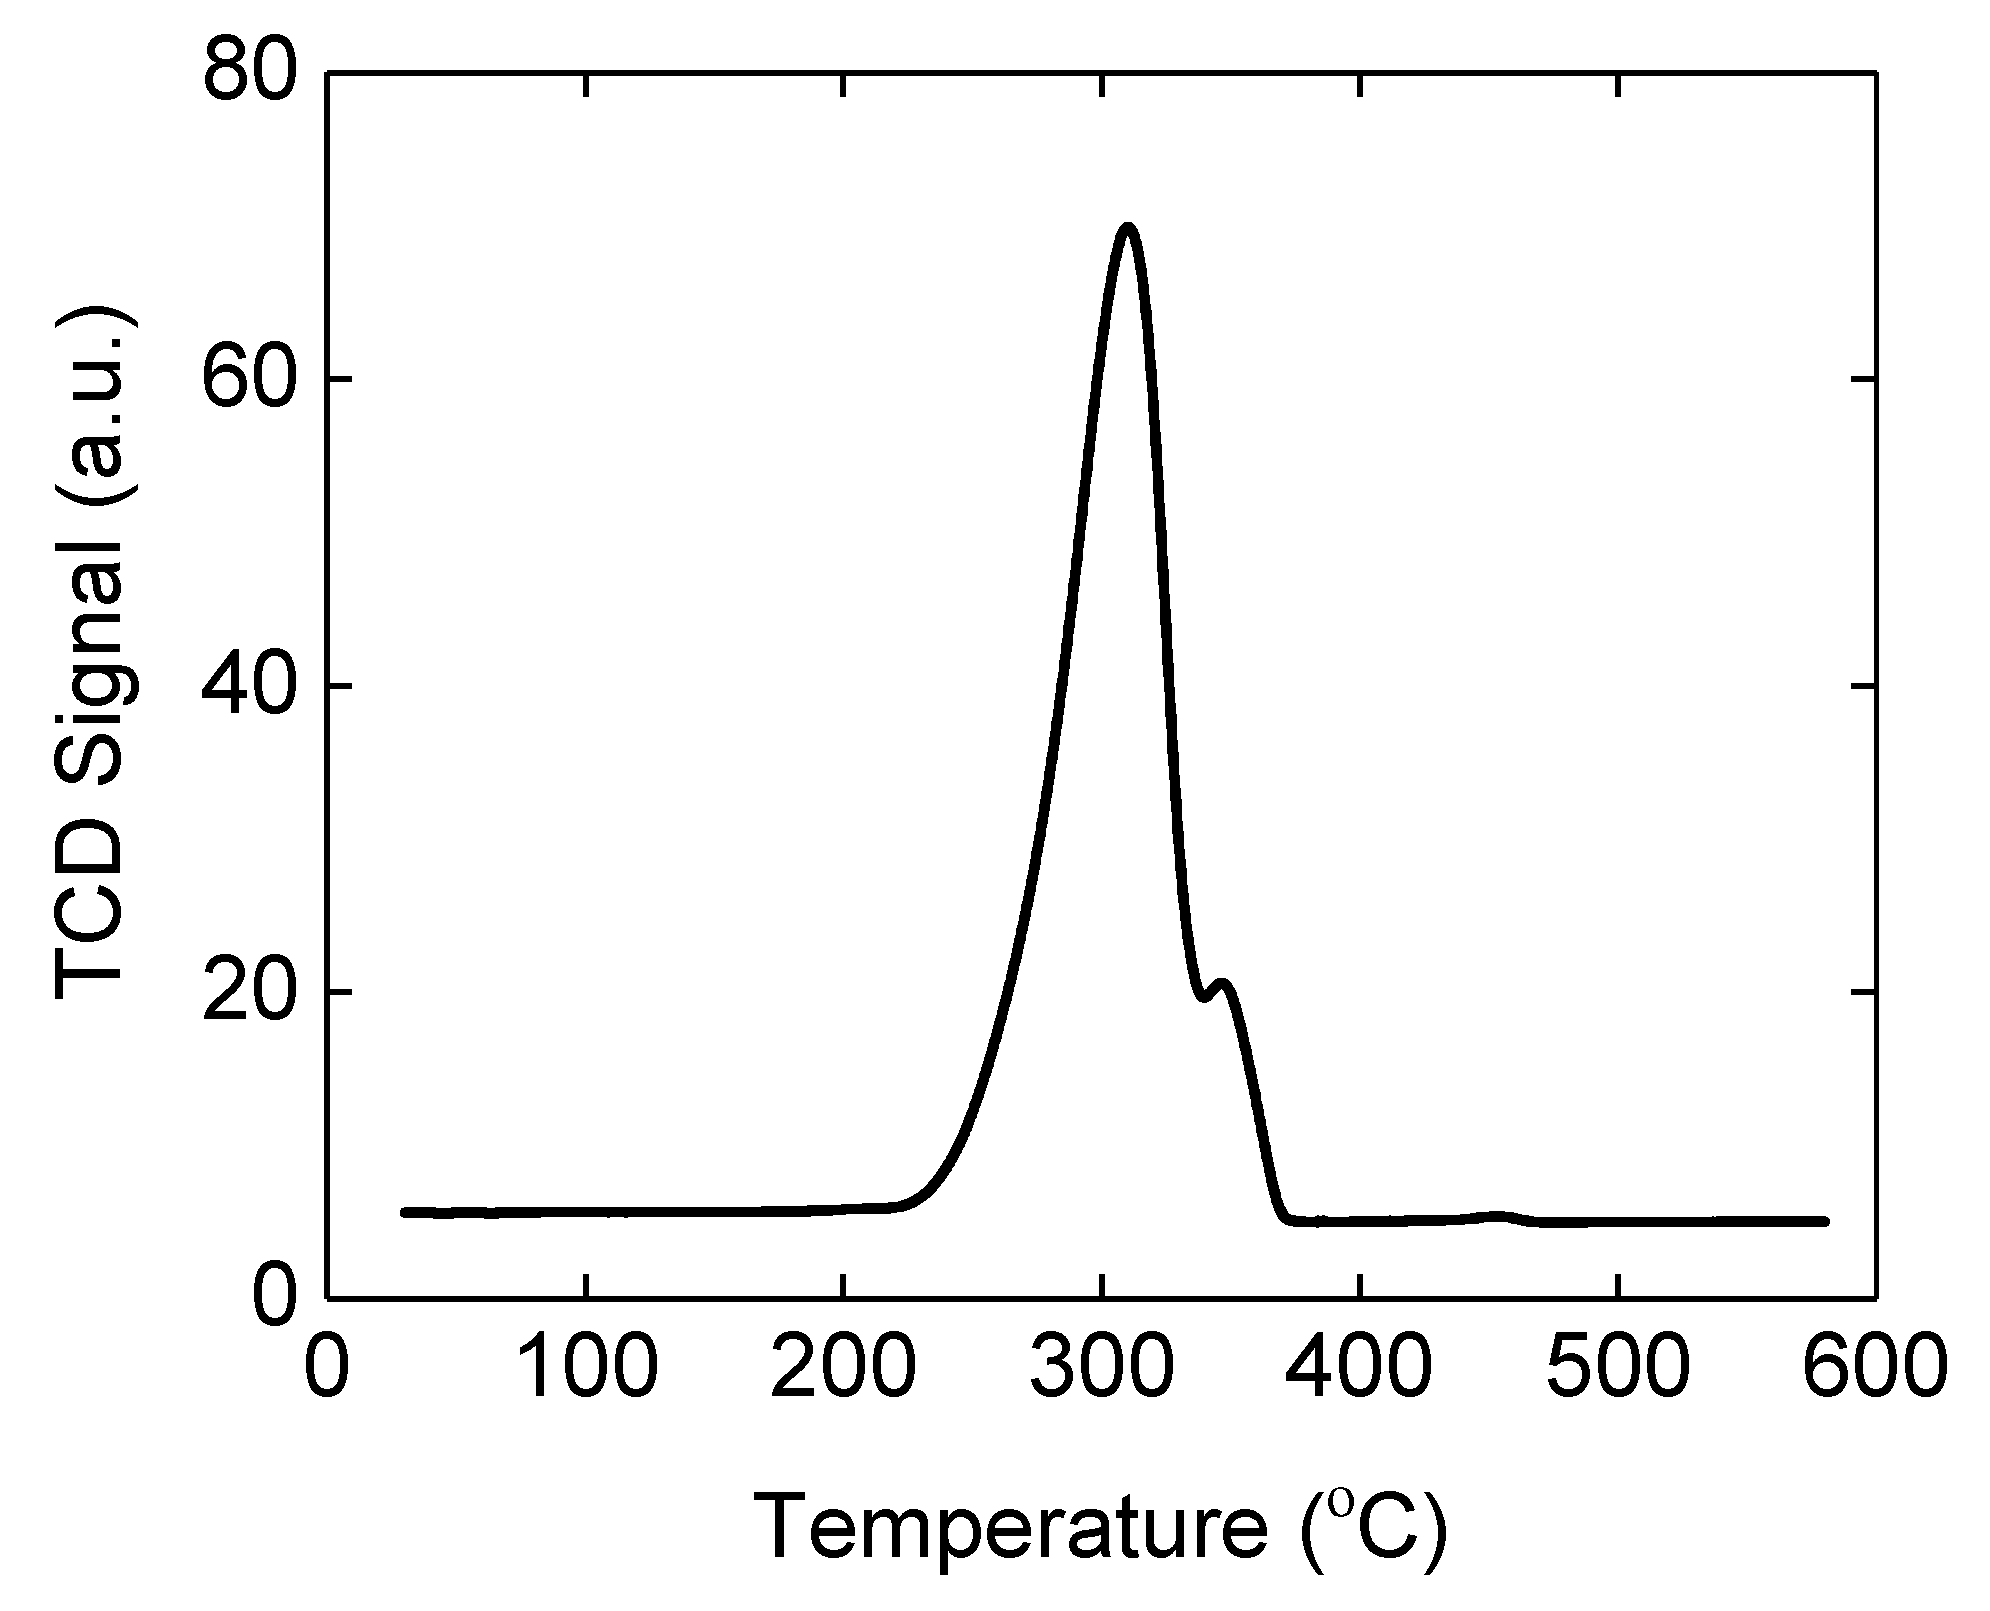
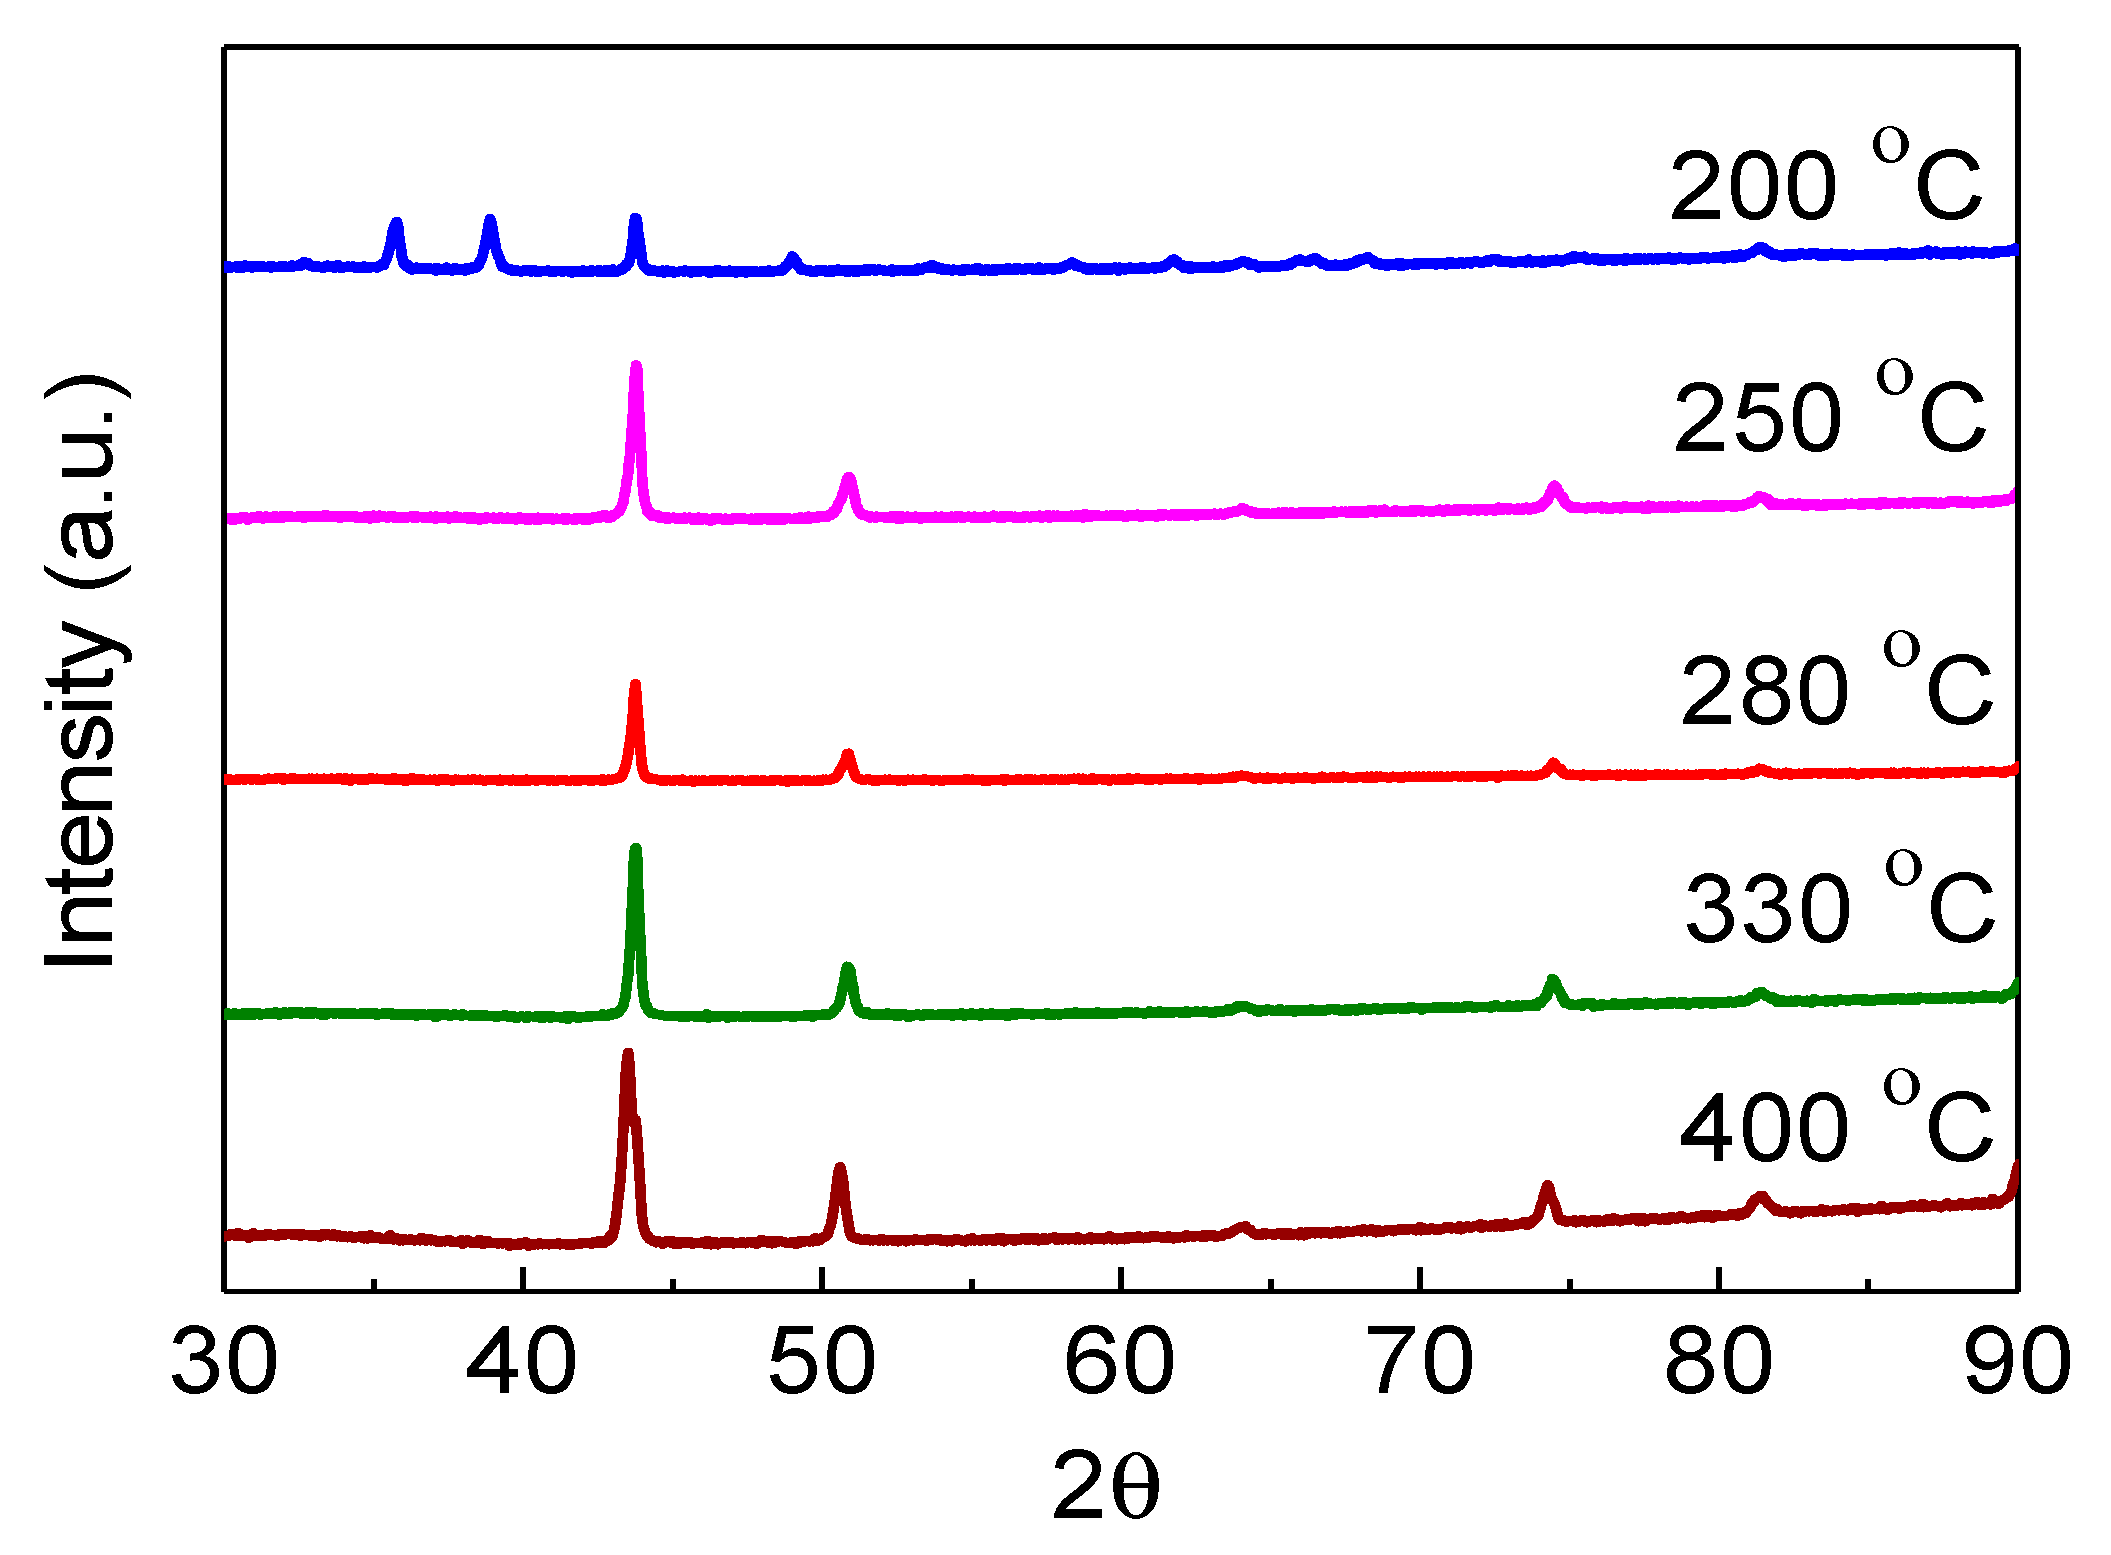
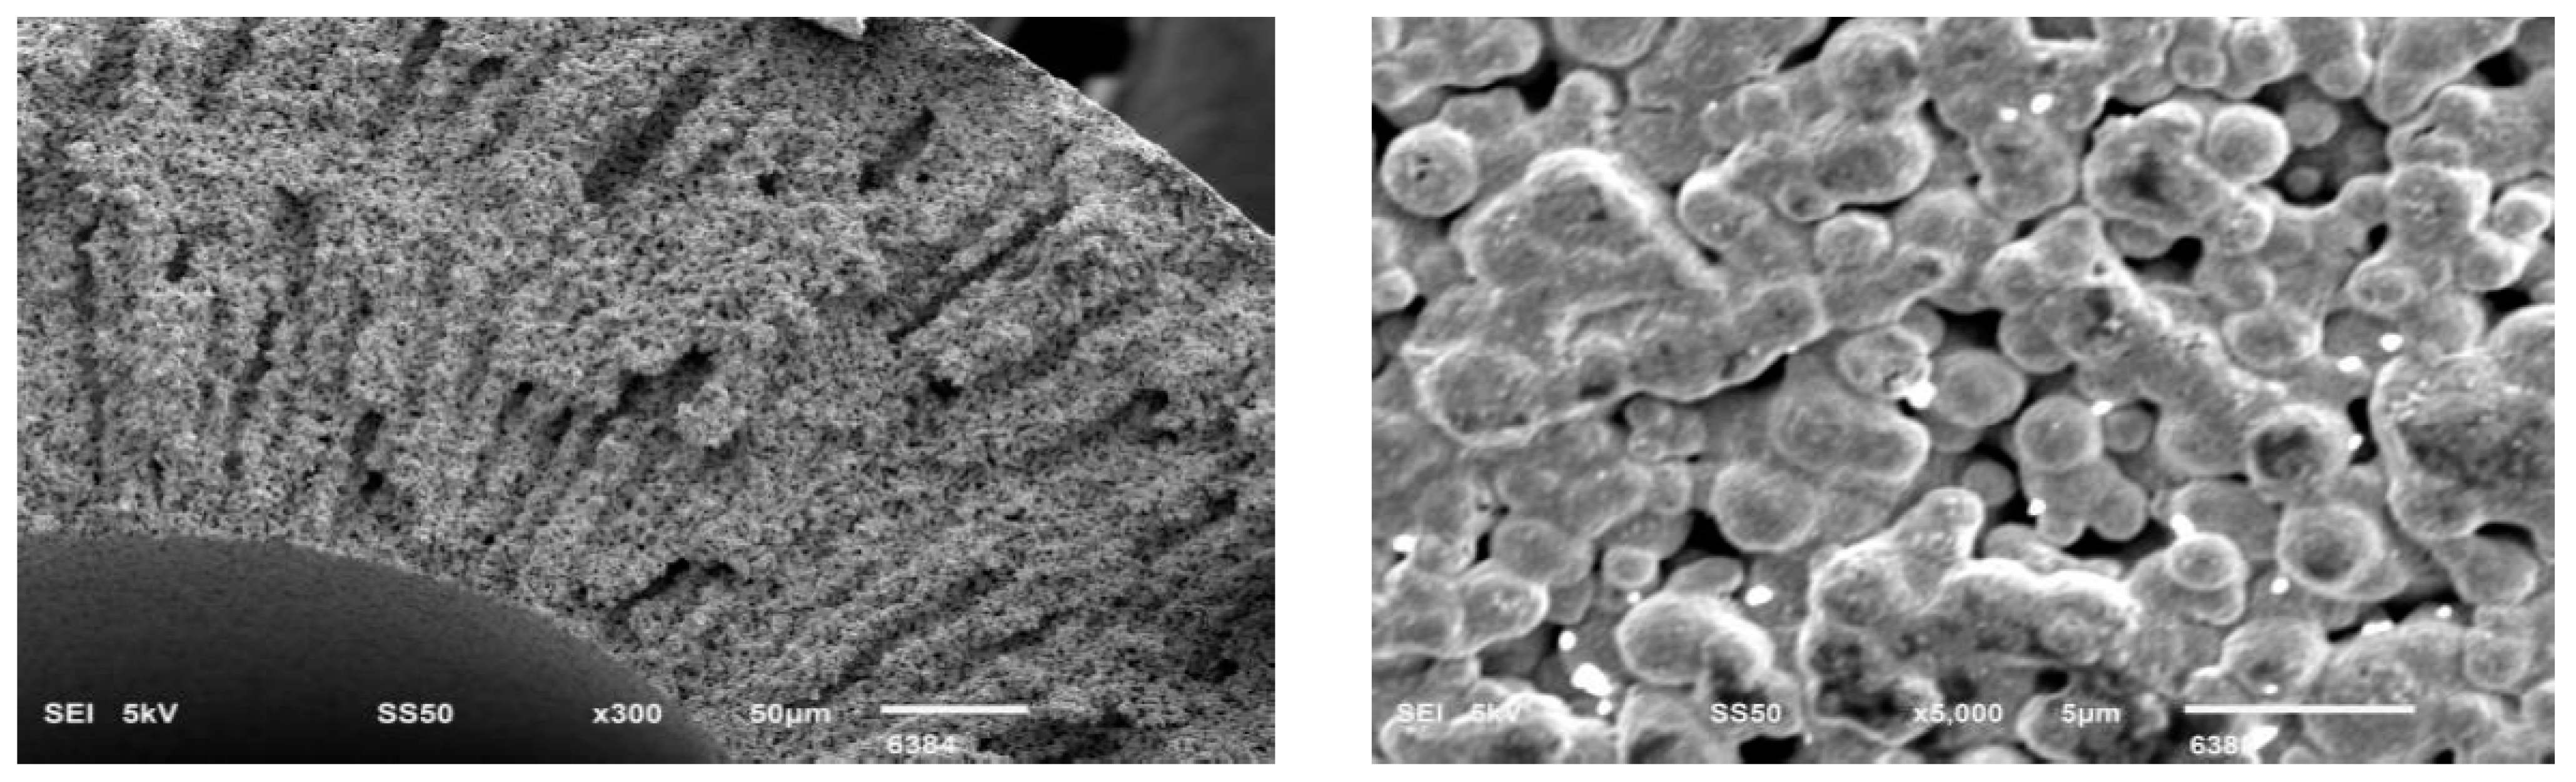
2.3. Reduction of Oxidized Fibers in 4% H2

The reduction of copper oxide hollow fibers in 4 vol-% H2 (in Ar) initiates at a temperature of approximately 200 °C, as shown in the TPR profile depicted in Figure 3.
A maximum in reduction rate is observed at 300 °C, followed by a small peak at 350 °C. Figure A4 shows the X-Ray diffraction patterns of copper hollow fibers obtained after reduction for 1 h in 4 vol-% H2 at 200, 250, 330, and 400 °C, respectively. A temperature of 200 °C in 4 vol-% H2 is insufficient to reduce CuO to Cu, in agreement with the TPR profile, and diffraction lines of CuO are still dominant. Above 200 °C, diffraction lines appear at 2Ɵ = 43.3, 50.4, and 74.1, indicative of metallic copper. The XRD patterns do not show any features of cuprous oxide.
Reduction of CuO has been extensively investigated and proceeds according to the following equations [18]:
2 CuO + H2 → Cu2O + H2O
Cu2O + H2 → 2 Cu + H2O
CuO + H2 → Cu + H2O
The temperature required for initiation of reduction of CuO in H2 atmosphere depends on the ease of initial nucleation and formation of the reduced phase [19], which is dependent on the water vapor pressure [19]. Wang and Yeh [20] summarized the steps required for reduction of CuO as follows: first, diffusion of H2 to the oxide surface occurs, followed by adsorption of H2 on the active oxide sites, subsequent formation of metal nuclei through reduction, accompanied by formation of H2O, and finally water removal. Rodriguez et al. [18] demonstrate that the reduction of CuO requires an initiation period. Kim et al. [21] also performed time-resolved XRD analysis, and stated that the heating rate is important in determining the formation of Cu2O: at rates smaller than 10 °C·min−1 Cu2O was not identified, but at higher heating rate the intermediate phase becomes evident. At large heating rates, the reduction of CuO actually occurs only at temperatures greater than 450 °C. Even though we applied a heating rate of 5 K°C.min−1, we do observe a shoulder on the reduction profile at 350 °C.
We assign this second reduction peak to reduction that is mass transfer limited, most likely reduction of the core of the particles. As shown in the SEM images, the individual particles, and even more so the clustered agglomerates, have significant size in the order of several tens of micrometers, and hence a delay in reduction of the core is likely. In summary, the obtained TPR profiles and reduction temperature required for the formation of metallic copper are in agreement with the literature, and formation of copper requires at least 250 °C, while complete reduction likely requires higher temperatures, to overcome transport issues of oxygen and or hydrogen migration from/to the interior of the particles and to/from the surface.
After reduction, various SEM pictures were taken of the reduced samples. Within the error of measurement, the average outer and inner diameter do not significantly vary as a function of reduction temperature. Figure A5 presents the low and high magnification of the cross-section of the wall, and shows the pore size distribution over the thickness of the wall has not significantly changed by the applied temperature procedures (compare Figure 1). Details of sintering degree of the particles show that the reduction of the fiber in 4% H2 for 1 h at 200 °C, does not significantly alter it (compare Figure A3). Figure A6 provides a typical view of the porosity of the fiber, demonstrating the high degree of sintering induced by the treatment in oxygen.

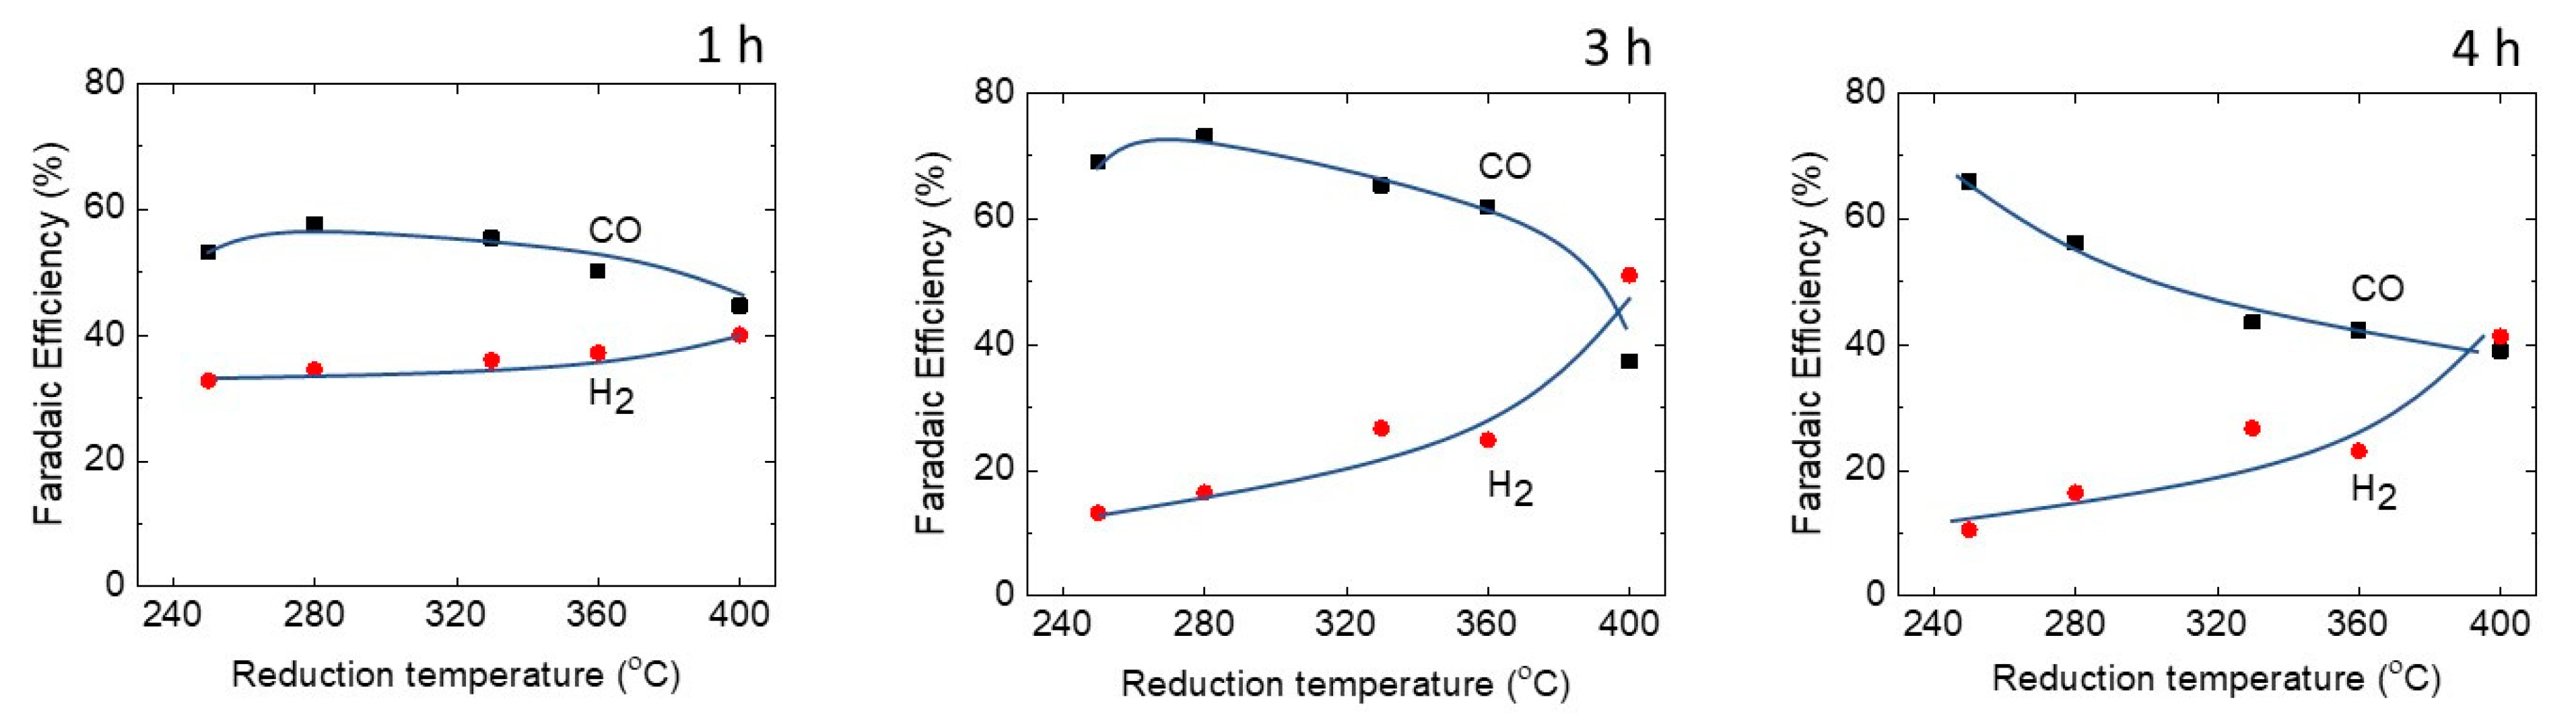
2.4. Performance of the Cu Hollow Fibers in CO2 Reduction

The effect of preparative variables (temperature of oxidation of the fibers at variable times, and the effect of the treatment temperature in 4% H2) on the performance in the electrochemical conversion of CO2 is shown in Figure 4 and Figure A7. Calcination was performed at 600 °C for 1 h, 3 h, and 4 h, while the temperature of reductive treatment was varied between 250 and 400 °C. The current densities of various samples are shown in Figure A7. When the reduction time is plotted versus the current density for the different calcination durations, the reduction temperature of 280 °C yields the highest current for 1–3 h of calcination. For 4 h of calcination, the current is the highest at 250 °C. Increasing the reduction temperature results in lower currents for all samples.
The two most obvious observations of Figure 4 include the significant improvement in FECO when the calcination time of the fibers is prolonged from 1 to 3 or 4 h (maximizing at 75% (3 h) vs. 55% (1 h)), while in all cases the FECO decreases (and the FE in H2 increases) as a function of increasing temperature of treatment in hydrogen. In particular for the sample calcined for 3 h, the most significant decrease in FE of CO occurs above 360 °C. The trends we show in Figure 4 for the FE of CO, generally are mirrored by the FE of hydrogen (a decreasing FE in CO generally leads to a similar amount of increasing FE towards hydrogen). It is well known from the literature that the additional product is formate [13], formed with FEs of ~10–20% in our study, which, on the basis of the results of Figure 4, can be assumed to be relatively constant.
The maximum Faradaic efficiency obtained (73.1%) at a potential of −0.45 V vs. RHE was almost twice that reported for copper nanoparticles at a potential of −0.4 V [22]. The stability of copper hollow fibers in delivering the performance shown in Figure 4 is high. Stability of copper electrodes generally is an issue in CO2 electroreduction [23], and several reasons for deactivation have been proposed, including deposition of contaminants, formation of carbon [23,24,25,26], or recently the formation of (oxide associated) carbonate, which prompts catalyst deactivation by restraining effective charge transport. [27] As previously reported, the activity of the hollow fibers does not significantly decrease within 24 h, besides a drop in current density of approximately 10% within the first 7 h, as was mentioned in our previous study [13].

3. Discussion

Here we discuss the trends in FEs of CO and H2 on the basis of mass transfer phenomena, affected by the porosity of the wall, and the reaction kinetics, affected by the crystallinity and degree of reduction of the (sintered) copper particles.
The pore structure of the hollow fibers is largely determined by the time of the oxidation treatment at 600 °C, and the degree of sintering, which is shown in Figure A3, Figure A5 and Figure A6. As stated previously, the degree of sintering is higher for samples treated for an extended period of time at 600 °C in air (Figure A3), which leads to a more even distribution of relatively large pores over the length of the fiber. When sintering is not extensive, large pores exist more locally, which induce preferential flow of CO2. In other words, the extensive sintering leads to improved gas exiting profiles, and therefore to enhanced gas-liquid mixing by convection near the wall of the fiber, similarly to manipulation by changing the gas velocity [13]. Enhanced mixing leads to higher current densities (Figure A7) and improved FE towards reduction of CO2 to CO. Quantification of mixing phenomena as a function of porosity is beyond the scope of the present study, but will be addressed in a future publication for Ti hollow fibers, including determination of the ElectroChemical Surface Area (ECSA) and Impedance Spectroscopy. Manipulation of the ECSA of hollow fibers has recently been demonstrated to lead to improved electrochemical performance [17].
The effect of the hydrogen reduction temperature on FE is more difficult to explain, and we can only speculate. The temperature for reduction is significantly lower than that used in the oxidation procedure, and several SEM images confirm that the degree of sintering (and hence the pore structure) does not significantly change. As shown in the TPR profiles of Figure 3, and as has been discussed, reduction of copper oxide occurs in the temperature range of 240–400 °C, a second peak indicating mass transfer limited phenomena. Reduction of CuO has been analyzed in extensive detail by Kim et al. [21]. It is conceivable, given the relatively large size of the individual particles, and in particular the sintered clusters, that reduction of the inner core is not fully complete at the lowest reduction temperatures applied, and that oxide domains are present in the interior [21], even though this is not directly evident from the XRD profiles (see Figure A4). This seems to suggest that the presence of some residual oxide might be beneficial in suppressing hydrogen formation and favoring FE towards CO2 reduction products. As shown in Figure 3, at least 360 °C appears to be necessary to fully reduce the sample, which agrees with the most significant reduction in FE towards CO after hydrogen treatment above this temperature (falling from 62% to 37% (!); see Figure 4). The role of the initial presence of (sub-surface) copper oxide in achieving a high FE towards CO2 reduction products has been frequently observed and discussed in the existing literature. Both formation of specific grain boundaries or strain in the samples after electrochemical reduction [23], or a direct effect of (sub-surface) oxide have been proposed [27,28,29].
In summary, this study provides guidelines for the optimization of the high temperature treatment of Cu hollow fibers after spinning. Yet, the current densities achieved with the hollow fiber morphology are still significantly lower than reported for carbon cloth or carbon paper based (flow by) gas diffusion cells [12]. Enhancement of geometrical area of a single fiber has been achieved by introduction of a second stage of porosity into metallic hollow fiber electrodes, but reported current densities remain in the range of 15–20 mA·cm−2 [17]. We presently investigate the option of creating bundles of several fibers, which should increase conversion per volume of the applied electrochemical reactor.
Future study is also aimed at the evaluation of the mass transfer effects induced by the exiting gas bubbles, as a function of porosity and gas flow rate. In addition, the effects of gas impurities on the performance of hollow fiber electrodes are investigated. Finally, the impact of high temperature treatment (in particular duration) on the economics of an electrochemical process operated with hollow fibers, is assessed.

4. Materials and Methods

4.1. Preparation of Copper-Polymer Spinning Mixtures

Copper powder with particle sizes in the range of 1–2 µm (Skyspring nanomaterials) was added to N-methylpyrrolidone (99.5 wt%, Sigma Aldrich, Darmstadt, Germany, in a ratio of 70 wt-% to 22 wt-%, followed by stirring for 30 min. Subsequently, Polyetherimide (PEI, Ultem1000, General Electric, Boston, MA, USA) to the amount of 7 wt% was added to the mixture mentioned above and kept in a water bath at 50 °C for 1 h, and subsequently at 60 °C for 2 h. The mixture was cooled and stirred at room temperature overnight. Finally, PolyVinyl Pyrolidone (to the amount of 1 wt%) was added to the mixture, to enhance viscosity, again followed by stirring overnight. Prior to spinning, the spinning mixture was degassed by applying vacuum for 90 min, and then kept overnight under an atmosphere of dry air.

4.2. The Spinning Process

The spinning mixture was pressurized in a stainless vessel using nitrogen (1 bar), and consecutively pressed through a spinneret (inner and outer diameter of 0.8, and 2.0 mm respectively). De-ionized water was pumped through the bore of the spinneret with a speed of 30 mL min−1. The coagulation bath contained tap-water and the length of the air gap was 3 cm. The spinning experiment was carried out at ambient temperature. After spinning, the fibers were first kept in a water bath for 1 day to remove traces of NMP, followed by drying for 1 day against the laboratory atmosphere.

4.3. Treatment of the Fibers at Elevated Temperatures

The thus-obtained green copper hollow fibers were calcined at 600 °C for 1, 2, 3, and 4 h (heating rate 1 K min−1) in a static air atmosphere in porcelain crucibles, to remove of the polymer and induce sintering of the copper (oxide) particles. The calcined copper oxide hollow fibers were subsequently treated at 200, 250, 280, 330, 360, or 400 °C for 1 h in a flow of H2/Ar containing 4 vol-% H2, using a heating rate of 1.5 K min−1. The fibers were cooled in H2-atmosphere, and passivated by slow oxidation of the surface against the laboratory atmosphere at room temperature. This way, a variety of copper hollow fibers was obtained.

4.4. Characterization

Thermogravimetric analysis (TGA) was performed on a Netzsch STA 449 F3 instrument under air environment at a heating rate of 1 K min−1 over a temperature range of 25–1000 °C. The X-ray diffraction (XRD) patterns were recorded using a Bruker D2 PHASER diffractometer (Billerica, MA, USA), equipped with a Cu-Kα source and operated at 30 kV and 10 mA. TPR profiles of oxidized fibers were obtained under H2 (4% in Ar) flow of 30 cm3/min, applying a heating rate of 5 K min−1 over a temperature range of 50–600 °C. To this end, the oxidized fibers were crushed into particulate matter, and inserted as powder in a fixed-bed quartz flow reactor. SEM analysis was performed using a JEOL JSM 5600 LV instrument (Tokyo, Japan). The SEM micrographs of both surface and cross-sections were recorded at various magnifications.

4.5. Determination of Electrochemical Performance

A glass cell reactor consisting of a three electrode assembly at room temperature and pressure was used to assess the performance of the copper hollow fibers. A Pt mesh was used as counter electrode and was separated from the working electrode using a proton exchange membrane (Nafion 112 Sigma Aldrich). A Ag/AgCl (3 M KHCO3 BASI, West Lafayette, IN, USA) reference electrode was placed near the working electrode. The reactor was filled with 100 mL, 0.3 M KHCO3 (99.95%, Sigma Aldrich) and purged with CO2 at least 30 min before each experiment. The applied cathodic potential for all experiments remained constant at −0.45 V vs. RHE. The potential vs. RHE was calculated according to Nernst law, using the potential vs. Ag/AgCl (0.198 V) and the pH of the solution (pH = 7.2). This potential was selected on the basis of a previous study [13], demonstrating that at more negative potentials the evolution of hydrogen significantly increased, reducing the Faradaic Efficiency (FE). During the electrolysis, CO2 was purged continuously through the fiber at a rate of 20 mL min−1, which was previously determined to be the optimum flow rate [13]. The gas-phase reactor effluent was sampled via gas chromatography (GC) once every 6 min. CO, CO2, H2, and hydrocarbons were separated using two different columns (a ShinCarbon 2 m micropacked column and a Rtx-1 column). A thermal conductivity detector and flame ionization detector were used to perform the quantitative analysis of the gas-phase products. The time needed to reach steady-state concentration was 10 min; thus, the reaction was performed for at least 20 min at each experimental condition. A control experiment was conducted at −0.45 V versus RHE under argon atmosphere. CO was not detected in such experiment, showing that residues of the polymers used during preparation of the hollow fibers did not contribute to CO formation in the electrochemical CO2 reduction experiments.

5. Conclusions

We studied the effect of calcination time (1–4 h at 600 °C), and temperature of treatment in hydrogen (200–400 °C in 4 vol-% H2 in Ar) on the performance of copper hollow fibers in the electroreduction of CO2 to produce CO. The highest Faradaic efficiency towards CO is obtained when the calcination is performed for as long as 3 h at 600 °C. This calcination time results for a variety of reduction temperatures in the highest Faradaic efficiency towards CO, while a reduction temperature of 280 °C seems to be optimal. For these conditions, the faradaic efficiency amounts to 75%, at a geometric current density of ~10.5 mA·cm−1. The optimized combination of treatment in oxygen and hydrogen can be explained on the one hand by a favorable porosity and thus gas distribution over the length of the fiber, and on the other hand by incomplete reduction and presence of residual oxide prior to electrochemical performance testing.

Author Contributions

K.K.H., R.K., A.S., G.M., and N.B., conceptual discussion; K.K.H., experimental work; K.K.H., writing—original draft preparation; K.K.H., A.S., G.M., and N.B., writing—review and editing; G.M. and N.B., funding acquisition. All authors have read and agreed to the published version of the manuscript.

Funding

This work took place within the framework of the Institute of Sustainable Process Technology, co-funded with subsidy from the Topsector Energy by the Ministry of Economic Affairs and Climate Policy, The Netherlands.

Data Availability Statement

Data are available upon request by sending an Email to the corresponding authors.

Conflicts of Interest

The authors declare no conflict of interest.

Appendix A

Figure A1. XRD patterns of crushed hollow fibers calcined at 600 °C for different times (1, 2, 3 and 4 h, respectively). The diffraction lines indicate the fibers are composed of CuO after calcination.
Catalysts 11 00571 g0a1
Figure A2. Fiber dimensions as obtained for fibers calcined at 600 °C for different times. Within the error of measurement, the diameters and wall thickness do not significantly change.
Catalysts 11 00571 g0a2
Figure A3. SEM images at low magnification showing surface morphology (left) and at high magnification showing details of the porosity (right), after calcination of the copper hollow fiber at 600 °C for (A) 1 (B) 3 and (C) 4 h.
Catalysts 11 00571 g0a3
Figure A4. XRD patterns of crushed hollow fibers calcined at 600 °C for different times, followed by reduction at variable temperature for a period of 1 h. The heating rate was set at 10 K/min. All diffraction lines can be assigned to metallic copper, except for the pattern at 200 °C, showing features of copper oxide. Some fibers were analyzed after electrochemical treatment, which did not lead to any changes in the XRD patterns, suggesting the crystalline copper phase remains metallic.
Catalysts 11 00571 g0a4
Figure A5. SEM images of the cross-section of the wall (left) and detail of the surface-structure (Right) of copper oxide hollow fibers after reduction at 200 °C for 1 h. The sample was treated in air for as long as 3 h, which is the optimized time as indicated in Figure A7.
Catalysts 11 00571 g0a5
Figure A6. SEM images of high magnification of the inside surface of the wall (left) and outside surface of the wall (Right) of copper hollow fibers after calcination at 600 °C for 3 h and reduction at 280 °C for 1 h, respectively. Such fibers show the highest Faradaic Efficiency in reduction of CO2 towards CO.
Catalysts 11 00571 g0a6
Figure A7. Total current densities of the copper hollow fibers as a function of temperature of treatment in H2. The hollow fibers were calcined at 600 °C for 1, 3, and 4 h (see legend in the Figure), respectively, prior to reduction in the hydrogen flow. The graphs shows that the fibers prepared by reduction in hydrogen at 280 °C show the highest current densities, in particular for the fibers prepared by calcination for 1 h or 3 h. It should also be noted that the order in performance (3 h > 1 h > 4 h) of each of the 4 fibers prepared at different calcination times is consistent throughout the temperature range of reduction.
Catalysts 11 00571 g0a7

References

  1. Kondratenko, E.V.; Mul, G.; Baltrusaitis, J.; Larrazábal, G.O.; Pérez-Ramírez, J. Status and perspectives of CO2 conversion into fuels and chemicals by catalytic, photocatalytic and electrocatalytic processes. Energy Environ. Sci. 2013, 6, 3112–3135. [Google Scholar] [CrossRef] [Green Version]
  2. Spurgeon, J.M.; Kumar, B. A comparative technoeconomic analysis of pathways for commercial electrochemical CO2 reduction to liquid products. Energy Environ. Sci. 2018, 11, 1536–1551. [Google Scholar] [CrossRef]
  3. Zhang, B.; Zhang, J.-T. Rational design of Cu-based electrocatalysts for electrochemical reduction of carbon dioxide. J. Energy Chem. 2017, 26, 1050–1066. [Google Scholar] [CrossRef] [Green Version]
  4. Lv, J.-J.; Jouny, M.; Luc, W.; Zhu, W.; Zhu, J.-J.; Jiao, F. A Highly Porous Copper Electrocatalyst for Carbon Dioxide Reduction. Adv. Mater. 2018, 30, 1803111. [Google Scholar] [CrossRef] [PubMed]
  5. Hori, Y.; Wakebe, H.; Tsukamoto, T.; Koga, O. Electrocatalytic process of CO selectivity in electrochemical reduction of CO2 at metal electrodes in aqueous media. Electrochim. Acta 1994, 39, 1833–1839. [Google Scholar] [CrossRef]
  6. Jhong, H.-R.M.; Ma, S.; Kenis, P.J.A. Electrochemical conversion of CO2 to useful chemicals: Current status, remaining challenges, and future opportunities. Curr. Opin. Chem. Eng. 2013, 2, 191–199. [Google Scholar] [CrossRef]
  7. Kas, R.; Kortlever, R.; Milbrat, A.; Koper, M.T.M.; Mul, G.; Baltrusaitis, J. Electrochemical CO2 reduction on Cu2O-derived copper nanoparticles: Controlling the catalytic selectivity of hydrocarbons. Phys. Chem. Chem. Phys. 2014, 16, 12194–12201. [Google Scholar] [CrossRef]
  8. Chen, C.; Khosrowabadi Kotyk, J.F.; Sheehan, S.W. Progress toward Commercial Application of Electrochemical Carbon Dioxide Reduction. Chem 2018, 4, 2571–2586. [Google Scholar] [CrossRef] [Green Version]
  9. Fang, Y.-X.; Flake, J.C. Electrochemical Reduction of CO2 at Functionalized Au Electrodes. J. Am. Chem. Soc. 2017, 139, 3399–3405. [Google Scholar] [CrossRef]
  10. Gattrell, M.; Gupta, N.; Co, A. A review of the aqueous electrochemical reduction of CO2 to hydrocarbons at copper. J. Electroanal. Chem. 2006, 594, 1–19. [Google Scholar] [CrossRef]
  11. Schreier, M.; Yoon, Y.; Jackson, M.N.; Surendranath, Y. Competition between H and CO for active sites governs Cu mediated electrosynthesis of hydrocarbon fuels. Angew. Chem. Int. Ed. 2018, 57, 10221–10225. [Google Scholar] [CrossRef]
  12. Dinh, C.-T.; Burdyny, T.; Kibria, M.G.; Seifitokaldani, A.; Gabardo, C.M.; García de Arquer, F.P.; Kiani, A.; Edwards, J.P.; De Luna, P.; Bushuyev, O.S.; et al. CO2 electroreduction to ethylene via hydroxide-mediated copper catalysis at an abrupt interface. Science 2018, 360, 783–787. [Google Scholar] [CrossRef] [Green Version]
  13. Kas, R.; Hummadi, K.H.K.H.; Kortlever, R.; Wit, P.D.; Milbrat, A.; Luiten-Olieman, M.W.J.; Benes, N.E.; Koper, M.T.M.; Mul, G. Three-dimensional porous hollow fibre copper electrodes for efficient and high-rate electrochemical carbon dioxide reduction. Nat. Commun. 2016, 7, 1–7. [Google Scholar] [CrossRef] [PubMed] [Green Version]
  14. Wickramasinghe, S.R.; Semmens, M.J.; Cussler, E.L. Mass transfer in various hollow fiber geometries. J. Mem. Sci. 1992, 69, 235–250. [Google Scholar] [CrossRef]
  15. Rabiee, H.; Zhang, X.; Ge, L.; Hu, S.; Li, M.; Smart, S.; Zhu, Z.; Yuan, Z. Tuning the Product Selectivity of the Cu Hollow Fiber Gas Diffusion Electrode for Efficient CO2 Reduction to Formate by Controlled Surface Sn Electrodeposition. ACS Appl. Mater. Interfaces 2020, 12, 21670–21681. [Google Scholar] [CrossRef] [PubMed]
  16. Jong, R.P.H.; Krzywda, P.M.; Benes, N.E.; Mul, G. Preparation of Ti, Ti/TiC or Ti/TiN based hollow fibres with extremely low electrical resistivity. RSC Adv. 2020, 10, 31901–31908. [Google Scholar] [CrossRef]
  17. Bell, D.; Rall, D.; Grosseheide, M.; Marx, L.; Hulsdunker, L.; Wessling, M. Tubular hollow fibre electrodes for CO2 reduction made from copper aluminum alloy with drastically increased intrinsic porosity. Electrochem. Commun. 2020, 111, 106645. [Google Scholar] [CrossRef]
  18. Rodriguez, J.A.; Kim, J.Y.; Hanson, J.C.; Perez, M.; Frenkel, A.I. Reduction of CuO in H2: In situ time-resolved XRD studies. Catal. Lett. 2003, 85, 247–254. [Google Scholar] [CrossRef]
  19. Zhu, Y.; Mimura, K.; Isshiki, M. Oxidation Mechansim of Cu2O to CuO at 600–1050 °C. Oxid. Met. 2004, 62, 207–222. [Google Scholar] [CrossRef]
  20. Wang, H.-P.; Yeh, C.-T. On the reduction of copper oxide. J. Chin. Chem. Soc. 1983, 30, 139–143. [Google Scholar] [CrossRef]
  21. Kim, J.Y.; Rodriguez, J.A.; Hanson, J.C.; Frenkel, A.I.; Lee, P.L. Reduction of CuO and Cu2O with H2: H Embedding and Kinetic Effects in the Formation of Suboxides. J. Am. Chem. Soc. 2003, 125, 10684–10692. [Google Scholar] [CrossRef] [PubMed]
  22. Li, C.W.; Kanan, M.W. CO2 Reduction at Low Overpotential on Cu Electrodes Resulting from the Reduction of Thick Cu2O Films. J. Am. Chem. Soc. 2012, 134, 7231–7234. [Google Scholar] [CrossRef]
  23. Qiao, J.; Liu, Y.; Hong, F.; Zhang, J. A review of catalysts for the electroreduction of carbon dioxide to produce low-carbon fuels. Chem. Soc. Rev. 2014, 43, 631–675. [Google Scholar] [CrossRef] [PubMed]
  24. Kuhl, K.P.; Cave, E.R.; Abramf, D.N.; Jaramillo, T.F. New insights into the electrochemical reduction of carbon dioxide on metallic copper surfaces. Energy Environ. Sci. 2012, 5, 7050–7059. [Google Scholar] [CrossRef]
  25. Hori, Y.; Konishi, H.; Futamura, T.; Murata, A.; Koga, O.; Sakurai, H.; Oguma, K. Deactivation of copper electrode, in electrochemical reduction of CO2. Electrochem. Acta 2005, 50, 5354–5369. [Google Scholar] [CrossRef]
  26. Kedzierzawski, P.; Augustynski, J. Poisoning and Activation of the Gold Cathode during Electroreduction of CO2. J. Electrochem. Soc. 1994, 141, L58–L60. [Google Scholar] [CrossRef]
  27. Velasco-Velez, J.-J.; Jones, T.; Gao, D.; Carbonio, E.; Arrigo, R.; Hsu, C.-J.; Huang, Y.-C.; Dong, C.-L.; Chen, J.-M.; Lee, J.-F.; et al. The Role of the Copper Oxidation State in the Electrocatalytic Reduction of CO2 into Valuable Hydrocarbons. ACS Sustain. Chem. Eng. 2019, 7, 1485. [Google Scholar] [CrossRef]
  28. Eilert, A.; Cavalca, F.; Roberts, F.S.; Osterwalder, J.; Liu, C.; Favaro, M.; Crumlin, E.J.; Ogasawara, H.; Friebel, D.; Pettersson, L.G.M.; et al. Subsurface Oxygen in Oxide-Derived Copper Electrocatalysts for Carbon Dioxide Reduction. J. Phys. Chem. Lett. 2017, 8, 285–290. [Google Scholar] [CrossRef] [Green Version]
  29. Chou, T.-C.; Chang, C.-C.; Yu, H.-L.; Yu, W.-Y.; Dong, C.-L.; Velasco-Vélez, J.-J.; Chuang, C.-H.; Chen, L.-C.; Lee, J.-F.; Chen, J.M.; et al. Controlling the Oxidation State of the Cu Electrode and Reaction Intermediates for Electrochemical CO2 Reduction to Ethylene. J. Am. Chem. Soc. 2020, 142, 2857–2867. [Google Scholar] [CrossRef]
Figure 1. SEM image of the cross section of the Cu hollow fiber after spinning at low (a) and high (b) magnification. The scale bar indicates 50 or 1 µm, respectively.
Catalysts 11 00571 g001
Figure 2. Thermogravimetric analysis of the as-synthesized Cu hollow fibers. A heating rate of 1 °C min−1 was applied, in an atmosphere of air. A value <100% indicates a weight loss as compared to the weight of the as-prepared fiber, and a value >100% indicates a weight gain.
Catalysts 11 00571 g002
Figure 3. Temperature programmed reduction of powdered CuO fiber. A H2 (4% in Ar) flow of 30 cm3·min−1, and a heating rate of 5 °C min−1 were applied.
Catalysts 11 00571 g003
Figure 4. Faradaic Efficiency profiles of hollow fibers calcined at variable times at 600 °C in air (1 h, 3 h, 4 h), as a function of reduction temperature in hydrogen. Efficiencies were determined by chrono amperometry, using 0.3 M KHCO3, at ~7–12 mA·cm−1, requiring a voltage of −0.45 V vs. RHE.
Catalysts 11 00571 g004
Publisher’s Note: MDPI stays neutral with regard to jurisdictional claims in published maps and institutional affiliations.

