Article

A Model of Catalytic Cracking: Product Distribution and Catalyst Deactivation Depending on Saturates, Aromatics and Resins Content in Feed

by
Galina Y. Nazarova
1,*,
Elena N. Ivashkina
1,
Emiliya D. Ivanchina
1,
Alexander V. Vosmerikov
2,
Ludmila N. Vosmerikova
2 and
Artem V. Antonov
1
1
Division for Chemical Engineers, National Research Tomsk Polytechnic University, 634050 Tomsk, Russia
2
Institute of Petroleum Chemistry, Siberian Branch, Russian Academy of Science, 634055 Tomsk, Russia
*
Author to whom correspondence should be addressed.
Submission received: 24 April 2021 / Revised: 28 May 2021 / Accepted: 29 May 2021 / Published: 1 June 2021
(This article belongs to the Special Issue Modeling of the Catalytic Cracking)

Abstract

:
The problems of catalyst deactivation and optimization of the mixed feedstock become more relevant when the residues are involved as a catalytic cracking feedstock. Through numerical and experimental studies of catalytic cracking, we optimized the composition of the mixed feedstock in order to minimize the catalyst deactivation by coke. A pure vacuum gasoil increases the yields of the wet gas and the gasoline (56.1 and 24.9 wt%). An increase in the ratio of residues up to 50% reduces the gasoline yield due to the catalyst deactivation by 19.9%. However, this provides a rise in the RON of gasoline and the light gasoil yield by 1.9 units and 1.7 wt% Moreover, the ratio of residue may be less than 50%, since the conversion is limited by the regenerator coke burning ability.

Graphical Abstract

1. Introduction

Depending on market needs, the catalytic cracking technology can be aimed at increasing the yield of gasoline, light olefins, or light gasoil, the latter being more relevant to Europe with its high amount of diesel cars [1]. Factors affecting the products’ yields include interacting operating variables in the reactor and the regenerator, catalyst deactivation, and, especially, change in the hydrocarbon type content in the feedstocks. To improve the oil refining depth, the residual fraction involves catalytic cracking units as a feedstock [2,3,4,5]. When the heavy petroleum fractions are converted, the rising content of coke on the catalyst contributes to its deactivation and an increase in the temperature of the regenerated catalyst [6]. In this case, the amount of heat created in the regenerator should not deactivate the catalyst or disturb the heat balance significantly. Moreover, the conversion of catalytic cracking feedstock is limited by the regenerator coke burning ability. This poses a major challenge when using the existing industrial catalytic cracking units, i.e., how to choose the mixed feedstock in order to increase the production of light gas oil, gasoline, or light olefins when using residual fractions; and how to define the optimal amount of residues in the mixed feedstock to prevent an intensive formation of coke and catalyst deactivation. Since change in the composition of feedstock and non-optimum conditions for the catalyst operation may lead to catalyst deactivation by coke and as a result reduce the cracking efficiency, addressing the above challenge is an essential task. Therefore, the rate of coke formation should be optimized accordingly.
To predict the efficiency of catalytic cracking, scientists have successfully employed both mathematical models and experimental study (Froment, Corella, Gilbert, Ancheyta, Jimeńez-García, Fernandes, Radu, Oliveira, Mujtaba, Al-Khattaf, Barbosa et al.) [7,8,9,10,11,12,13,14,15,16]. Given that the main difficulty when modeling the advanced petroleum processes is to ensure the sensitivity of the model to the saturates, aromatic hydrocarbons, and resins (SAR) composition, most reaction networks have been based on the formation of pseudocomponents according to their wide fractional composition [17,18,19]. However, this approach fails to consider how group characteristics of the feedstock as well as the hydrocarbon reactivity influence the yield of coke and products, which is important when predicting the composition of products considering the catalyst deactivation. Although some models consider the hydrocarbon type content in the feedstock, they may not predict the hydrocarbons groups of the gasoline, which requires forecasting the research octane number (RON) [20,21].
A model for the optimization of the mixed feedstock of the catalytic cracking should be sensitive to changes in the hydrocarbon type content in the feedstock [22], predict the group composition of the gasoline, and take account of not only the cracking temperature, but also the operating variables of the catalyst after the regeneration zone such as temperature, activity, and catalyst consumption. Aggregation of mechanisms of complex chemical reactions using elements of lumping analysis provides an effective and informative approach.
In this article, we apply a complex approach to developing such a mathematical model. We determine the thermodynamic and kinetic patterns of catalytic cracking of high molecular weight hydrocarbons, taking into account catalyst deactivation and the content of the saturates, the aromatics, and the resins in the feedstock. This model allows us to predict the yield and the quality of products, as well as choose the suitable mixed feedstock to increase the yield of gasoline, light olefins, or light gasoil.

2. Results and Discussion

2.1. Experimental

2.1.1. Feedstocks

Table 1 contains the SAR compositions and density of VD and R feeds defined experimentally.
The results showed that VD was enriched in saturates, with the content of these hydrocarbons 71.8 wt%, which was higher by 13.6 wt% than in the R feedstock (55.8 wt%). Conversely, the latter had a higher content of aromatics (40.1 wt%), which was also confirmed by the value of density (0.9006 and 0.9100 g/cm3 for VD and R, respectively). Moreover, the content of resins in the R feedstock was 1.8 times higher than for the VD feed, which leads to intensive coke formation and catalyst deactivation and as a result may limit the conversion of the feedstock under certain temperatures. These negative impacts can be reduced if the R feedstock is co-processed with the VD feed. However, this requires finding the optimal R-to-VD ratio in such a mixed feedstock, which will ensure the increase in yield of the desired products.

2.1.2. Catalysts

Table 2 presents the change in acid properties of the coked and regenerated catalysts. The results of thermoprogrammed desorption of ammonia showed that the concentration of the acid sites was 224 μmol/g for the regenerated catalyst, which was 1.4 times higher than for the coked catalyst. This confirmed that the catalyst operation in the riser leads to a significant deactivation of the catalyst by coke.
The thermogravimetric results (Figure 1a) showed that the coke formed on the catalyst had an amorphous structure since the exothermic peak of coke oxidation was detected at a temperature less than 740 °C.
The presence of amorphous coke was also confirmed by a thermogram of the spent catalyst with a charge–mass distribution m/z = 44 (mass-to-charge ratio). (Figure 1b). In this case, the ion current peak appeared at a temperature range of 465–650 °C. This indicates the presence of CO2 gas formed during the oxidation of the amorphous coke. The coke content on the catalyst was 0.32–0.5 wt%. Thus, by studying the cracking catalysts, we defined how the coke content on the surface of the catalyst impacts the catalyst deactivation. The patterns of this influence were further taken into account to develop the optimization model (Section 2.2.1).

2.2. Riser Model

2.2.1. Equations

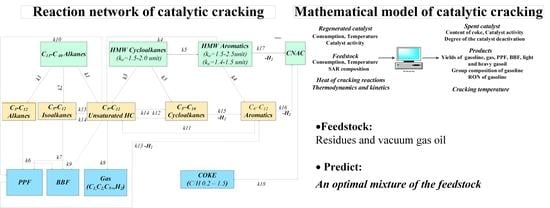
The formalized mechanism of cracking reactions simplifies the mathematical description of such a complicated multicomponent process. We developed a 14-lump kinetic model that includes hydrocarbon groups of the feedstock participating in the catalytic cracking. The reaction network is based on quantum–chemical methods and the database of hydrocarbons composition of the feedstock and products obtained at a laboratory of Tomsk Polytechnic University, Tomsk, Russia. Table 3 contains the initial data to develop the model, including the concentration of the hydrocarbons groups of feedstock and products.
The predictive ability of the model depends on the set of desired products such as gasoline and fat gas. The developed reaction network (Figure 2) helps predict the group composition of the gasoline, as well as the content of both the propane–propylene and butane–butylene fractions in wet gas, and coke. In addition, it also takes into account the SAR composition and the reactions leading to coke formation from these hydrocarbons on the catalyst. Therefore, this mechanism allows us to predict the amount of coke and the degree of catalyst deactivation when modeling the process of catalytic cracking.
The results of quantum–chemical methods of calculations confirmed the fundamental occurrence of reactions under the study (Table 4). The probability of their occurrence according to isobaric–isothermal potential (ΔrG°810–848), as well as the reactivity of hydrocarbon groups, were estimated at the equilibrium temperature between the feedstock and the catalyst (Equation (4)). Moreover, the thermal effects of reactions (ΔrH°810–848) defined using DFT are used to solve a heat balance equation of the riser.
The mathematical model (Equation (1)) represents a system of ordinary differential equations describing the material and heat balances. The riser is modeled as a plug flow reactor, for the gas velocity (≈3.2–9.2 m/s) significantly exceeds the initial fluidizing velocity and the Peclet diffusion number tends to infinity.
{ d C i d τ = j = 1 18 ( ± ψ ( W W ) j ) ρ m c m d T d τ = j = 1 18 ( ± ψ ( ( Δ r H T ) W ) j ( ( Δ r H T ) W ) j ) )
Initial conditions: Ci = Ci,0, T0 = Ti.t.
Here, i is the number of components; j is the number of reactions; Ci is the concentration of i—the hydrocarbons group, mol/m3; τ is the contact time, s; j is the reaction number; ψ is the deactivation function (3); pm, cm are the density and heat capacity of flow, kg/m3, kJ/kg ∙ K; T is the temperature; W , W are the reaction rate in the forward and reverse directions, mol/(s·m3); Δr H T , Δr H T are the thermal effects of the chemical reactions, kJ/mol; Tit is the temperature of the thermal equilibrium between the feedstock and the catalyst, K;
A two-phase flow is required to describe the process with a moving catalyst bed. The passive phase is the gas–liquid flow, the active phase is the flow in pores of solid catalyst particles. The hydrodynamic mode of both phases is close to plug flow. The transfer of matter by moving solid particles of the catalyst is not important if the particles have a small specific surface area that poorly absorbs the reagent [23].
The interdependence between reaction rates (18 reactions) and group concentrations (14 components) is based on the law of mass action according to the reaction network (Figure 2). Moreover, the reaction rate is multiplied by the catalyst deactivation parameter when the concentration of the components calculates (Equation (2)):
W j = ψ k j C i
The catalyst deactivation parameter 
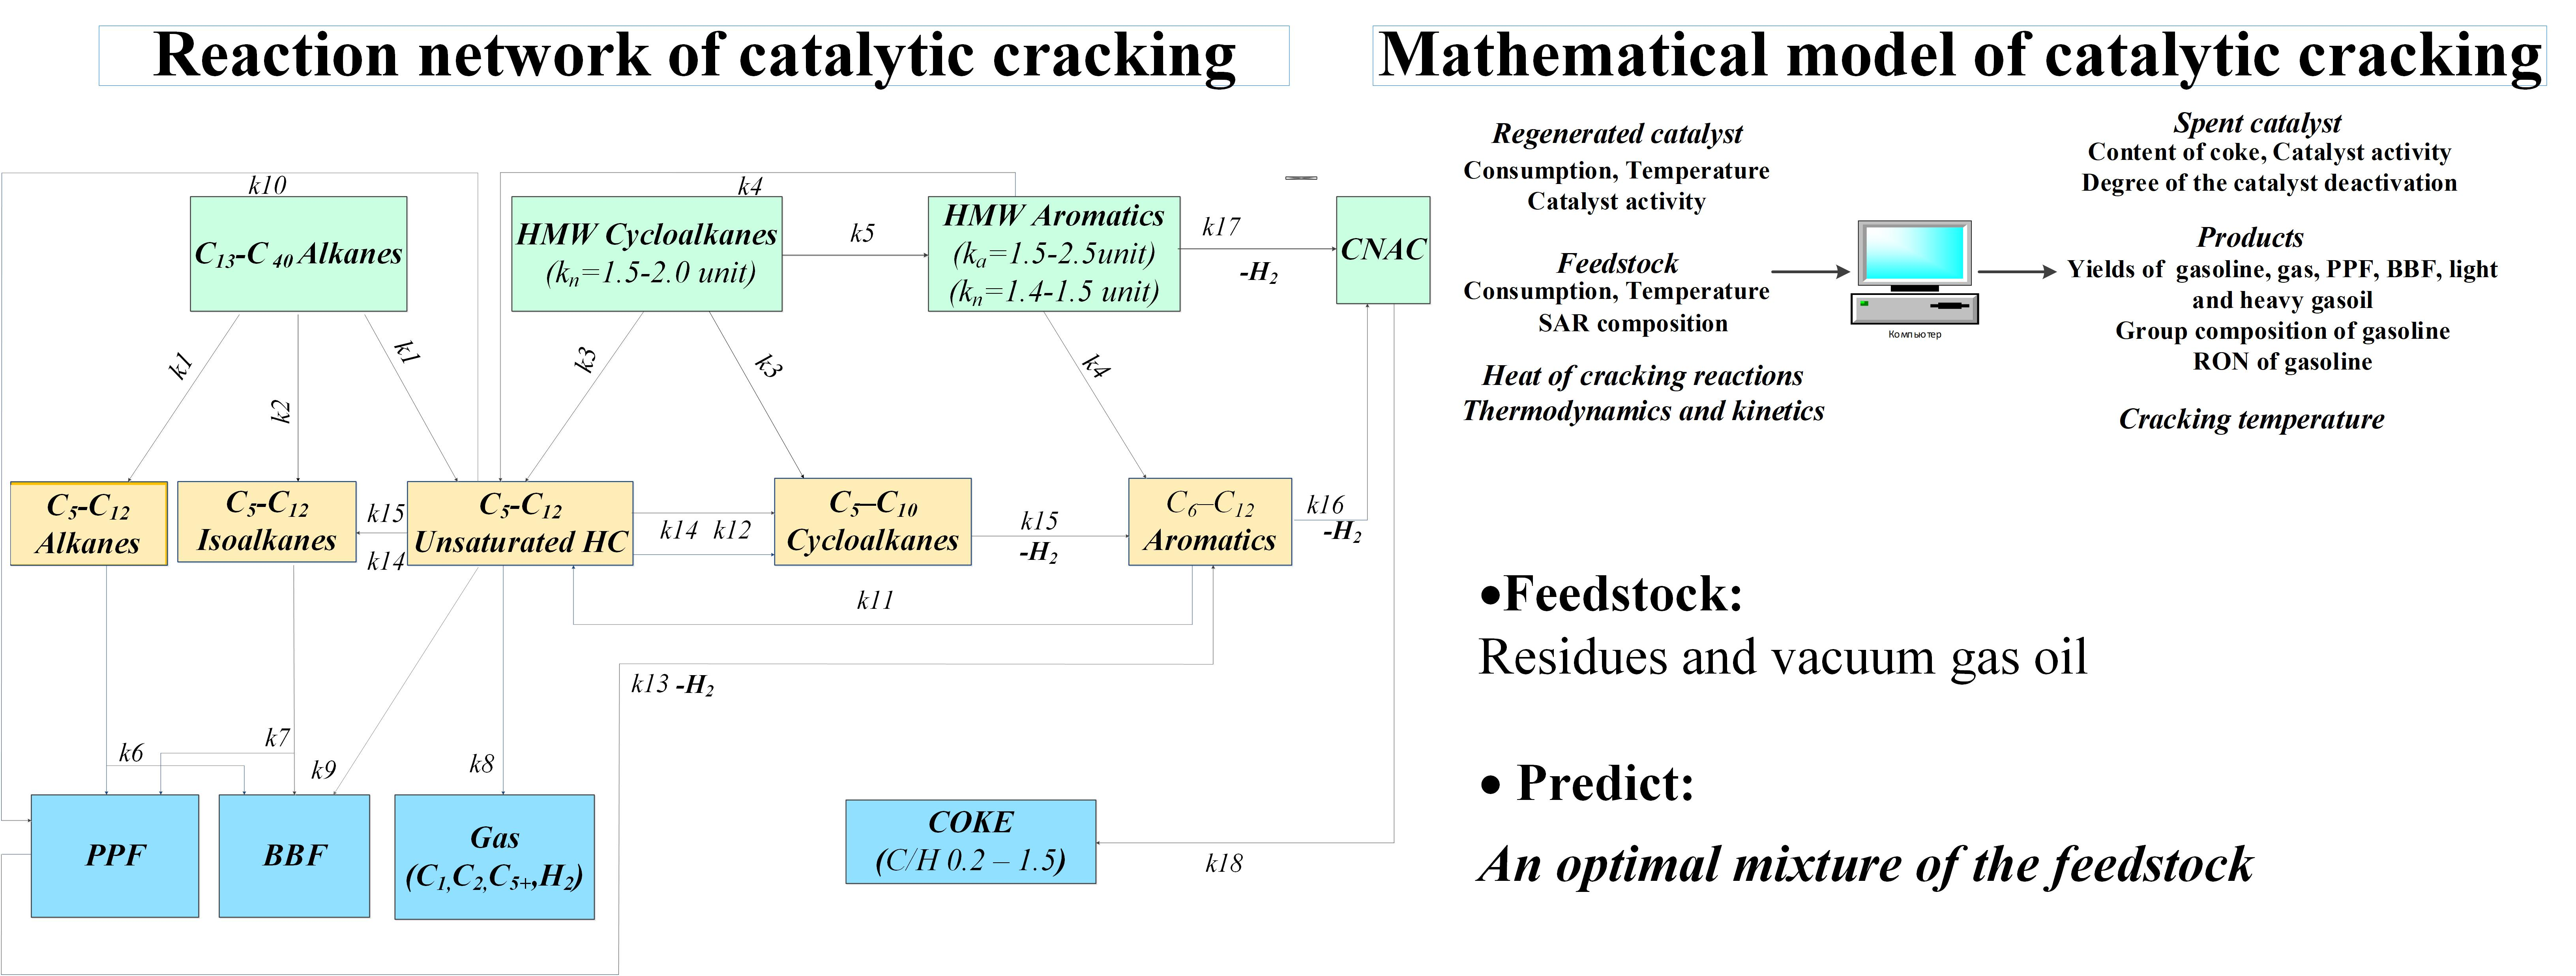
ψ is calculated depending on the content of coke on its surface. Using the results TPD, we defined the change in acid properties of the catalyst depending on the concentration of coke (Equation (3)):
ψ = f ( C к ) = A = A 0 e 1.74 C c o k e
where A is the current relative catalyst activity (acidity), %; A0 is regenerated catalyst activity, %; Ccoke is the coke content on the catalyst, wt%.
This approach allows us to implement the relationship among the following parameters: the composition of the feedstock—the content of coke on the catalyst—the change in catalyst activity—the change in the yield and composition of the products.
The model takes into account the interdependence between the operating variables of the riser and the regenerator. The cracking temperature depends largely on the temperature of the thermal equilibrium between the feedstock, the catalyst, and the heat of cracking reactions. The initial temperature of the reactions depends on the consumption of the feedstock and regenerated catalyst, as well as on their temperatures and heat capacities (Equation (4)):
G c a t c c a t ( T c a t ( T i t + 1 ) ) = G f c f ( T i t + T f )
where Gcat is catalyst consumption, kg/s; Gf is the feedstock consumption, kg/s; cf, ccat is the feedstock and the catalyst heat capacity, J/kgK; Tcat is the temperature of regenerated catalyst, K; Tit is the temperature of the thermal equilibrium between the feedstock and the catalyst, K.
Reaction rate constants were defined by solving the inverse kinetic problem, when the kinetic parameters are calculated based on the feedstock and product concentrations. Table 3 contains initial data for solving the inverse kinetic problem. As an initial approximation, we used the kinetic parameters of the reaction of the individual hydrocarbons, which characterized the reaction groups, and lumps, which were defined both experimentally, including quantum-chemicals methods, and using the existent models [24,25,26,27,28,29,30,31,32,33,34,35].
Since the models differ significantly in reaction paths, the number of components, and their characteristics, as well as in catalysts type and operating variables etc., we used the kinetic parameters defined experimentally in several studies, where possible: for unsaturated hydrocarbons cyclization [24], for C5–C12 alkanes and isoalkanes cracking [25], for unsaturated hydrocarbons cracking [26], for aromatics dealkylation [27], for C13–C40 alkanes cracking [28], for diene synthesis [29], for hydrogen transfer [30].
Our kinetic scheme is based on a group approach and includes several reactions when the feedstock converts into gasoline, and often, the products are both components of gas and gasoline. Although the use of the lump approach often involves the formation of a component through pseudo-reactions directly, without considering the specific hydrocarbons, we also take into account the modeling results: for C5–C12 isoalkanes cracking [31], for condensation and coke formation [32,33], for cycloalkanes cracking and dealkylation [34], for cycloalkanes cracking [35].
At the same time, the most important factors are the catalyst nature and the operating variables, when the kinetic parameters are defined; most often, the databases present kinetic parameters of thermal conversion of individual hydrocarbons under a different catalyst.
These factors also lead to the optimization task of the kinetic parameters. To solve this problem, we used a genetic algorithm [36,37]. Finding the solution of the task using a genetic algorithm consists of the application of an iterative procedure, when the original solution improves gradually. At each iteration, several alternative candidate solutions (individuals) are considered immediately, and the genetic algorithm updates the population (the set of individuals used in the iteration) by creating new individuals and eliminating the worst ones.
The generation and mutation of new individuals is based on the modeling of the breeding and mutation processes using the crossing and the mutation operators. The reduction operator ensures the choice of the best (“revivable”) individuals among the parents and descendants by eliminating the worst (“poorly adapted”) ones. The latter performs according to strictly defined (deterministic) rules; at the same time, the crossing and the mutation occur randomly.
The main selection rule is the evolution law: “the strongest survives”, whichimprroves the finding solution. Equation (5) presents the expression for the fitness function:
F = k i = 1 n ( y i y i c a l c ) 2
where yi is the value of the i-th parameter (concentration); yicalc is the calculated value of the i-th parameter (concentration); n is the total amount of parameters; k is amount of days under the studied; F is fitness function.
The implementation of these options provides a set of the kinetic parameters of the catalytic cracking reactions in accordance with reaction networks, which has a maximum fitness function. The degree of fitness of the kinetic parameters set is defined as 1/F.
Table 4 presents the estimated kinetic and thermodynamic parameters of the reactions involving high molecular weight hydrocarbons that convert into gas, gasoline, diesel fractions, and coke. Thermodynamic values marked with an asterisk were defined by quantum–chemical methods; for low molecular weight hydrocarbons, we used reference data [38].
The defined set of kinetic parameters provides the sensitivity of the developed mathematical model to changes in the SAR composition of the feedstock, as well as in operating variables. In addition to the kinetic parameters, the thermodynamic parameters provide an accuracy of the model in terms of temperature and, consequently, the components concentrations. The mathematical model provides a quantitative account of the influence of the feedstock composition by considering the concentrations of reagents and reaction rate constants.

2.2.2. Verifications

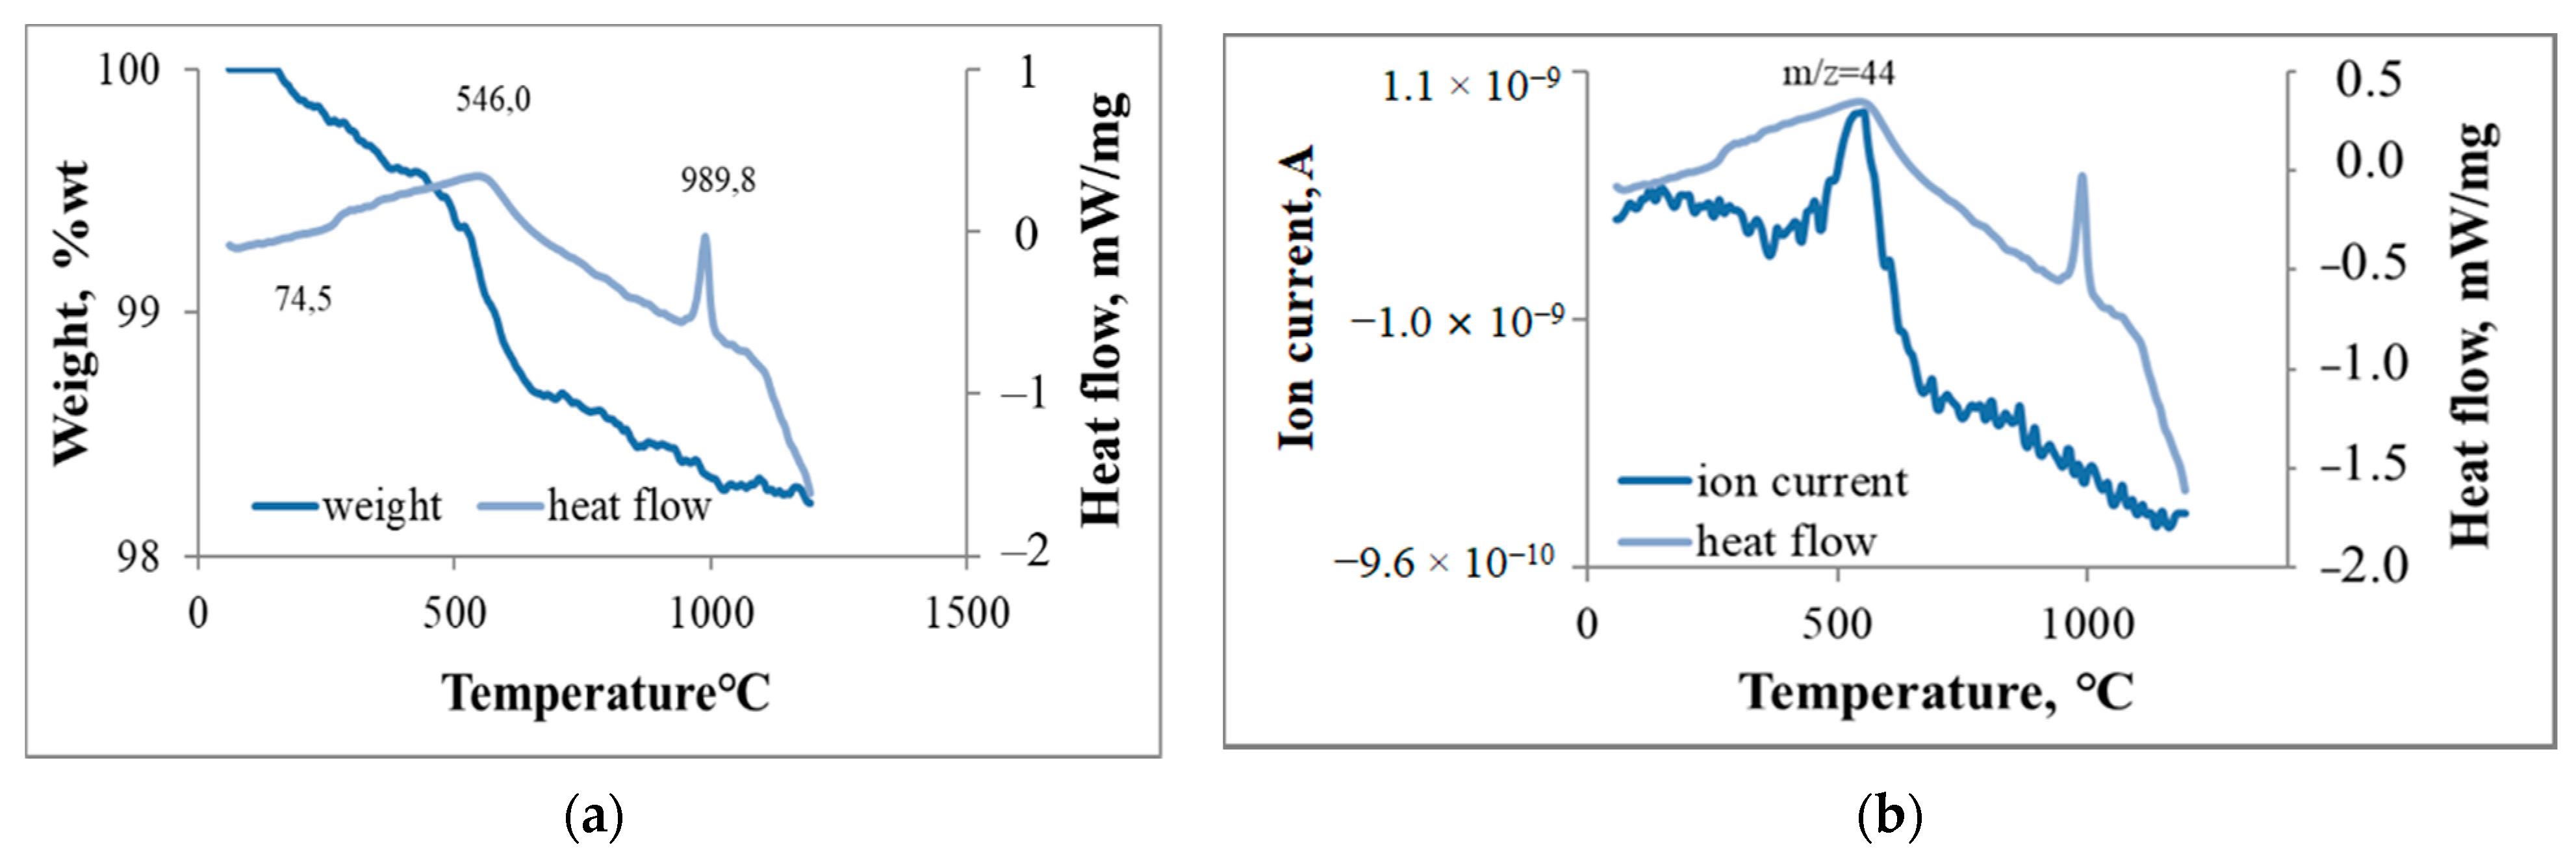
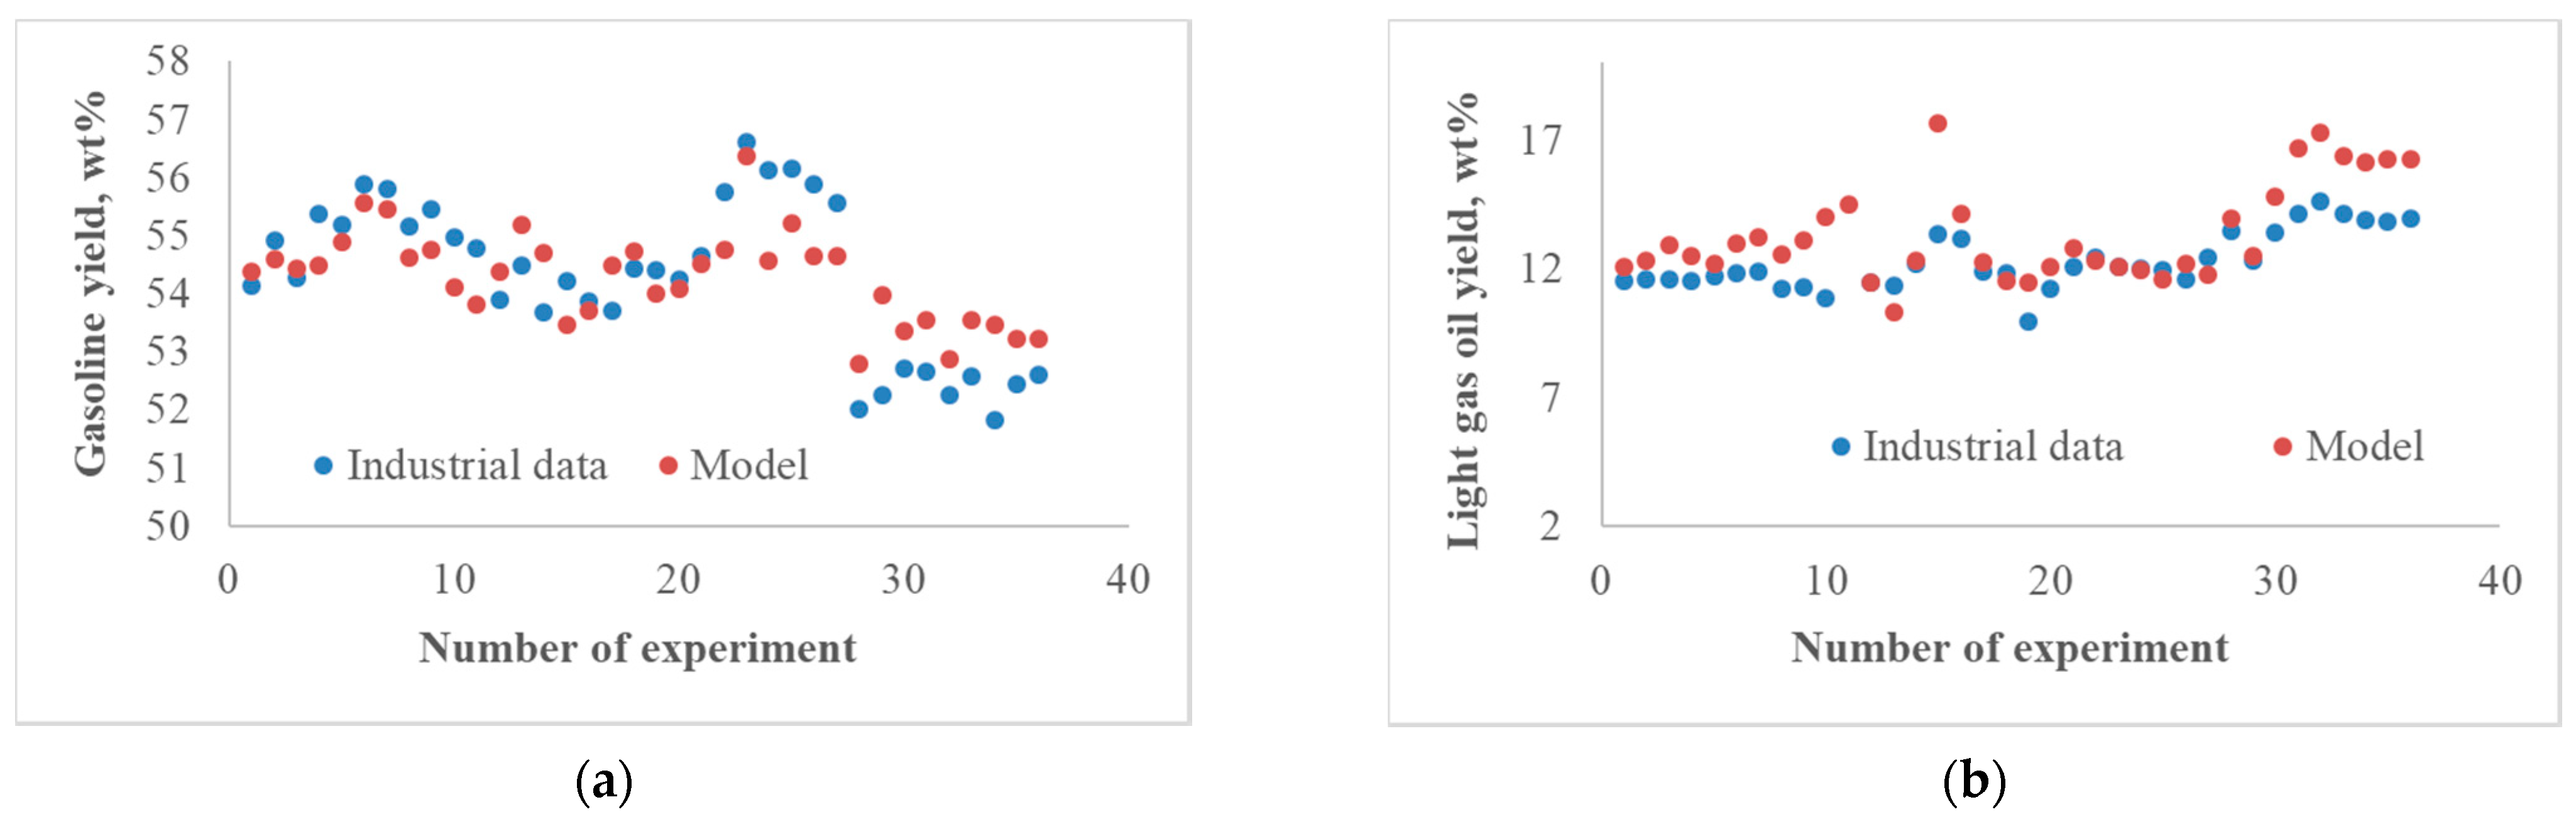
The mathematical model was verified by comparing the calculated data of the product yields and industrial data (Figure 3). A change in the main operating variables of the riser is presented in Table 5. The feedstock composition changed according to Table 6.
Verification of the model shows that the average relative error between the calculated and experimental data is not more than 7.0 wt%. (Figure 3). Figure 3d shows that the alkanes concentration with a step size h = 0.01 and h = 0.001 are close in comparison with h = 0.3–0.5, which ensures the convergence of the results during solving the system of ordinary differential equations.
Figure 4 shows the sensitivity of the model to SAR content in the feedstocks and the major process variable.
Model-based calculation shows that the gasoline yield is the highest (55.5–55.7 wt%) when the feedstocks with a high content of saturates are converted (C-1, C-2, and C-6 feed). At the same time, the values of RON of the gasoline are lower (90.48–92.15) relative to other feedstock, which have a high content of aromatics. Although the yields of gas are high values (24.6–24.9 wt%), the amount of light (10.81–11.12 wt%) gas oil is lower relative to other feeds.
The feedstock (F-10) which has a high concentration of aromatics (45.1 wt%) and resins (3.0 wt%), reduces the yield of the gasoline with a high octane number (95.69 units, 53.72 wt%) and gas (22.22 wt%). In addition, this feedstock contributes to the high rate of formation of coke (5.86 wt%), which leads to a decrease in the catalyst activity, as well as the degree of the feedstock conversion, and to an increase in heavy products: light and heavy gas oils (13.3 and 4.9 wt%).
Figure 5 and Figure 6 show the effect of the main process variables on the cracking temperature and the latter on the consumption of product components.
Studying the parametric sensitivity showed that the change in the product yields and composition of cracking products is consistent with the theoretical laws about the process. With an increase in temperature, the consumption of feedstock components decreases and consumption of the gas components and the coke increases. The content of gasoline passes through a maximum due to an increase in the rates of cracking reactions with the release of gas components and condensation with further coke formation.
The developed model is intended to predict the yields and composition of products when the SAR composition of feedstock and the catalyst deactivation change. Such a model is to define the suitable ratio of the mixed feedstock for increasing the yield of the desirable product, taking into account the temperature, consumption of regenerated catalyst, as well as its deactivation.

2.3. Model Application

Figure 7a shows the effect of the different feedstocks (Table 1) on the yield of the products and the RON of the gasoline when the operating variables were equal (Table 7).
Model-based calculations showed that the cracking of VD provides a high yield of gasoline and C3–C4 gases (56.1 and 24.9 wt%) due to the high content of the saturates in its composition. The RON of the gasoline is 91 units and the coke yield was 4.8 wt%. This amount of coke leads to decrease in the catalyst deactivation by 12.6% relative to the activity of regenerated catalyst.
When R feed was converted, the yield of coke was 6.7 wt%. This stems from a high content of resins (4.1 wt%), which condense intensively to form the coke and crack so weakly under the catalytic cracking conditions. The conversion of such feedstock leads to a significant deactivation of the catalyst by coke and exceeds the regenerator coke burning ability for the unit under the study. The composition of R ensures an increase the degree of the catalyst deactivation by 26.0% relative to the initial value for regenerated catalyst. This reduced the yield of the gasoline and the wet gas by 3.0 and 3.9 wt% as well as increased the RON of gasoline by 3.5 units. In this case, the decrease of the slops consumption to the riser by 20 m3/h may improve activity loss negligibly by 4.6%.
Although R feed is inappropriate to convert in the catalytic cracking unit due to intensive formation of the coke on the catalyst, the co-processing of R and VD feeds is suitable to increase the yield light gasoil and the RON. Figure 7b compares the yields of products when the ratio of R:VD changes at the equal process variables. The ratio of R in the mixed feed may be less than 50% to decrease in coke yield (5.8 wt%) and prevent a significant catalyst deactivation. This feedstock leads to a rise in the yield of light gasoil by 1.7% and the RON of gasoline by 1.9 units in comparison with the VD feed. Given that the catalytic cracking gasoline is a part of the commercial petrol, the optimization of mixed feedstocks to increase the yield and RON of gasoline should correspond to the consumptions and properties of the other flows (riformates, isomerizates, etc.) [39].

3. Methods

In our research, we studied a typical vacuum gasoil catalytic cracking unit that consists of two interconnected units performing the continuous “reaction-regeneration” cycle for the circulated catalyst. The microspherical catalyst used in the unit contains Y-zeolite. The bulk density of the catalyst equals 872–877 kg/m3; the pore volume is 0.419–0.423 sm3/g; and the catalyst activity is not less than 72–76%.
The target products produced by catalytic cracking are gasoline and fat gas. The gasoline after the stabilization represents a high-octane component of commercial gasoline (about 30 ÷ 40 wt%), while the fat gas becomes a feedstock for the gas fractionation unit and contains a high content of propane–propylene (PPF) and butane–butylene (BBF) fractions. The propane–propylene fraction is further used as a feedstock for propylene concentration, from which petrochemical products are obtained. The butane–butylene fraction performs as a feedstock for producing MTBE and alkylation units and is also a component of household gas and commercial gasoline. Depending on the market needs, the hydrocarbons composition of the feedstock and the operating variables for raising the yield of gasoline, light olefins, or light gas oil differ considerably.
To optimize the composition of the mixed feedstock taking into account the catalyst deactivation, we applied the strategy of system analysis and the method of mathematical modeling. This approach also included numerical studies and a group of physicochemical methods, such as liquid and gas chromatography, mass spectrometry, structural group analysis, etc. The results of gas chromatography, mass spectrometry, and structural group analysis can be found in [36,40].
The SAR content in the catalytic cracking feedstock, including the vacuum distillate (VD) and residues (R), was determined by the methods of liquid adsorption using ASKG silica gel (grain size of 0.2–0.5 mm) as a fixed phase. During the liquid adsorption chromatography, the sorbent in the column was treated with n-C6H14 to remove the heat of wetting. The saturates and aromatics were eluted by n-C6H14 and a mixture of C6H6 and C7H8 in the ratio of 6:1 for vacuum distillate and heavy gasoil, and 3:1 for light gasoil. The alcohol–benzene resins were isolated by a mixture of C2H5OH and C6H6 in the ratio of 1:1. During the chromatographic separation, we measured the refractive index and carried out the formalin reaction, which allowed us to verify the absence of arenes in the saturated part of the feedstock.
After that, we conducted the experimental study of the spent and the regenerated catalysts, which facilitated the development of a model that also takes into consideration the effect of the catalyst deactivation on process efficiency. The acid properties of both catalysts were studied by the method of temperature-programmed desorption of ammonia (TPD) using the thermal desorption unit with programmed heating. Ammonia was adsorbed at 100 °C on a pre-trained sample and further desorbed from the zeolite surface in a linear heating mode at a rate of 10 K/min. The strength of the catalyst acid sites was estimated by the temperature maxima on the thermal desorption curve. The concentration of the acid sites was expressed in μmol per 1 g of the catalyst and determined by the amount of ammonia desorbed when fixing the desorption peaks. The quantity and structure of the coke on the spent and regenerated catalysts were determined experimentally by the TG-DSC method (thermogravimetric analysis and differential-scanning calorimetry) using NETZSCH STA 449 F3. This equipment captured the gravimetric analysis and registered mass changes and thermal effects that occurred with changing the temperature and time of heating. The catalysts were heated from 50 to 1000 °C at a rate of 10 deg/min in corundum crucibles in the air.
The above complex of experimental studies was further combined with the methods of quantum chemical modeling (DFT (B3LYP, basis 3-21G)) and methods of solving the inverse kinetic problem. DFT results allow evaluating the fundamental occurrence of reactions using Gibbs energy and take into account the heat effects of the reactions when the model has been developed. This approach allowed us to determine the thermodynamic and kinetic parameters of reactions accounting for the catalyst deactivation by coke. These parameters form the basis of the kinetic model. Figure 8 illustrates the major operating variables that we took into account during developing the model.
Using the mathematical model, we predict how the SAR content in the VD feedstock and R feedstock influences the yield of products and the RON of the gasoline. Given that the conversion of feedstock is limited by the regenerator coke burning ability and degree of the catalyst deactivation, we were also able to optimize the composition of the mixed feedstock in order to increase the yield of gasoline, light olefins or light gasoil when VD and R were co-processed in a different ratio.

4. Conclusions

Currently, the study of the mechanism and the kinetic patterns of catalytic reactions in industrial conditions using the methods of the mathematical modeling represents both the major direction of fundamental research in the field of catalytic processes as well as an important scientific and practical task.
The problems of catalyst deactivation and optimization of the mixed feedstock become more relevant when vacuum distillate and residues are co-processed as catalytic cracking feedstocks in a various ratio. Given that the degree of the catalyst deactivation depends significantly on the operating variables and the SAR content in the feedstock, the latter should be optimized when the residues are involved in the catalytic cracking. This ensures both minimization of the catalyst deactivation by coke and the production of the required coke amount, since the feedstock conversion is limited by regenerator coke burning ability.
We developed the kinetic model of the catalytic cracking, which ensures its sensitivity to SAR content in the feedstock and predicts how the mixed feedstock composition influences the yield and composition of the product, the RON of the gasoline, and the coke content on the catalyst surface. The obtained experimental and numerical results of the catalytic cracking, including the feedstock, as well as the spent and the regenerated catalysts allow us to consider the catalyst deactivation by coke using the TPD results.
To improve the yields of desired products, we chose the suitable feedstock composi-tion by changing the ratio of vacuum gasoil and residuals in the mixed feed. The vacuum gasoil should be converted to increase in the yields of the wet gas and the gasoline (56.1 and 24.9 wt%). The rise of the ratio of residues up to 50% leads to reducing the gasoline yield; however, this provides an increase in the amount of the RON of gasoline and the light gasoil by 1.9 units and 1.7 wt%. This stems from the high content of aromatics in the mixed feedstock. Although the residual feed, which contains of 40.1 and 4.1 wt% of aromatics and resins, increases the amount of light gasoil by 3.2%, this feedstock tends to produce more coke on the catalyst surface. Therefore, the catalyst is progressively deactivated by 26.0% relative to the activity of the regenerated catalyst. This leads to a reduction in the yield of gasoline and gas.
Since the conversion and capacity of the unit are limited by the regenerator coke burning ability, the ratio of the residue may be less than 50%. This prevents the catalyst decay and increases the yield of the target products. The feed, which contains about 30% of residuals, tends to the high yield and the RON of gasoline on the level of 55.2 and 92 units.
The use of the developed model allows us to increase the resource efficiency of the industrial catalytic cracking units by prediction and optimization of the mixed feedstock depending on the desired products. In addition, the model has a high predictive ability of the operating variables such as the temperature and consumption of the feedstock and re-generated catalyst, as well as its activity. The developed model at TPU has a high adaptability to various technological challenges of oil refineries.

Author Contributions

Conceptualization, E.D.I.; Data curation, L.N.V.; Formal analysis, A.V.A.; Funding acquisition, E.N.I.; Investigation, G.Y.N.; Methodology, E.D.I.; Project administration, E.N.I.; Resources, E.N.I. and A.V.V.; Software, G.Y.N.; Supervision, E.N.I.; Validation, A.V.A.; Visualization, G.Y.N. and L.N.V.; Writing—original draft, G.Y.N.; Writing—review & editing, E.N.I. and A.V.V. All authors have read and agreed to the published version of the manuscript.

Funding

This research was supported by RSCF grant No 19-71-10015, Russian Foundation for Basic Research No 21-53-10004.

Acknowledgments

This research was supported by TPU development program. This research was supported by RSCF grant No 19-71-10015 and Russian Foundation for Basic Research No 21-53-10004.

Conflicts of Interest

The authors declare no conflict of interest.

Abbreviations

SARsaturates: aromatics and resins
RONthe research octane number
VDvacuum distillate
Rresidue
PPFpropane–propylene fractions
BBFButane–butylene fractions
DFTdensity functional theory
kreaction rate constant, s−1/l·s−1mol−1
knthe average number of naphthenic rings
kaaverage number of aromatic rings
CNACcondensed naphthenic-aromatic compounds
HMWhigh molecular weight
m/zmass-to-charge ratio
Δr810–848change in Gibbs energy at 810–848 K, J/mol
Δr810–848thermal effects of reactions at 810–848 K, J/mol
Ciconcentration of the i-th hydrocarbons group, mol/m3
Ci0initial concentration of the i-th hydrocarbons group, mol/m3
T0initial temperature of cracking, K
Titthe temperature of the thermal equilibrium between the feedstock and the catalyst, K
Δr H T , Δr H T the thermal effects of the chemical reactions, kJ/mol
W , W the reaction rate in the forward and reverse directions, mol/(s·m3)
Ttemperature
pmthe density of flow, kg/m3
cmthe heat capacity of flow, kJ/kg ∙ K
ψthe deactivation function
jthe reaction number
τthe contact time, s
inumber of component
jis number of reaction
Athe current relative catalyst activity (acidity), %
A0the regenerated catalyst activity, %
Ccokethe coke content on the catalyst, wt%
Gcatthe catalyst consumption, kg/s
Gfthe feedstock consumption, kg/s
cfthe feedstock heat capacity, J/kgK
ccatthe catalyst heat capacity, J/kgK
Tcatthe temperature of regenerated catalyst, K
yithe value of the i-th parameter (concentration)
yicalcthe calculated value of the i-th parameter (concentration)
na total amount of parameters
kamount of days under the studied
Ffitness function

References

  1. Zhou, X.; Zhai, Q.; Chen, C.; Yan, H.; Chen, X.; Zhao, H.; Yang, C. Technoeconomic Analysis and Life Cycle Assessment of Five VGO Processing Pathways in China. Energy Fuels 2019, 33, 12106–12120. [Google Scholar] [CrossRef]
  2. Vogt, E.T.C.; Weckhuysen, B.M. Fluid catalytic cracking: Recent developments on the grand old lady of zeolite catalysis. Chem. Soc. Rev. 2015, 44, 7342–7370. [Google Scholar] [CrossRef] [PubMed] [Green Version]
  3. Nefedov, B.K. Modernization of oil refineries as the basis for the development of the Russian oil refining industry in the period of 2010–2020. Catal. Ind. 2012, 4, 83–88. [Google Scholar] [CrossRef]
  4. Zhou, X.; Zhao, M.; Sheng, N.; Tang, L.; Feng, X.; Zhao, H.; Liu, Y.; Chen, X.; Yan, H.; Yang, C. Enhancing light olefins and aromatics production from naphthenic-based vacuum gas oil: Process integration, techno-economic analysis and life cycle environmental assessment. Comput. Chem. Eng. 2021, 146, 107207. [Google Scholar] [CrossRef]
  5. Boytsova, A.; Kondrasheva, N.; Ancheyta, J. Thermogravimetric Determination and Pyrolysis Thermodynamic Parameters of Heavy Oils and Asphaltenes. Energy Fuels. 2017, 31, 10566–10575. [Google Scholar] [CrossRef]
  6. Wolschlag, L.M.; Couch, K.A. Upgrade FCC performance. Hydrocarb. Process. 2010, 57–65. Available online: https://honeywelluop.chinacloudsites.cn/wp-content/uploads/2011/03/UOP-Upgrade-FCC-Performance-white-tech-paper.pdf (accessed on 31 May 2021).
  7. Pinheiro, C.I.C.; Fernandes, J.L.; Domingues, L.; Chambel, A.J.S.; Graça, I.; Oliveira, N.M.C.; Cerqueira, H.S.; Ribeiro, F.R. Fluid Catalytic Cracking (FCC) Process Modeling, Simulation, and Control. Ind. Eng. Chem. Res. 2012, 51, 1–29. [Google Scholar] [CrossRef]
  8. Moustafa, T.M.; Corella, J.; Froment, G.F. Kinetic modeling of coke formation and deactivation in the catalytic cracking of vacuum gas oil. Ind. Eng. Chem. Res. 2003, 42, 14–25. [Google Scholar] [CrossRef]
  9. Gilbert, W.R. Mathematical model of FCC catalyst deactivation. Chem. Eng. Commun. 2003, 190, 1485–1498. [Google Scholar] [CrossRef]
  10. Alonso-Ramírez, G.; Cuevas-García, R.; Sánchez-Minero, F.; Ramírez, J.; Moreno-Montiel, M.; Silva-Oliver, G.; Ancheyta, J. Catalytic hydrocracking of a Mexican heavy oil on a MoS2/al2o3catalyst: II. Study of the transformation of isolated aromatics fraction obtained from SARA analysis. Fuel 2021, 288, 119541. [Google Scholar] [CrossRef]
  11. Silva, D.C.M.; Oliveira, N.M.C. Optimization and nonlinear model predictive control of batch polymerization systems. Comput. Chem. Eng. 2002, 26, 649–658. [Google Scholar] [CrossRef] [Green Version]
  12. John, Y.M.; Patel, R.; Mujtaba, I.M. Maximization of propylene in an industrial FCC unit. Appl. Petrochem. Res. 2018, 8, 79–95. [Google Scholar] [CrossRef] [Green Version]
  13. Jiménez-García, G.; De Lasa, H.; Maya-Yescas, R. Simultaneous estimation of kinetics and catalysts activity during cracking of 1,3,5-tri-isopropyl benzene on FCC catalyst. Catal. Today 2014, 220–222, 178–185. [Google Scholar] [CrossRef]
  14. Radu, S.; Ciuparu, D. Modelling and Simulation of an Industrial Fluid Catalytic Cracking. Rev. Chim.-Ducharest-Orig. 2014, 65, 113–119. [Google Scholar]
  15. Al-Khattaf, S.; Saeed, M.R.; Aitani, A.; Klein, M.T. Catalytic Cracking of Light Crude Oil to Light Olefins and Naphtha over E-Cat and MFI: Microactivity Test versus Advanced Cracking Evaluation and the Effect of High Reaction Temperature. Energy Fuels 2018, 32, 6189–6199. [Google Scholar] [CrossRef]
  16. Olafadehan, O.A.; Sunmola, O.P.; Jaiyeola, A.; Efeoybokhan, V.; Abatan, O.G. Modelling and simulation of an industrial RFCCU-riser reactor for catalytic cracking of vacuum residue. Appl. Petrochem. Res. 2018, 8, 219–237. [Google Scholar] [CrossRef] [Green Version]
  17. Zhong, H.; Zhang, J.; Liang, S.; Zhu, Y. Two-fluid model with variable particle–particle restitution coefficient: Application to the simulation of FCC riser reactor. Part. Sci. Technol. 2020, 38, 549–558. [Google Scholar] [CrossRef]
  18. Shah, M.T.; Utikar, R.P.; Pareek, V.; Evans, G.M.; Joshi, J.B. Computational Fluid Dynamic Modelling of FCC Riser: A review. Chem. Eng. Res. Des. 2016, 111, 403–448. [Google Scholar] [CrossRef]
  19. John, Y.M.; Patel, R.; Mujtaba, I.M. Effects of compressibility factor on fluid catalytic cracking unit riser hydrodynamics. Fuel 2018, 223, 230–251. [Google Scholar] [CrossRef] [Green Version]
  20. Yang, F.; Dai, C.; Tang, J.; Xuan, J.; Cao, J. A hybrid deep learning and mechanistic kinetics model for the prediction of fluid catalytic cracking performance. Chem. Eng. Res. Des. 2020, 155, 202–210. [Google Scholar] [CrossRef]
  21. Sun, S.; Yan, H.; Meng, F. Optimization of a Fluid Catalytic Cracking Kinetic Model by Improved Particle Swarm Optimization. Chem. Eng. Technol. 2020, 43, 289–297. [Google Scholar] [CrossRef]
  22. Stratiev, D.S.; Shishkova, I.K.; Nikolaychuk, I.M.; Sharafutdinov, E.; Chavdarov, I.S.; Nikolova, R.; Mitkova, M.; Yordanov, D.; Rudnev, N. Impact of feed properties on gasoline olefin content in the fluid catalytic cracking. Pet. Sci. Technol. 2019, 34, 652–658. [Google Scholar] [CrossRef]
  23. Ioffe, I.I.; Pismen, L.M. Engineering Chemistry of Heterogeneous Catalysis; Chemistry: Moscow, Russia, 1965. (In Russian) [Google Scholar]
  24. Konno, H.; Ohnaka, R.; Nishimura, J.; Tago, T.; Nakasaka, Y.; Masuda, T. Kinetics of the catalytic cracking of naphtha over ZSM-5 zeolite: Effect of reduced crystal size on the reaction of naphthenes. Catal. Sci. Technol. J. 2014, 4, 1–9. [Google Scholar] [CrossRef] [Green Version]
  25. Konno, H.; Okamura, T.; Kawahara, T.; Nakasaka, Y.; Tago, T.; Masuda, T. Kinetics of n-hexane cracking over ZSM-5 zeolites—Effect of crystal size on effectiveness factor and catalyst lifetime. Chem. Eng. J. 2012, 207, 490–496. [Google Scholar] [CrossRef] [Green Version]
  26. YanFeng, L.; JiQin, Z.; Hui, L.; Peng, H.; Peng, W.; HuiPing, T. Theoretical study of 1-hexene activation over La/ZSM-5 zeolite. J. Beijing Univ. Chem. Technol. (Nat. Sci. Ed.) 2011, 3, 6–11. [Google Scholar]
  27. Wojciechowski, B.W.; Corma, A.; Dekker, M. Catalytic Cracking: Catalysis, Chemistry, and Kinetics. AlChE J. 1987, 33, 1581. [Google Scholar]
  28. Xian, X.; Liu, G.; Zhang, X.; Wang, L.; Mi, Z. Catalytic cracking of n-dodecane over HZSM-5 zeolite under supercritical conditions: Experiments and kinetics. Chem. Eng. Sci. 2010, 65, 5588–5604. [Google Scholar] [CrossRef]
  29. Nagamatsu, S.; Inomata, M.; Imura, K.; Kishida, M.; Wakabayashi, K. Conversion of Light Naphtha to Aromatic Hydrocarbons. Part 4. Kinetic Study of Hexane Conversion Catalyzed by Platinum Supported on Zeolite L. J. Jpn. Pet. Inst. 2001, 44, 351–359. [Google Scholar] [CrossRef] [Green Version]
  30. Fierro, V.; Duplan, J.L.; Verstraete, J.; Schuurman, Y.; Mirodatos, C. A non-stationary kinetics approach for the determination of the kinetic parameters of the protolytic cracking of methylcyclohexane. Stud. Surf. Sci. Catal. 2001, 133, 341–348. [Google Scholar]
  31. Fernandes, J.L.; Verstraete, J.J.; Pinheiro, C.I.C.; Oliveira, N.M.C.; Ramoa Ribeiro, F. Dynamic modelling of an industrial R2R FCC unit. Chem. Eng. Sci. 2007, 62, 1184–1198. [Google Scholar] [CrossRef]
  32. Chen, C.; Yang, B.; Yuan, J.; Wang, Z.; Wang, L. Establishment and solution of eight-lump kinetic model for FCC gasoline secondary reaction using particle swarm optimization. Fuel 2007, 86, 2325–2332. [Google Scholar] [CrossRef]
  33. Behjat, Y.; Shahhosseini, S.; Marvast, M.A. CFD analysis of hydrodynamic, heat transfer and reaction of three phase riser reactor. Chem. Eng. Res. Des. J. 2011, 89, 978–989. [Google Scholar] [CrossRef]
  34. Chu, K.; Wang, B.; Xu, D.L.; Chen, Y.X.; Yu, A. CFD–DEM simulation of the gas–solid flow in a cyclone separator. Chem. Eng. Sci. J. 2011, 66, 834–847. [Google Scholar] [CrossRef]
  35. Liang, C.; Danhong, Z.; Shuangying, X.; Xin, L. Reaction Mechanism of Ethylene Aromatization over HZSM-5 Zeolite: From C4 to C6 Intermediates. Chin. J. Catal. 2010, 31, 645–650. [Google Scholar]
  36. Ivashkina, E.; Nazarova, G.; Ivanchina, E.; Oreshina, A.; Vymyatnin, E. A predictive model of catalytic cracking: Feedstock-induced changes in gasoline and gas composition. Fuel Proc. Technol. 2021, 106720, in press. [Google Scholar]
  37. Agrawal, N.; Rangaiah, G.P.; Ray, A.K.; Gupta, S.K. Multi-objective Optimization of the Operation of an Industrial Low-Density Polyethylene Tubular Reactor Using Genetic Algorithm and Its Jumping Gene Adaptations. Ind. Eng. Chem. Res. 2006, 45, 3182–3199. [Google Scholar] [CrossRef]
  38. Stull, D.R.; Westrum, E.F.; Sinke, G.C. The Chemical Thermodynamics of Organic Compounds; John & Wiley: New York, NY, USA, 1969. [Google Scholar]
  39. Chuzlov, V.; Nazarova, G.; Ivanchina, E.; Ivashkina, E.; Dolganova, I.; Solopova, A. Increasing the economic efficiency of gasoline production: Reducing the quality giveaway and simulation of catalytic cracking and compounding. Fuel Proc. Technol. 2019, 196, 106139. [Google Scholar] [CrossRef]
  40. Ivanchina, E.; Ivashkina, E.; Nazarova, G. Mathematical modelling of catalytic cracking riser reactor. Chem. Eng. J. 2017, 329, 262–274. [Google Scholar] [CrossRef]
Figure 1. Thermogravimetry results: (a) thermogram for spent catalyst; (b) mass distribution.
Catalysts 11 00701 g001
Figure 2. Kinetic scheme of catalytic cracking to predict the contents of the gasoline and the gas hydrocarbons as well as the coke: k is reaction rate constant; kn is the average number of naphthenic rings; ka is average number of aromatic rings; CNAC—condensed naphthenic–aromatic compounds: HMW—high molecular weight.
Catalysts 11 00701 g002
Figure 3. Model and experimental results: (a) yields of gasoline; (b) light gasoil yield; (c) gas and coke yield; and a graph of sensitivity of one component to time step (d).
Catalysts 11 00701 g003aCatalysts 11 00701 g003b
Figure 4. The sensitivity of the model to SAR content in feedstock.
Catalysts 11 00701 g004
Figure 5. Effect of the main process variables on cracking temperature.
Catalysts 11 00701 g005
Figure 6. Effect of the main process variables on cracking temperature and consumption of product components.
Catalysts 11 00701 g006aCatalysts 11 00701 g006b
Figure 7. Feedstock-induced changes in product yields and RON of gasoline: (a) when vacuum distillate (VD) and residual feedstock (R) are converted; (b) when different ratio of vacuum distillate (VD) and residual feedstock (R) are converted.
Catalysts 11 00701 g007
Figure 8. The major operating variables of catalytic cracking and prediction ability of the model.
Catalysts 11 00701 g008
Table 1. Results of laboratory study of catalytic cracking feedstocks.
Properties, CompositionVDR
Density 15 °C, g/cm30.90060.910
Saturates, wt%71.855.8
Aromatics, wt%25.940.1
Resins, wt%2.34.1
Table 2. Acid properties of the spent and regenerated catalysts.
CharacteristicRegenerated CatalystSpent Catalyst
Concentration of the acid sites, µmol/g224156
Temperature of peak maximum, °C140125
Content of coke on the catalyst, wt%0.0230.482
Table 3. Process variables, feedstock and products properties to develop the model.
ReactionValue
Feedstock:-
Consumption, tons/d2732.3–4552.3
Temperature, °C279.5–298.2
Density, g/cm30.88–0.91
Content of saturates, wt%51.9–72.7
Ratio of carbon in alkanes to cycloalkanes by n-d-m-method2.63–2.95
Content of aromatics, wt%24.5–45.10
Content of resins, %2.3–4.1
Gasoline:-
Consumption, tons/d1098.2–2113.9
Alkanes, wt%3.3–4.0
Isoalkanes, wt%25.9–35.9
Alkenes, wt%17.5–25.0
Cycloalkanes, wt%6.7–9.2
Aromatics, wt%33.3–41.0
Wet gas:-
Consumption, tons/day1036.5–1349.5
Gas, wt%8.6–14.16
PPF, wt%23.7–32.8
BBF, wt%32.08–42.99
Light gasoil:-
Consumption, tons/day283.2–585.1
Saturated hydrocarbons, wt%25.9–27.1
Aromatics, wt%72.38–73.75
Resin compounds, wt%0.34–0.53
Heavy gasoil:-
Consumption, tons/day100.9–401.1
Saturated hydrocarbons, wt%9.42–11.64
Aromatics, wt% 83.62–84.13
Resinous (and asphaltenes) compounds, wt%5.85–6.45
Coke yield, tons/day137.7–243.2
Other Process variables:-
Cracking temperature, °C525–530
Pressure, MPa0.12–0.16
Slops consumption to riser, m3/h10.7–16.3
Steam feed to reactor gripper device, kg/h0–5500
Steam consumption to spray the feedstock, kg/h2400–2520
Regenerated catalyst temperature, °C670.4–680.9
Catalyst to feedstock ratio, tonscat/tonsfeed8–10
Table 4. The thermodynamic and kinetic patterns of catalytic cracking.
No.ReactionΔr810–848, kJ/molΔr810–848, kJ/molk803.4, s−1/L·s−1mol−1
1C13–C40 Alkanes ↔ C5–C12 Alkanes + C5–C12 Unsaturated HC64.7–64.2 *−(70.3–76.6) *0.1
2C13–C40 Alkanes ↔ C5–C12 Isoalkanes + C5–C12 Unsaturated HC 65.3–64.8 *−(64.5–70.6) *0.63
3HMW Cycloalkanes ↔ C5–C10 Cycloalkanes + 2 C5–C12Unsaturated HC100.8–99.7 *−(191.5–204.6) *0.42
4HMW Aromatics ↔ C5–C12 Aromatics + 2 C5–C12Unsaturated HC134.0–133.1−(143.0–156.1) *0.29
5HMW Cycloalkanes ↔ C5–C12 Aromatics + 2H2+PPF267.4–266.9 *−(138.5–156.9) *0.11
6C5–C12 N-alkanes ↔ PPF+BBF77.5–77.1−(36.6–41.9)0.07
7C5–C12 Isoalkanes ↔ PPF+BBF70.2–69.8−(40.2–45.4)0.071
8C5–C12Unsaturated HC ↔ 2 Gas88.2–78.3−(22.3–37.1)0.09
9C5–C12 Unsaturated HC ↔ BBF + BBF78.1–77.7−(35.3–40.6)0.11
10C5–C12 Unsaturated HC ↔ PPF + PPF77.8–77.3−(36.1–41.4)0.072
11C6–C12 Aromatics ↔ C6–C12 Aromatics + C5–C12 Unsaturated HC80.0–79.6−(17.3–21.9)0.06
12C5–C12 Unsaturated HC C5–C10↔ C5–C10 Cycloalkanes−(92.2–91.6)−(25.1–22.0)0.019
13C5–C12 Unsaturated HC + PPF↔ C5–C12 Aromatics + 2H2−(71.2–70.9)−(106.9–108.6)1.1
142 C5–C12 Unsaturated HC ↔ C5–C10 Cycloalkanes + C5–C12 Isoalkanes 2−(85.2–85.3) *−(40.1–38.1) *7.14
15C5–C12 Unsaturated HC + C5–C10 Cycloalkanes ↔ C5–C12 Aromatics + C5–C12 Isoalkanes−(169.3–169.6) *−(162.1–161.9) *36.30
16C6–C12 Aromatics + C5–C12 Unsaturated HC ↔ HMW Aromatics + 2H2−(9.6–9.0) *−(47.2–42.1) *0.35
17HMW Aromatics + C6–C12 Aromatics ↔ CNAC + 2H252.2–48.4 *−(32.0–36.5) *1.44
18CNAC ↔ COKE + 3H2−26.4–113.5−(378.5–669.0) *0.70
* marked asterisk were defined by quantum-chemical methods (DFT (B3LYP, basis 3–21G).
Table 5. Change in the major operating variables for model validation.
Process ConditionValue
Feedstock consumption, m3/h160.5–265.0
Feedstock temperature, C279.5–305.2
Slops consumption to riser, m3/h0.0–19.2
Steam feed to reactor gripper device, kg/h5499.5–6880
Steam consumption to spray the feedstock, kg/h2400.0
Regenerated catalyst temperature, K659.3–665
Cracking temperature, C523.0–530.1
Reactor pressure, MPa0.11–0.15
Catalyst to feedstock ratio, tonscat/tonsfeed7.14–9.4
Table 6. Feedstock composition to define the model sensitivity.
Process ConditionContent, wt%
SaturatesAromaticsResins
167.230.42.4
270.127.22.7
362.135.22.7
463.533.92.6
559.737.82.4
672.724.52.8
755.841.42.7
858.139.22.8
960.436.53.1
1051.945.13.0
Table 7. Operating variables to model-based calculations.
Process ConditionsValue
Feedstock consumption, m3/h189.1
Feedstock temperature, °C297.6
Slops flow rate to reactor, m3/h19.18
Water vapor flow to reactor gripper, kg/h.6880.0
Water vapor consumption for spraying feedstocks, kg/h2400.0
Regenerated catalyst temperature, °C661.4
Cracking temperature, °C527.8
Pressure in the reactor, MPa0.13
Catalyst/oil ratio, tonscat/tonsfeedstock9.2
Publisher’s Note: MDPI stays neutral with regard to jurisdictional claims in published maps and institutional affiliations.

