
Octahedral Growth of PtPd Nanocrystals
by
 , , , and
Diana Nelli
1 ,
,
Cesare Roncaglia
1,
Samuel Ahearn
2,
Marcel Di Vece
2,
Riccardo Ferrando
3,* and
Chloé Minnai
4,* 1
Dipartimento di Fisica dell’Università di Genova, Via Dodecaneso 33, 16146 Genova, Italy
2
Interdisciplinary Centre for Nanostructured Materials and Interfaces (CIMaINa) and Physics Department “Aldo Pontremoli”, University of Milan, Via Celoria 16, 20133 Milan, Italy
3
Dipartimento di Fisica dell’Università di Genova and CNR-IMEM, Via Dodecaneso 33, 16146 Genova, Italy
4
Molecular Cryo-Electron Microscopy Unit, Okinawa Institute of Science and Technology Graduate University, 1919-1 Tancha, Onna-Son, Kunigami-Gun, Okinawa 904-0495, Japan
*
Authors to whom correspondence should be addressed.
Catalysts 2021, 11(6), 718; https://0-doi-org.brum.beds.ac.uk/10.3390/catal11060718
Submission received: 17 May 2021
/
Revised: 1 June 2021
/
Accepted: 3 June 2021
/
Published: 9 June 2021
(This article belongs to the Special Issue Heterogeneous Catalysts Optimization: From Material Design to Properties)
Abstract
:PtPd nanoparticles are among the most widely studied nanoscale systems, mainly because of their applications as catalysts in chemical reactions. In this work, a combined experimental-theoretical study is presented about the dependence of growth shape of PtPd alloy nanocrystals on their composition. The particles are grown in the gas phase and characterized by STEM-HRTEM. PtPd nanoalloys present a bimodal size distribution. The size of the larger population can be tuned between 3.8 ± 0.4 and 14.1 ± 2.0 nm by controlling the deposition parameters. A strong dependence of the particle shape on the composition is found: Pd-rich nanocrystals present more rounded shapes whereas Pt-rich ones exhibit sharp tips. Molecular dynamics simulations and excess energy calculations show that the growth structures are out of equilibrium. The growth simulations are able to follow the growth shape evolution and growth pathways at the atomic level, reproducing the structures in good agreement with the experimental results. Finally the optical absorption properties are calculated for PtPd nanoalloys of the same shapes and sizes grown in our experiments.
1. Introduction
Binary metallic clusters and nanoparticles (BNPs, also known as nanoalloys) [1,2,3,4,5] have received increasing attention in recent years due to their applications in various fields, among which catalysis is traditionally the most important. Further applications are found in plasmonics, data storage and biomedicine [6]. In addition to the size-dependent properties of elemental nanoparticles, nanoalloys present composition-dependent properties. On one hand, this makes nanoalloys more versatile than elemental nanoparticles for specific and tailored applications. On the other hand, this further degree of freedom increases the complexity of the energy landscapes compared to elemental nanoparticles so that the control of nanoalloy shapes in their formation process may be more challenging. For this reason, detailed studies of the formation processes of nanoalloys are extremely important. Specifically, the study of growth processes in very clean environments, such as the gas phase [7], is essential to unravel the dominant pathways leading to the growth of nanoparticles of different shapes. These studies often take advantage of combined experiment-simulation efforts [8,9,10,11,12,13,14,15,16,17,18,19,20].
The investigation of the formation mechanisms of BNPs is therefore a key step in view of producing nanoparticles with the desired properties for applications [1,21,22,23]. In particular, chemical reactions usually occur at the nanoparticle surfaces, so that they are strongly influenced by the morphology of the surface itself, which may comprise different types of facets, edges, and defects.
In this work, we study the growth of PtPd nanoalloys of different compositions. PtPd nanoparticles are among the most widely studied nanoscale systems, mainly because of their applications as catalysts in chemical reactions. Their activity is superior to that of the corresponding elemental Pt and Pd nanoparticles in many reactions [24,25,26,27,28,29].
Our PtPd nanoalloys are grown in the gas phase and their structures are analyzed by HAADF/STEM, this being a well established technique for characterizing PtPd nanoalloys [30,31]. In Ref. [8], we focused on the analysis of their chemical ordering, showing that the gas-phase growth leads to the formation of structures with a peculiar type of non-equilibrium patterns, in which the core of the nanoparticle contains both metals, while the shell is strongly enriched in the majority element (PtPd@Pt and PtPd@Pd chemical ordering, for Pt-rich and Pd-rich nanoalloys, respectively). Here, we focus on the analysis of the geometric shapes of PtPd nanoalloys, specifically addressing the problem of the dependence of the shape on composition. As we will show in the following, even if both Pt-rich and Pd-rich compositions lead to the formation of nanocrystals (i.e., of crystalline fragments of the bulk lattice), the nanocrystal shapes differ in the two cases. In order to understand the growth pathways of these nanocrystals, we perform molecular dynamics (MD) simulations. By means of MD simulations, the growth shape evolution and growth pathways can be followed at the atomic level. Unlike Monte Carlo growth simulations, which always assume some sort of approximated coarse-grained kinetics, MD simulations reproduces physically correct trajectories of the atoms. Finally we calculate the optical properties of Pd-rich PtPd nanoparticles of the same shape and size grown in our experiments.
2. Results and Discussion
2.1. Bimodal Distribution
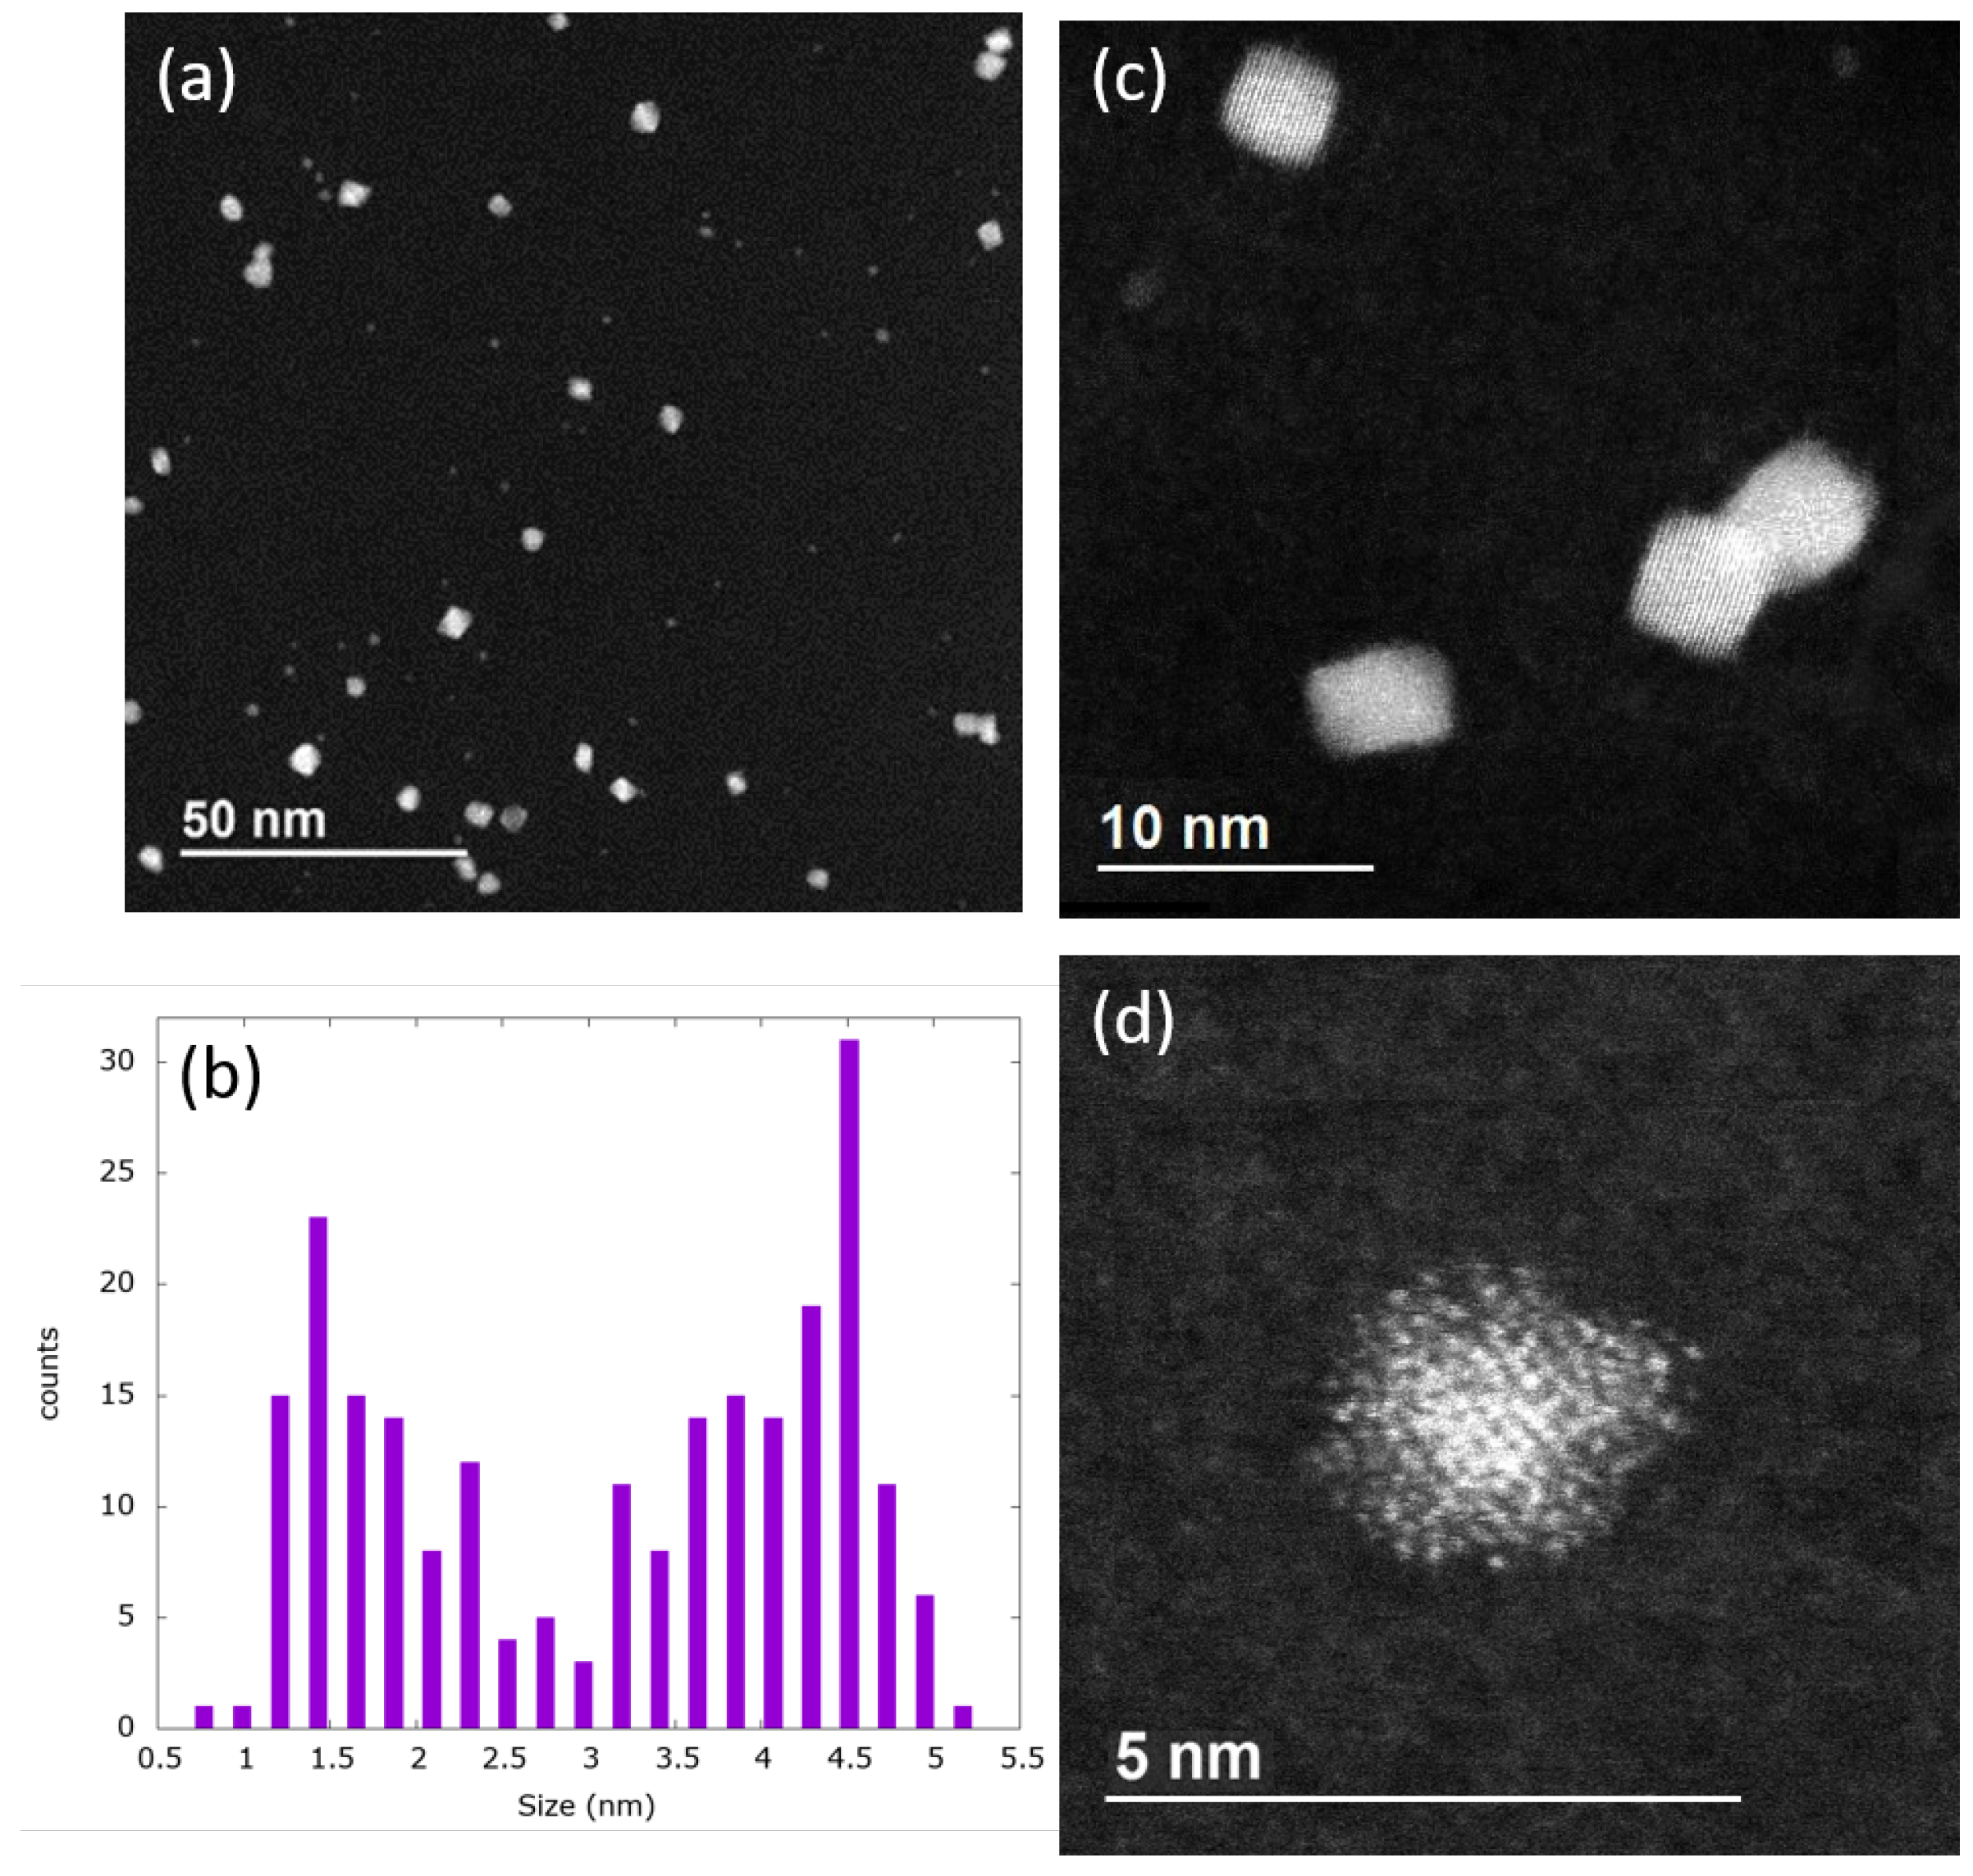
Let us consider first a distribution of PtPd NPs, grown in a Pt-rich atomic vapor (PtPd). At low magnification, we can observe that the NPs grown in these conditions present a bimodal size distribution, with two well separated nanoparticle populations. A histogram of the size distribution reveals that the larger population has an average size 4.2 nm ± 0.4 nm and the smaller one of 1.7 ± 0.4 nm (see Figure 1).
At higher magnification (Figure 1c,d), we can see that the nanoalloys of both populations have crystalline structurew, with well defined truncated octahedral shapes in the larger population. We note that the presence of sub-2 nm nanoparticles has been reported in pure Ag and Pt samples grown by a magnetron-sputtering source. They were believed to originate from a charging effect of the clusters [32,33]. Similar features were also observed in PtPd systems grown by a chemical synthesis approach [34]. However, in this last case, the sub-2 nm NPs decorated the surface of larger NPs with diameters of ∼20 nm. We finally note that the relative percentage of the two populations depends on the pressure in the deposition chamber (P). By increasing this pressure, we observe a reduction in the% sub–2 nm NPs, which become roughly zero when P is higher than 8 × 10 mbar.
2.2. Controlling the Size Distribution of Ptpd Nps
Magnetron sputtering enables the control the size of the NPs by varying the sputtering conditions. Larger particles are generally obtained by increasing the powers applied to the targets, which increases the sputtering yield. Particle size can be controlled by varying the residence time of the NPs in the aggregation zone (AZ) where the clusters collides forming larger NPs. This can be achieved by mechanically varying the length of the AZ, and tuning the difference of between the pressure in the source (P) and in deposition chamber. The former way to control the size has been widely characterized in the literature for several mono- and bimetallic systems [35]. For instance, Pratonep et al. [36] found a shift in the size distribution of Ag clusters of about 20% towards larger masses when the AZ length was increased by 2–3 cm. On the other hand, the effects of tuning the pressure difference have been poorly characterized. Intuitively, an increase in P at constant P decreases the overall difference of pressure between the two regions, and hence the acceleration of the NPs towards the deposition chamber. In this way, the nanoparticles have more time for growing, so that their average size increases. Here, we combined both these approaches to tune the size distribution in a wider range of values.
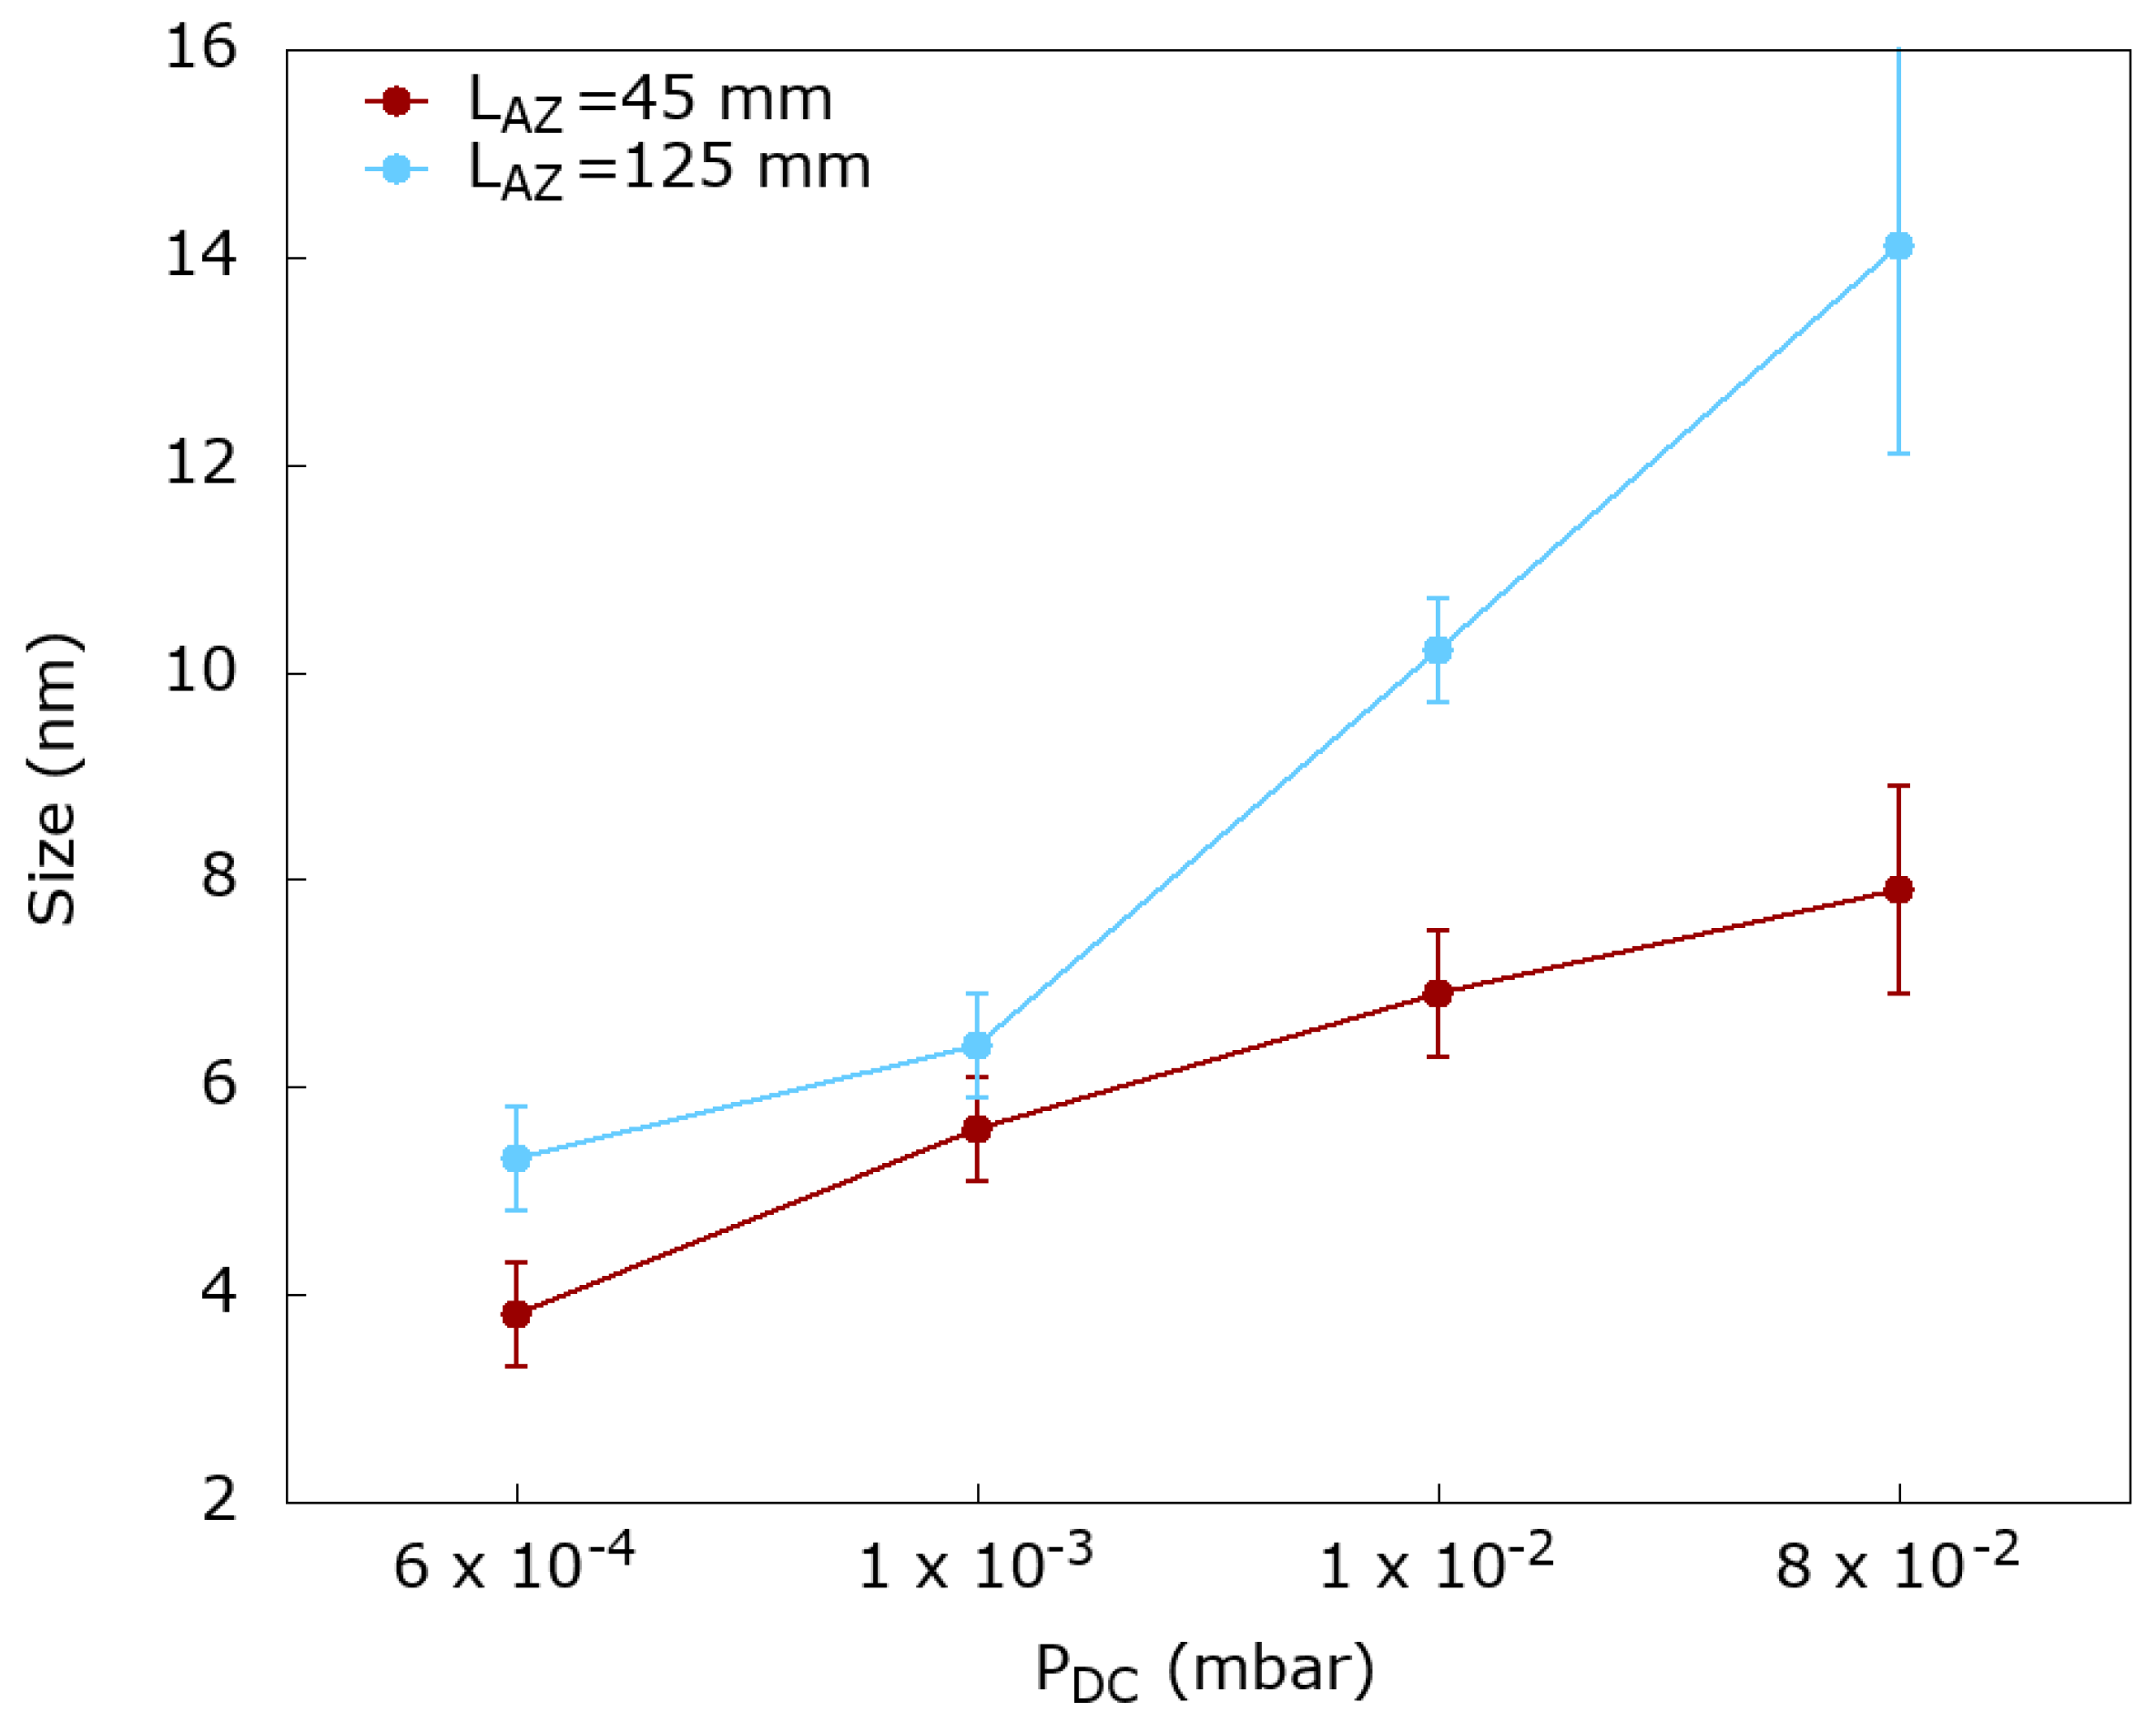
In Figure 2, we summarize the effects of increasing the P from 6.5 × 10 to 8 × 10 mbar keeping P and other sputtering parameters constant. We tested this effect for two different L: 45 and 125 mm, the minimum length to have a stable plasma and the maximum one.
We observed that increasing both P and L causes an increase in the NP size. Particularly, at L = 45 mm, the size distributions peaked at 3.8, 5.6, 6.9, 7.9 nm for depositions grown at a P of 6 × 10, 1 × 10, 1 × 10 and 8 × 10, respectively. Increasing L to 125 mm those values rise to 5.2, 7.1, 10.3 and 14.1 nm, i.e., with an increment between 27% and 49%.
Other observations can be made considering the same data set as a function of P. We observe that rising P from 10 to 10 mbar causes an overall increase in the particle size of 82% for the populations grown at L = 45 mm and of 98% for distributions grown at L = 125 mm. This indicates that the effect of increasing the residence time of the particles in the AZ by reducing the difference of pressure between source and deposition chamber has a remarkably bigger effect on the size distribution than just increasing the length of AZ. We also note that an increase in P also causes an overall decrease in the deposition rate of 30%, in agreement with the formation of larger NPs.
2.3. Composition vs. Facets
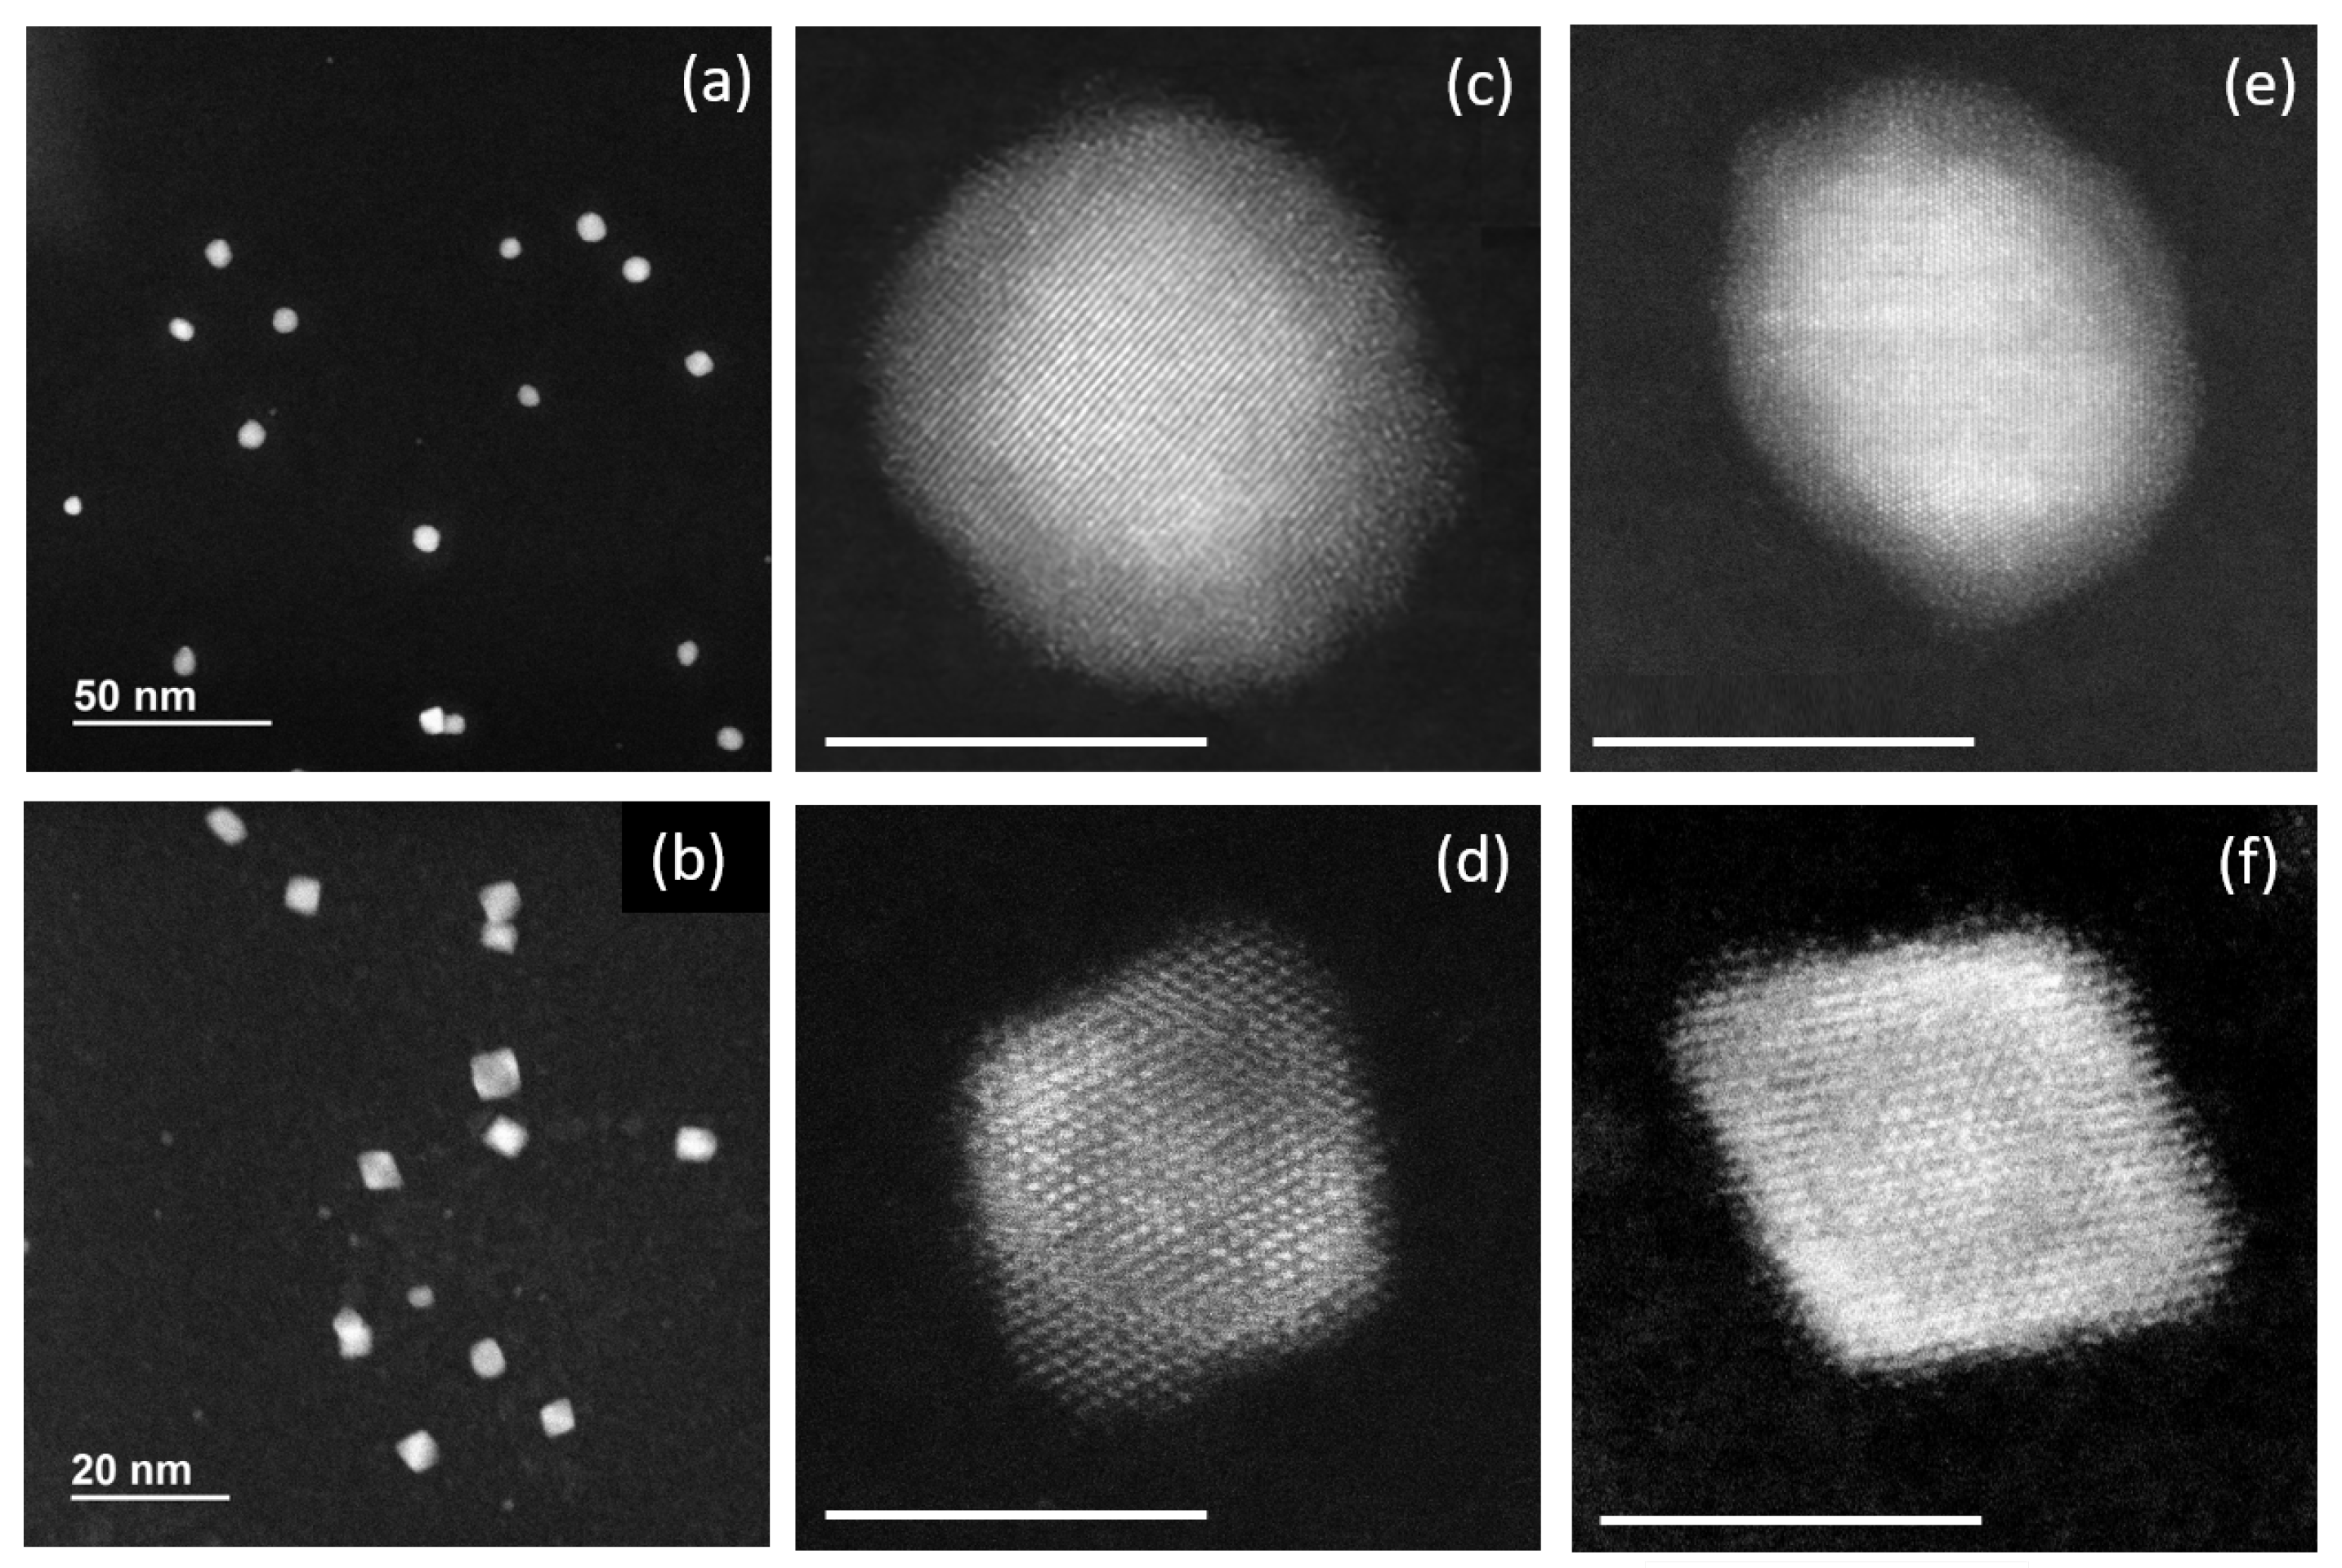
Two distributions of PtPd NPs are shown in Figure 3. The first was grown in an 80% Pd-rich atmosphere (top row) and the second was grown in a 70% Pt-rich one (bottom row). These compositions result in (PtPd)@Pd and (PtPd)@Pt core-shell NPs, respectively [8]. In addition to giving two different chemical orderings, these compositions lead to the formation of particles with different shapes.
By comparing the two distributions, we can see that the particles grown in a Pd-rich environment are quasi-spherical, while the ones grown in a Pt-rich atmosphere show more evident sharp edges and tips. At higher magnification, we can notice that both Pd-rich and Pt-rich nanoparticles tend to be octahedral, with some degree of truncation. These nanoalloys are therefore nanocrystals, i.e., fragments of the bulk fcc lattice. The high-maginification images confirm that more rounded shapes are formed in Pd-rich nanoalloys, whereas sharper edges and tips tips are generally found in Pt-rich nanoalloys.
2.4. Simulation Results
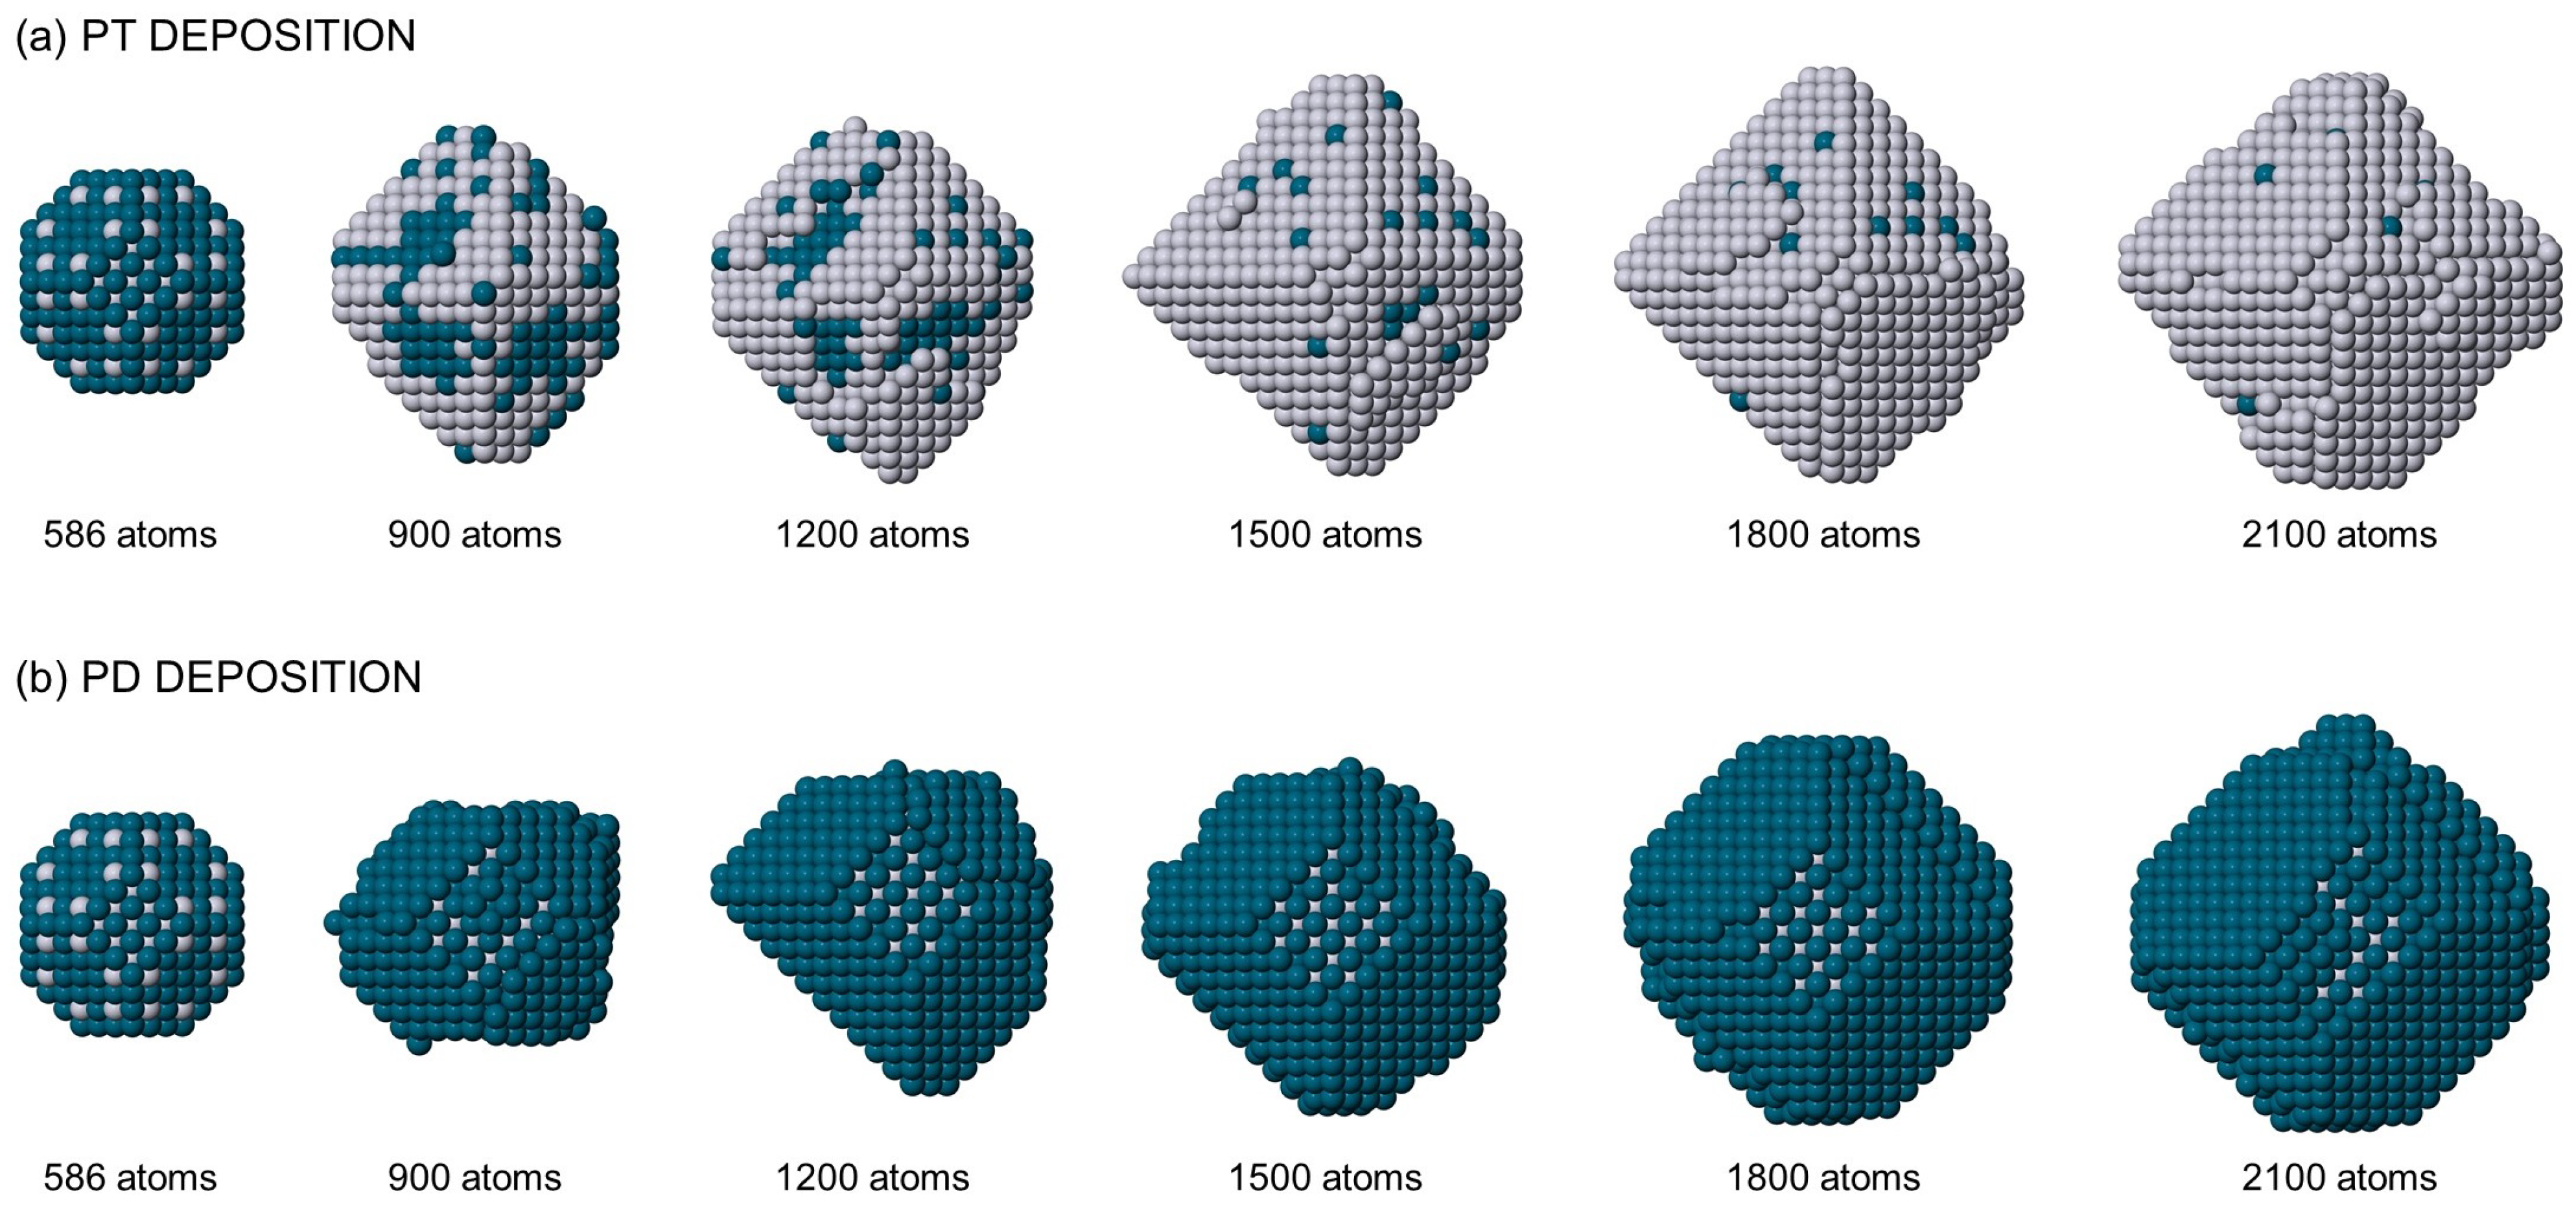
The experimental data of the previous section reveal that the most common PtPd nanoalloy structures belong to the octahedral motif. The octahedra always present some degree of truncation, and in general, the shapes of Pd-rich nanoalloys are more rounded than those of Pt-rich nanoalloys, which often show quite sharp tips. Truncated octahedra with rectangular base were also observed. In order to rationalize these findings, we performed MD simulations of nanoalloy growth. These simulations started from a regular truncated octahedron of 586 atoms with 50–50% compositions and intermixed chemical ordering. This structure is representative of the equilibrium configurations of relatively small nanoparticles of diameters in the range of 2–3 nm, and its composition reflects that of nanoalloys in the early stages of growth, for both Pt-rich and Pd-rich nanoalloys, as shown in Ref. [8]. On top of this seed, we deposited either Pd atoms or Pt atoms to reach sizes up to 2100 atoms. This is to simulate the later stages of growth, in which the metal vapour is even more enriched in the majority element, because the minority element is almost completely consumed in the early part of the growth [8,14]. Atoms are deposited by placing them initially at random on a sphere, whose radius is larger than the maximum radius of the growing cluster by 0.5 nm, with initial velocity directed towards the cluster. The deposition rate is of 1 atom every ns. Simulations temperatures are of 600, 700, 800 and 900 K. For each temperature, four independent simulations were run.
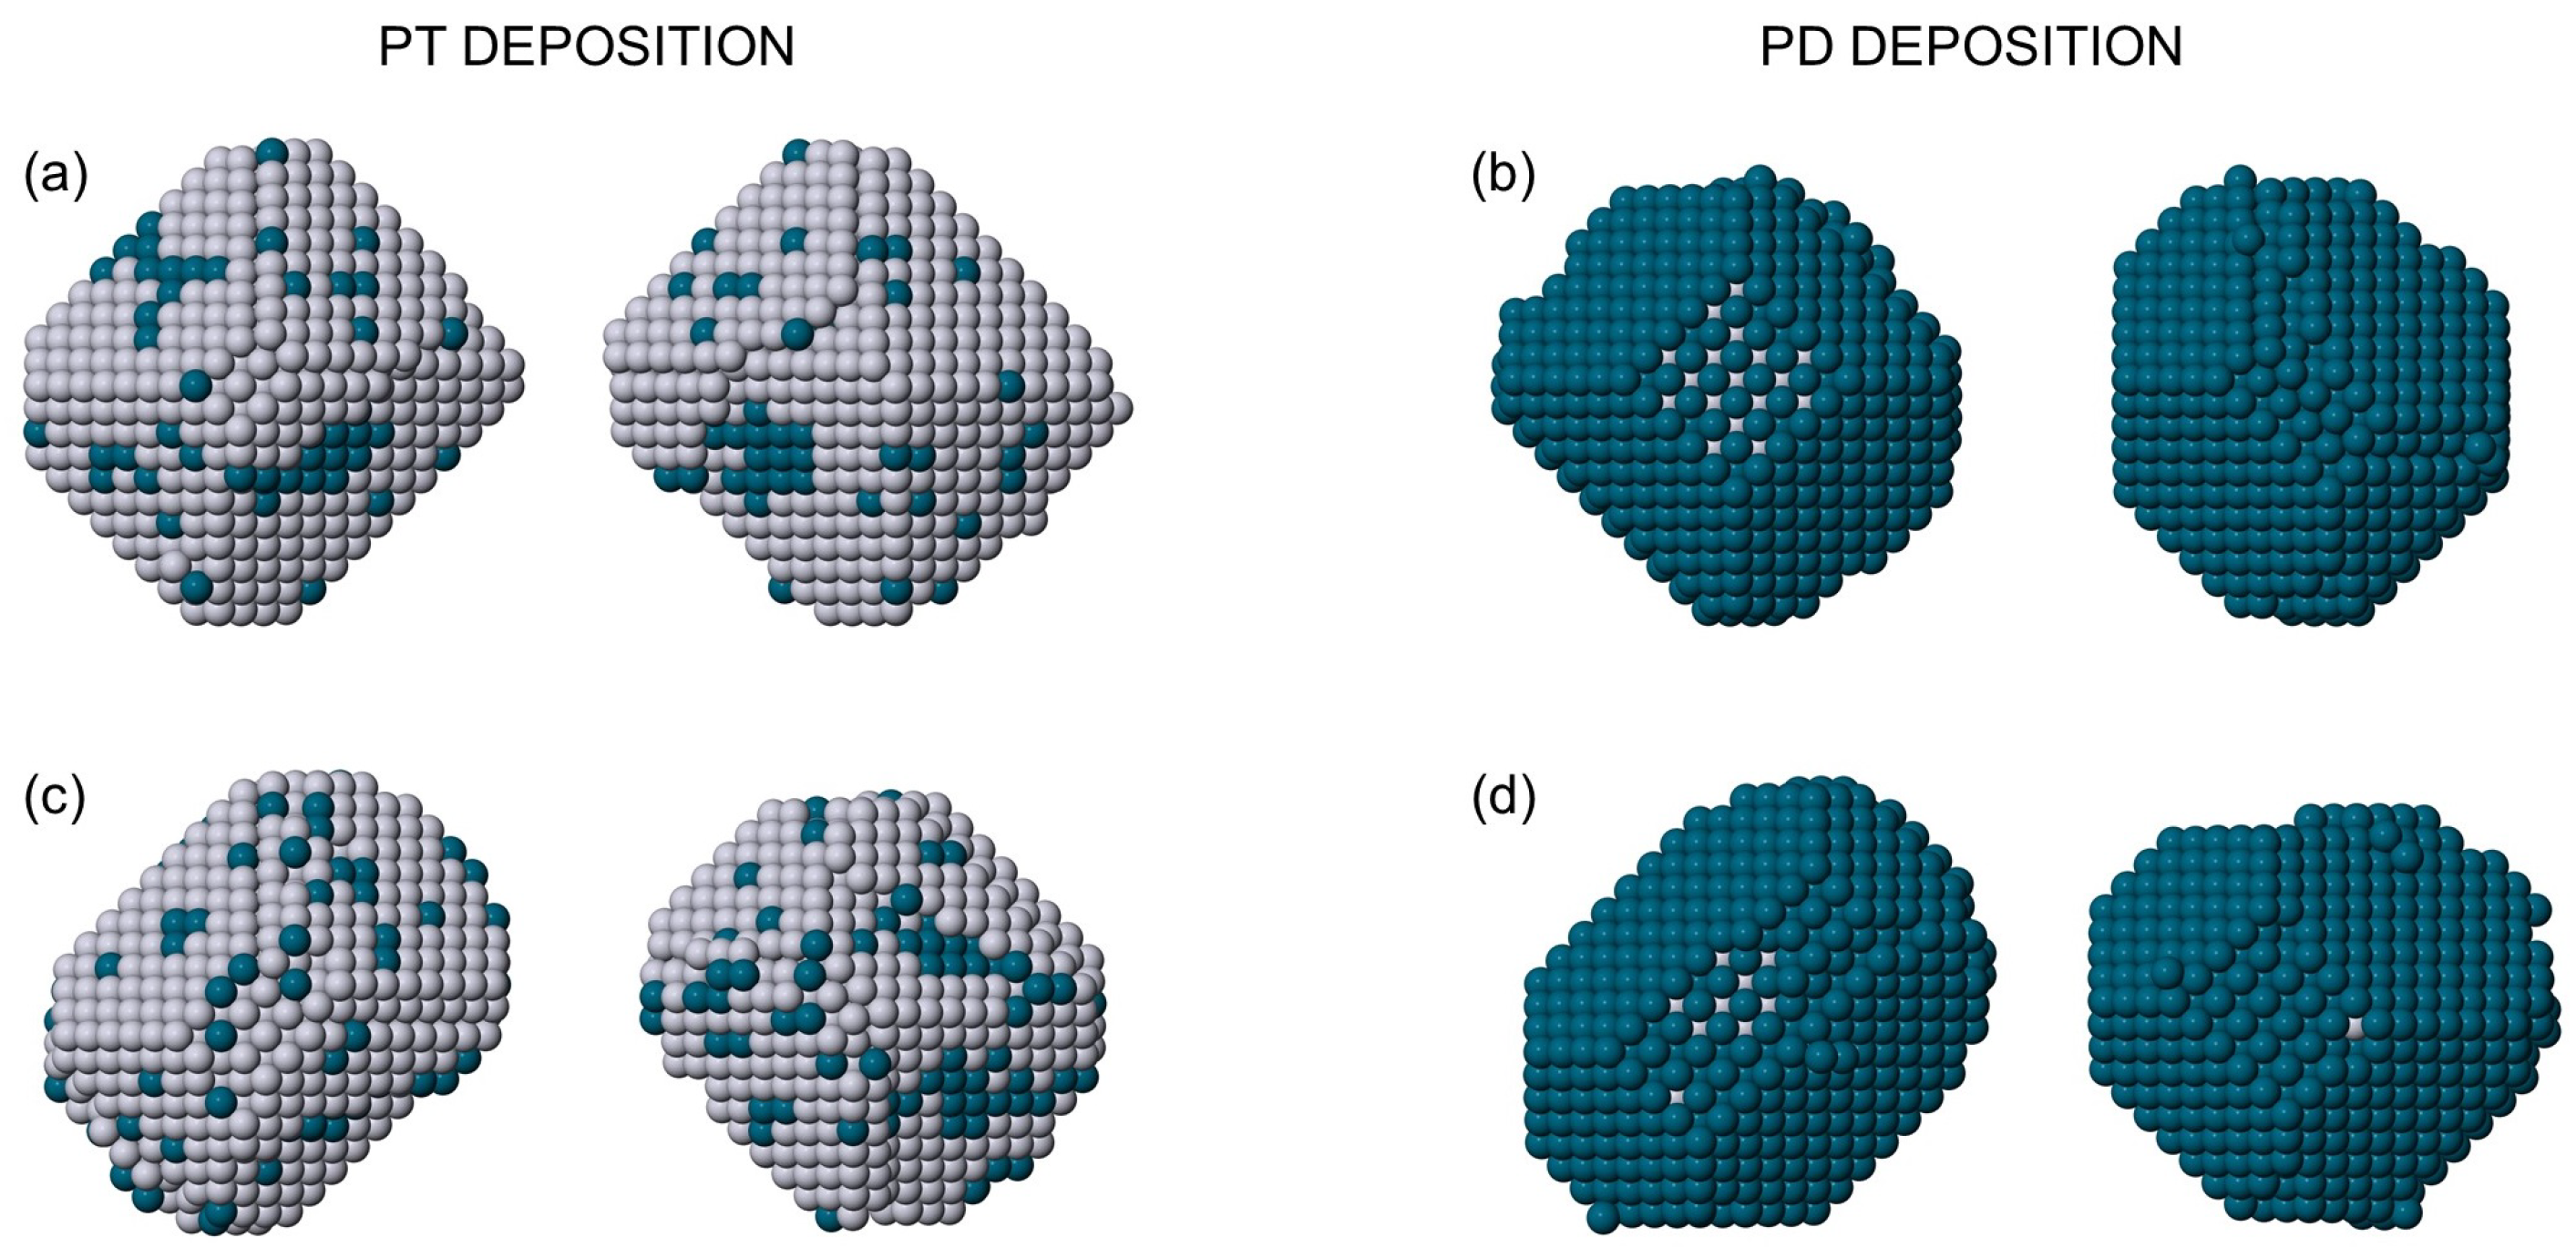
In Figure 4, we show some typical truncated octahedral structures grown in our simulations. While the structures in Figure 4a,b keep the square symmetry of the initial seed of 586 atoms to some extent, the structures in Figure 4c,d show a transition towards more elongated shapes with rectangular bases. In these structures, the octahedral tips are sharper than in the initial regular truncated octahedron, especially for the Pt-rich case. Both the formation of rectangular shapes and the sharpening of the tips hint at the presence of non-equilibrium effects in the growth of these nanoalloys. This will be discussed in the following.
Growth sequences at 700 and 800 K for Pt and Pd deposition are shown in Figure 5a,b. These sequences are representative of the typical growth behavior. We note that while the Pd-rich nanoalloy still maintains an appreciable degree of vertex truncation during its evolution, the Pt-rich nanoalloy quickly formed an almost perfect octahedron with quite sharp tips.
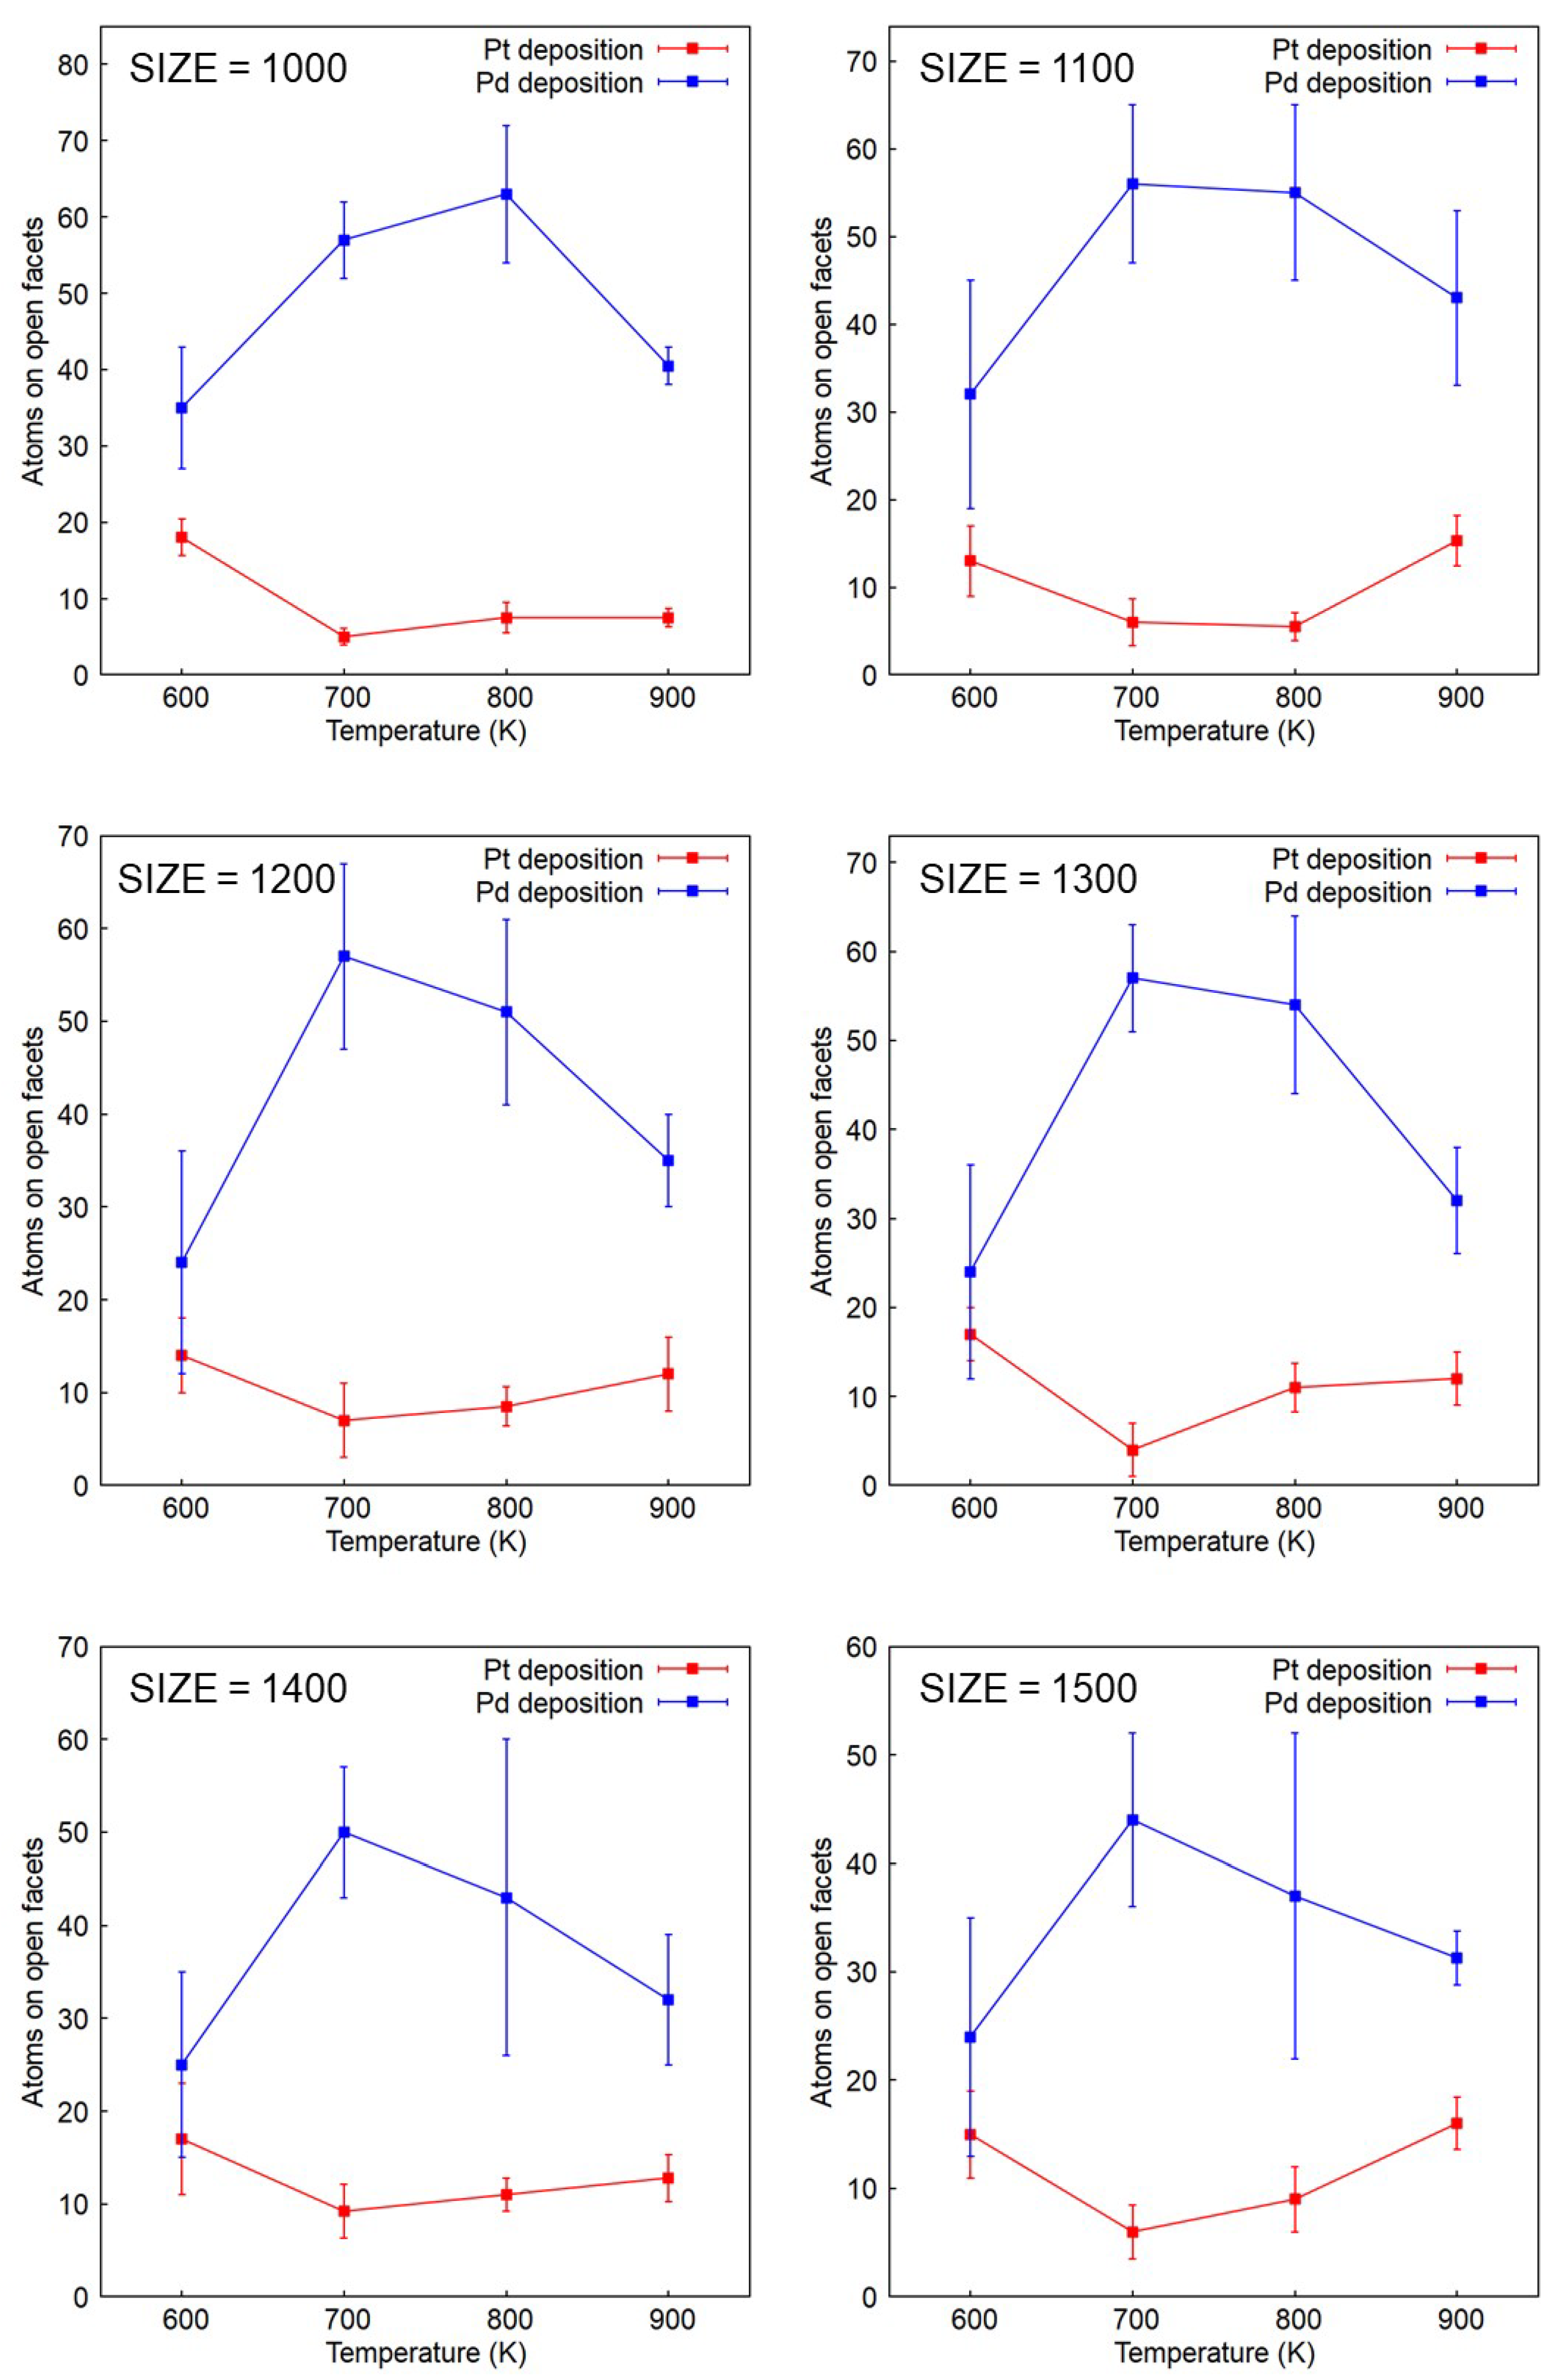
The degree of truncation of these growing nanoalloys was quantified with the aid of the data in Figure 6, where we report the number of terrace atoms on open facets (mostly (100) facets) at different stages of the growth and for all simulation temperatures. is a measure of the degree of tip truncation, because a deeper truncation forms a larger (100) facet. The results of Figure 6 show that is consistently much larger in nanoalloys grown by Pd deposition than in those formed by Pt deposition, for all temperatures and sizes.
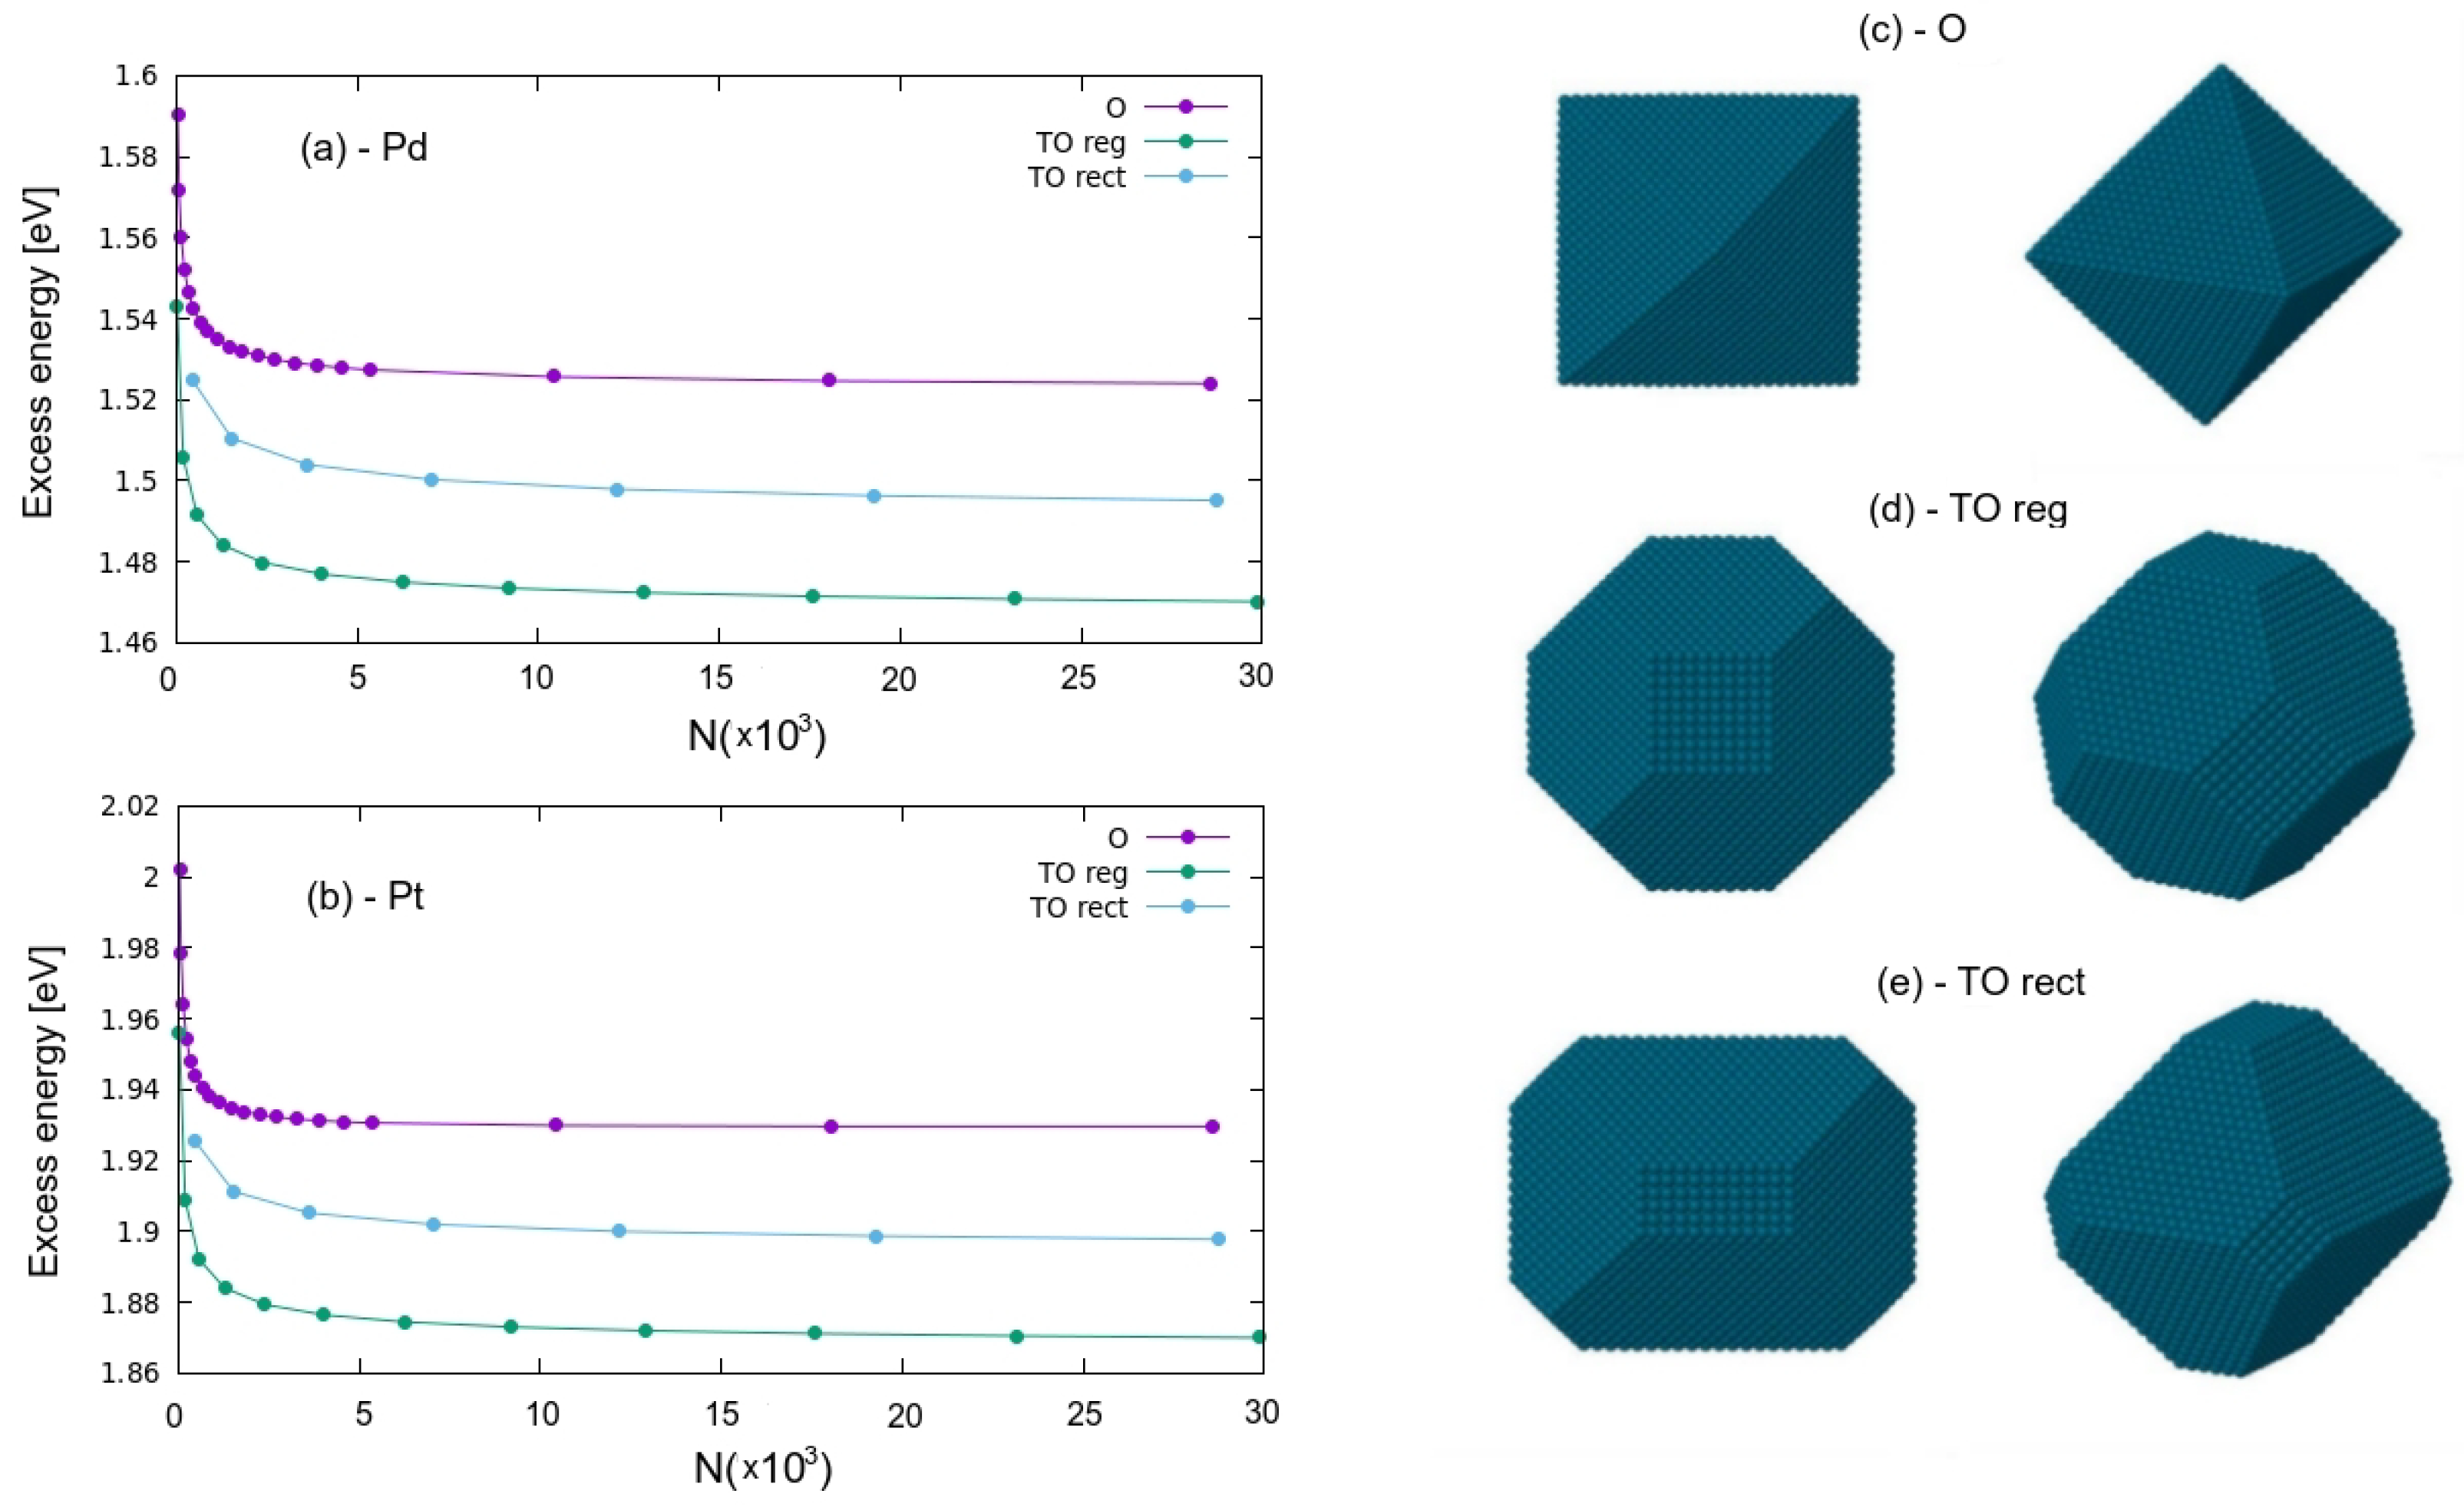
In summary, the results of the growth simulations are in good agreement with our experimental observations, for what concerns different aspects such as the growth within the octahedral motif, the formation of sharper tips in Pt-rich samples and the possible growth of elongated shapes with rectangular base. These aspects also indicate that kinetic trapping effects are likely to be important. In order to discuss this point, we calculate the excess energy of octahedral and truncated octahedral Pt and Pd nanocrystals (see Figure 7). For a nanoparticle with N atoms, is defined as [37]
where is the binding energy of the nanoparticle (which is negative), while is the cohesive energy per atom in the bulk solid (defined as positive). The results reported in Figure 7 correspond to nanoparticles of diameters between 3.5 and 9.5 nm.
From the results in Figure 7 it turns out that the lowest-energy structures are the truncated octahedra with square base. Specifically, for Pd nanocrystals the optimal truncation is that corresponding to the regular truncated octahedron, in which all (111) facets are regular hexagons. This structure is obtained from a complete octahedron with edge of atoms by eliminating atomic planes at each vertex, with [38]
In Pt nanocrystals, the optimal truncation is less deep—by one atomic layer. For both metals, increases if the base of the octahedron is made rectangular. Complete octahedra are quite high in energy. These results clearly confirm that the nanocrystal shapes obtained in the growth experiments and simulation originate to a great extent from kinetic effects.
The growth mechanism of the octahedral tips is the same discussed in the simulations of Ref. [39]. In the gas-phase growth, atoms randomly land on the growing nanocrystals from all directions. The formation of regular shapes with flat facets indicate that these atoms are mobile on the nanocrystal surface. In particular, atoms can very quickly diffuse on the large (111) facets and easily cross the borders between (111) facets, and from (111) to (100) facets. On the contrary, the reverse border crossing from (100) to (111) facets is much more difficult, because adsorption energy is much higher on (100) facets. This leads to an accumulation of atoms on (100) facets where the octahedral tips grow. This kinetic effect is stronger in Pt than in Pd due to the larger difference in adsorption energies of the former, which induces a very high energy barrier for the (100)→(111) border crossing. In addition, the excess energy calculations indicate that also at equilibrium Pd nanocrystals would present slightly deeper truncations.
3. Optical Simulations of (Ptpd)@Pd Nanocrystals
It has been established that the plasmon resonance of Pd and Pt nanoparticles resides in the ultraviolet range of the optical spectrum, which can be red shifted by increasing the particle size [40]. An optical activity in the UV part of the optical spectrum is interesting, for example, in photocatalysis, in which platinum has a prominent role. The truncated octahedral shape will also delicately affect the optical (plasmonic) response of the PtPd core Pd shell particles [41]. Below we present the results of classical simulations of the absorption spectre. In fact, the sizes of our nanocrystals are sufficiently large to exclude strong quantum mechanical effects on the plasmonic behavior.
In Figure 8a, the optical absorption spectra in the PtPd core and in the Pd shell are shown independently for the investigated sizes. It is clear that most of the optical absorption occurs in the range of 200–350 nm. Lower wavelengths than 200 nm were not considered as they are not interesting for practical applications due to constraints on the optical setup in case of far ultraviolet light. From the simulations, it appears that most of the optical absorption occurs at the Pd shell, with an order of magnitude difference with respect to the core. Furthermore, the shell shields optical absorption in the core, as can be seen from the 3 nm core particles in which the thick shell results in much less optical absorption in the core as compared with particles with thin shells.
4. Materials and Methods
4.1. Experimental Methods
PtPd nanoparticles were synthesized by inert gas aggregation-sputtering deposition (Nanogen-Trio source, Mantis Deposition Ltd, UK). This technique is based on the condensation of an atomic vapor produced by DC simultaneous magnetron-sputtering of targets.
The Nanogen-Trio source [43,44] employed three separate circular 1 targets mounted on the same linear translator within one region of inert gas aggregation, called aggregation zone. The sputtering current applied to the different targets can be adjusted separately, thereby providing control over the mole fraction of metals incorporated into the nanoparticles. Here, the sputtering currents applied to the targets were adjusted to create either a Pd-rich atomic vapor (PdPt) or a Pt-rich one (PtPd). The powers applied to the targets were obtained by applying a power of P = 8 W and P = 24 W for the Pd-rich distribution, and P = 23 W and P = 8 W for the Pt-rich one.
The composition of the atomic vapor was estimated by dividing the power applied to the target by the cohesion energy of the specific element (E = 3.89 eV/atom and E = 5.84 eV/atom). The composition of individual nanoparticles was also assessed by performing quantitative analysis of the EDX maps.
The length of the aggregation zone (AZ) can be mechanically varied in the range 35–125 mm by linear translation of the magnetron gun and multitarget holder.
The deposition chamber had a backing pressure of P ∼ mbar, which increased to ∼ mbar in standard operating conditions. This value can be further increased to ∼ mbar by flowing a controlled amount of Ar in the deposition chamber. This does not significantly affect the absolute value of the pressure measured inside the AZ. Specifically, this value fluctuated between 2.0 × 10 and 2.2 × 10 mbar during the experiments.
The difference of pressure caused nanoparticle extraction and acceleration from the aggregation zone to the deposition chamber, where they soft landed onto substrates held at ground potential.
To unravel the features of the PtPd distribution, the nanoparticles were deposited directly on amorphous carbon coated TEM grids to yield random arrays of binary nanoparticles. The deposition time was varied so to have very low density of particles in the samples used for characterising the structure of the nanoparticles. In these samples, the depositions lasted 180 s to avoid coalescence phenomena due to overlapping of the nanoparticles on the grid. The interparticle distances were at least 10 times their diameter. Larger densities of nanoparticles were deposited onto the samples that were used for evaluating the composition of the PtPd distribution. In this case, the depositions lasted at least 5 min.
The average composition, size and morphology of the nanoparticles were examined using aberration-corrected scanning transmission electron microscopy (C-corrected-STEM), JEOL JEM-ARM 200F. Scanning transmission electron microscopy combined with X-ray energy-dispersive spectroscopy (STEM–EDX) was also used to study elemental mapping for the respective elements.
4.2. Model and Simulation Methods
PtPd nanoparticles were modelled by means of an atomistic force field derived within the second-moment approximation to the tight-binding model [45,46]. Form and parameters of the force field can be found in Refs. [8,47]. This model has been favorably tested against ab initio results [48] and growth experiments [8,9].
Nanoparticle growth was simulated by MD simulations. In these simulations, atoms were deposited one by one on a preformed seed (a truncated octahedron of 586 atoms) from random directions. In the MD simulations, the equations of motion were solved by the velocity Verlet algorithm with a time step of 5 fs. Temperature was kept constant by an Andersen thermostat, whose collision frequency was chosen to ensure good thermalization with a negligible perturbation of the dynamics [39].
4.3. Optical Simulation Methods
The finite difference time domain (FDTD) simulations were conducted using commercial software (Lumerical Solutions Inc., Vancouver, BC, Canada) and provided the optical absorption in the metal nanoparticles. FDTD simulations solved the Maxwell equations time resolved in three dimension, in which a light pulse was directed through the simulation region, which was illuminated by a total-field scattered-field (TFSF) source. The refractive indices used in the simulations for the PtPd core were taken from the literature for Pt and Pd in a 50/50 alloy and for the Pd shell from Palik [49]. The simulations used a 900 × 900 × 900 nm simulation box, with Perfectly Matched Layer (PML) boundaries of 12 layers. The mesh box size on and around the particle varied between 0.07 × 0.07 × 0.07 nm and 0.3 × 0.3 × 0.3 nm depending on the particle size. A convergence test on the smallest particle confirmed the accuracy of the chosen mesh size. The measured diameter of the particle and the core were taken as the maximal span of the simulated particle base plane.
5. Conclusions
In this paper, we studied the growth of PtPd nanoalloys. Both Pt-rich and Pd-rich compositions were considered, leading to the formation of (PtPd)@Pt and (PtPd)@Pd chemical orderings, respectively. The grown samples presented a bimodal distribution, with two nanoparticle populations corresponding to small clusters (below 2 nm diameter) and larger nanoparticles with diameters of several nanometers. By varying the growth conditions, it was observed that the small-size population tended to disappear when the experimental parameters were adjusted to produce a slower growth process. Slower growth also increased the average diameter of the nanoparticles in the large-size population. These results demonstrated that the size distribution of PtPd nanoparticles grown in the gas phase can be controlled to a good extent.
The analysis of the nanoparticles of the larger population showed that the growth of PtPd nanoalloys takes place within the octahedral motif, which corresponds to fcc crystalline structures, namely, nanocrystals. These octahedra always present some degree of vertex truncation, which is different depending on the composition. In fact, while quite sharp vertices were observed in Pt-rich nanocrystals, the shapes of Pd-rich nanocrystals were more rounded, corresponding to deeper truncations. These findings were rationalized with the aid of molecular dynamics simulations of the growth. In these simulations, either Pt or Pd atoms were deposited on a preformed mixed seed. The simulations produced sharper octahedral shapes in Pt deposition than in Pd deposition, which is in good agreement with the experimental results. In fact, the Pd-rich nanocrystals presented more rounded shapes, with larger (100) facets than in the Pt-rich nanocrystals. The calculation of the excess energies of Pt and Pd nanocrystals showed that octahedra with sharp tips are out-of-equilibrium structures in both cases, and that the optimal truncation would be only slightly deeper for Pd nanocrystals. Therefore, the formation of sharper tips in Pt-rich growth was mainly attributed the stronger kinetic trapping effects in these nanocrystals, due to the slower atom diffusion between different facets on Pt-rich surfaces than on Pd-rich ones.
Finally, the optical absorption spectra were calculated for (PtPd)@Pd truncated octahedral nanocrystals of sizes in the range of experimental ones. The calculations showed that optical absorption is mainly in the range of 200–350 nm, and that the Pd shell is much more effective in absorbing radiation than the PtPd core.
Author Contributions
All experiments were conducted by C.M. Growth simulations were carried out by D.N. Excess energy calculations were carried out by C.R. and R.F. Plasmonic simulations were performed by S.A. and M.D.V. All authors contributed to writing the manuscript. All authors have read and agreed to the published version of the manuscript.
Funding
Research and APC were funded by the Italian MIUR under the project PRIN 2017 UTFROM, and by the Okinawa Institute of Science and Technology Graduate University.
Institutional Review Board Statement
Not applicable.
Informed Consent Statement
Not applicable.
Data Availability Statement
The data presented in this study are available on request from the corresponding authors.
Acknowledgments
We thank OIST Imaging Section for provide access to JEOL JEM-ARM200F and for their support. The authors acknowledge networking support from the International Research Network Nanoalloys of CNRS. D.N., C.R. and R.F. acknowledge support from the project “Dipartimento di Eccellenza” of the Physics Department of the University of Genoa.
Conflicts of Interest
The authors declare no conflict of interest.
References
- Ferrando, R.; Jellinek, J.; Johnston, R.L. Nanoalloys: From Theory to Applications of Alloy Clusters and Nanoparticles. Chem. Rev. 2008, 108, 845–910. [Google Scholar] [CrossRef] [PubMed]
- Ghosh Chaudhuri, R.; Paria, S. Core/Shell Nanoparticles: Classes, Properties, Synthesis Mechanisms, Characterization, and Applications. Chem. Rev. 2012, 112, 2373–2433. [Google Scholar] [CrossRef] [PubMed]
- Calvo, F. (Ed.) Nanoalloys from Fundamentals to Emergent Applications; Elsevier: Amsterdam, The Netherlands, 2013. [Google Scholar]
- Ferrando, R. Structure and Properties of Nanoalloys; Frontiers of Nanoscience; Elsevier: Amsterdam, The Netherlands, 2016; Volume 10. [Google Scholar]
- Gilroy, K.D.; Ruditskiy, A.; Peng, H.C.; Qin, D.; Xia, Y. Bimetallic Nanocrystals: Syntheses, Properties, and Applications. Chem. Rev. 2016, 116, 10414–10472. [Google Scholar] [CrossRef] [PubMed]
- McNamara, K.; Tofail, S.A.M. Nanoparticles in biomedical applications. Adv. Phys. X 2017, 2, 54–88. [Google Scholar] [CrossRef]
- Huttel, Y.; Martinez, L.; Mayoral, A.; Fernández, I. Gas-phase synthesis of nanoparticles: Present status and perspectives. MRS Commun. 2018, 8, 947–954. [Google Scholar] [CrossRef]
- Nelli, D.; Krishnadas, A.; Ferrando, R.; Minnai, C. One-Step Growth of Core–Shell (PtPd)@Pt and (PtPd)@Pd Nanoparticles in the Gas Phase. J. Phys. Chem. C 2020, 124, 14338–14349. [Google Scholar] [CrossRef]
- Nelli, D.; Cerbelaud, M.; Ferrando, R.; Minnai, C. Tuning the coalescence degree in the growth of Pt–Pd nanoalloys. Nanoscale Adv. 2021, 3, 836–846. [Google Scholar] [CrossRef]
- Zhao, J.; Baibuz, E.; Vernieres, J.; Grammatikopoulos, P.; Jansson, V.; Nagel, M.; Steinhauer, S.; Sowwan, M.; Kuronen, A.; Nordlund, K.; et al. Formation Mechanism of Fe Nanocubes by Magnetron Sputtering Inert Gas Condensation. ACS Nano 2016, 10, 4684–4694. [Google Scholar] [CrossRef]
- Vernieres, J.; Steinhauer, S.; Zhao, J.; Grammatikopoulos, P.; Ferrando, R.; Nordlund, K.; Djurabekova, F.; Sowwan, M. Site-Specific Wetting of Iron Nanocubes by Gold Atoms in Gas-Phase Synthesis. Adv. Sci. 2019, 6, 1900447. [Google Scholar] [CrossRef] [Green Version]
- Wells, D.M.; Rossi, G.; Ferrando, R.; Palmer, R.E. Metastability of the atomic structures of size-selected gold nanoparticles. Nanoscale 2015, 7, 6498–6504. [Google Scholar] [CrossRef]
- Grammatikopoulos, P.; Kioseoglou, J.; Galea, A.; Vernieres, J.; Benelmekki, M.; Diaz, R.E.; Sowwan, M. Kinetic trapping through coalescence and the formation of patterned Ag-Cu nanoparticles. Nanoscale 2016, 8, 9780–9790. [Google Scholar] [CrossRef] [PubMed]
- Liao, T.W.; Yadav, A.; Hu, K.J.; van der Tol, J.; Cosentino, S.; D’Acapito, F.; Palmer, R.E.; Lenardi, C.; Ferrando, R.; Grandjean, D.; et al. Unravelling the nucleation mechanism of bimetallic nanoparticles with composition-tunable core-shell arrangement. Nanoscale 2018, 10, 6684–6694. [Google Scholar] [CrossRef] [PubMed] [Green Version]
- Pirart, J.; Front, A.; Rapetti, D.; Andreazza-Vignolle, C.; Andreazza, P.; Mottet, C.; Ferrando, R. Reversed size-dependent stabilization of ordered nanophases. Nat. Commun. 2019, 10, 1982. [Google Scholar] [CrossRef] [PubMed] [Green Version]
- Ahmad, N.; Bon, M.; Passerone, D.; Erni, R. Template-Assisted in Situ Synthesis of Ag@Au Bimetallic Nanostructures Employing Liquid-Phase Transmission Electron Microscopy. ACS Nano 2019, 13, 13333–13342. [Google Scholar] [CrossRef] [PubMed]
- Nelli, D.; Rossi, G.; Wang, Z.; Palmer, R.E.; Ferrando, R. Structure and orientation effects in the coalescence of Au clusters. Nanoscale 2020, 12, 7688–7699. [Google Scholar] [CrossRef] [PubMed]
- Nelli, D.; Ferrando, R. Core-shell vs. multi-shell formation in nanoalloy evolution from disordered configurations. Nanoscale 2019, 11, 13040–13050. [Google Scholar] [CrossRef]
- Foster, D.M.; Ferrando, R.; Palmer, R.E. Experimental determination of the energy difference between competing isomers of deposited, size-selected gold nanoclusters. Nat. Commun. 2018, 9, 1323. [Google Scholar] [CrossRef]
- Andreazza, P.; Lemoine, A.; Coati, A.; Nelli, D.; Ferrando, R.; Garreau, Y.; Creuze, J.; Andreazza-Vignolle, C. From metastability to equilibrium during the sequential growth of Co–Ag supported clusters: A real-time investigation. Nanoscale 2021, 13, 6096–6104. [Google Scholar] [CrossRef]
- Llamosa, D.; Ruano, M.; Martinez, L.; Mayoral, A.; Roman, E.; Garcia-Hernández, M.; Huttel, Y. The ultimate step towards a tailored engineering of core@ shell and core@ shell@ shell nanoparticles. Nanoscale 2014, 6, 13483–13486. [Google Scholar] [CrossRef]
- Minnai, C.; Cremonesi, L.; Milani, P.; Potenza, M.A. A very simple scheme for spectrally resolved imaging by means of curved polymeric gratings. Mater. Res. Express 2019, 6, 065044. [Google Scholar] [CrossRef]
- Minnai, C.; Di Vece, M.; Milani, P. Mechanical-optical-electro modulation by stretching a polymer-metal nanocomposite. Nanotechnology 2017, 28, 355702. [Google Scholar] [CrossRef] [PubMed]
- Huang, X.; Li, Y.; Li, Y.; Zhou, H.; Duan, X.; Huang, Y. Synthesis of PtPd bimetal nanocrystals with controllable shape, composition, and their tunable catalytic properties. Nano Lett. 2012, 12, 4265–4270. [Google Scholar] [CrossRef] [PubMed]
- Zhang, H.; Jin, M.; Xia, Y. Enhancing the catalytic and electrocatalytic properties of Pt-based catalysts by forming bimetallic nanocrystals with Pd. Chem. Soc. Rev. 2012, 41, 8035–8049. [Google Scholar] [CrossRef] [PubMed]
- Lim, B.; Jiang, M.; Camargo, P.H.C.; Cho, E.C.; Tao, J.; Lu, X.; Zhu, Y.; Xia, Y. Pd-Pt Bimetallic Nanodendrites with High Activity for Oxygen Reduction. Science 2009, 324, 1302–1305. [Google Scholar] [CrossRef] [PubMed] [Green Version]
- Peng, Z.; Yang, H. Synthesis and Oxygen Reduction Electrocatalytic Property of Pt-on-Pd Bimetallic Heteronanostructures. J. Am. Chem. Soc. 2009, 131, 7542–7543. [Google Scholar] [CrossRef] [PubMed]
- Wang, L.; Nemoto, Y.; Yamauchi, Y. Direct Synthesis of Spatially-Controlled Pt-on-Pd Bimetallic Nanodendrites with Superior Electrocatalytic Activity. J. Am. Chem. Soc. 2011, 133, 9674–9677. [Google Scholar] [CrossRef] [PubMed]
- Yin, A.X.; Min, X.Q.; Zhang, Y.W.; Yan, C.H. Shape-Selective Synthesis and Facet-Dependent Enhanced Electrocatalytic Activity and Durability of Monodisperse Sub-10 nm Pt−Pd Tetrahedrons and Cubes. J. Am. Chem. Soc. 2011, 133, 3816–3819. [Google Scholar] [CrossRef]
- Khanal, S.; Casillas, G.; Velazquez-Salazar, J.J.; Ponce, A.; Jose-Yacaman, M. Atomic resolution imaging of polyhedral PtPd core–shell nanoparticles by Cs-corrected STEM. J. Phys. Chem. C 2012, 116, 23596–23602. [Google Scholar] [CrossRef] [PubMed] [Green Version]
- Yang, C.; Zhang, D.; Zhao, W.; Cui, M.; Liang, R.; Ou, Q.; Zhang, S. Plasma-synthesized octahedral PtPd alloy/reduced graphene oxide nanocomposites with boosted electrocatalytic activity for methanol oxidation. J. Alloy. Compd. 2020, 835, 155334. [Google Scholar] [CrossRef]
- Faraone, G.; Modi, R.; Marom, S.; Podestà, A.; Di Vece, M. Increasing the optical absorption in a-Si thin films by embedding gold nanoparticles. Opt. Mater. 2018, 75, 204–210. [Google Scholar] [CrossRef]
- Popok, V.N.; Gurevich, L. Charge states of size-selected silver nanoparticles produced by magnetron sputtering. J. Nanoparticle Res. 2019, 21, 171. [Google Scholar] [CrossRef]
- Huang, D.B.; Yuan, Q.; Wang, H.H.; Zhou, Z.Y. Facile synthesis of PdPt nanoalloys with sub-2.0 nm islands as robust electrocatalysts for methanol oxidation. Chem. Commun. 2014, 50, 13551–13554. [Google Scholar] [CrossRef] [PubMed]
- Huttel, Y. Gas-Phase Synthesis of Nanoparticles; John Wiley & Sons: Hoboken, NJ, USA, 2017. [Google Scholar]
- Pratontep, S.; Carroll, S.J.; Xirouchaki, C.; Streun, M.; Palmer, R.E. Size-selected cluster beam source based on radio frequency magnetron plasma sputtering and gas condensation. Rev. Sci. Instrum. 2005, 76, 045103. [Google Scholar] [CrossRef]
- Baletto, F.; Ferrando, R. Structural properties of nanoclusters: Energetic, thermodynamic, and kinetic effects. Rev. Mod. Phys. 2005, 77, 371–423. [Google Scholar] [CrossRef] [Green Version]
- Baletto, F.; Ferrando, R.; Fortunelli, A.; Montalenti, F.; Mottet, C. Crossover among structural motifs in transition and noble-metal clusters. J. Chem. Phys. 2002, 116, 3856. [Google Scholar] [CrossRef]
- Baletto, F.; Mottet, C.; Ferrando, R. Molecular dynamics simulations of surface diffusion and growth on silver and gold clusters. Surf. Sci. 2000, 446, 31–45. [Google Scholar] [CrossRef]
- Bigall, N.C.; Hartling, T.; Klose, M.; Simon, P.; Eng, L.M.; Eychmuller, A. Monodisperse platinum nanospheres with adjustable diameters from 10 to 100 nm: Synthesis and distinct optical properties. Nano Lett. 2008, 8, 4588–4592. [Google Scholar] [CrossRef]
- Tao, A.R.; Habas, S.; Yang, P. Shape control of colloidal metal nanocrystals. Small 2008, 4, 310–325. [Google Scholar] [CrossRef]
- Ozbay, E. Plasmonics: Merging photonics and electronics at nanoscale dimensions. science 2006, 311, 189–193. [Google Scholar] [CrossRef]
- Johnson, G.E.; Colby, R.; Laskin, J. Soft landing of bare nanoparticles with controlled size, composition, and morphology. Nanoscale 2015, 7, 3491–3503. [Google Scholar] [CrossRef]
- Mayoral, A.; Mejia-Rosales, S.; Mariscal, M.M.; Perez-Tijerina, E.; Jose-Yacaman, M. The Co-Au interface in bimetallic nanoparticles: A high resolution STEM study. Nanoscale 2010, 2, 2647–2651. [Google Scholar] [CrossRef] [PubMed]
- Cyrot-Lackmann, F.; Ducastelle, F. Binding Energies of Transition-Metal Atoms Adsorbed on a Transition Metal. Phys. Rev. B 1971, 4, 2406–2412. [Google Scholar] [CrossRef]
- Rosato, V.; Guillopé, M.; Legrand, B. Thermodynamical and structural properties of f.c.c. transition metals using a simple tight-binding model. Phil. Mag. A 1989, 59, 321. [Google Scholar] [CrossRef]
- Rossi, G.; Ferrando, R.; Rapallo, A.; Fortunelli, A.; Curley, B.C.; Lloyd, L.D.; Johnston, R.L. Global optimization of bimetallic cluster structures. I. Size-matched Ag-Pd, Ag-Au, and Pd-Pt systems. J. Chem. Phys. 2005, 122, 194309. [Google Scholar] [CrossRef] [PubMed]
- Paz-Borbón, L.O.; Johnston, R.L.; Barcaro, G.; Fortunelli, A. A Mixed Structural Motif in 34-Atom Pd-Pt Clusters. Phys. Chem. Chem. Phys. 2007, 111, 2936–2941. [Google Scholar] [CrossRef]
- Palik, E.D. Handbook of Optical Constants of Solids; Academic Press: Cambridge, MA, USA, 1998; Volume 3. [Google Scholar]
Figure 1.
Bimodal distribution of PtPd NPs. (a) Low-magnification C-corrected STEM-HAADF image showing several NPs. (b) Histogram showing the size distribution of the NPs. (c,d) Specimens representing the two populations.
Figure 1.
Bimodal distribution of PtPd NPs. (a) Low-magnification C-corrected STEM-HAADF image showing several NPs. (b) Histogram showing the size distribution of the NPs. (c,d) Specimens representing the two populations.

Figure 2.
Evolution of the NPs size in function of the P at two different L.

Figure 3.
C-corrected STEM-HAADF images of PtPd NPs grown in a Pd-rich atmosphere (PdPt) (top row) and in a Pd-rich one (PtPd) (bottom row). (a,b) low magnification images (c–f) high magnification images with scale bar—5 nm.
Figure 3.
C-corrected STEM-HAADF images of PtPd NPs grown in a Pd-rich atmosphere (PdPt) (top row) and in a Pd-rich one (PtPd) (bottom row). (a,b) low magnification images (c–f) high magnification images with scale bar—5 nm.

Figure 4.
Representative growth structures of size 1500. (a,b) Structures obtained in growth simulations at 800 K for Pt and Pd deposition, respectively. (c,d) Elongated structures obtained in growth simulations at 900 K for Pt and Pd deposition, respectively. Each structure is shown from two perspectives. Here and in the following, Pt and Pd atoms are represented in gray and blue, respectively.

Figure 5.
Growth sequences for (a) Pt and (b) Pd deposition. The simulations are run at 700 and 800 K, respectively.
Figure 5.
Growth sequences for (a) Pt and (b) Pd deposition. The simulations are run at 700 and 800 K, respectively.

Figure 6.
Number of atoms on open facets in the growth simulations at different temperatures and sizes. Results were obtained by averaging over four independent simulations.
Figure 6.
Number of atoms on open facets in the growth simulations at different temperatures and sizes. Results were obtained by averaging over four independent simulations.

Figure 7.
Excess energies (see Equation (1)) of pure (a) Pd and (b) Pt nanocrystals of different shapes ((c)—regular octahedron, (d)—regular truncated octahedron and (e)—truncated octahedron with rectangular base), where is equal to 3.91127 eV for Pd and 5.82801 eV for Pt.
Figure 7.
Excess energies (see Equation (1)) of pure (a) Pd and (b) Pt nanocrystals of different shapes ((c)—regular octahedron, (d)—regular truncated octahedron and (e)—truncated octahedron with rectangular base), where is equal to 3.91127 eV for Pd and 5.82801 eV for Pt.

Figure 8.
(a) Optical absorption in PtPd core Pd shell truncated octahedron nanoparticles as obtained by FDTD simulations. (b) Cross sections at wavelength 238 nm in xy plane for the truncated octahedron with core 3 nm and outer shell 7 nm. (c) Cross sections at wavelength 238 nm in xz plane for the truncated octahedron with core 3 nm and outer shell 7 nm.

Publisher’s Note: MDPI stays neutral with regard to jurisdictional claims in published maps and institutional affiliations. |
© 2021 by the authors. Licensee MDPI, Basel, Switzerland. This article is an open access article distributed under the terms and conditions of the Creative Commons Attribution (CC BY) license (https://creativecommons.org/licenses/by/4.0/).
Share and Cite
MDPI and ACS Style
Nelli, D.; Roncaglia, C.; Ahearn, S.; Di Vece, M.; Ferrando, R.; Minnai, C. Octahedral Growth of PtPd Nanocrystals. Catalysts 2021, 11, 718. https://0-doi-org.brum.beds.ac.uk/10.3390/catal11060718
AMA Style
Nelli D, Roncaglia C, Ahearn S, Di Vece M, Ferrando R, Minnai C. Octahedral Growth of PtPd Nanocrystals. Catalysts. 2021; 11(6):718. https://0-doi-org.brum.beds.ac.uk/10.3390/catal11060718
Chicago/Turabian StyleNelli, Diana, Cesare Roncaglia, Samuel Ahearn, Marcel Di Vece, Riccardo Ferrando, and Chloé Minnai. 2021. "Octahedral Growth of PtPd Nanocrystals" Catalysts 11, no. 6: 718. https://0-doi-org.brum.beds.ac.uk/10.3390/catal11060718
Note that from the first issue of 2016, this journal uses article numbers instead of page numbers. See further details here.