
Plasma-Catalytic Process of Hydrogen Production from Mixture of Methanol and Water


1
Faculty of Chemistry, Warsaw University of Technology, Noakowskiego 3, 00-664 Warsaw, Poland
2
Faculty of Electrical Engineering, Warsaw University of Technology, Pl. Politechniki 1, 00-661 Warsaw, Poland
3
Faculty of Advanced Technologies and Chemistry, Military University of Technology, Gen. S. Kaliskiego 2, 00-908 Warsaw, Poland
*
Author to whom correspondence should be addressed.
Catalysts 2021, 11(7), 864; https://0-doi-org.brum.beds.ac.uk/10.3390/catal11070864
Submission received: 24 June 2021
/
Revised: 17 July 2021
/
Accepted: 18 July 2021
/
Published: 19 July 2021
(This article belongs to the Special Issue Towards Catalysts Prepared by Cold Plasma)
Abstract
:In the present work the process of hydrogen production was conducted in the plasma-catalytic reactor, the substrates were first treated with plasma and then introduced into the catalyst bed. Plasma was produced by a spark discharge. The discharge power ranged from 15 to 46 W. The catalyst was metallic nickel supported on Al2O3. The catalyst was active from a temperature of 400 °C. The substrate flow rate was 1 mol/h of water and 1 mol/h of methanol. The process generated H2, CO, CO2 and CH4. The gas which formed the greatest amount was H2. Its concentration in the gas was ~60%. The conversion of methanol and the production of hydrogen in the plasma-catalytic reactor were higher than in the plasma and catalytic reactors. The synergy effect of the interaction of two environments, i.e., plasma and the catalyst, was observed. The highest hydrogen production was 1.38 mol/h and the highest methanol conversion was 64%. The increased in the discharge power resulted in increasing methanol conversion and hydrogen production.
1. Introduction
Plasma-catalytic reactors are complex systems in which chemical reactions and the effect of plasma on a catalyst must be taken into account. Various plasma-catalytic systems are used. A catalyst may be located in a plasma zone [1,2,3,4,5,6,7], an electrode may be the catalyst [8,9], and often the catalyst is located outside the plasma zone [1,10,11,12,13,14,15,16,17,18]. This way of placing the catalyst prevents the destruction of the catalyst by plasma and the disturbance of the discharge. Especially catalysts in which the active phase is a metal capable of conducting an electric current on the surface and lead to a short circuit.
Plasma-catalytic reactors are used to improve the selectivity and efficiency of chemical processes. Such reactors combine the advantages of plasma and a catalyst. In plasma, in collisions with high-energy electrons very reactive radicals are formed, and the catalyst is subjected to selectively desired chemical reactions. As a result of introducing the catalyst into the plasma reactor, the conversion increases, which results in a reduction of the energy cost of the process. Processes such as gas purification [1,2,3], hydrogen production [5,7], Fischer–Tropsch synthesis [6] are carried out in plasma-catalytic reactors.
In this work, a plasma-catalytic reactor was used to generate hydrogen from a mixture of water and methanol place:
CH3OH + H2O⇆ CO2 + H2 (R1)
However, other methods of producing hydrogen from methanol are also investigated, e.g., plasma, catalytic, and electrochemical [19,20,21,22,23,24].
The H2 production using methanol/water mixture is endothermic. The reaction enthalpy for the reactants in the gas phase is 131.57 kJ/mol, and for the reactants in the liquid phase it is 49.51 kJ/mol. The difference in enthalpy is due to the energy consumption for the evaporation of methanol and water.
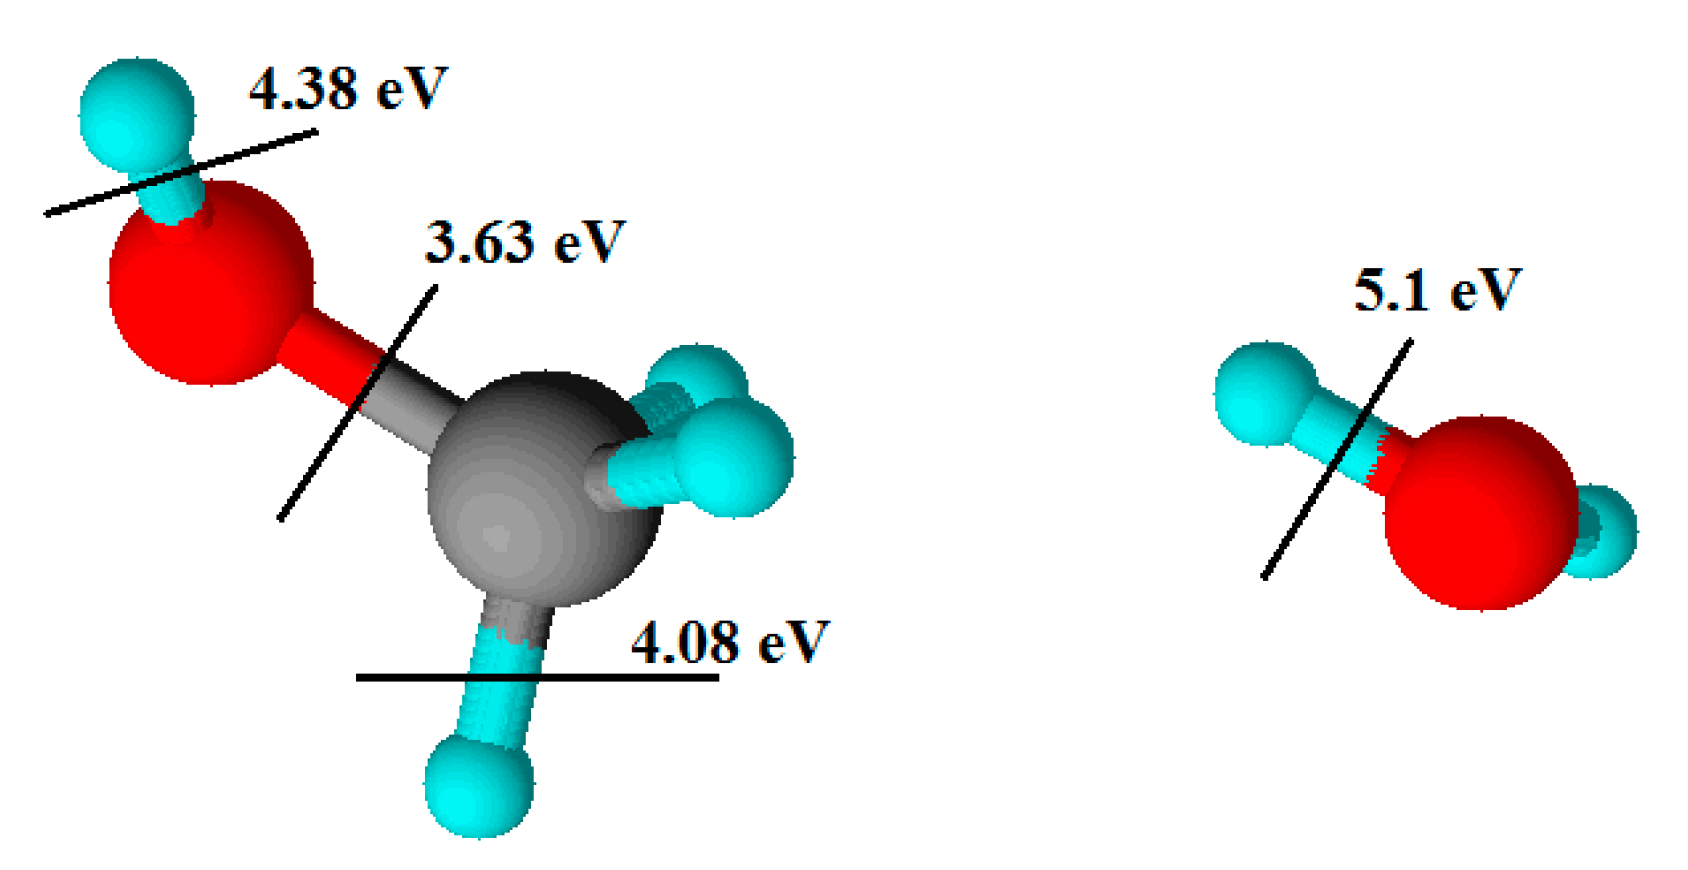
Methanol and water have several advantages as hydrogen sources. They are easy to transport as liquids. Water is a commonly available resource. Methanol can be obtained from biomass. The energy of the bonds in methanol is 3.63, 4.08, and 4.38 eV [25], and in water 5.10 eV [26] (Figure 1). Therefore, in collisions with high-energy electrons these molecules can dissociate, and radicals will be formed:
In this work, plasma was produced by a spark discharge. This discharge consists of many discharge channels in which the electron density reaches 1017 cm−1 [27]. Not all collisions lead to dissociation. Most of the collision raises the internal energy of water and methanol. There are many electrons, they are small and mobile, so molecules can collide with them many times and be excited to another energy state. After obtaining sufficiently high energy, they can dissociate, and methanol can also decompose:
CH3OH→CO + 2H2 (R6)
The return of the excited molecules to lower energy states is accompanied by the emission of photons, which allow photochemical reactions to take place on photocatalysts. Nickel deposited on carriers has photocatalytic properties [28,29,30]. Nickel catalysts also show catalytic activity in the process of steam reforming of methanol [31,32,33]. A catalyst with a metallic nickel content of 2.5% by weight was used in the tests.
2. Results and Discussion
2.1. Catalytic Reactor
The activity of the catalyst used in the conducted process was observed starting from the temperature of 400 °C. The products of the catalytic process included H2, CH4, CO, and CO2 (Table 1). In the studied temperature range (400–600 °C), the concentration of H2 in the cooled gases was high and ranged from 60.1 to 60.8%. The CO concentration ranged from 15.3 to 24.2%. The CO2 concentration ranged from 5.4 to 10.6%. The CH4 concentration ranged from 0.3 to 0.4%. In addition to the products, the cooled gas also contained water vapor (~2%) and methanol (~10%).
The high concentration of CO indicates that methanol decomposes on the nickel catalyst (R6). Then CO2 is formed in the water–gas shift reaction:
CO + H2O⇆ CO2 + H2 (R7)
CO can also be converted to methane:
CO + 3H2⇆ CH4 + H2O (R8)
The methanation (R8) is of minor importance as it requires four molecules, so it is more difficult to carry out than the water–gas shift reaction. Additionally, the amount of water vapor is greater than the amount of hydrogen. This composition of the reaction mixture favors the water–gas shift reaction (R7), which is the desired reaction because it is responsible for the increase in hydrogen production.
2.2. Plasma Reactor
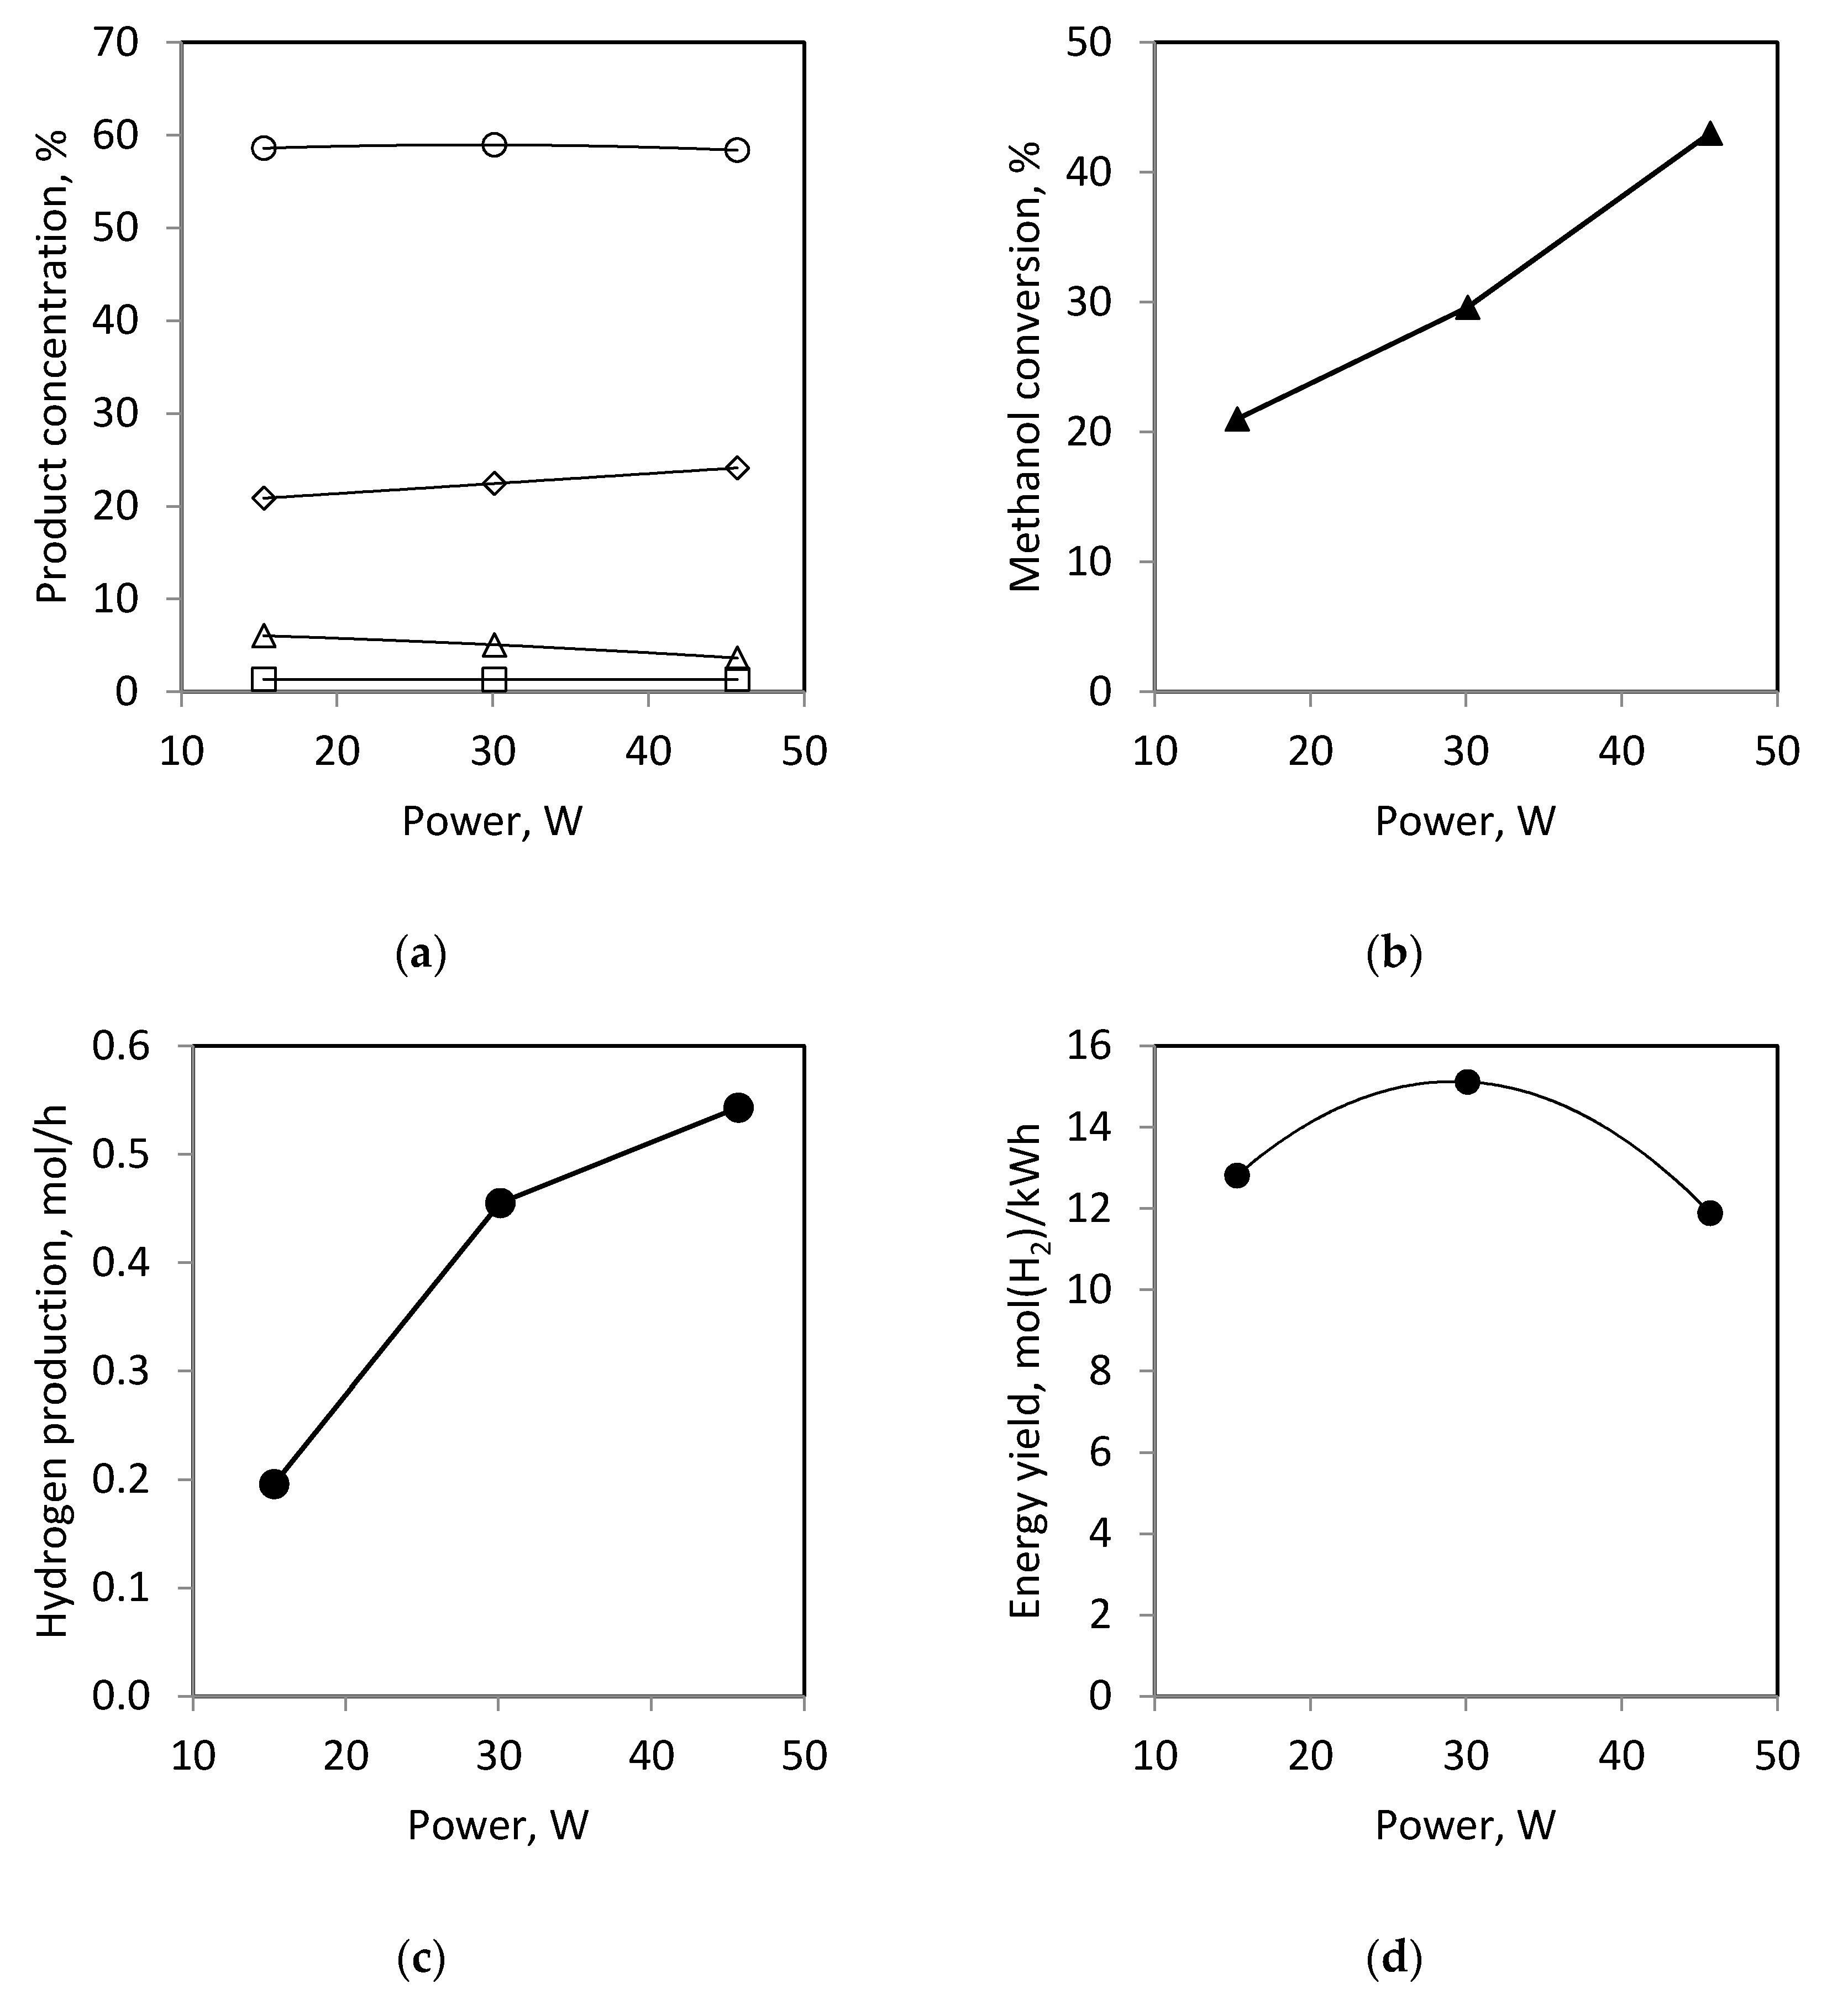
The gaseous products generated in the spark discharge from the methanol and water mixture were H2, CH4, CO, and CO2 (Figure 4a). The concentration of H2 in the cooled gases was high in all conditions and ranged from 58.0 to 58.9%. The second product in terms of concentration in the cooled gases was CO. Its concentration ranged from 15.3 to 24.2%. The concentration of CO was correlated with the concentration of CO2. When the CO concentration was the highest then the CO2 concentration had the lowest values, 3.5%. When the CO concentration was the lowest, then the CO2 concentration was the highest, 10.6%. The CH4 concentration ranged from 1.0 to 1.3%.
The high concentration of CO results from the mechanism of an initiation reaction in plasma, i.e., the collision of molecules with high-energy electrons. CH2OH and CH3O radicals are formed from methanol mostly because it has the highest number of bonds with hydrogen (one O-H and three C-H). These radicals are in mutual equilibrium [37]:
CH2OH·⇆ CH3O· (R9)
Formyl radical is unstable and decomposes within 1 ms [46]:
CHO·→CO + H· (R21)
CO2 can be produced by the reaction with water vapor (R7), atomic oxygen, hydroxyl radical, or hydrogen peroxide [47,48,49,50]:
Figure 4 shows the effect of the discharge power on the methanol conversion (Figure 4b) and hydrogen production (Figure 4c) in the plasma reactor. It shows that the methanol conversion and hydrogen production increased with increasing discharge power. The increase in the methanol conversion and hydrogen production with increasing discharge power is the expected effect. We observed a similar effect in our earlier work on ethanol steam reforming in the dielectric barrier discharge. It is worth noting that the higher the discharge power, the greater the hydrogen production (0.20 mol/h and 0.46 mol/h for 15 W and 30 W, respectively). That is a two-fold increase in power resulted in a more than two-fold increase in the hydrogen production. A further increase in the discharge power to 46 W, by ~50%, resulted in a much smaller increase in the hydrogen production, only to 0.54 mol/h, i.e., by ~20%. Therefore, at 30 W of the discharge power the energy yield reaches a maximum (Figure 4d).
2.3. Plasma-Catalytic Reactor
The gaseous products of the plasma-catalytic process included H2, CH4, CO, and CO2 (Table 1). In the studied temperature range (400–600 °C), the concentration of H2 in the cooled gases was high and ranged from 58.9 to 60.9%. The CO2 concentration ranged from 2.7 to 9.1%. The CH4 concentration ranged from 0.5 to 1.3%.
In the plasma-catalytic reactor, the substrates first pass through the plasma zone where radicals are formed. The average residence time of the reactants in the plasma zone is 7 ms. Then, after 40 ms, the reactants are contacted with the catalyst. In comparison to the catalytic process, the reaction of methanol decomposition in the plasma-catalytic reactor is slower. This is due to the fact that the concentration of methanol in the stream of reactants fed into the catalyst bed is lower in the plasma-catalytic reactor than in the catalytic reactor. On the other hand, the reactions involving CO and H2 will run faster because CO and H2 are already present in the gases introduced to the catalyst bed. The obtained CH4 concentration in the plasma-catalytic reactor was higher than in the catalytic converter. However, it is surprising that the concentration of CO2 in the plasma-catalytic reactor is similar or even lower than in the catalytic reactor. This indicates that the conditions in the catalyst bed are not favorable for the water–gas shift reaction (R7) but favor the methanation (R8) or the Sabatier reaction (R36):
CO2 + 4H2⇄CH4 + 2H2O (R36)
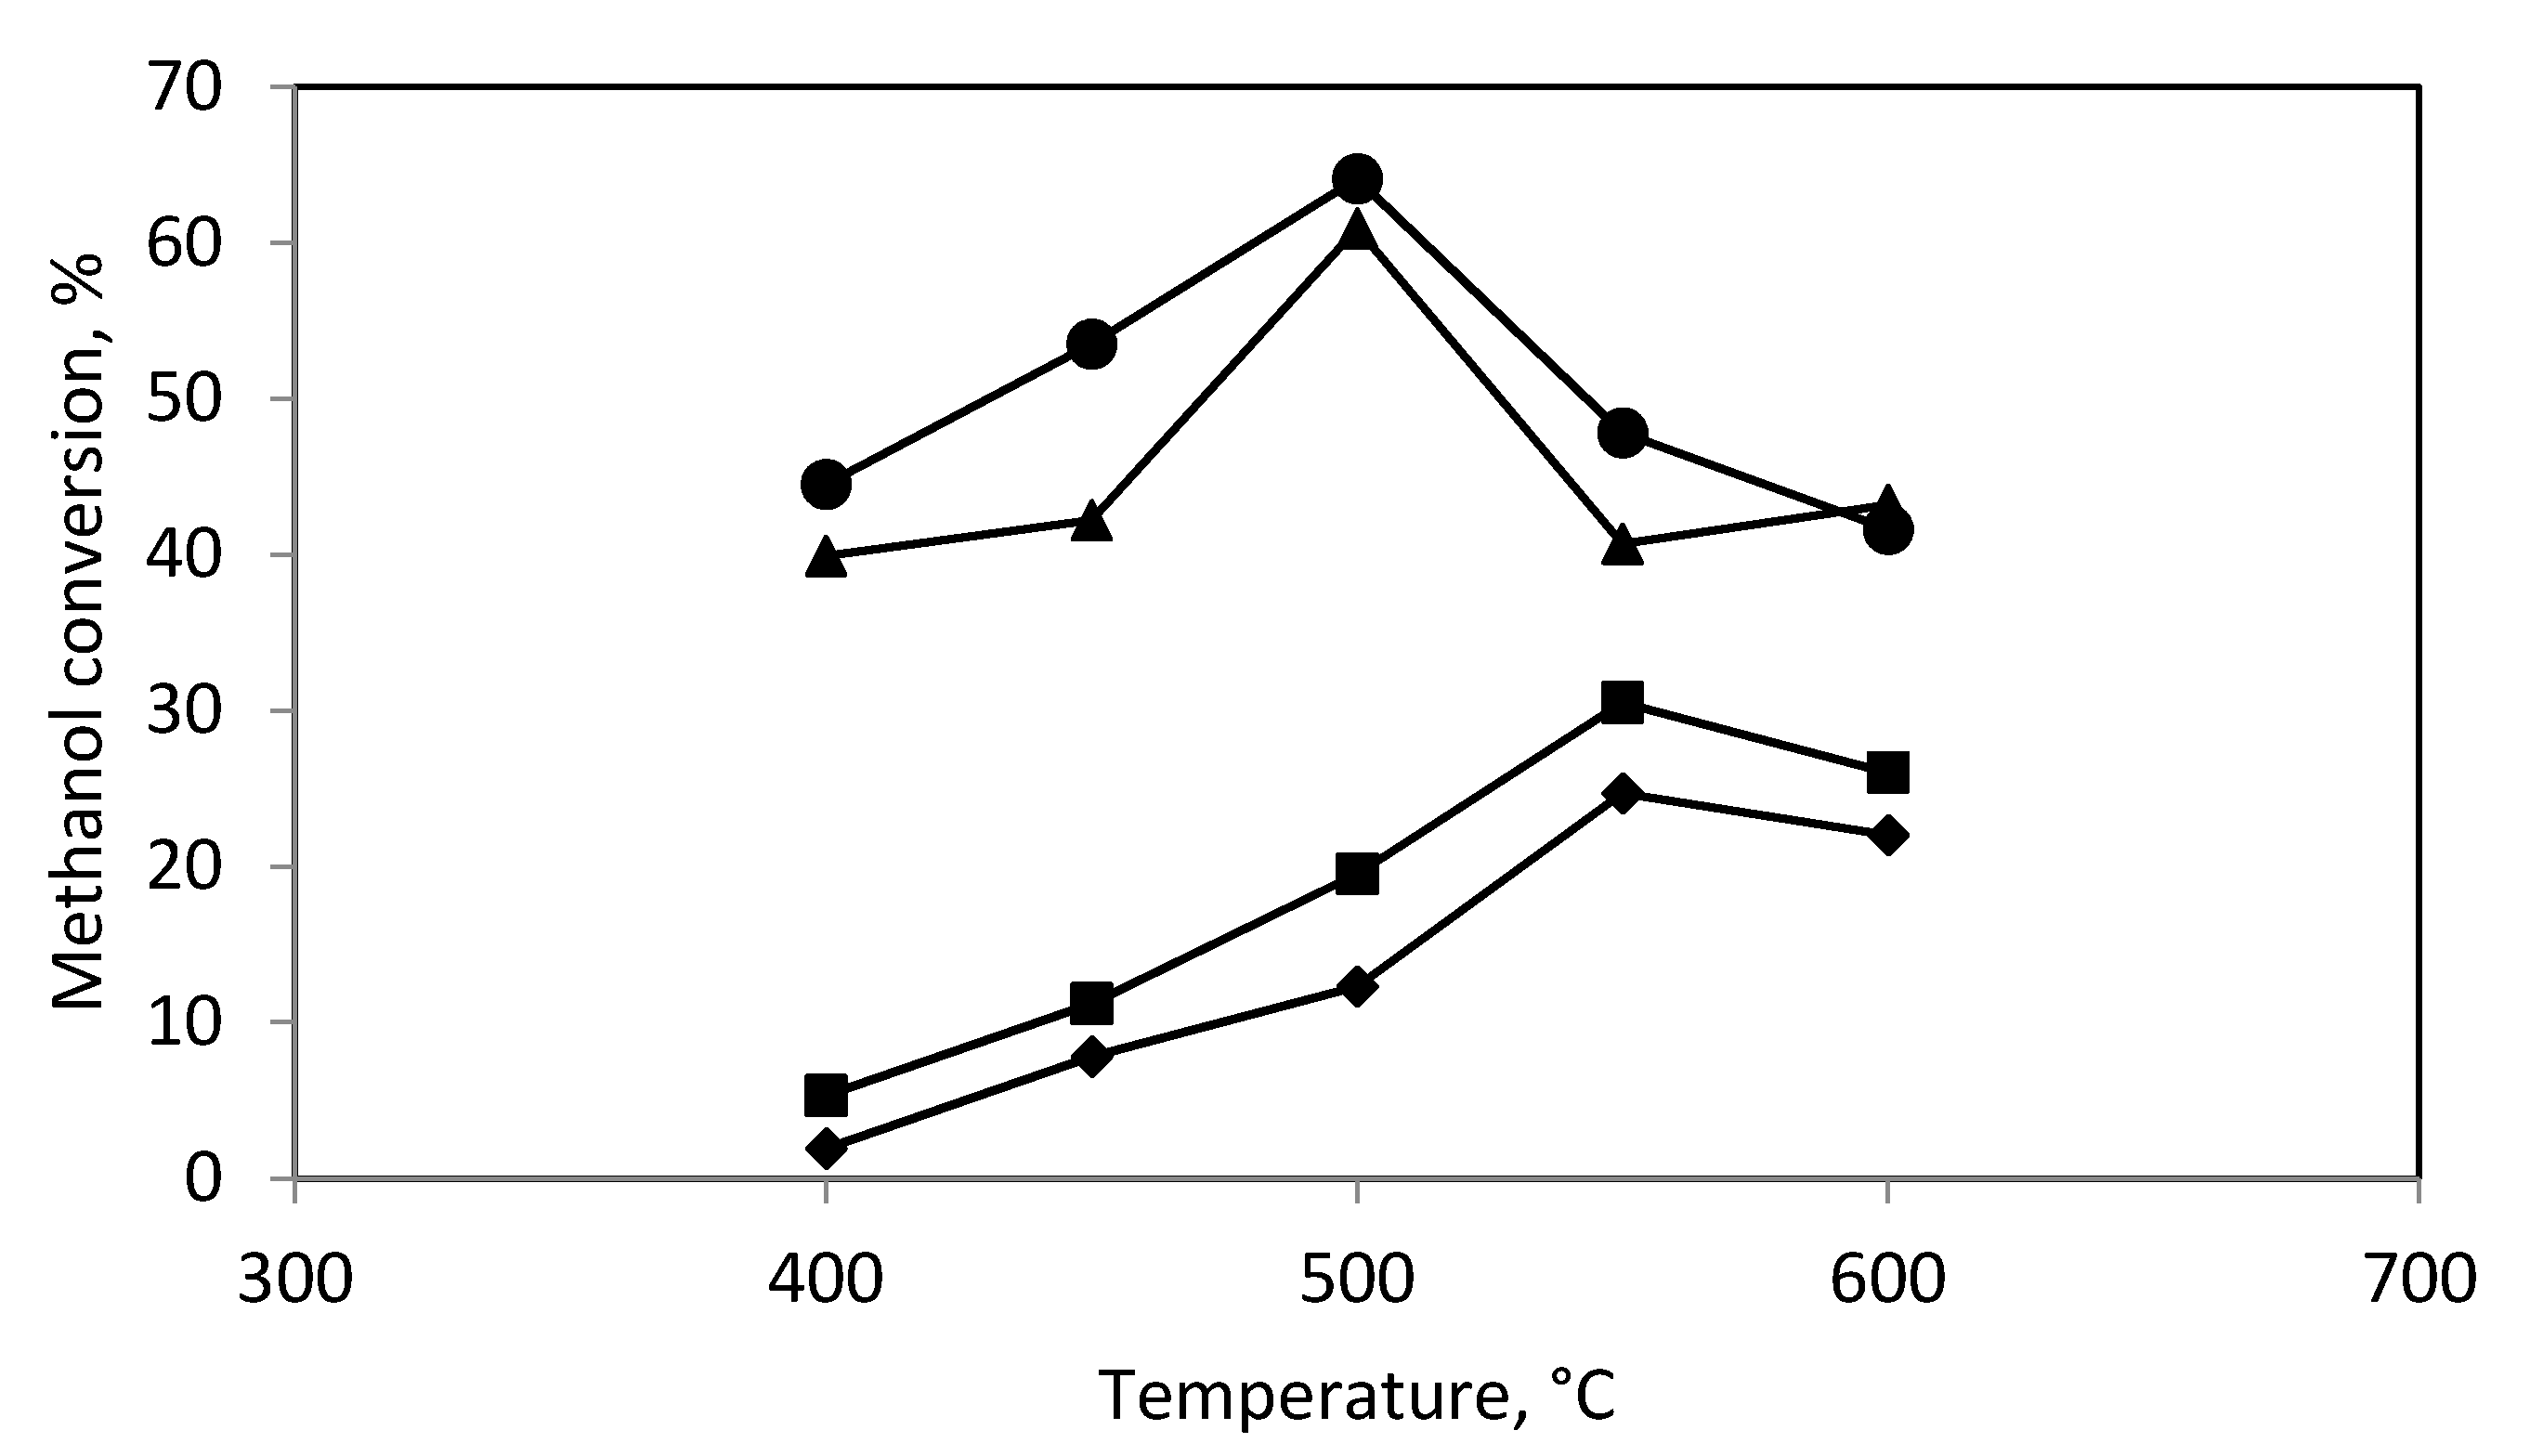
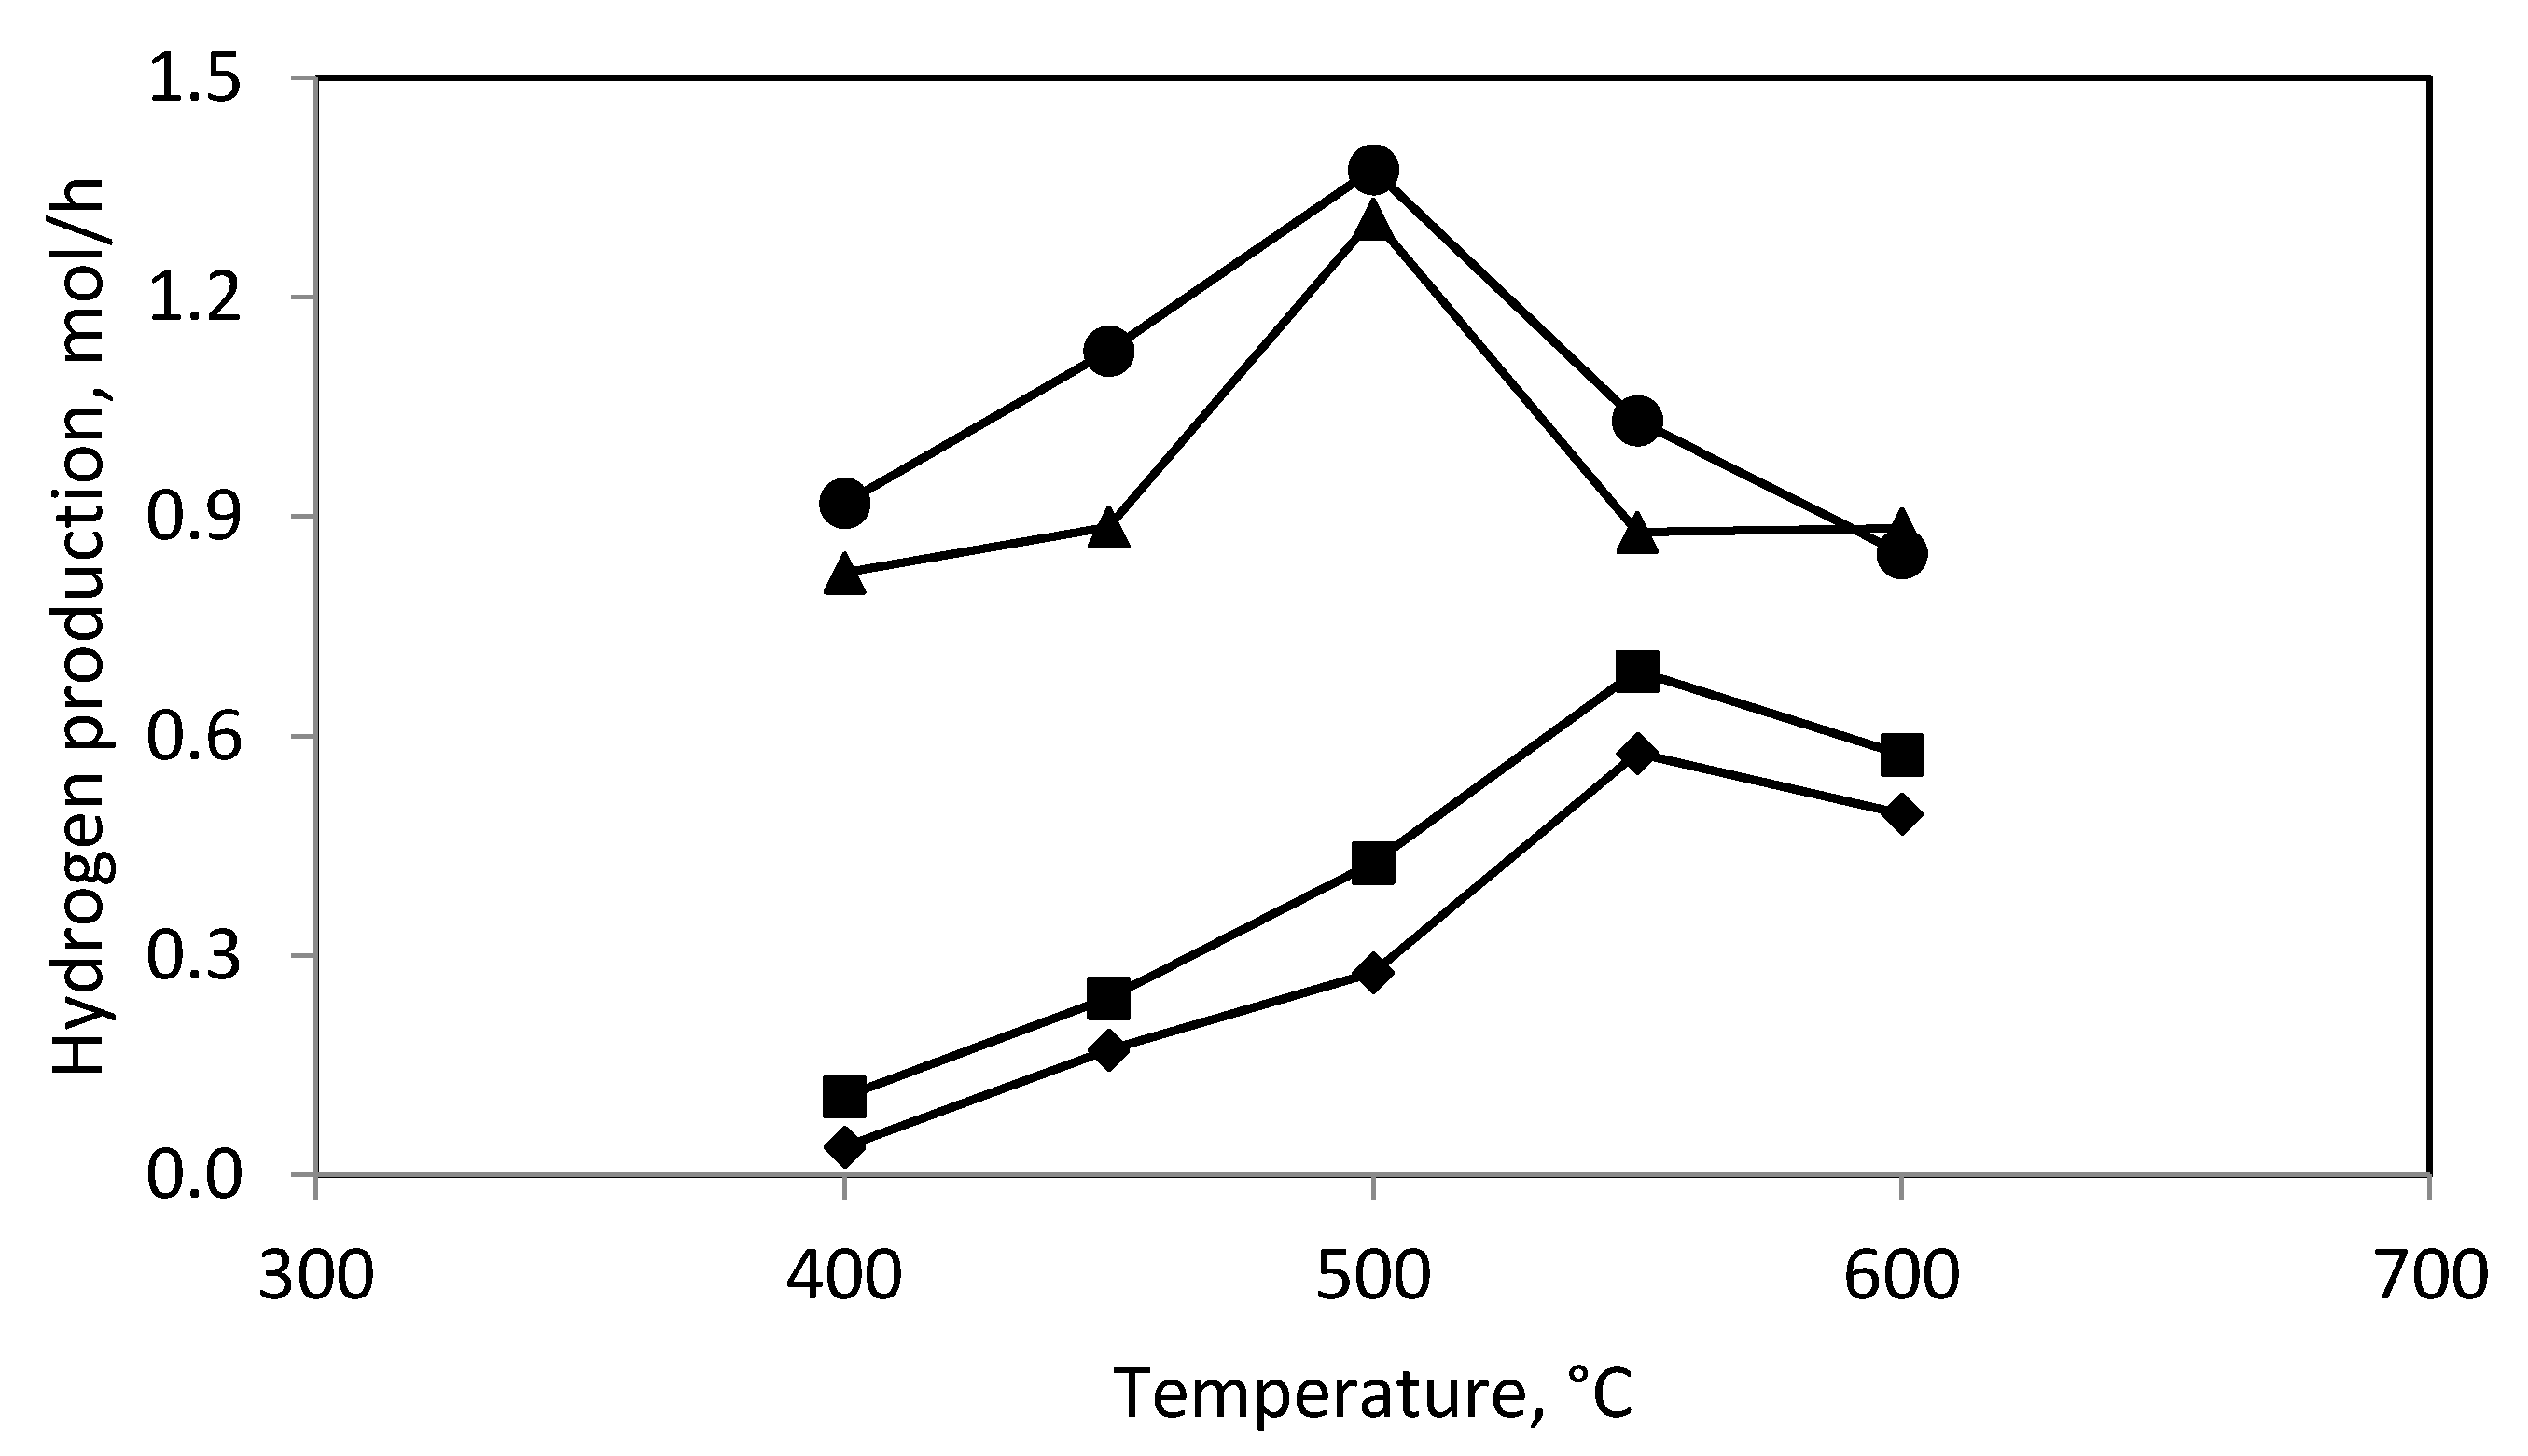
In the plasma-catalytic reactor the methanol conversion and hydrogen production were higher than that for the plasma reactor or the catalytic reactor even though the unfavorable phenomenon of methane formation was observed. Figure 2 and Figure 3 show the dependence of the methanol conversion and hydrogen production on the catalytic bed temperature and the discharge power. The methanol conversion and hydrogen production were maximum at 500–550 °C and increased with increasing discharge power (Figure 2 and Figure 3) as it was observed for the plasma reactor. The increase in the discharge power from 15 to 30 W resulted in a significant increase in the methanol conversion and hydrogen production. In contrast, a further increase in the discharge power to 46 W caused a small increase in methanol conversion and hydrogen production.
2.4. Catalyst Characteristic
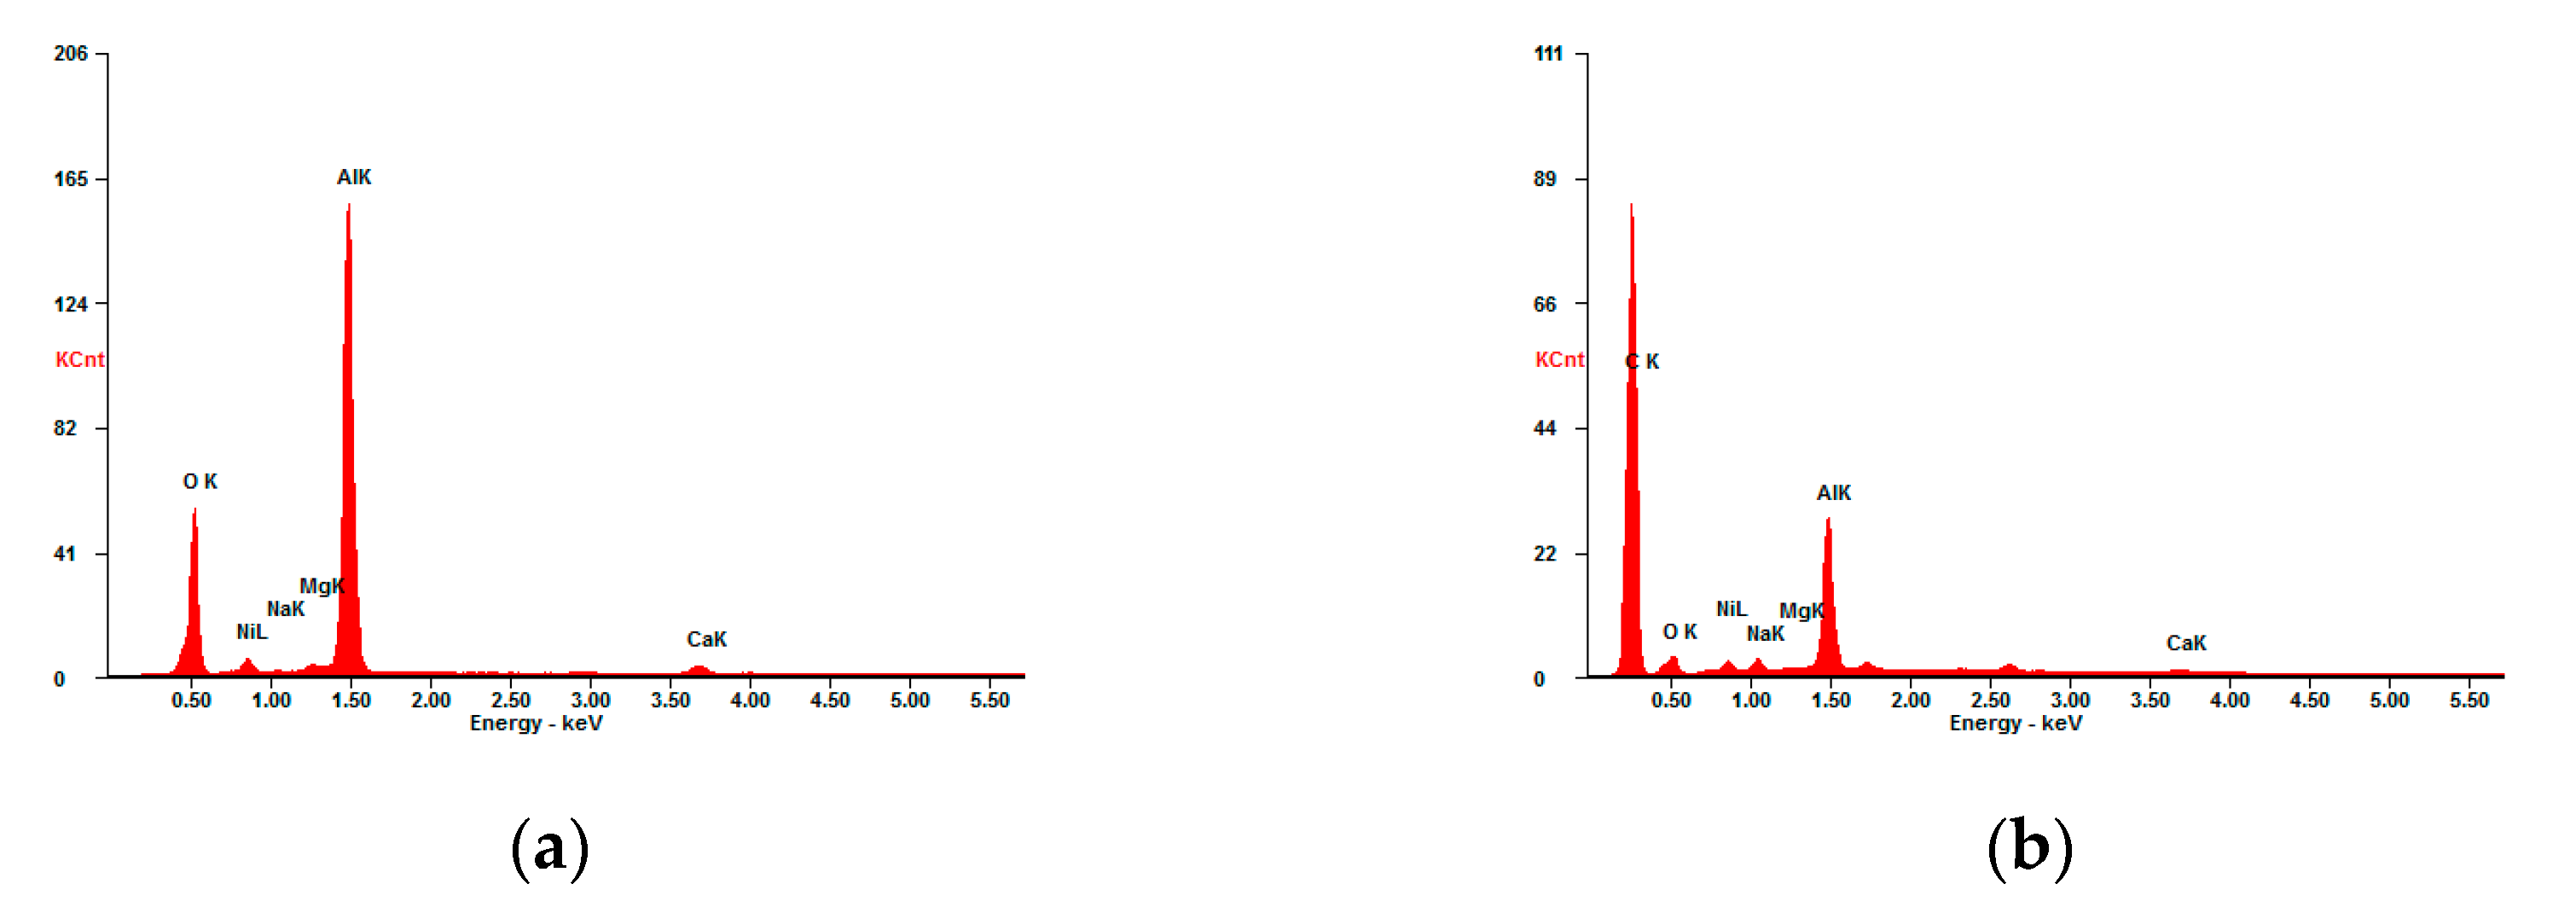
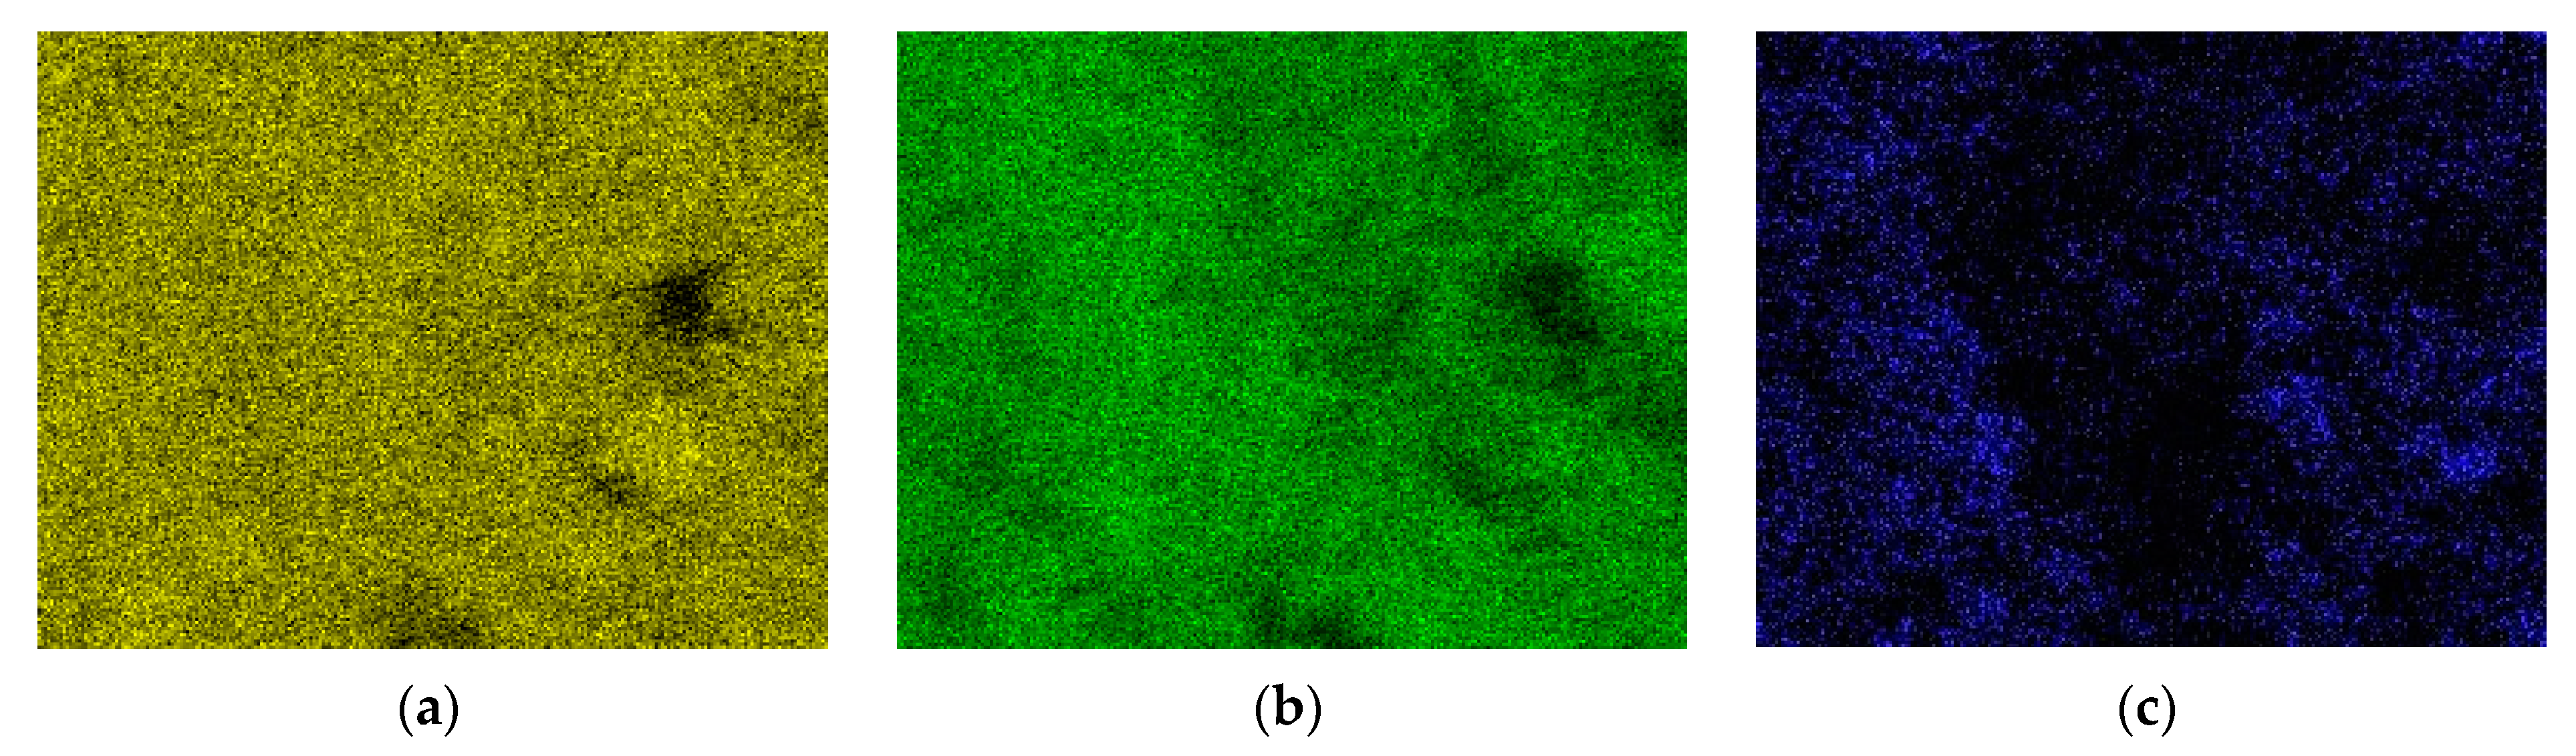
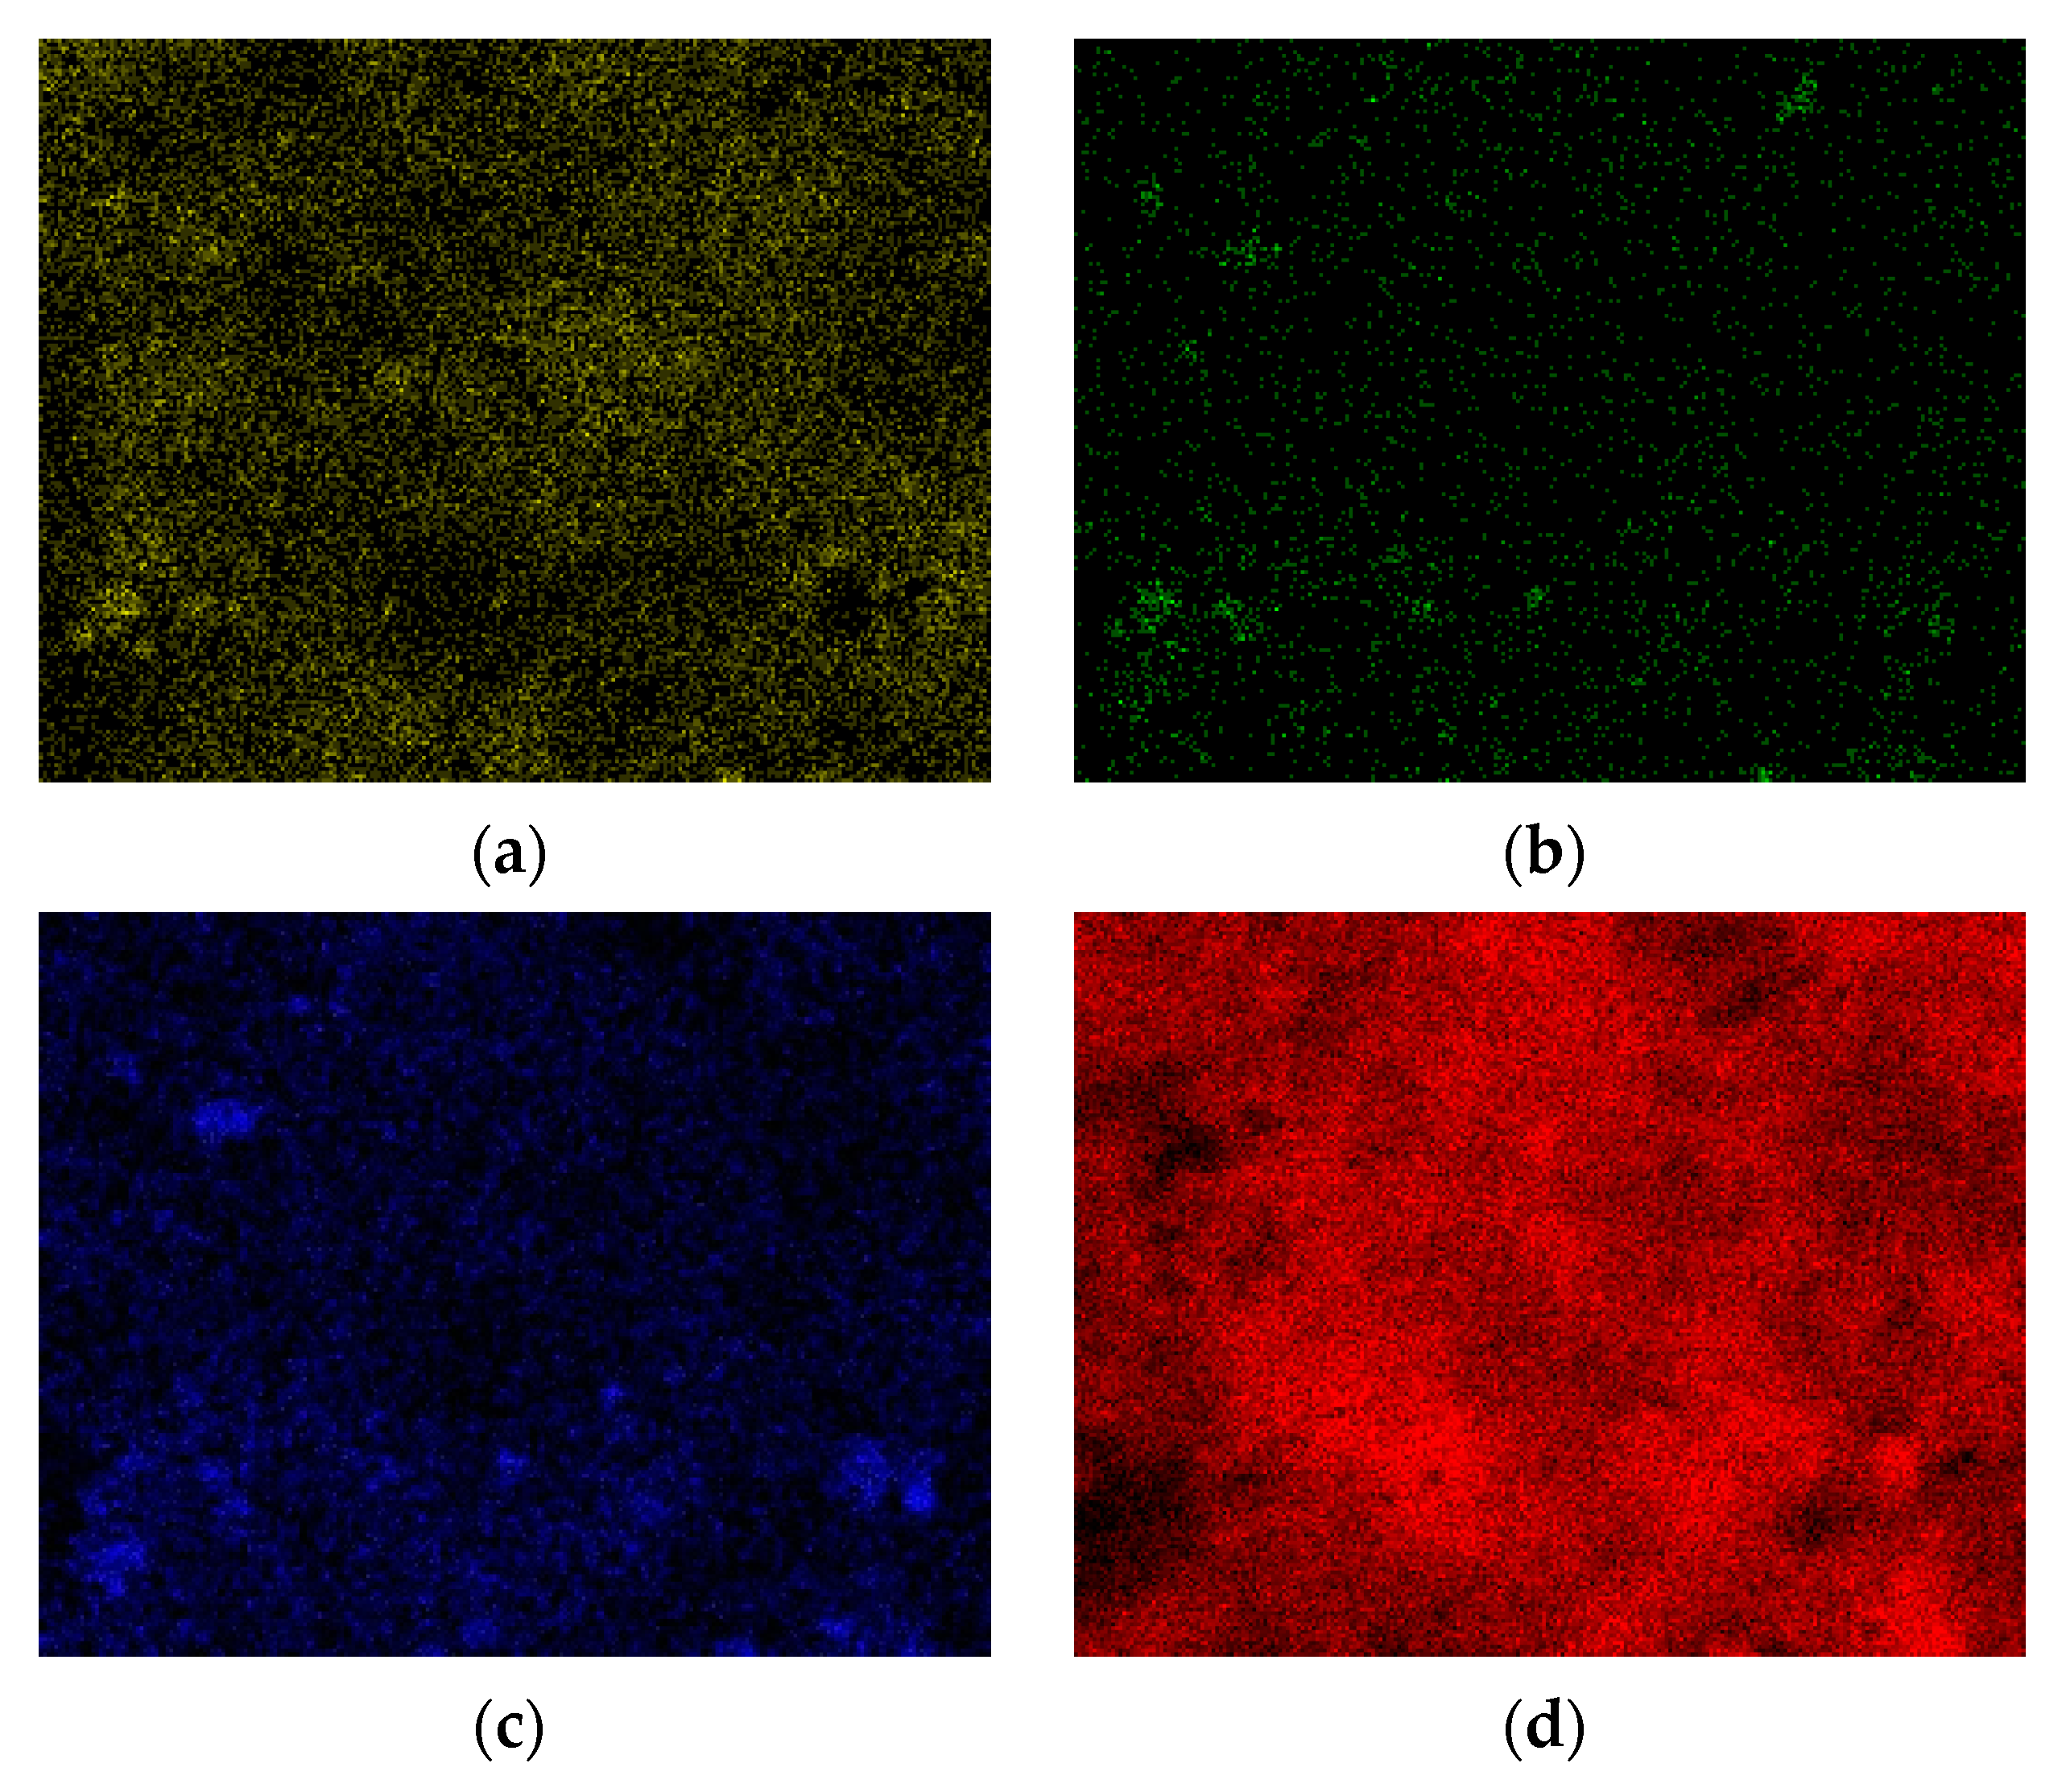
Figure 5 shows the EDX analysis of the fresh and used catalysts. The following elements Al, O, Ni, Ca, Mg, and Na were present in the fresh catalyst. Nickel was introduced into the catalyst during its preparation. The remaining elements are the carrier components. The main component of the carrier was aluminum oxide. The remaining elements were found in small amounts. Calcium, magnesium, and sodium were 0.85, 0.80, and 0.17%, respectively. Al, O, and Ni were evenly distributed on the surface of the fresh catalyst (Figure 6). The EDX dot mapping analysis of the surface of the used catalyst (Figure 7) indicates that there is no change in Ni dispersion under the influence of plasma.
The EDX spectrum showed the presence of carbon in the used catalyst (Figure 5b). Carbon covered the entire surface of the catalyst and the intensity of EDX signals from Al, O and Ni were lower in the used catalyst than in the fresh catalyst (Figure 5, Figure 6 and Figure 7).
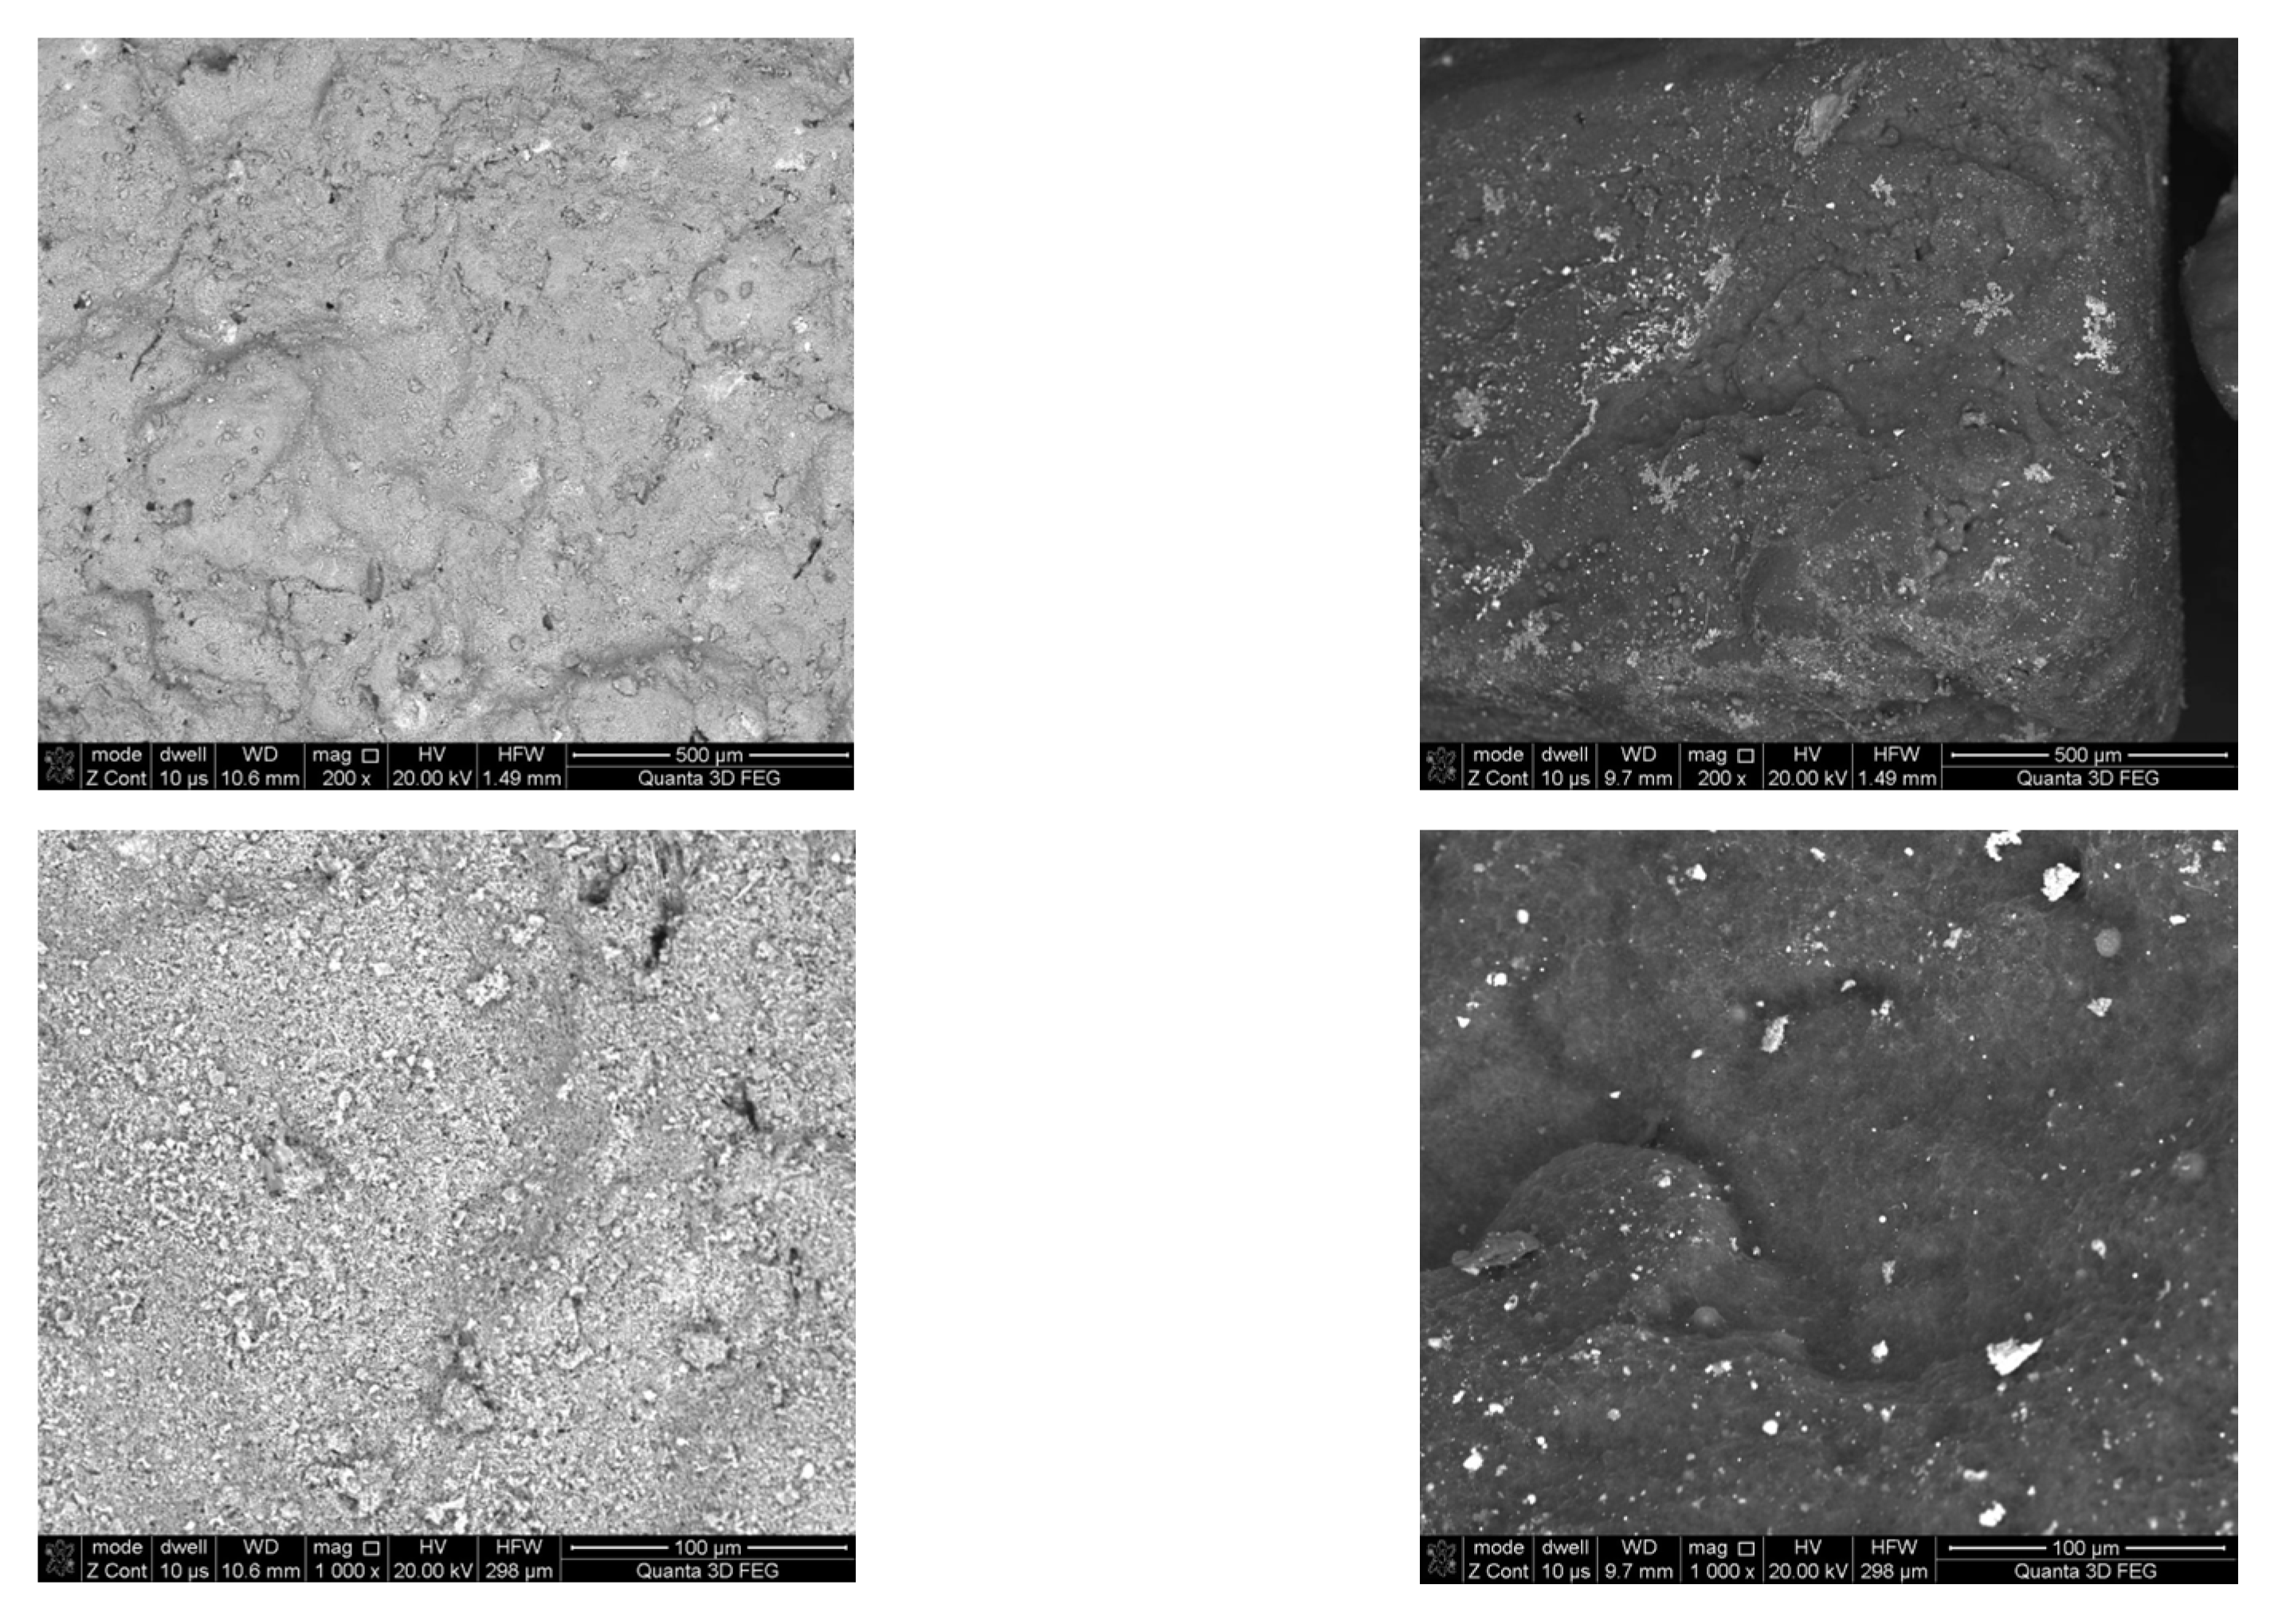
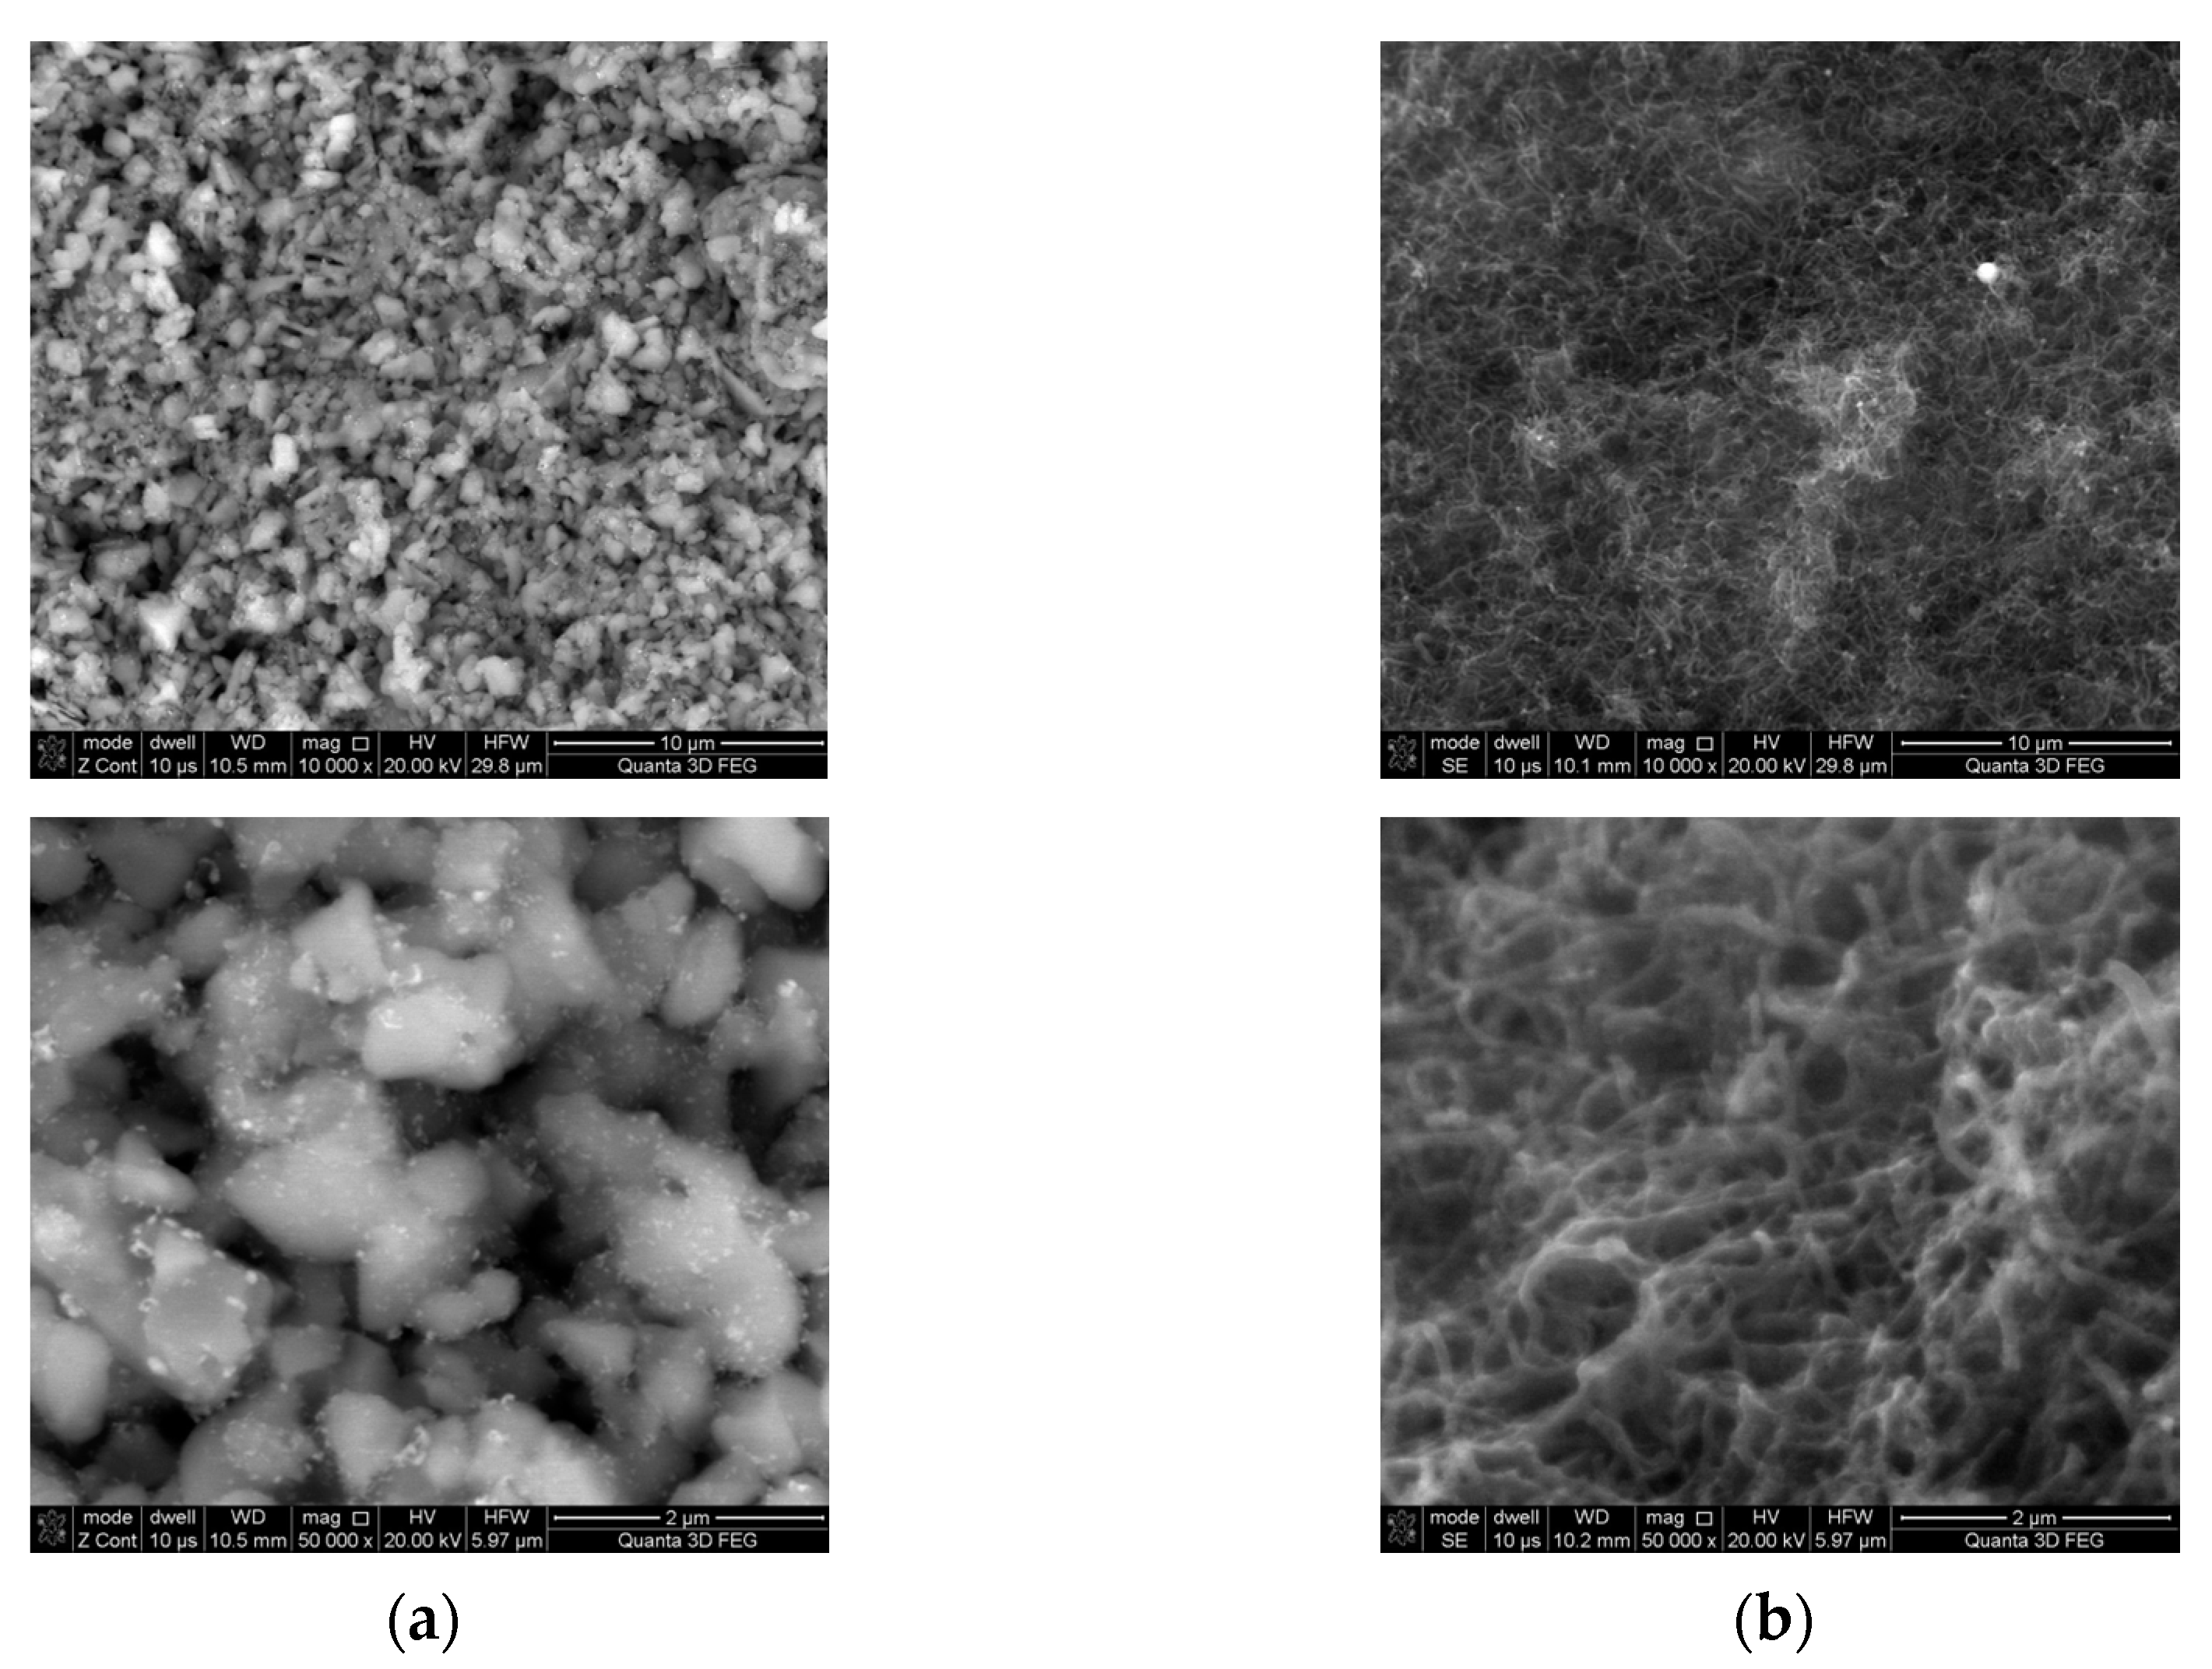
The SEM micrographs of the fresh and used catalyst are shown in Figure 8. In the fresh catalyst, particles with a size of ~1 μm were visible on the surface. The morphology of the used catalyst was different. The catalyst surface were covered with a deposit of carbon nanofibers. This deposit was porous and gas permeable, therefore no reduction in the catalyst activity was observed during the tests.
The carbon deposit could be formed in the following reactions [56]:
The presence of CO in the gases introduced into the catalytic bed is favorable for both reactions. However, the presence of water vapor inhibits R38 and R39. While the temperature of 400–600 °C and the low content of CO2 in the gases introduced into the catalyst bed favor the Boudouard reaction (R37). Therefore, most likely this reaction is responsible for the formation of a deposit of carbon nanofibers.
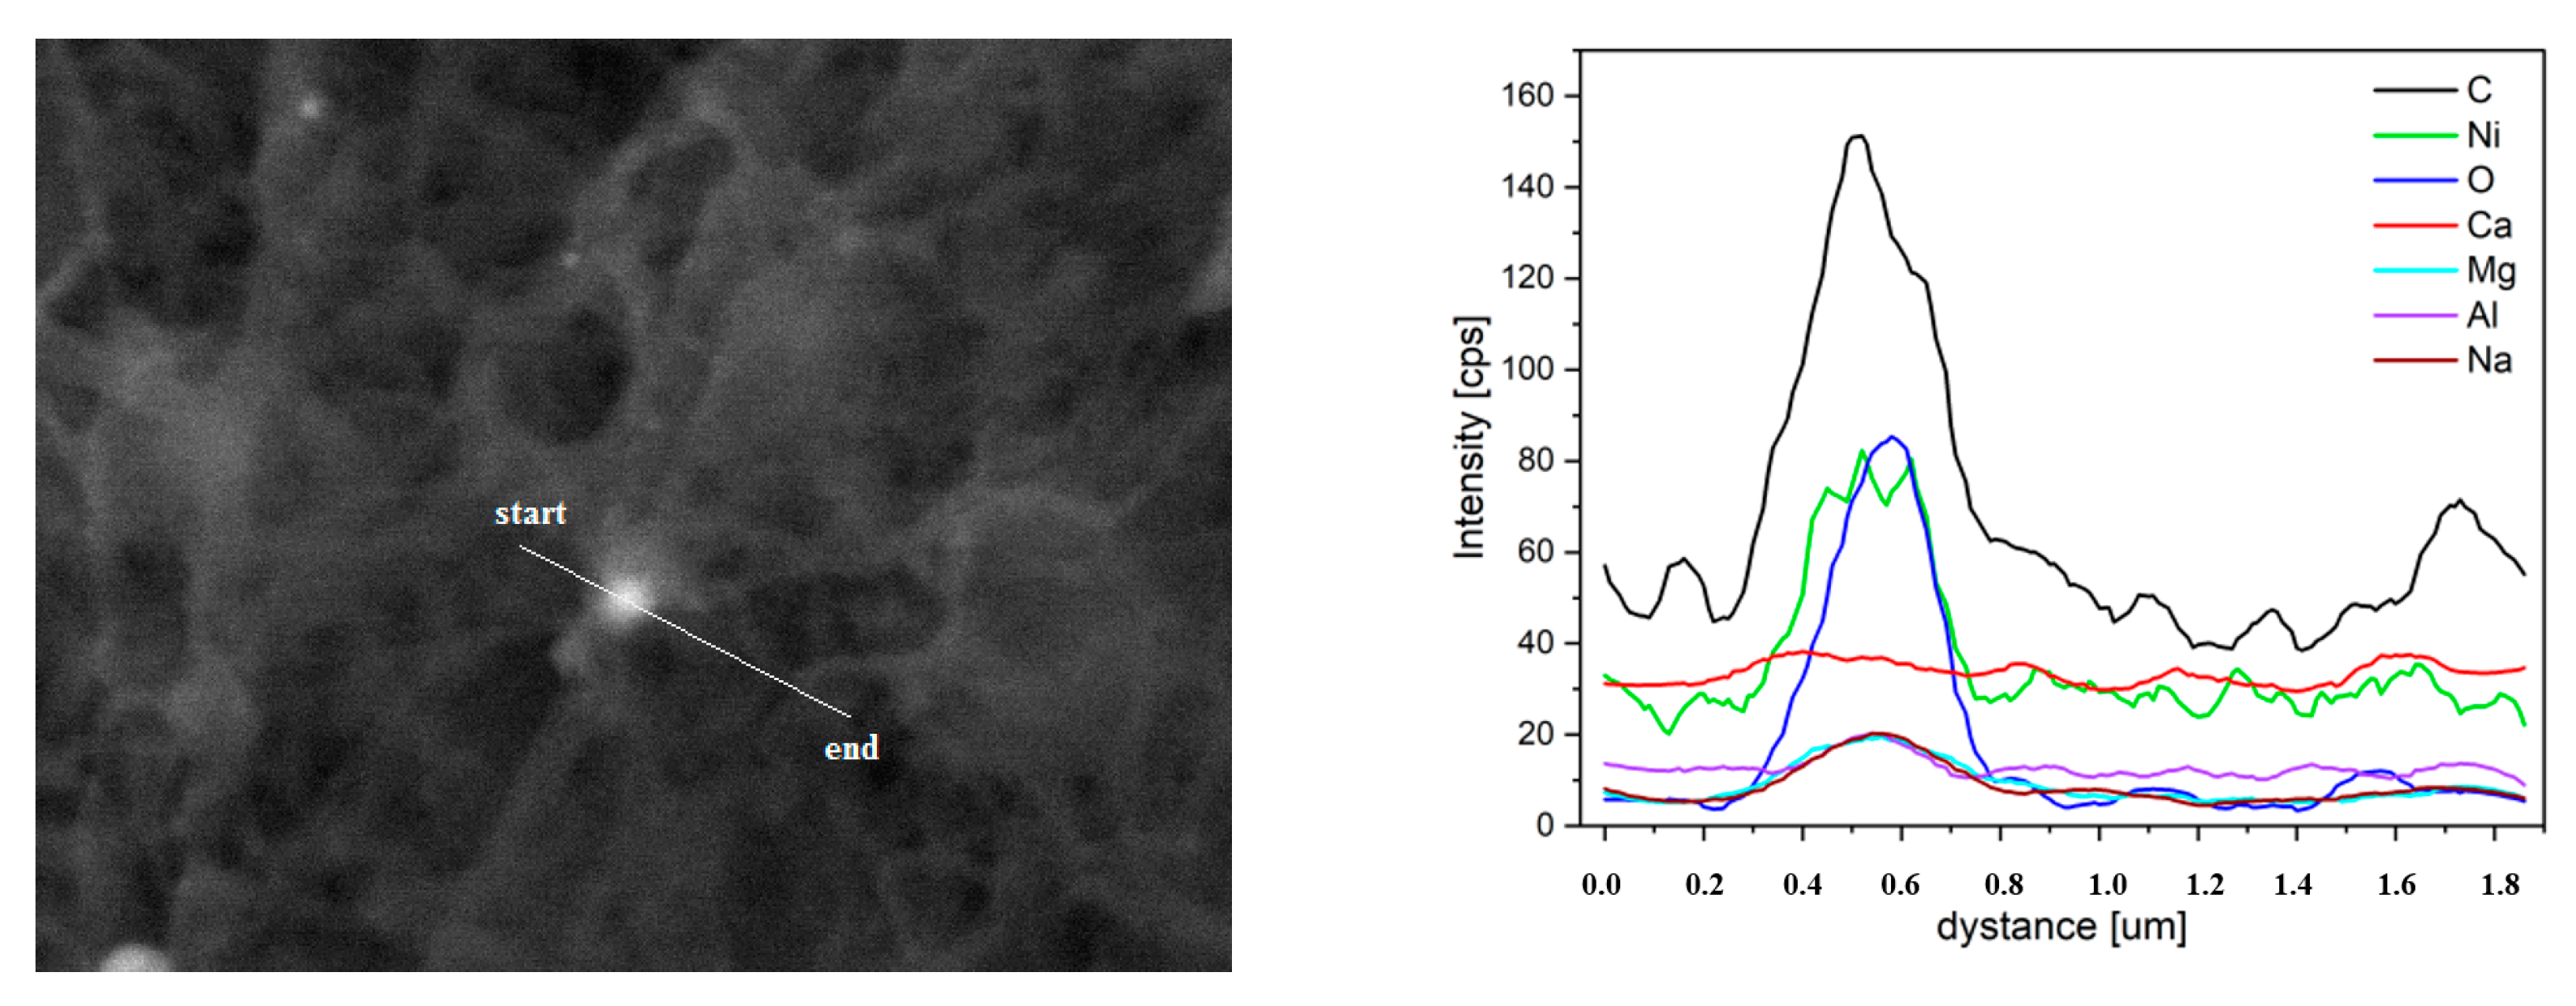
In the catalyst used, there were local spherical particles showing an increased content of nickel and oxygen (Figure 9), also covered with a carbon deposit. The elevated oxygen content indicates that some part of nickel is oxidized. In the presence of water this is not surprising. Water can be decomposed on nickel catalysts and nickel can be oxidized [57]. The presence of nickel oxide may be advantageous because it makes the photochemical reactions run more efficiently [58]. Other metal oxides are photo-catalysts, on which the water splitting process takes place [59,60].
3. Materials and Methods
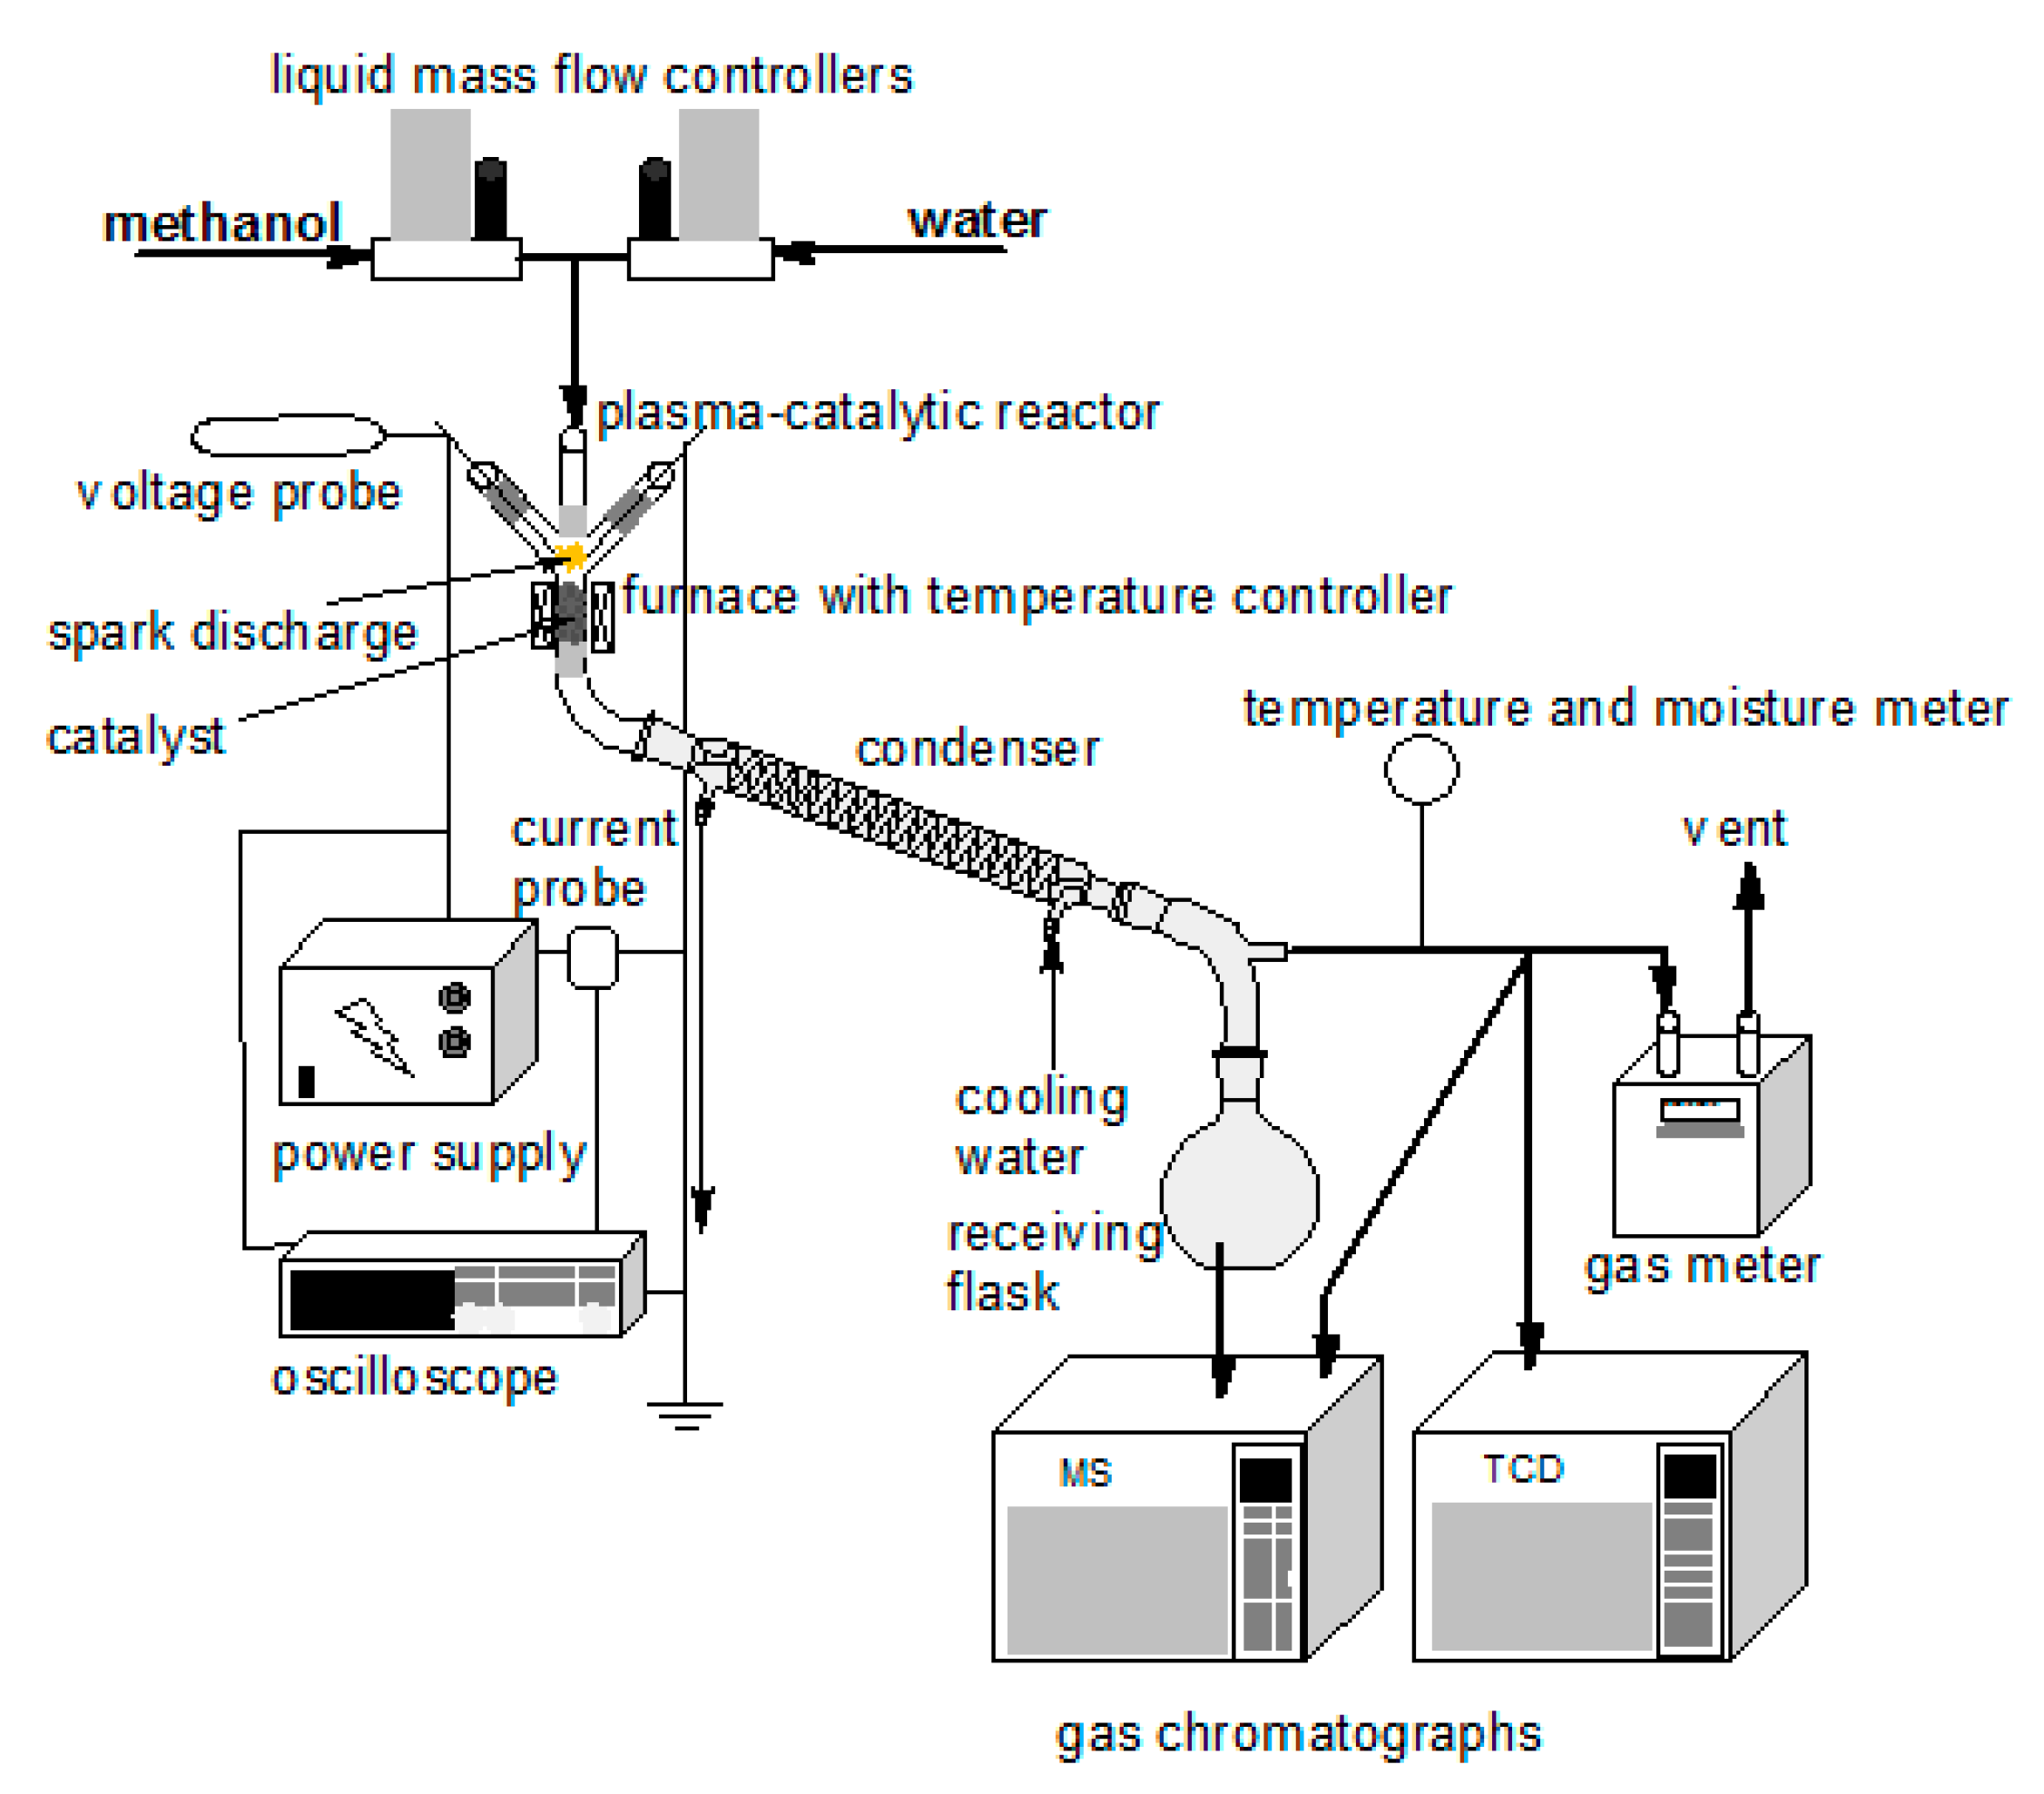
Figure 10 presents the apparatus used during the experiments. The main part was a reactor with quartz casing of 100 mm in length and the internal diameter of 8 mm. The electrodes were placed in 50 mm long quartz arms. The electrodes were made of 316L grade stainless steel and had a diameter of 3.2 mm. The seal between the electrodes and the casing was made of high-temperature silicone. A layer of quartz wool was placed over the electrodes. This layer increased the surface of the liquid evaporation and the mixing of the substrates vapors. One gram of the catalyst was placed under the electrodes. The distance between the ends of the electrodes and the catalyst was 10 mm. The catalyst bed was heated by an electric furnace. The temperature of the catalyst bed was controlled in the range of 400 to 600 °C.
The Al2O3 carrier was manufactured by INS Puławy, Poland. The carrier was impregnated with a solution of Ni(NO3)2·6H2O (Avantor Performance Material Poland SA) using incipient wetness method. The next steps of the catalyst preparation were: drying (24 h), calcination at 600 °C (24 h), reduction at 400 °C (6 h) under H2 flow and cooling to 40 °C under H2 flow. The obtained catalyst has the surface area (SBET) of 7.6 m2/g estimated by N2 physisorption method using ASAP 2020 (Micromeritics, Norcross, GA, USA). The morphology of the catalyst was determined with a Quanta 3D (FEG SEM) field emission gun scanning electron microscopy. The chemical composition was estimated using FEG SEM EDS spectrometer of 20 kV acceleration voltage.
The substrates (water and methanol) flow rates were 1 mol/h for each reagent and were controlled with liquid mass flow controllers (Bronkhorst/EIEWIN, Gliwice, Poland) calibrated to water and methanol.
The outlet gas was passed through a quartz fiber filter and cooled to 17–18 °C to condense water and methanol (measured by weigth). The gas flow rate was measured with the Illmer-Gasmesstechnik (Berlin, Germany) gas-meter, the temperature and water vapor content in the gases were measured with the Apar (Raszyn, Poland) AR236/2 sensor. The concentration of the gases was measured using the Hewlett-Packard (Palo Alto, CA, USA) 6890 gas chromatograph with the thermal conductivity detector. The composition of the liquid was measured with the Thermo Fisher Scientific (Waltham, MA, USA)Trace 1300 chromatograph equipped with the single quadrupole mass spectrometer. The same research methodology was used in our previous studies [7,61].
The reactor was powered by alternating current with a frequency of 15.3 kHz using the power supply constructed at the Faculty of Electrical Engineering of the Warsaw University of Technology. The discharge powers were 15, 30 and 46 W.
The discharge was turned on when starting the feeding of the reactor with the substrates. The recording of the discharge parameters (i.e., voltage and current) using a Tektronix (Beaverton, OR, USA) TDS3032 oscilloscope with a Tektronix P6015A voltage probe and a Tektronix TCP202 current probe was conducted with an interval of 15 min. Based on these measurements, the discharge power was calculated according to the formula (1):
P = f · ∫ U(t) · I(t) dt
- P—discharge power, W
- F—frequency, Hz
- U—voltage, V
- I—current, A
- t—time, s
The parameters used to assess the process of hydrogen production, i.e., concentration of products, hydrogen production, methanol conversion, and energy yield of hydrogen production were measured or calculated according to the formulas (2)–(4):
W[H2] = q · c/V
- W[H2]—production of hydrogen, mol/h
- q—gas flow rate [STP], dm3/h
- c—concentration of hydrogen
- V—molar volume of gas [STP], dm3/mol
X = (Win[MeOH] – W[MeOH])/Win[MeOH] · 100%
- x—methanol conversion, %
- Win[MeOH]—inlet methanol flow rate, mol/h
- W[MeOH]—outlet methanol flow rate, mol/h
- V—molar volume of gas under standard conditions, dm3/mol
Y = W[H2]/(1000 · P)
- Y—energy yield, mol(H2)/kWh
4. Conclusions
The plasma-catalytic reactor allowed to achieve higher hydrogen production and methanol conversion in comparison to the plasma reactor or the catalytic reactor. The methanol conversion and hydrogen production were dependent on the discharge power and the temperature of the catalytic bed. The best results were obtained when the catalytic bed temperature was 500–550 °C. The conversion methanol and hydrogen production increased as the discharge power increased. However, while the increase in the discharge power from 15 to 30 W caused a large increase in the methanol conversion and hydrogen production, a further increase to 46 W was not very effective. Therefore, the discharge power of 30 W was optimal. For this power and the temperature of 500 °C methanol conversion and hydrogen production were 61% and 1.31 mol/h, respectively. The highest achieved values of methanol conversion and hydrogen production were slightly higher and amounted to 64% and 1.38 mol/h, respectively. They were obtained for the discharge power of 46 W and the temperature of 500 °C.
Both in the plasma and on the catalyst the decomposition of methanol was the main reaction. Subsequent reactions leading to the formation of CO2 and CH4 occurred to a small extent. The presence of the catalyst was advantageous because it increased the importance of the subsequent reactions.
Author Contributions
Conceptualization, B.U.; methodology, B.U., M.M., P.J. and Ł.N.; validation, B.U., K.K., P.J. and M.M.; formal analysis, B.U.; investigation, B.U., P.J., Ł.N. and M.M.; resources, B.U., Ł.N. and P.J.; data curation, B.U.; writing—original draft preparation, B.U.; writing—review and editing, B.U.; supervision, K.K.; funding acquisition, K.K. All authors have read and agreed to the published version of the manuscript.
Funding
This research was funded by Warsaw University of Technology.
Data Availability Statement
Data will be made available by authors on request.
Conflicts of Interest
The authors declare no conflict of interest.
References
- Schmidt-Szałowski, K.; Krawczyk, K.; Sentek, J.; Ulejczyk, B.; Górska, A.; Młotek, M. Hybrid plasma-catalytic systems for converting substances of high stability, greenhouse gases and VOC. Chem. Eng. Res. Des. 2011, 89, 2643–2654. [Google Scholar] [CrossRef]
- Vega-Gonzalez, A.; Duten, X.; Sauce, S. Plasma-Catalysis for Volatile Organic Compounds Decomposition: Complexity of the Reaction Pathways during Acetaldehyde Removal. Catalysis 2020, 10, 1146. [Google Scholar]
- Cimerman, R.; Cíbiková, M.; Satrapinskyy, L.; Hensel, K. The effect of packing material properties on tars removal by plasma catalysis. Catalysts 2020, 10, 1476. [Google Scholar] [CrossRef]
- Krawczyk, K.; Młotek, M.; Ulejczyk, B.; Schmidt-Szałowski, K. Methane conversion with carbon dioxide in plasma-catalytic system. Fuel 2014, 117, 608–617. [Google Scholar] [CrossRef]
- Ge, W.; Duan, X.; Li, Y.; Wang, B. Plasma catalyst synergy during methanol steam reforming in dielectric barrier discharge micro-plasma reactors for hydrogen production. Plasma Chem. Plasma Process. 2015, 35, 187–199. [Google Scholar] [CrossRef]
- Govender, B.B.; Iwarere, S.A.; Ramjugarnath, D. Plasma-catalytic Fisher-Tropsch synthesis at very high pressure. Catalysts 2021, 19, 297. [Google Scholar] [CrossRef]
- Ulejczyk, B.; Nogal, Ł.; Młotek, M.; Falkowski, P.; Krawczyk, K. Hydrogen production from ethanol using a special multi-segment plasma-catalytic reactor. J. Energy Inst. 2021, 95, 179–186. [Google Scholar] [CrossRef]
- Magureanu, M.; Mandache, N.B.; Paevulescu, V.I.; Subrahmanyam, C.; Renken, A.; Kiwi-Minsker, L. Improved performance of non-thermal plasma reactor during decomposition of trichloroethylene: Optimization of the reactor geometry and introduction of catalytic electrode. Appl. Catal. B Environ. 2007, 74, 270–277. [Google Scholar] [CrossRef] [Green Version]
- Krawczyk, K.; Jodzis, S.; Lamenta, A.; Kostka, K.; Schmidt-Szalowski, K. Study on decomposition of tetrachloromethane as a model substance in environment of spark discharge plasma. Przem. Chem. 2010, 8, 1101–1106. [Google Scholar]
- Reda, E.; Jóźwik, P.; Krawczyk, K.; Młotek, M. Plasma-catalytic decomposition of cyclohexane in gliding discharge reactor. Appl. Catal. A Gen. 2015, 25, 150–158. [Google Scholar]
- Shak, J.R.; Harrison, J.M.; Carreon, M.L. Ammonia plasma-catalytic synthesis using low melting point alloys. Catalysts 2018, 8, 437. [Google Scholar]
- Młotek, M.; Ulejczyk, B.; Woroszył, J.; Walerczak, I.; Krawczyk, K. Purification of the gas after pyrolysis in coupled plasma-catalytic system. Pol. J. Chem. Technol. 2017, 19, 94–98. [Google Scholar] [CrossRef] [Green Version]
- Du, C.M.; Ma, D.; Wu, J.; Lin, Y.; Xiao, W.; Ruan, J.; Huang, D. Plasma-catalysis reforming for H2 production from ethanol. Int. J. Hydrogen. Energy 2015, 40, 15398–15410. [Google Scholar] [CrossRef]
- Młotek, M.; Ulejczyk, B.; Woroszył, J.; Krawczyk, K. Coupled Plasma-Catalytic System with Rang 19pr Catalyst for Conversion of Tar. Sci. Rep. 2019, 9, 13562. [Google Scholar] [CrossRef] [PubMed] [Green Version]
- Młotek, M.; Ulejczyk, B.; Woroszył, J.; Krawczyk, K. Decomposition of Toluene in Coupled Plasma-Catalytic System. Ind. Eng. Chem. Res. 2020, 59, 4239–4244. [Google Scholar] [CrossRef]
- Krawczyk, K.; Ulejczyk, B.; Song, H.K.; Lamenta, A.; Paluch, B.; Schmidt-Szałowski, K. Plasma-catalytic Reactor for Decomposition of Chlorinated Hydrocarbons. Plasma Chem. Plasma Process. 2009, 29, 27–41. [Google Scholar] [CrossRef]
- Wang, B.; Mikhail, M.; Gavadias, S.; Tatoulian, M.; Da Costa, P.; Ognier, S. Improvement of the activity of CO2 methanation in a hybrid plasma-catalytic process in varying catalyst particle size or under pressure. J. CO2 Util. 2021, 46, 101471. [Google Scholar] [CrossRef]
- Audemar, M.; Vallcorba, O.; Peral, I.; Thomann, J.S.; Przekora, A.; Pawlat, J.; Canal, C.; Ginalska, G.; Kwiatkowski, M.; Duday, D.; et al. Catalytic enrichment of plasma with hydroxyl radicals in the aqueous phase at room temperature. Catal. Sci. Technol. 2021, 11, 1430–1442. [Google Scholar] [CrossRef]
- Mosinska, M.; Stępińska, N.; Maniukiewicz, W.; Rogowski, J.; Mierczynska-Vasilev, A.; Vasilev, K.; Szynkowska, M.I.; Mierczyński, P. Hydrogen production on Cu-Ni catalysts via the oxy-steam reforming of methanol. Catalysts 2020, 10, 273. [Google Scholar] [CrossRef] [Green Version]
- Perez-Larios, A.; Rico, J.L.; Anaya-Esparza, L.M.; Gonzalez Vargas, O.A.; Gonzalez-Silva, N.; Gomez, R. Hydrogen production from aqueous methanol solutions using Ti–Zr mixed oxides as photocatalysts under UV irradiation. Catalysts 2019, 9, 938. [Google Scholar] [CrossRef] [Green Version]
- Ranjekar, A.M.; Yadav, G.D. Steam reforming of methanol for hydrogen production: A critical analysis of catalysis, processes, and scope. Ind. Eng. Chem. Res. 2021, 60, 89–113. [Google Scholar] [CrossRef]
- Pethaiah, S.S.; Sadasivuni, K.K.; Jayakumar, A.; Ponnamma, D.; Tiwary, C.S.; Sasikumar, G. Methanol electrolysis for hydrogen production using polymer electrolyte membrane: A mini-review. Energies 2020, 13, 5879. [Google Scholar] [CrossRef]
- Burlica, R.; Shin, K.Y.; Hnatiuc, B.; Locke, B.R. Hydrogen generation by pulsed gliding arc discharge plasma with sprays of alcohol solutions. Ind. Eng. Chem. Res. 2011, 50, 9466–9470. [Google Scholar] [CrossRef]
- Panda, N.R.; Sahu, D. Enhanced hydrogen generation efficiency of methanol using dielectric barrier discharge plasma methodology and conducting sea water as an electrode. Heliyon 2020, 6, e04717. [Google Scholar] [CrossRef]
- Bauschlichter, C.W.; Langhoff, S.R.; Walch, S.P. Theoretical study of the bond dissociation energies of methanol. J. Chem. Phys. 1992, 96, 450–454. [Google Scholar] [CrossRef]
- Maksyutenko, P.; Rizzo, T.R.; Boyarkin, O.V. A direct measurement of the dissociation energy of water. J. Chem. Phys. 2006, 125, 181101. [Google Scholar] [CrossRef]
- Bye, C.A.; Scheeline, A. Electron density profiles in single spark discharges. J. Quant. Spectrosc. Radiative 1995, 53, 75–93. [Google Scholar] [CrossRef]
- Cheng, C.; Shi, J.; Du, F.; Zong, S.; Guan, X.; Zhang, Y.; Liu, M.; Guo, L. Simply blending Ni nanoparticles with typical photocatalysts for efficient photocatalytic H2 production. Catal. Sci. Technol. 2019, 9, 7016–7022. [Google Scholar] [CrossRef]
- Husin, H.; Pontas, K.; Yunardu, Y.; Salamun, A.; Alam, P.N.; Hasfita, F. Photocatalytic hydrogen production over Ni/La-NaTaO3 nanoparticles from NaCl-water solution in the presence of glucose as electron donor. ASEAN J. Chem. Eng. 2017, 17, 27–36. [Google Scholar] [CrossRef] [Green Version]
- Garay-Rodríguez, L.F.; Murcia-López, S.; Andreu, T.; Moctezuma, E.; Torres-Martínez, L.M.; Morante, J.R. Photocatalytic hydrogen evolution using bi-metallic (Ni/Pt) Na2Ti3O7 whiskers: Effect of the deposition order. Catalysts 2019, 9, 285. [Google Scholar] [CrossRef] [Green Version]
- Laosiripojana, N.; Assabumrungrat, S. Catalytic steam reforming of methane, methanol, and ethanol over Ni/YSZ: The possible use of these fuels in internal reforming SOFC. J. Power Sources 2007, 163, 943–951. [Google Scholar] [CrossRef]
- Li, J.; Mei, X.; Zhang, L.; Yu, Z.; Liu, Q.; Wei, T.; Wu, W.; Dong, D.; Xu, L.; Hu, X. A comparative study of catalytic behaviors of Mn, Fe, Co, Ni, Cu and Zn-based catalysts in steam reforming of methanol, acetic acid and acetone. Int. J. Hydrogen. Energy 2020, 45, 3815–3832. [Google Scholar] [CrossRef]
- Bobadilla, L.F.; Palma, S.; Ivanova, S.; Dominguez, M.I.; Romero-Sarria, F.; Centeno, M.A.; Odriozola, J.A. Steam reforming of methanol over supported Ni and Ni-Sn nanoparticles. Int. J. Hydrogen. Energy 2013, 38, 6646–6656. [Google Scholar] [CrossRef]
- Papavasiliou, J.; Paxinou, A.; Słowik, G.; Neophytides, S.; Avgouropoulos, G. Steam reforming of methanol over nanostructured Pt/ToO2 and Pt/CeO2 catalysts for fuel call applications. Catalysts 2018, 8, 544. [Google Scholar] [CrossRef] [Green Version]
- Zhang, R.; Huang, C.; Zong, L.; Wang, X.; Cai, J. Hydrogen production from methanol steam reforming over TiO2 and CeO2 pillared clay supported Au catalysts. Appl. Sci. 2018, 8, 176. [Google Scholar] [CrossRef] [Green Version]
- Papavasiliou, J.; Słowik, G.; Avgouropoulos, G. Redox behavior of a copper-based methanol reformer for fuel cell applications. Energy Technol. 2018, 6, 1332–1341. [Google Scholar] [CrossRef]
- Xu, Z.F.; Raghunath, P.; Lin, M.C. Ab-initio chemical kinetics for the CH3 + O(3P) reaction and related isomerization−decomposition of CH3O and CH2OH radicals. J. Phys. Chem. A 2015, 119, 7404–7417. [Google Scholar] [CrossRef] [PubMed]
- Bouallagui, A.; Zanchet, A.; Yazidi, O.; Jaidane, N.; Banares, L.; Senent, M.L.; Garcia-Vela, A. Photodissociation of the CH3O and CH3S radical molecules: An ab initio electronic structure study. Phys. Chem. Chem. Phys. 2017, 19, 31245. [Google Scholar] [CrossRef]
- Cribb, P.H.; Dove, J.E.; Yamazaki, S. A kinetic study of the pyrolysis of methanol using shock tube and computer simulation techniques. Combust. Flame 1992, 88, 169–185. [Google Scholar] [CrossRef]
- Tsang, W. Chemical kinetic data base for combustion chemistry. Part 2. Methanol. J. Phys. Chem. Ref. 1987, 16, 471–508. [Google Scholar] [CrossRef]
- Hoyermann, K.; Loftfield, N.S.; Sievert, R.; Wagner, H.G. Mechanism and Rates of the Reactions of CH3O and CH2OH Radicals with H Atoms. Symp. Int. Combust. Proc. 1981, 18, 831–842. [Google Scholar] [CrossRef]
- Jasper, A.W.; Klippenstein, S.J.; Harding, L.B. Theoretical rate coefficients for the reaction of methyl radical with hydroperoxyl radical and for methylhydroperoxide decomposition. Proc. Combust. Inst. 2009, 32, 279–286. [Google Scholar] [CrossRef]
- Rhee, T.S.; Brenninkmeijer, C.A.M.; Rockmann, T. Hydrogen isotope fractionation in the photolysis of formaldehyde. Atmos. Chem. Phys. 2008, 8, 1353–1366. [Google Scholar] [CrossRef] [Green Version]
- Irdam, E.A.; Kiefer, J.H.; Harding, L.B.; Wagner, A.F. The formaldehyde decomposition chain mechanism. Int. J. Chem. Kinet. 1993, 25, 285–303. [Google Scholar] [CrossRef]
- Temps, F.; Wagner, H.G. Rate constants for the reactions of OH-radicals with CH2O and HCO. Ber. Bunsenges. Phys. Chem. 1984, 88, 415–418. [Google Scholar] [CrossRef]
- Krasnoperov, L.N.; Chesnokov, E.N.; Stark, H.; Ravishankara, A.R. Unimolecular dissociation of formyl radical, HCO→H + CO, studied over 1-100 bar pressure range. J. Phys. Chem. A 2004, 108, 1526–11536. [Google Scholar] [CrossRef]
- Kaufman, F.; Del Greco, F.P. Fast reactions of OH radicals. Symp. Int. Combust. Proc. 1963, 9, 659–668. [Google Scholar] [CrossRef]
- Sangwan, M.; Chesnokov, E.N.; Krasnoperov, L.N. Reaction OH plus OH Studied over the 298-834 K Temperature and 1–100 bar Pressure Ranges. J. Phys. Chem. A 2012, 116, 6282–6294. [Google Scholar] [CrossRef]
- Larson, C.W.; Stewart, P.H.; Golden, D.M. Pressure and temperature dependence of reactions proceeding via a bound complex. An approach for combustion and atmospheric chemistry modelers. Application to HO + CO → [HOCO] → H + CO2. Int. J. Chem. Kinet. 1988, 20, 27–40. [Google Scholar] [CrossRef]
- Baldwin, R.R.; Jackson, D.; Melvin, A.; Rossiter, B.N. The Second Limit of Hydrogen + Carbon Monoxide + Oxygen Mixtures. Int. J. Chem. Kinet. 1972, 4, 277–292. [Google Scholar] [CrossRef]
- Ma, S.; Liu, R. Theoretical studies on the reaction path and dynamics of the reaction CH3 + H2O → CH4 + OH. Sci. China Ser. B 1996, 39, 37–44. [Google Scholar]
- Brouard, M.; Macpherson, M.T.; Pilling, M.J. Experimental and RRKM modeling study of the CH3 + H and CH3 + D Reactions. J. Phys. Chem. 1989, 93, 4047–4059. [Google Scholar] [CrossRef]
- Shannon, T.W.; Harrison, A.G. The reaction of methyl radicals with methyl alcohol. Can. J. Chem. 1963, 41, 2455–2461. [Google Scholar] [CrossRef]
- Thynne, J.C.J.; Gray, P. Methoxyl-radical-induced decomposition of methyl formate: Kinetics of methoxyl and methyl radical reactions. Trans. Faraday Soc. 1963, 59, 1149–1155. [Google Scholar] [CrossRef]
- Jasper, A.W.; Klippenstein, S.J.; Harding, L.B.; Rustic, B. Kinetics of the reaction of methyl radical with hydroxyl radical and methanol decomposition. J. Phys. Chem. A 2007, 111, 3932–3950. [Google Scholar] [CrossRef]
- Kierzkowska-Pawlak, H.; Tracz, P.; Redzynia, W.; Tyczkowski, J. Plasma deposited novel nanocatalysts fof CO2 hydrogenation to methane. J. CO2 Util. 2017, 17, 312–319. [Google Scholar] [CrossRef]
- Zhang, L.; Liu, Q.; Aoki, T.; Crozier, P.A. Structural evolution during photocorrosion of Ni/NiO core/shell cocatalyst on TiO2. J. Phys. Chem. C 2015, 119, 7207–7214. [Google Scholar] [CrossRef]
- Xie, K.; Guo, P.; Xiong, Z.; Sun, S.; Wang, H.; Gao, Y. Ni/NiO hybrid nanostructure supported on biomass carbon for visible-light photocatalytic hydrogen evolution. J. Mater. Sci. 2021, 56, 12775–12788. [Google Scholar] [CrossRef]
- Turczyniak, S.; Teschner, D.; Machocki, A.; Zafeiratos, S. Effect of ten surface on the catalytic performance of a Co/CeO2 ethanol steam reforming catalyst. J. Catal. 2016, 340, 321–330. [Google Scholar] [CrossRef]
- Jozwiak, L.; Balcerzak, J.; Tyczkowski, J. Plasma-deposited Ru-based thin films for photoelectrochemical water splitting. Catalysts 2020, 10, 278. [Google Scholar] [CrossRef] [Green Version]
- Ulejczyk, B.; Nogal, Ł.; Młotek, M.; Krawczyk, K. Hydrogen production from ethanol using dielectric barrier discharge. Energy 2019, 174, 261–268. [Google Scholar] [CrossRef]
Figure 1.
The energy bond in methanol and water.

Figure 2.
The conversion of methanol in: (♦) catalytic reactor; (■) plasma-catalytic reactor, 15 W of power; (▲) plasma-catalytic reactor, 30 W of power; (●) plasma-catalytic reactor, 46 W of power.
Figure 2.
The conversion of methanol in: (♦) catalytic reactor; (■) plasma-catalytic reactor, 15 W of power; (▲) plasma-catalytic reactor, 30 W of power; (●) plasma-catalytic reactor, 46 W of power.

Figure 3.
The hydrogen production in: (♦) catalytic reactor; (■) plasma-catalytic reactor, 15 W of power; (▲) plasma-catalytic reactor, 30 W of power; (●) plasma-catalytic reactor, 46 W of power.
Figure 3.
The hydrogen production in: (♦) catalytic reactor; (■) plasma-catalytic reactor, 15 W of power; (▲) plasma-catalytic reactor, 30 W of power; (●) plasma-catalytic reactor, 46 W of power.

Figure 4.
The influence of the discharge power on the operation of the plasma reactor. (a) The concentration of: (○) hydrogen; (◊) carbon monoxide; (Δ) carbon dioxide and (☐) methane in the gas; (b) methanol conversion; (c) hydrogen production; (d) energy yield.
Figure 4.
The influence of the discharge power on the operation of the plasma reactor. (a) The concentration of: (○) hydrogen; (◊) carbon monoxide; (Δ) carbon dioxide and (☐) methane in the gas; (b) methanol conversion; (c) hydrogen production; (d) energy yield.

Figure 5.
EDX spectrum of elemental microanalysis: (a) the fresh catalyst; (b) the used catalyst.

Figure 6.
EDX dot mapping analysis of the surface of the fresh catalyst: (a) aluminum; (b) oxygen; (c) nickel.
Figure 6.
EDX dot mapping analysis of the surface of the fresh catalyst: (a) aluminum; (b) oxygen; (c) nickel.

Figure 7.
EDX dot mapping analysis of the surface of the used catalyst: (a) aluminum; (b) oxygen; (c) nickel; (d) carbon.
Figure 7.
EDX dot mapping analysis of the surface of the used catalyst: (a) aluminum; (b) oxygen; (c) nickel; (d) carbon.

Figure 8.
SEM images of: (a) the fresh catalyst; (b) the used catalyst.


Figure 9.
EDX linear scanning of the used catalyst.

Figure 10.
A schematic diagram of the experimental setup.


Table 1.
The concentration of products in the cooled gases.
| Reactor | Power, W | Temperature, °C | Concentration, % | |||
|---|---|---|---|---|---|---|
| H2 | CO | CO2 | CH4 | |||
| Catalytic | - | 400 | 60.1 | 24.2 | 3.5 | 0.3 |
| 450 | 60.6 | 20.3 | 6.8 | 0.3 | ||
| 500 | 61.0 | 18.5 | 8.0 | 0.4 | ||
| 550 | 61.4 | 15.3 | 10.4 | 0.4 | ||
| 600 | 60.8 | 18.9 | 7.7 | 0.4 | ||
| Plasma-catalytic | 15 | 400 | 59.2 | 25.5 | 2.7 | 0.6 |
| 450 | 60.2 | 21.2 | 6.1 | 0.5 | ||
| 500 | 60.5 | 19.3 | 7.5 | 0.6 | ||
| 550 | 60.9 | 17.1 | 9.1 | 0.6 | ||
| 600 | 60.4 | 18.8 | 7.8 | 0.6 | ||
| Plasma-catalytic | 30 | 400 | 59.4 | 22.1 | 5.4 | 1.1 |
| 450 | 59.8 | 21.6 | 5.8 | 0.9 | ||
| 500 | 60.0 | 19.5 | 7.4 | 1.1 | ||
| 550 | 60.1 | 18.2 | 8.3 | 1.2 | ||
| 600 | 59.0 | 21.9 | 5.4 | 1.3 | ||
| Plasma-catalytic | 46 | 400 | 59.4 | 22.1 | 5.4 | 1.1 |
| 450 | 59.7 | 21.6 | 5.8 | 0.9 | ||
| 500 | 60.0 | 19.5 | 7.3 | 1.1 | ||
| 550 | 60.0 | 18.1 | 8.3 | 1.2 | ||
| 600 | 58.9 | 21.9 | 5.4 | 1.3 | ||
Publisher’s Note: MDPI stays neutral with regard to jurisdictional claims in published maps and institutional affiliations. |
© 2021 by the authors. Licensee MDPI, Basel, Switzerland. This article is an open access article distributed under the terms and conditions of the Creative Commons Attribution (CC BY) license (https://creativecommons.org/licenses/by/4.0/).
Share and Cite
MDPI and ACS Style
Ulejczyk, B.; Nogal, Ł.; Jóźwik, P.; Młotek, M.; Krawczyk, K. Plasma-Catalytic Process of Hydrogen Production from Mixture of Methanol and Water. Catalysts 2021, 11, 864. https://0-doi-org.brum.beds.ac.uk/10.3390/catal11070864
AMA Style
Ulejczyk B, Nogal Ł, Jóźwik P, Młotek M, Krawczyk K. Plasma-Catalytic Process of Hydrogen Production from Mixture of Methanol and Water. Catalysts. 2021; 11(7):864. https://0-doi-org.brum.beds.ac.uk/10.3390/catal11070864
Chicago/Turabian StyleUlejczyk, Bogdan, Łukasz Nogal, Paweł Jóźwik, Michał Młotek, and Krzysztof Krawczyk. 2021. "Plasma-Catalytic Process of Hydrogen Production from Mixture of Methanol and Water" Catalysts 11, no. 7: 864. https://0-doi-org.brum.beds.ac.uk/10.3390/catal11070864
Note that from the first issue of 2016, this journal uses article numbers instead of page numbers. See further details here.