
Accelerating the Design of Photocatalytic Surfaces for Antimicrobial Application: Machine Learning Based on a Sparse Dataset

 ,
,  , ,
, , 
Abstract
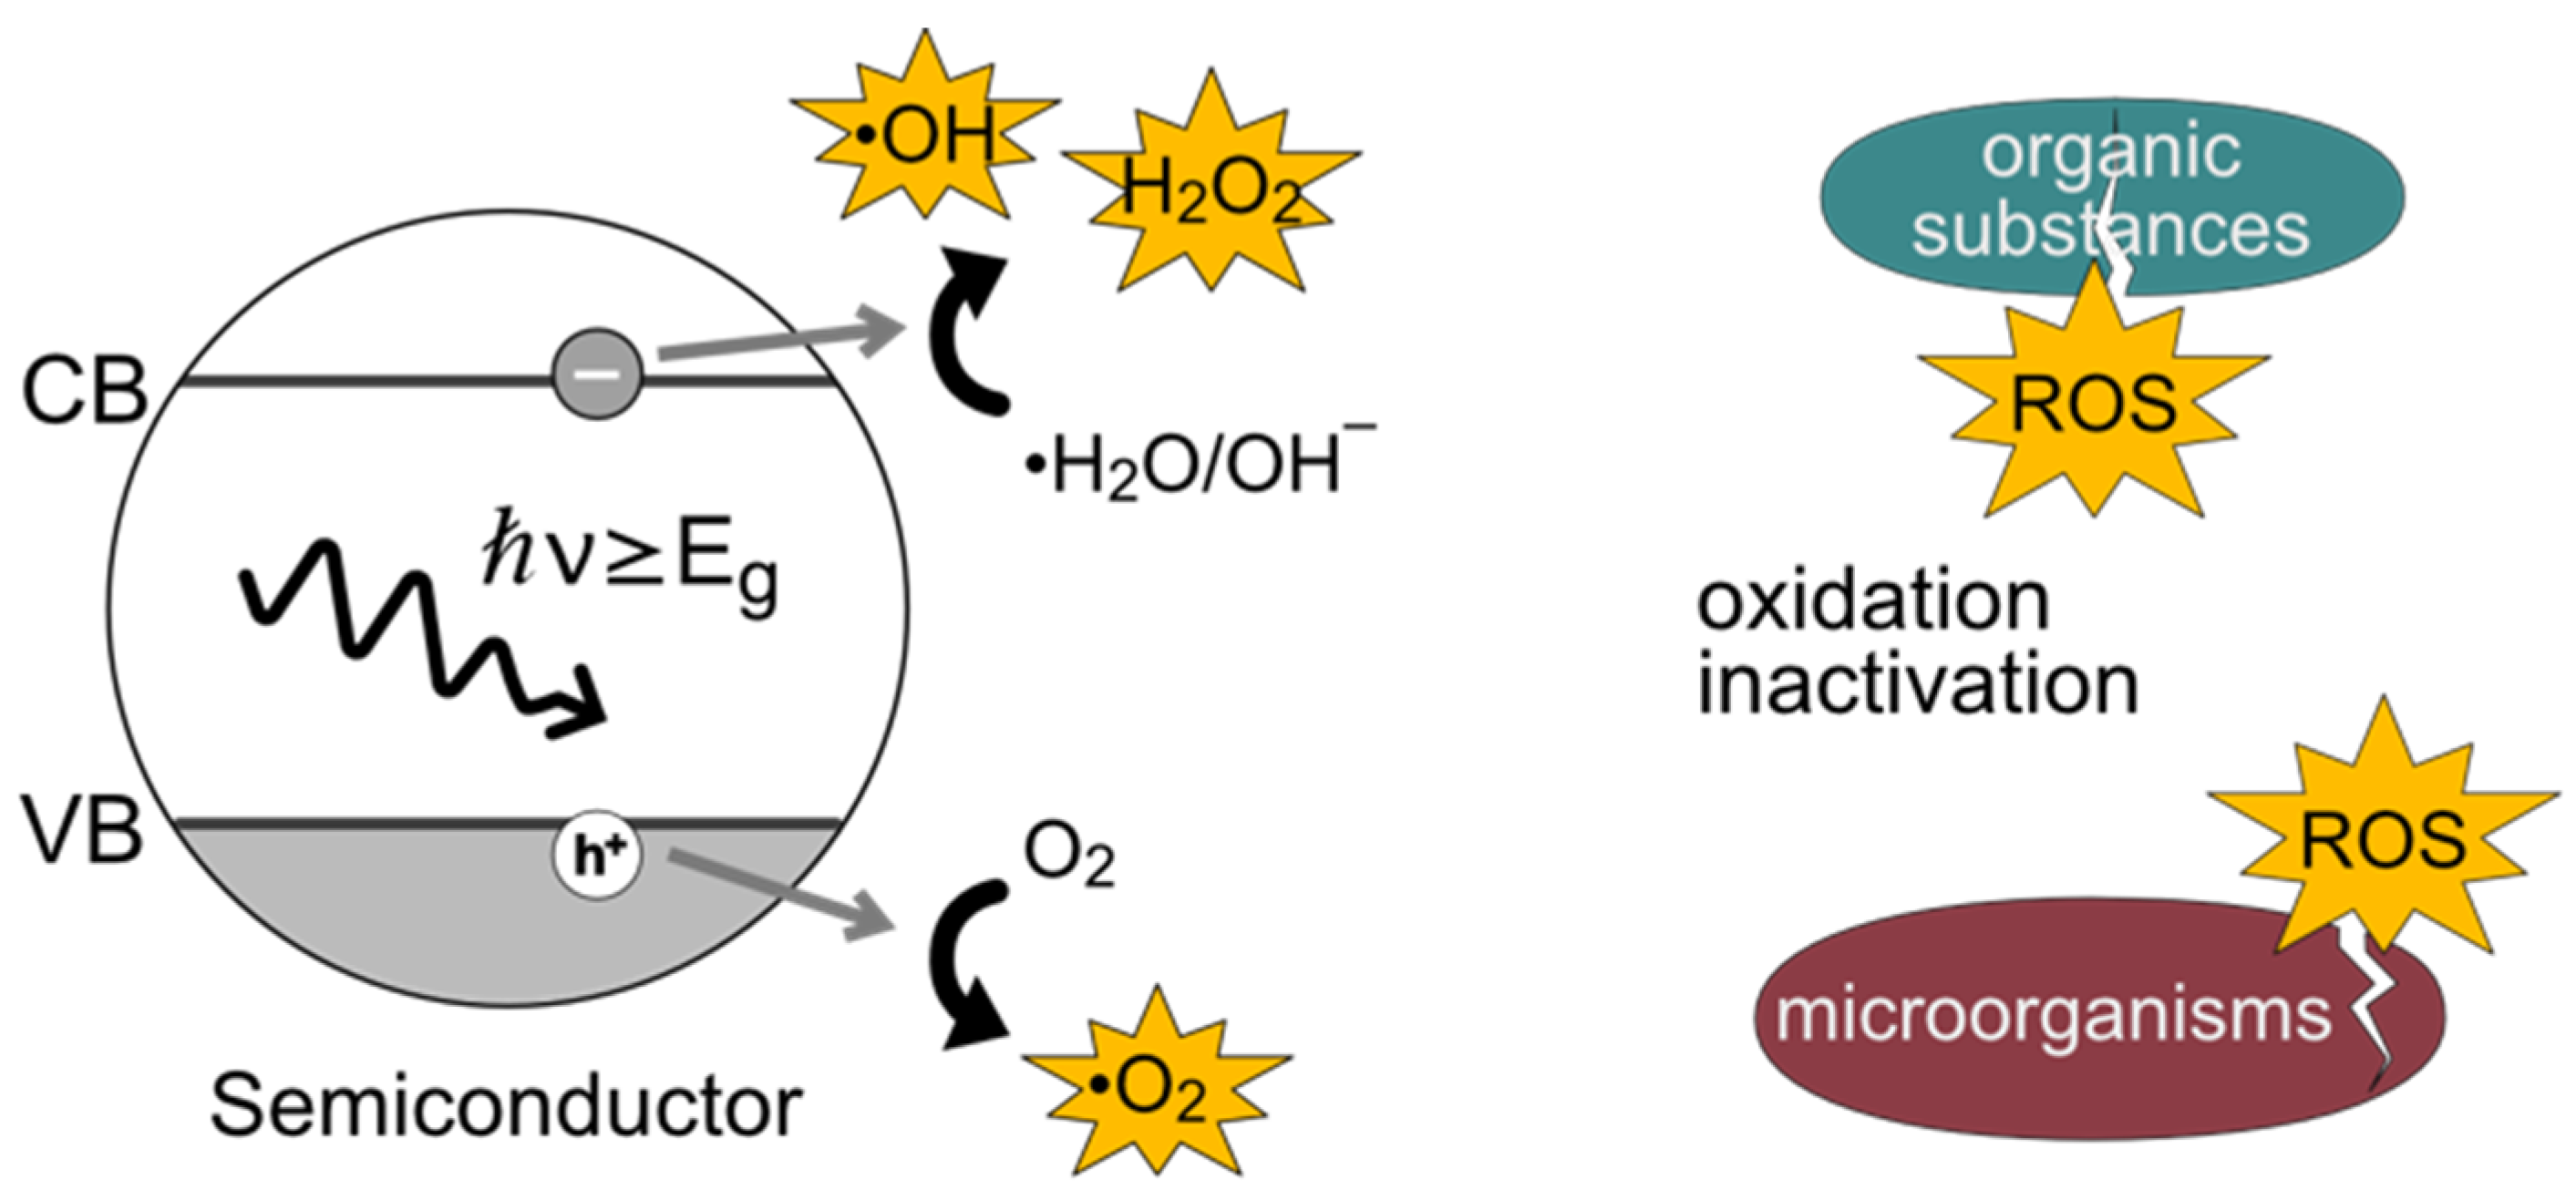
:1. Introduction
2. From-Experiment-to-Machine-Learning Scheme
2.1. Handling Small Dataset with Machine Learning
2.2. Dataset Preparation and ML Training
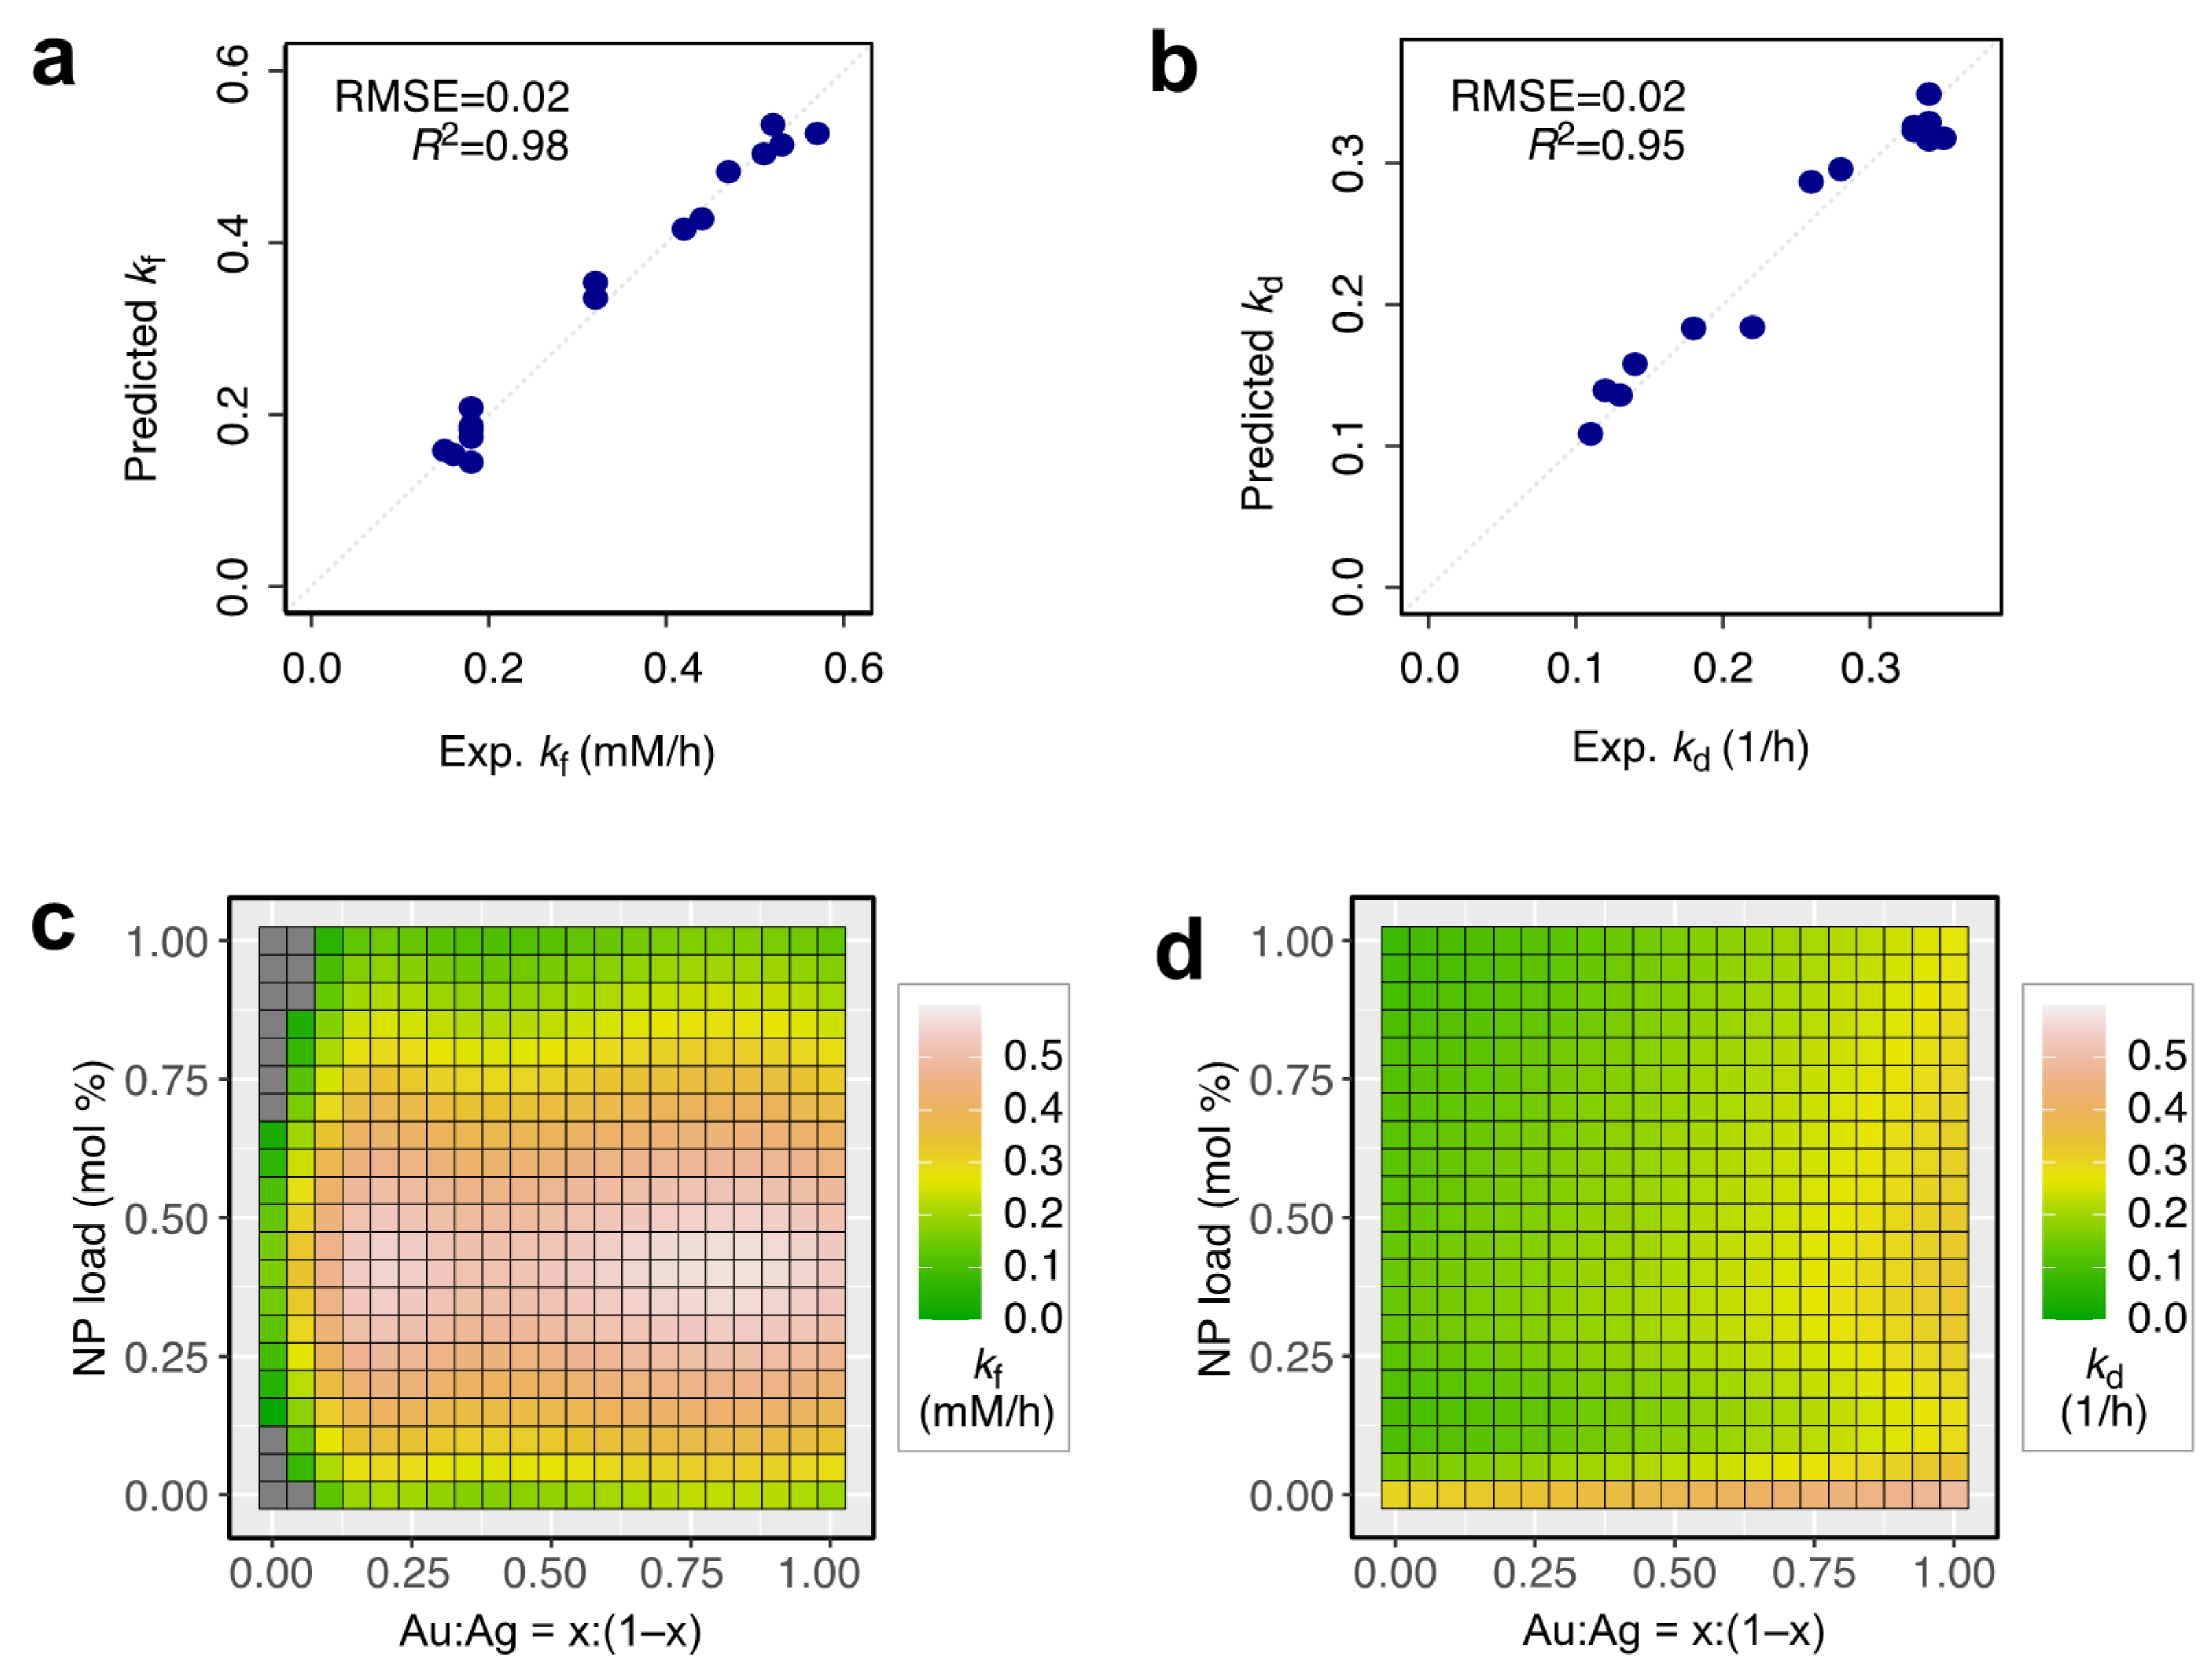
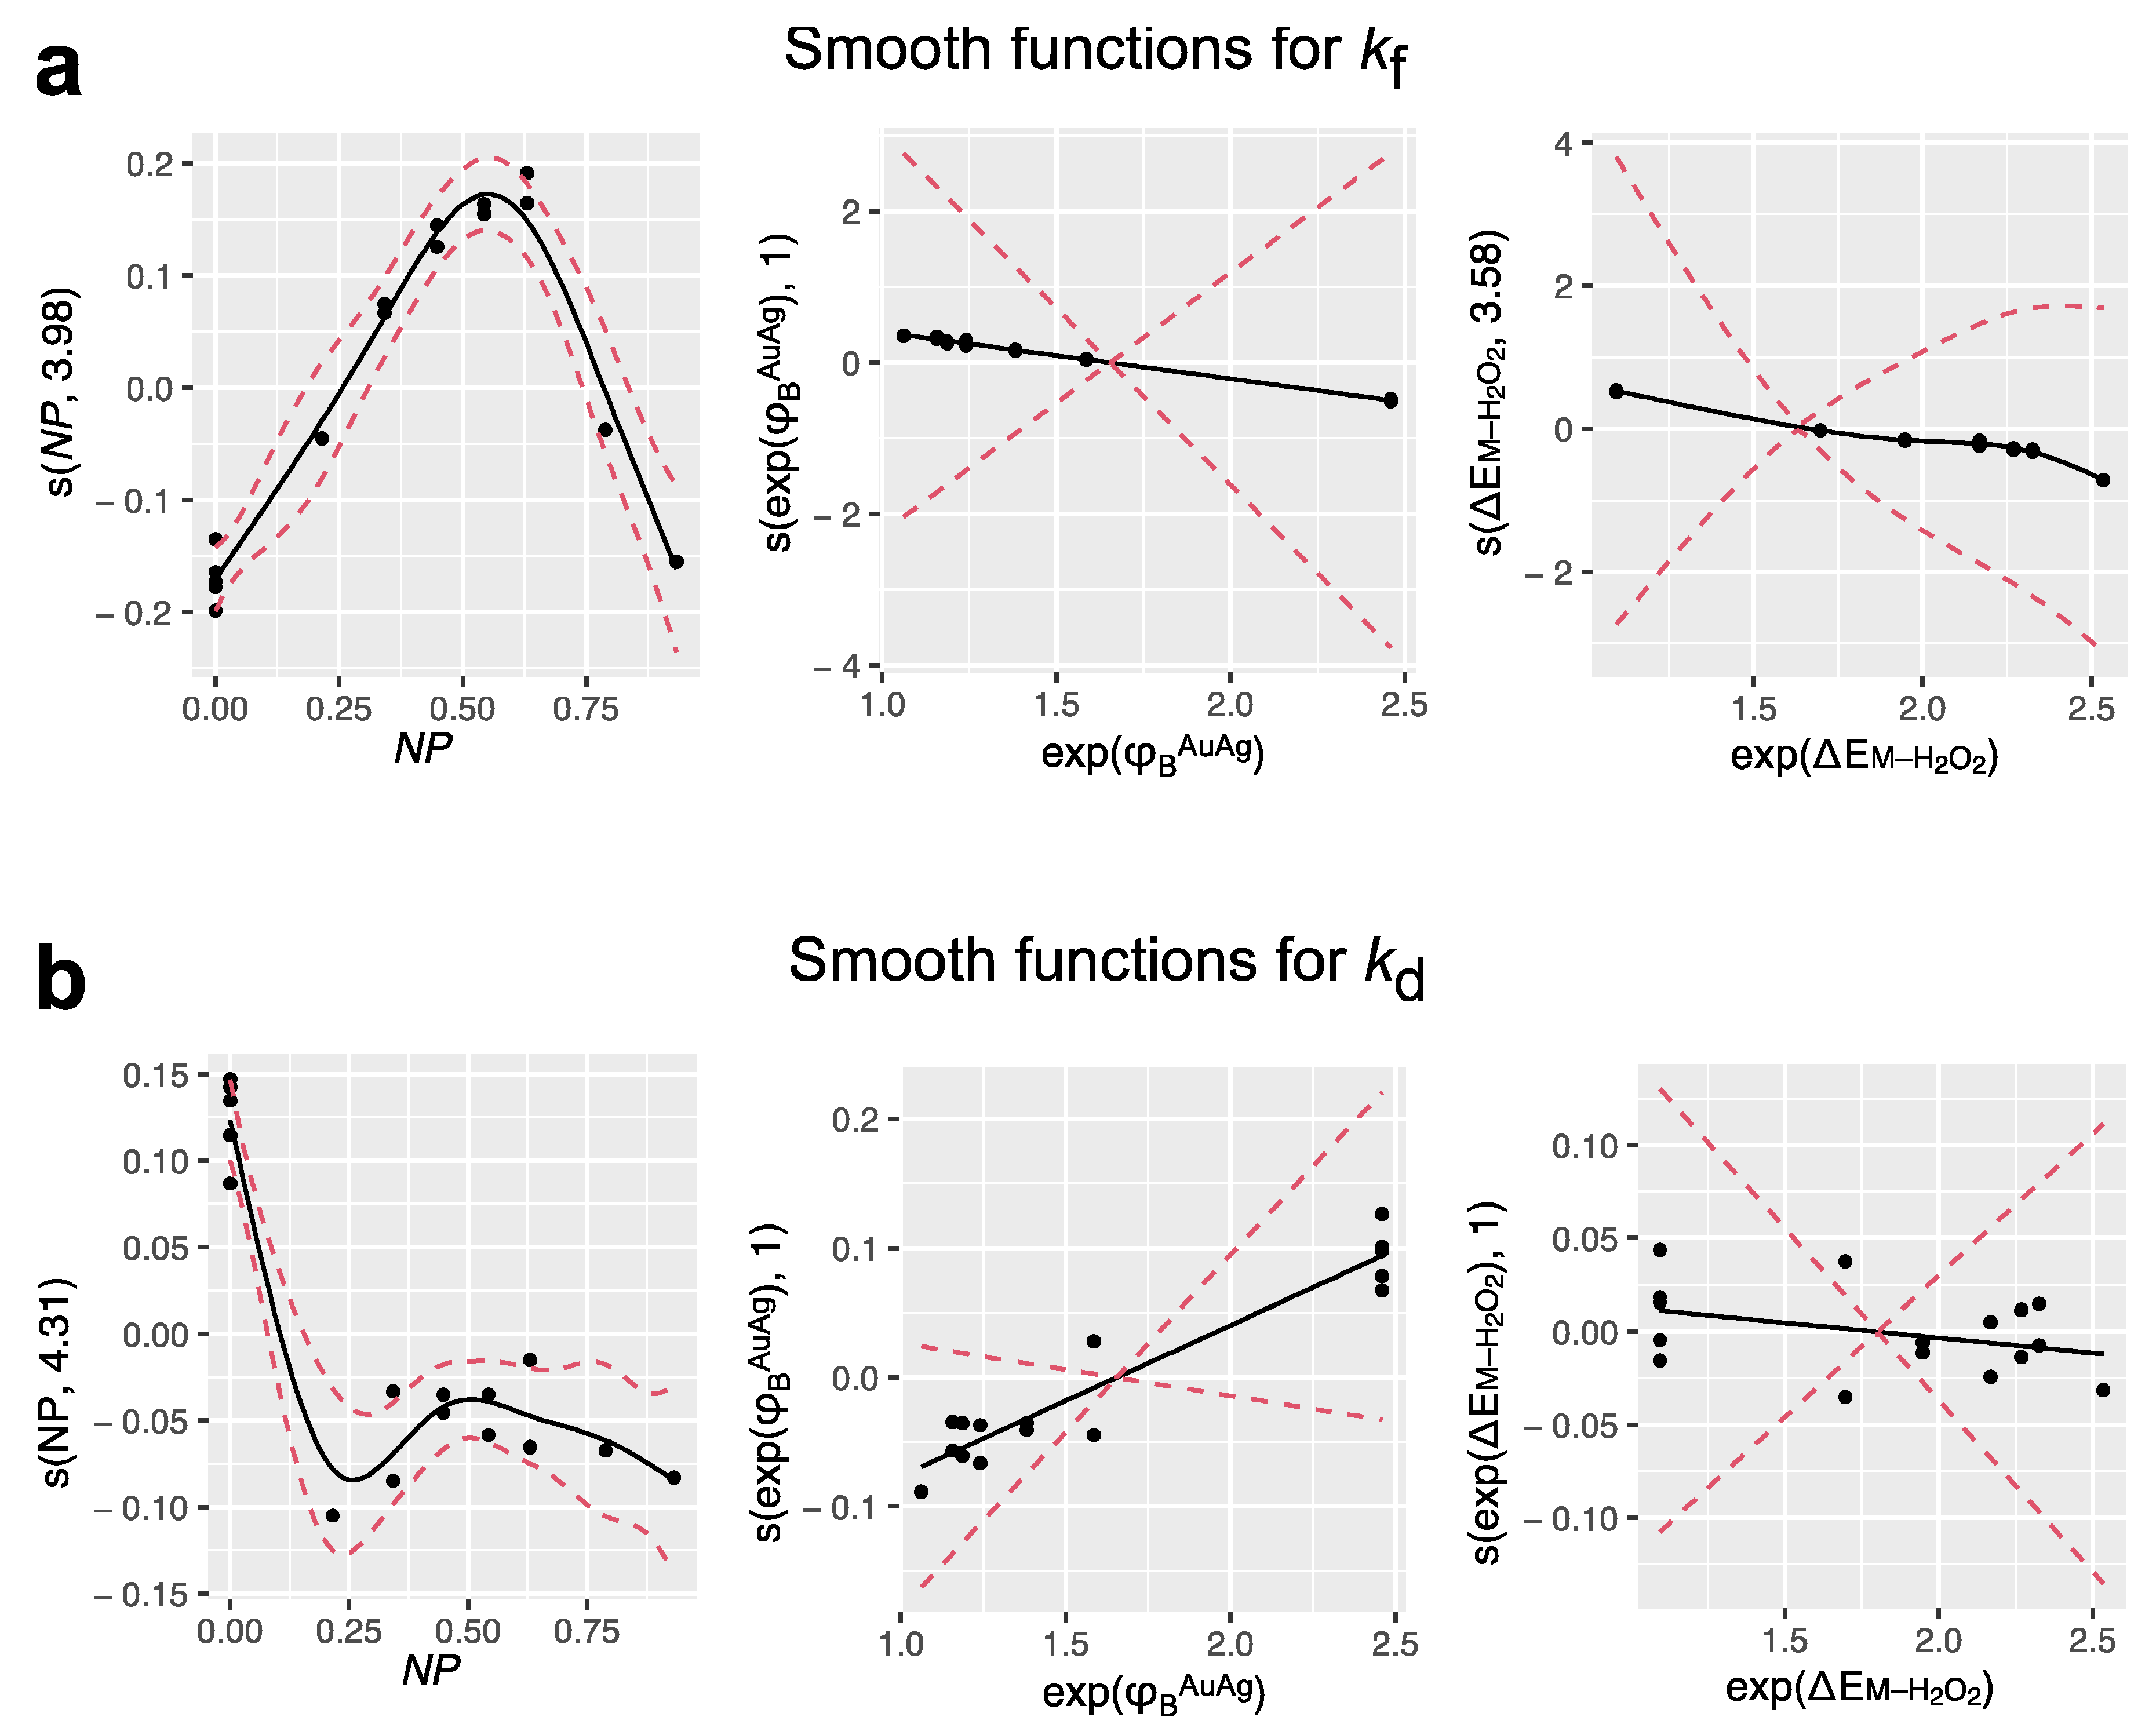
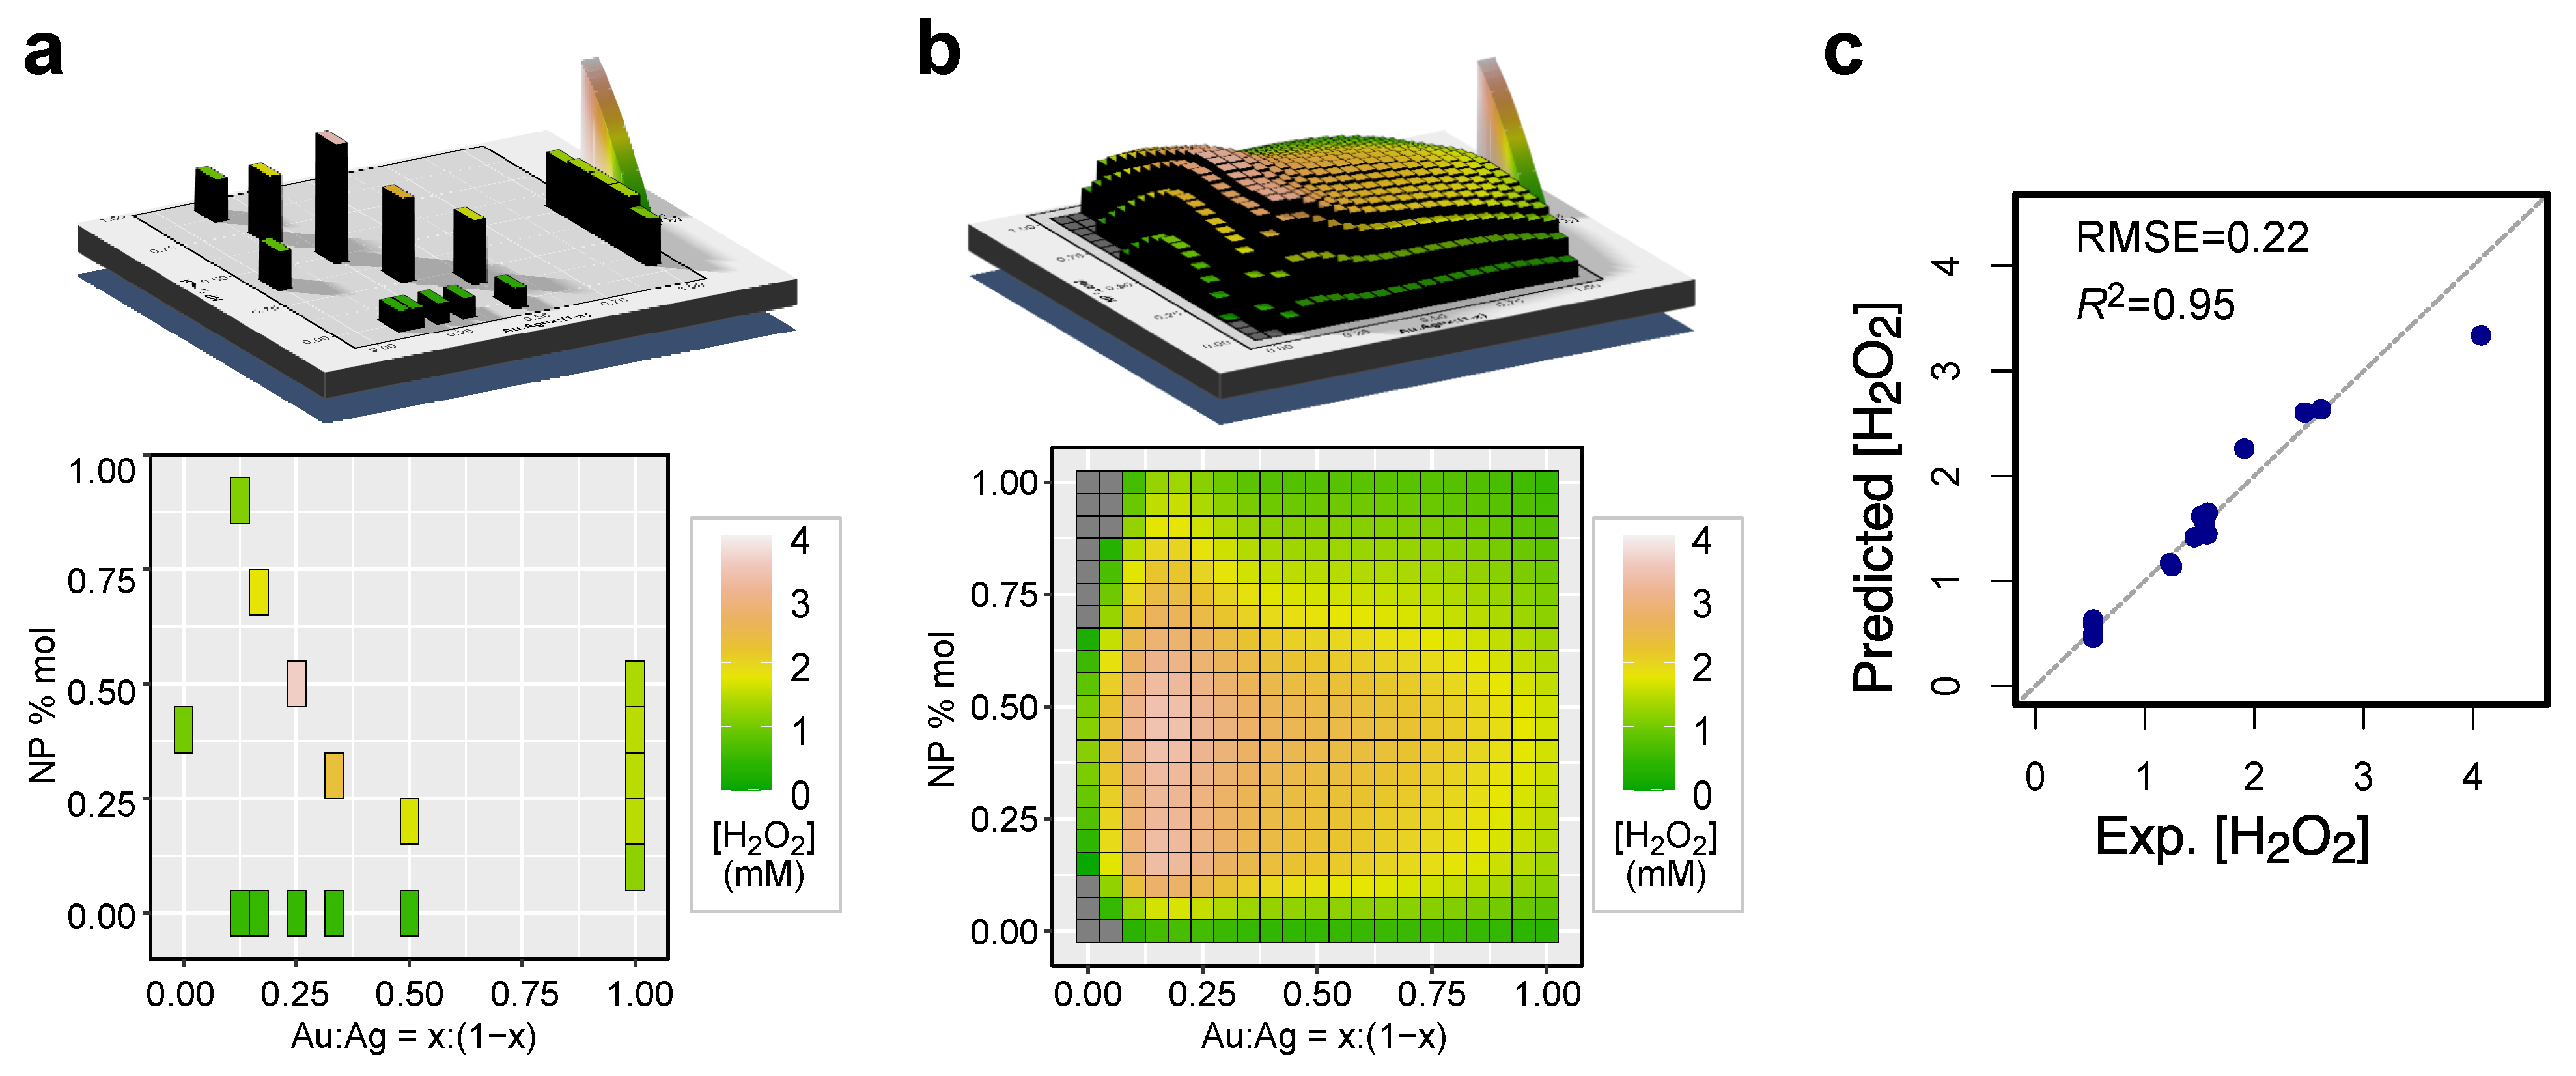
3. Results and Discussion
4. Conclusions
Supplementary Materials
Author Contributions
Funding
Data Availability Statement
Acknowledgments
Conflicts of Interest
References
- Modi, C.; Boehm, V.; Ferraro, S.; Stein, G.; Seljak, U. How deadly is COVID-19?: A rigorous analysis of excess mortality and age-dependent fatality rates in Italy. medRxiv 2020. [Google Scholar] [CrossRef] [Green Version]
- Smith, S.H.; Somsen, G.A.; Rijn, C.v.; Kooij, S.; Hoek, L.v.d.; Bem, R.A.; Bonn, D. Aerosol persistence in relation to possible transmission of SARS-CoV-2. Phys. Fluids 2020, 32, 107108. [Google Scholar] [CrossRef]
- Stadnytskyi, V.; Bax, C.E.; Bax, A.; Anfinrud, P. The airborne lifetime of small speech droplets and their potential importance in SARS-CoV-2 transmission. Proc. Natl. Acad. Sci. USA 2020, 117, 11875–11877. [Google Scholar] [CrossRef]
- Jayaweera, M.; Perera, H.; Gunawardana, B.; Manatunge, J. Transmission of COVID-19 virus by droplets and aerosols: A critical review on the unresolved dichotomy. Environ. Res. 2020, 188, 109819. [Google Scholar] [CrossRef]
- van Doremalen, N.; Bushmaker, T.; Morris, D.H.; Holbrook, M.G.; Gamble, A.; Williamson, B.N.; Tamin, A.; Harcourt, J.L.; Thornburg, N.J.; Gerber, S.I.; et al. Aerosol and Surface Stability of SARS-CoV-2 as Compared with SARS-CoV-1. N. Engl. J. Med. 2020, 382, 1564–1567. [Google Scholar] [CrossRef] [PubMed]
- Chin, A.W.H.; Chu, J.T.S.; Perera, M.R.A.; Hui, K.P.Y.; Yen, H.-L.; Chan, M.C.W.; Peiris, M.; Poon, L.L.M. Stability of SARS-CoV-2 in different environmental conditions. Lancet Microbe 2020, 1, e10. [Google Scholar] [CrossRef]
- Goldman, E. Exaggerated risk of transmission of COVID-19 by fomites. Lancet Infect. Dis. 2020, 20, 892–893. [Google Scholar] [CrossRef]
- Chia, P.Y.; Coleman, K.K.; Tan, Y.K.; Ong, S.W.X.; Gum, M.; Lau, S.K.; Lim, X.F.; Lim, A.S.; Sutjipto, S.; Lee, P.H.; et al. Detection of air and surface contamination by SARS-CoV-2 in hospital rooms of infected patients. Nat. Commun. 2020, 11, 2800. [Google Scholar] [CrossRef]
- Abidi, M.; Assadi, A.A.; Bouzaza, A.; Hajjaji, A.; Bessais, B.; Rtimi, S. Photocatalytic indoor/outdoor air treatment and bacterial inactivation on CuxO/TiO2 prepared by HiPIMS on polyester cloth under low intensity visible light. Appl. Catal. B 2019, 259, 118074. [Google Scholar] [CrossRef]
- Döhla, M.; Wilbring, G.; Schulte, B.; Kümmerer, B.M.; Diegmann, C.; Sib, E.; Richter, E.; Haag, A.; Engelhart, S.; Eis-Hübinger, A.M.; et al. SARS-CoV-2 in environmental samples of quarantined households. medRxiv 2020. [Google Scholar] [CrossRef]
- Ikonen, N.; Savolainen-Kopra, C.; Enstone, J.E.; Kulmala, I.; Pasanen, P.; Salmela, A.; Salo, S.; Nguyen-Van-Tam, J.S.; Ruutu, P. Deposition of respiratory virus pathogens on frequently touched surfaces at airports. BMC Infect. Dis. 2018, 18, 437. [Google Scholar] [CrossRef] [Green Version]
- Kampf, G.; Todt, D.; Pfaender, S.; Steinmann, E. Persistence of coronaviruses on inanimate surfaces and their inactivation with biocidal agents. J. Hosp. Infect. 2020, 104, 246–251. [Google Scholar] [CrossRef] [PubMed] [Green Version]
- Rudnick, S.N.; McDevitt, J.J.; First, M.W.; Spengler, J.D. Inactivating influenza viruses on surfaces using hydrogen peroxide or triethylene glycol at low vapor concentrations. Am. J. Infect. Control 2009, 37, 813–819. [Google Scholar] [CrossRef]
- Yu, J.; Wang, T.; Rtimi, S. Magnetically separable TiO2/FeOx/POM accelerating the photocatalytic removal of the emerging endocrine disruptor: 2,4-dichlorophenol. Appl. Catal. B 2019, 254, 66–75. [Google Scholar] [CrossRef]
- Foster, H.A.; Ditta, I.B.; Varghese, S.; Steele, A. Photocatalytic disinfection using titanium dioxide: Spectrum and mechanism of antimicrobial activity. Appl. Microbiol. Biotechnol. 2011, 90, 1847–1868. [Google Scholar] [CrossRef]
- Rtimi, S.; Sanjines, R.; Andrzejczuk, M.; Pulgarin, C.; Kulik, A.; Kiwi, J. Innovative transparent non-scattering TiO2 bactericide thin films inducing increased E. coli cell wall fluidity. Surf. Coat. Technol. 2014, 254, 333–343. [Google Scholar] [CrossRef]
- Djurišić, A.B.; Leung, Y.H.; Ng, A.M.; Xu, X.Y.; Lee, P.K.; Degger, N.; Wu, R.S. Toxicity of metal oxide nanoparticles: Mechanisms, characterization, and avoiding experimental artefacts. Small 2015, 11, 26–44. [Google Scholar] [CrossRef]
- Zhang, P.; Wang, T.; Gong, J. Current Mechanistic Understanding of Surface Reactions over Water-Splitting Photocatalysts. Chem 2018, 4, 223–245. [Google Scholar] [CrossRef] [Green Version]
- Yang, J.; Wang, D.; Han, H.; Li, C. Roles of cocatalysts in photocatalysis and photoelectrocatalysis. Acc. Chem. Res. 2013, 46, 1900–1909. [Google Scholar] [CrossRef] [PubMed]
- Bai, S.; Yin, W.; Wang, L.; Li, Z.; Xiong, Y. Surface and interface design in cocatalysts for photocatalytic water splitting and CO2 reduction. RSC Adv. 2016, 6, 57446–57463. [Google Scholar] [CrossRef]
- Verbruggen, S.W.; Keulemans, M.; Filippousi, M.; Flahaut, D.; Van Tendeloo, G.; Lacombe, S.; Martens, J.A.; Lenaerts, S. Plasmonic gold–silver alloy on TiO2 photocatalysts with tunable visible light activity. Appl. Catal. B 2014, 156–157, 116–121. [Google Scholar] [CrossRef]
- Sadrieyeh, S.; Malekfar, R. Photocatalytic performance of plasmonic Au/Ag-TiO2 aerogel nanocomposites. J. Non-Cryst. Solids 2018, 489, 33–39. [Google Scholar] [CrossRef]
- Tamimi, A.H.; Carlino, S.; Gerba, C.P. Long-term efficacy of a self-disinfecting coating in an intensive care unit. Am. J. Infect. Control 2014, 42, 1178–1181. [Google Scholar] [CrossRef]
- Scully, J.R. The COVID-19 Pandemic, Part 1: Can Antimicrobial Copper-Based Alloys Help Suppress Infectious Transmission of Viruses Originating from Human Contact with High-Touch Surfaces? Corrosion 2020, 76, 523–527. [Google Scholar] [CrossRef]
- Rtimi, S.; Dionysiou, D.D.; Pillai, S.C.; Kiwi, J. Advances in catalytic/photocatalytic bacterial inactivation by nano Ag and Cu coated surfaces and medical devices. Appl. Catal. B 2019, 240, 291–318. [Google Scholar] [CrossRef]
- Villapún, V.M.; Dover, L.G.; Cross, A.; González, S. Antibacterial Metallic Touch Surfaces. Materials 2016, 9, 736. [Google Scholar] [CrossRef]
- Weiss, C.; Carriere, M.; Fusco, L.; Capua, I.; Regla-Nava, J.A.; Pasquali, M.; Scott, J.A.; Vitale, F.; Unal, M.A.; Mattevi, C.; et al. Toward Nanotechnology-Enabled Approaches against the COVID-19 Pandemic. ACS Nano 2020, 14, 6383–6406. [Google Scholar] [CrossRef] [PubMed]
- Kumar, G.; Bossert, H.; McDonald, D.; Chatzidimitriou, A.; Ardagh, M.A.; Pang, Y.; Lee, C.; Tsapatsis, M.; Abdelrahman, O.A.; Dauenhauer, P.J. Catalysis-in-a-Box: Robotic Screening of Catalytic Materials in the Time of COVID-19 and Beyond. Matter 2020, 3, 805–823. [Google Scholar] [CrossRef] [PubMed]
- Vanpoucke, D.E.P.; Knippenberg, O.S.J.V.; Hermans, K.; Bernaerts, K.V.; Mehrkanoon, S. Small data materials design with machine learning: When the average model knows best. J. Appl. Phys. 2020, 128, 054901. [Google Scholar] [CrossRef]
- Hastie, T.J.; Tibshirani, R.J. Generalized Additive Models; CRC Press: Boca Raton, FL, USA, 1990; Volume 43. [Google Scholar]
- Tsukamoto, D.; Shiro, A.; Shiraishi, Y.; Sugano, Y.; Ichikawa, S.; Tanaka, S.; Hirai, T. Photocatalytic H2O2 Production from Ethanol/O2 System Using TiO2 Loaded with Au–Ag Bimetallic Alloy Nanoparticles. ACS Catal. 2012, 2, 599–603. [Google Scholar] [CrossRef]
- Thomas, N.; Dionysiou, D.D.; Pillai, S.C. Heterogeneous Fenton catalysts: A review of recent advances. J. Hazard. Mater. 2021, 404, 124082. [Google Scholar] [CrossRef]
- Gomathi Devi, L.; Kavitha, R. A review on plasmonic metal TiO2 composite for generation, trapping, storing and dynamic vectorial transfer of photogenerated electrons across the Schottky junction in a photocatalytic system. Appl. Surf. Sci. 2016, 360, 601–622. [Google Scholar] [CrossRef]
- Ma, Y.; Wang, X.; Jia, Y.; Chen, X.; Han, H.; Li, C. Titanium dioxide-based nanomaterials for photocatalytic fuel generations. Chem. Rev. 2014, 114, 9987–10043. [Google Scholar] [CrossRef] [PubMed]
- Bai, S.; Jiang, J.; Zhang, Q.; Xiong, Y. Steering charge kinetics in photocatalysis: Intersection of materials syntheses, characterization techniques and theoretical simulations. Chem. Soc. Rev. 2015, 44, 2893–2939. [Google Scholar] [CrossRef]
- Wang, Z.; Xue, N.; Chen, J. Semiconductor–Cocatalyst Interfacial Electron Transfer Dominates Photocatalytic Reaction. J. Phys. Chem. C 2019, 123, 24404–24408. [Google Scholar] [CrossRef]
- Ni, M.; Leung, M.; Leung, D.; Sumathy, K. Theoretical modeling of TiO2/TCO interfacial effect on dye-sensitized solar cell performance. Sol. Energy Mater. Sol. Cells 2006, 90, 2000–2009. [Google Scholar] [CrossRef]
- Hou, H.; Zeng, X.; Zhang, X. Production of Hydrogen Peroxide by Photocatalytic Processes. Angew. Chem. Int. Ed. Engl. 2019, 59, 17356–17376. [Google Scholar] [CrossRef]
- Shiraishi, Y.; Kanazawa, S.; Tsukamoto, D.; Shiro, A.; Sugano, Y.; Hirai, T. Selective Hydrogen Peroxide Formation by Titanium Dioxide Photocatalysis with Benzylic Alcohols and Molecular Oxygen in Water. ACS Catal. 2013, 3, 2222–2227. [Google Scholar] [CrossRef]
- Yang, X.; Wang, Y.; Zhang, L.; Fu, H.; He, P.; Han, D.; Lawson, T.; An, X. The Use of Tunable Optical Absorption Plasmonic Au and Ag Decorated TiO2 Structures as Efficient Visible Light Photocatalysts. Catalysts 2020, 10, 139. [Google Scholar] [CrossRef] [Green Version]
- Xiong, X.; Wang, Z.; Zhang, Y.; Li, Z.; Shi, R.; Zhang, T. Wettability controlled photocatalytic reactive oxygen generation and Klebsiella pneumoniae inactivation over triphase systems. Appl. Catal. B 2020, 264, 118518. [Google Scholar] [CrossRef]
- Weber, D.J.; Rutala, W.A.; Anderson, D.J.; Chen, L.F.; Sickbert-Bennett, E.E.; Boyce, J.M. Effectiveness of ultraviolet devices and hydrogen peroxide systems for terminal room decontamination: Focus on clinical trials. Am. J. Infect. Control 2016, 44 (Suppl. 5), 77. [Google Scholar] [CrossRef]
- Zhang, L.; Moralejo, C.; Anderson, W.A. A review of the influence of humidity on photocatalytic decomposition of gaseous pollutants on TiO2-based catalysts. Can. J. Chem. Eng. 2020, 98, 263–273. [Google Scholar] [CrossRef] [Green Version]
- Joonaki, E.; Hassanpouryouzband, A.; Heldt, C.L.; Areo, O. Surface Chemistry Can Unlock Drivers of Surface Stability of SARS-CoV-2 in a Variety of Environmental Conditions. Chem 2020, 6, 2135–2146. [Google Scholar] [CrossRef] [PubMed]
- NIOSH Pocket Guide to Chemical Hazards. Available online: https://www.cdc.gov/niosh/npg/npgd0335.html (accessed on 22 July 2021).
- Tsukamoto, D.; Shiraishi, Y.; Sugano, Y.; Ichikawa, S.; Tanaka, S.; Hirai, T. Gold Nanoparticles Located at the Interface of Anatase/Rutile TiO2 Particles as Active Plasmonic Photocatalysts for Aerobic Oxidation. J. Am. Chem. Soc. 2012, 134, 6309–6315. [Google Scholar] [CrossRef] [PubMed]


Publisher’s Note: MDPI stays neutral with regard to jurisdictional claims in published maps and institutional affiliations. |
© 2021 by the authors. Licensee MDPI, Basel, Switzerland. This article is an open access article distributed under the terms and conditions of the Creative Commons Attribution (CC BY) license (https://creativecommons.org/licenses/by/4.0/).
Share and Cite
Park, H.; Bentria, E.T.; Rtimi, S.; Arredouani, A.; Bensmail, H.; El-Mellouhi, F. Accelerating the Design of Photocatalytic Surfaces for Antimicrobial Application: Machine Learning Based on a Sparse Dataset. Catalysts 2021, 11, 1001. https://0-doi-org.brum.beds.ac.uk/10.3390/catal11081001
Park H, Bentria ET, Rtimi S, Arredouani A, Bensmail H, El-Mellouhi F. Accelerating the Design of Photocatalytic Surfaces for Antimicrobial Application: Machine Learning Based on a Sparse Dataset. Catalysts. 2021; 11(8):1001. https://0-doi-org.brum.beds.ac.uk/10.3390/catal11081001
Chicago/Turabian StylePark, Heesoo, El Tayeb Bentria, Sami Rtimi, Abdelilah Arredouani, Halima Bensmail, and Fedwa El-Mellouhi. 2021. "Accelerating the Design of Photocatalytic Surfaces for Antimicrobial Application: Machine Learning Based on a Sparse Dataset" Catalysts 11, no. 8: 1001. https://0-doi-org.brum.beds.ac.uk/10.3390/catal11081001