
Photo-Fenton-Like Treatment of Municipal Wastewater
by
 , ,
, ,
Yerkanat N. Kanafin
1 ,
,
Ardak Makhatova
1,
Vasilios Zarikas
2,
Elizabeth Arkhangelsky
3 and
Stavros G. Poulopoulos
1,* 1
Chemical and Materials Engineering Department, School of Engineering and Digital Sciences, Environmental Science & Technology Group (ESTg), The Environment & Resource Efficiency Cluster (EREC), Nazarbayev University, Nur-Sultan 010000, Kazakhstan
2
Mechanical and Aerospace Engineering Department, School of Engineering and Digital Sciences, Nazarbayev University, Nur-Sultan 010000, Kazakhstan
3
Civil and Environmental Engineering Department, School of Engineering and Digital Sciences, Environmental Science & Technology Group (ESTg), The Environment & Resource Efficiency Cluster (EREC), Nazarbayev University, Nur-Sultan 010000, Kazakhstan
*
Author to whom correspondence should be addressed.
Catalysts 2021, 11(10), 1206; https://0-doi-org.brum.beds.ac.uk/10.3390/catal11101206
Submission received: 13 August 2021
/
Revised: 29 September 2021
/
Accepted: 1 October 2021
/
Published: 8 October 2021
(This article belongs to the Special Issue New Trends in Photocatalysis: Photocatalytic Materials and Applications)
Abstract
:In this work, the photochemical treatment of a real municipal wastewater using a persulfate-driven photo-Fenton-like process was studied. The wastewater treatment efficiency was evaluated in terms of total carbon (TC), total organic carbon (TOC) and total nitrogen (TN) removal. Response surface methodology (RSM) in conjunction Box-Behnken design (BBD) and multilayer artificial neural network (ANN) have been utilized for the optimization of the treatment process. The effects of four independent factors such as reaction time, pH, K2S2O8 concentration and K2S2O8/Fe2+ molar ratio on the TC, TOC and TN removal have been investigated. The process significant factors have been determined implementing Analysis of Variance (ANOVA). Both RSM and ANN accurately found the optimum conditions for the maximum removal of TOC (100% and 98.7%, theoretically), which resulted in complete mineralization of TOC at the reaction time of 106.06 min, pH of 7.7, persulfate concentration of 30 mM and K2S2O8/Fe2+ molar ratio of 7.5 for RSM and at the reaction time of 104.93 min, pH of 7.7, persulfate concentration of 30 mM and K2S2O8/Fe2+ molar ratio of 9.57 for ANN. On the contrary, the attempts to find the optimal conditions for the maximum TC and TN removal using statistical, and neural network models were not successful.
1. Introduction
Municipal wastewater (MWW) is the second limitless source of water [1]. MWW mostly contains water (99.9%) with relatively small concentrations of suspended and dissolved organic and inorganic solids [2]. MWWs usually contain around 5% to 10% settleable suspended solids. They also contain approximately 1000 parts per million of dissolved and colloidal solids, most of which are organic in nature and usually difficult to remove with biological treatment [3]. The following organic compounds are present in MWW: carbohydrates, synthetic detergents, fats, proteins, lignin, soaps and their decomposition products, various natural and synthetic organic chemicals from the process industries [2]. Some of these compounds pose serious problems in biological treatment systems due to their resistance to biodegradation and/or toxic effects on microbial processes [4,5]. Municipal wastewater also comprises different inorganic substances from domestic and industrial sources, including several potentially toxic elements such as arsenic, cadmium, lead, mercury, etc. In addition, pathogenic viruses, bacteria, protozoa and helminths may be present in raw municipal wastewater and survive in the environment for long periods [6].
Recently, the effluents from municipal wastewater treatment plants (WWTPs) have been identified as a major source of emerging micropollutants, such as hormones, pharmaceuticals, and personal care products [7]. Despite their low concentration (from a few ng/L to several μg/L), they are resistant to biodegradation, since conventional WWTPs cannot provide a high rate of removal of micropollutants [8]. Strategies for removing these compounds from MWW are currently being discussed [9].
Advanced Oxidation Processes (AOPs) have been widely applied for the treatment of municipal wastewater [4]. AOPs using highly reactive hydroxyl radical (OH∙) as the main oxidant were first proposed for the treatment of drinking water in the 1980s. Then AOPs were widely used to treat various types of wastewater since strong oxidants can easily degrade persistent organic contaminants and remove inorganic pollutants from wastewater [10].
In recent years, a new type of oxidizing agent has attracted the interest of researchers. S2O82− is a strong oxidizing agent with a standard oxidation potential (Eo) of 2.01 V [11]. It can form more powerful sulfate radicals (SO4••−, Eo = 2.6 V) after activation by heat, ultraviolet (UV) irradiation (Equation (1)), transition metals (Equation (2)), or elevated pH, and further initiate sulfate radical-based AOPs [12,13]. The mechanisms of activation of persulfate with elevated pH are still unclear [14]. The temperature for the thermal activation of persulfate ranges from 35 to 130 °C [14].
As seen in Equations (1) and (2), the metal activation method gives only a 50% yield of sulfate radicals, which is obtained by heating or UV-activated persulfate method with the same molar concentration of persulfate. Consequently, the metal activation method is theoretically ineffective. The most commonly used metals include ferrous (Fe (II)) and ferric (Fe (III)) ions [15].
Sulfate radicals, like hydroxyl radicals, are highly reactive species with a short lifetime, although both radicals have different reaction patterns. Hydroxyl radicals have a tendency to attach to C=C bonds or remove H from C–H bonds during their reactions with organic substances [16], while sulfate radicals tend to remove electrons from organic molecules, which are consequently converted into organic radical cations [10]. In addition, hydroxyl radicals can be generated from sulfate radicals via Equations (3)–(5) [17,18,19].
Moreover, Equation (5) demonstrates that more hydroxyl radicals can be produced from sulfate radicals at alkaline conditions [10]. Unlike hydrogen peroxide (H2O2), persulfate can also oxidize some organic substances directly, without the participation of radical species [20].
Potassium persulfate (KPS) (K2S2O8) has good stability at room temperature, it is inexpensive, and solid at ambient temperatures, making it easy to store and transport [21]. The technical benefits of persulfate-AOP over H2O2-AOP include: (i) lower storage and transportation costs as a result of the availability of persulfate salts, (ii) higher achievable yields of radical formation, (iii) less dependence of the treatment efficiency on operating parameters, such as pH, initial peroxide loading, background constituents, and (iv) a wider range of available persulfate activation methods [20].
Velo-Gala et al. [19] studied the effectiveness of oxidation processes based on the application of UV radiation, UV/H2O2, and UV/K2S2O8, for the degradation of sodium diatrizoate in the aqueous medium. The UV/K2S2O8 process was found to be more efficient than the UV/H2O2 system, with higher rate constants [19].
Yang et al. [22] investigated sulfate-based oxidation technologies for the defluorination of aqueous perfluorooctanesulfonate (PFOS). The defluorination efficiency of PFOS with different treatments corresponded to the following order: HT (hydrothermal)/K2S2O8 > UV/K2S2O8 > Fe2+/K2S2O8 > US (ultrasound)/K2S2O8. The increase in the persulfate amount had a positive effect on the defluorination of PFOS [22].
Dbira et al. [23] found that the photo-Fenton process was more efficient for the tannic acid degradation in aqueous solution than the UV/persulfate system, concluding that hydroxyl radicals were stronger oxidizing agents than sulfate radicals.
Since iron-based heterogeneous catalysts activated with persulfate have received a lot of attention as a potentially advanced and sustainable water treatment system, Pervez et al. [24] employed a novel Fe3O4 impregnated graphene oxide (Fe3O4@GO)-activated persulfate (Fe3O4@GO+K2S2O8) system for the efficient degradation of dye pollutants in real wastewater treatment.
Persulfate-based oxidation technologies were recently classified as realistic for full-scale application based on energy consumption values [25]. However, most of works have been conducted using synthetic wastewater or aqueous solutions [19,22,23], although real wastewaters include several inorganic (chlorides, bicarbonates, carbonates) and organic constituents that may have a scavenging effect on oxidative radicals [26]. Therefore, it is essential to examine the efficiency of the process in the case of real wastewaters.
The present study focused on the effectiveness of AOPs based on the application of iron salts, potassium persulfate, and UV radiation to treat real municipal wastewater. There are no published studies applying Fe2+/S2O82−/UV process to treat wastewaters. Response surface methodology (RSM) and artificial neural network (ANN) were used to optimize the photo-Fenton-like treatment of the MWW.
2. Results and Discussion
2.1. Regression Model Based on ANOVA
Table 1 shows the experimental design (Box-Behnken design) obtained from the software and the results of the experiments.
The outcome of the experiments was predicted using a second-order quadratic polynomial model [27], which was based on the relation between responses and variables (Equation (6)):
where Y is the outcome variable (TC, TOC, and TN removal, %); is a constant coefficient; is a linear regression coefficient; is a quadratic regression coefficient; is an interactive regression coefficient; and are the coded variables; is the random error.
The BBD models for TC, TC, and TN removals obtained from Design-Expert software are presented in the following Equations (7)–(9):
where A, B, C, and D represent reaction time (min), pH, K2S2O8 concentration (mM), and K2S2O8/Fe2+ molar ratio, respectively. According to the analysis of variance (ANOVA) for the response surface model, B, A2, BC terms for TC removal, and A, B, C2, AB, BC, CD terms for TOC removal were significant in equations (Figure S1). No terms for TN removal were considered significant due to the lack of fit of the model.
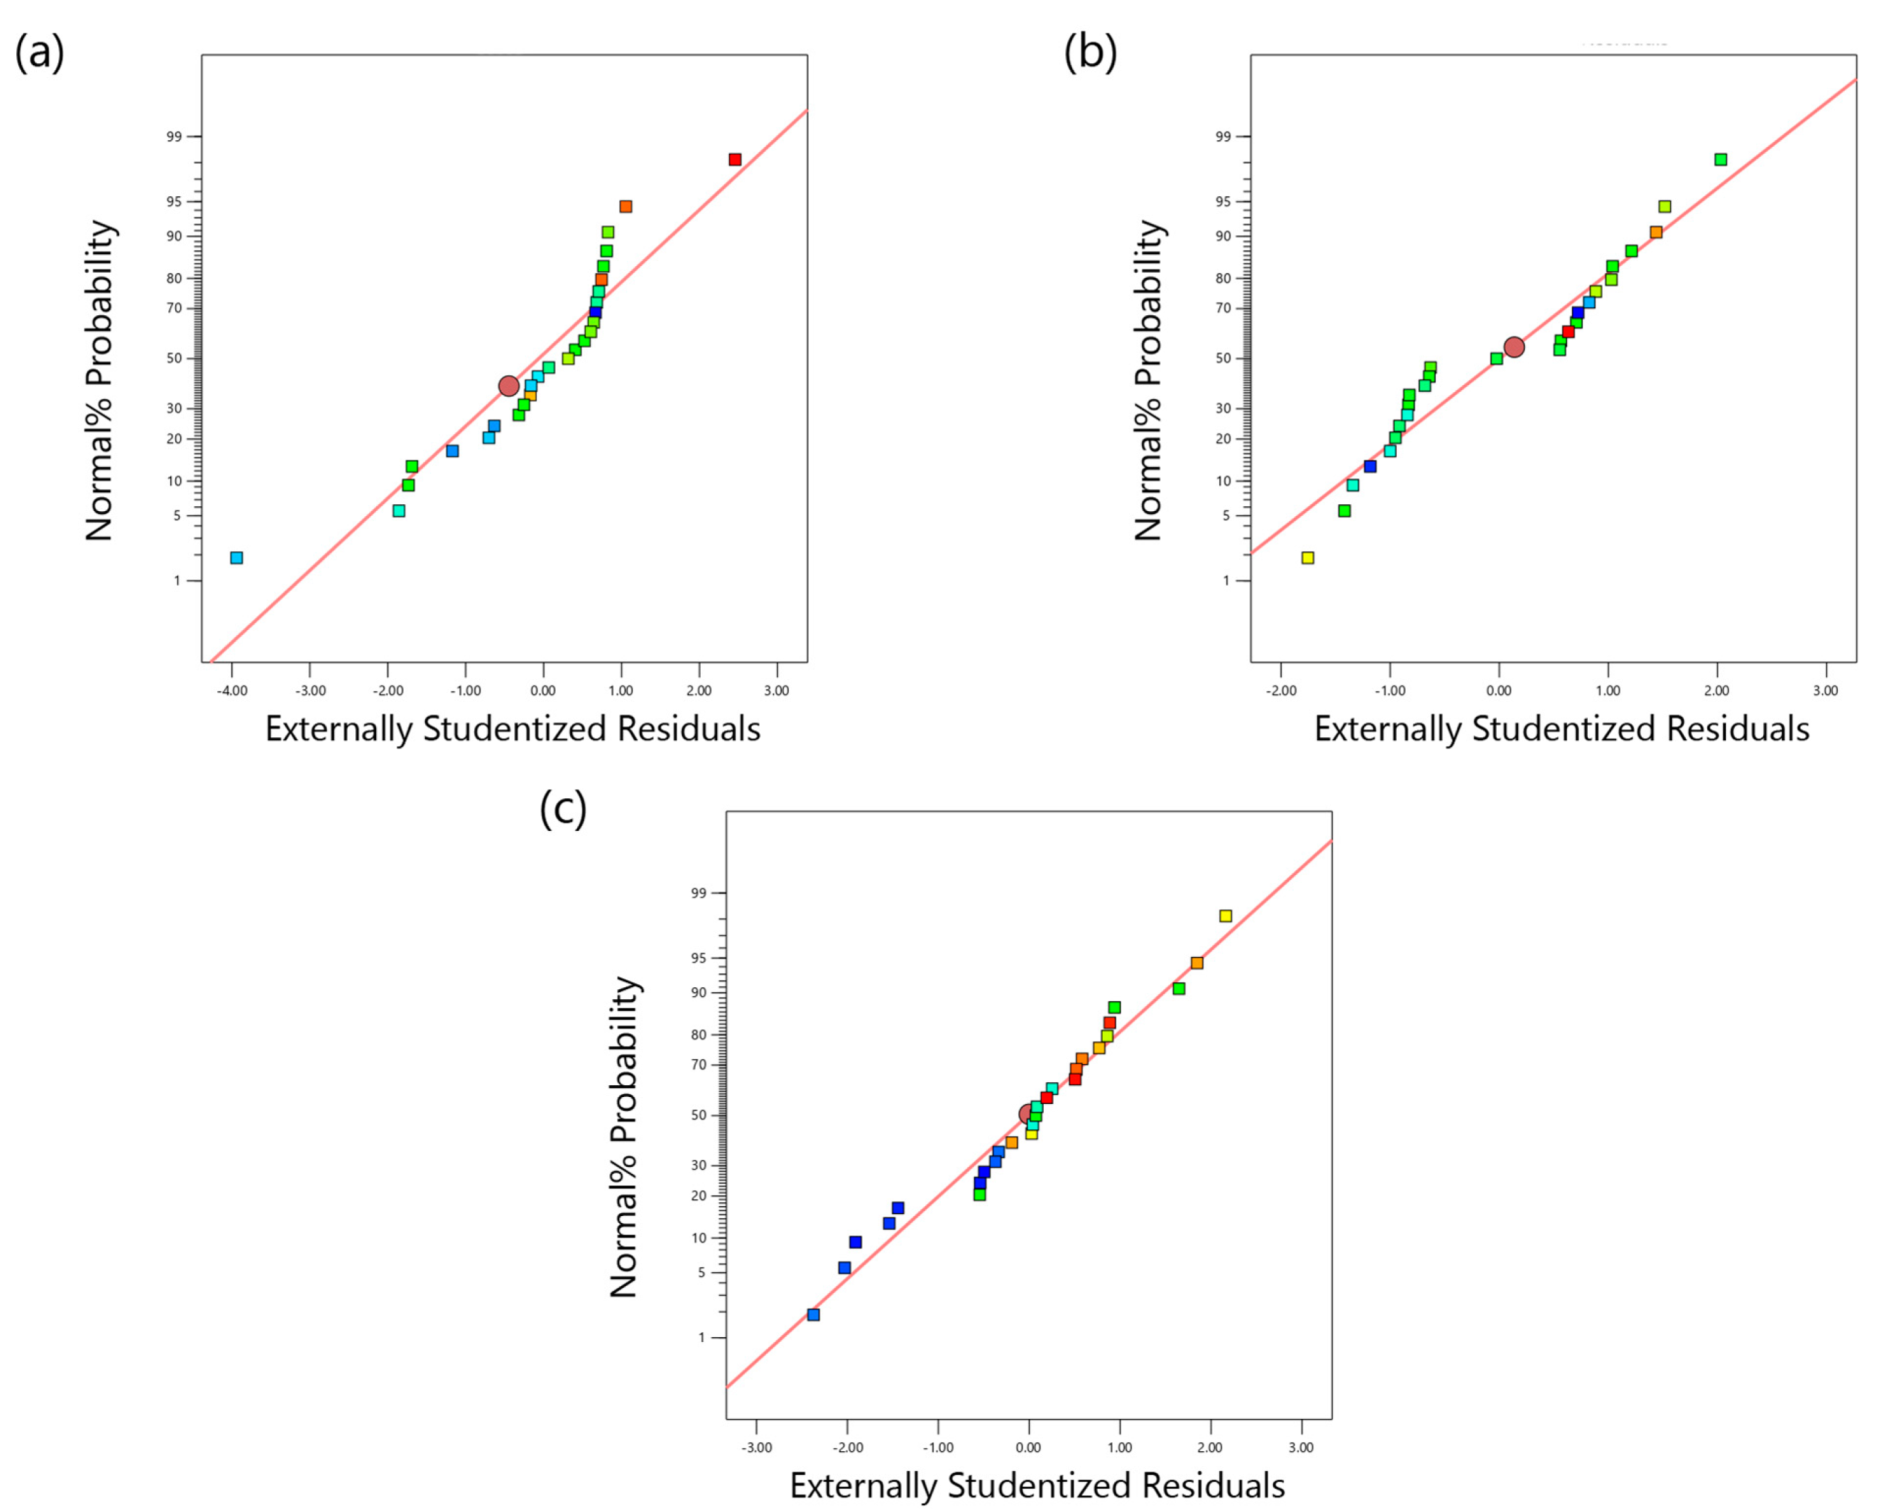
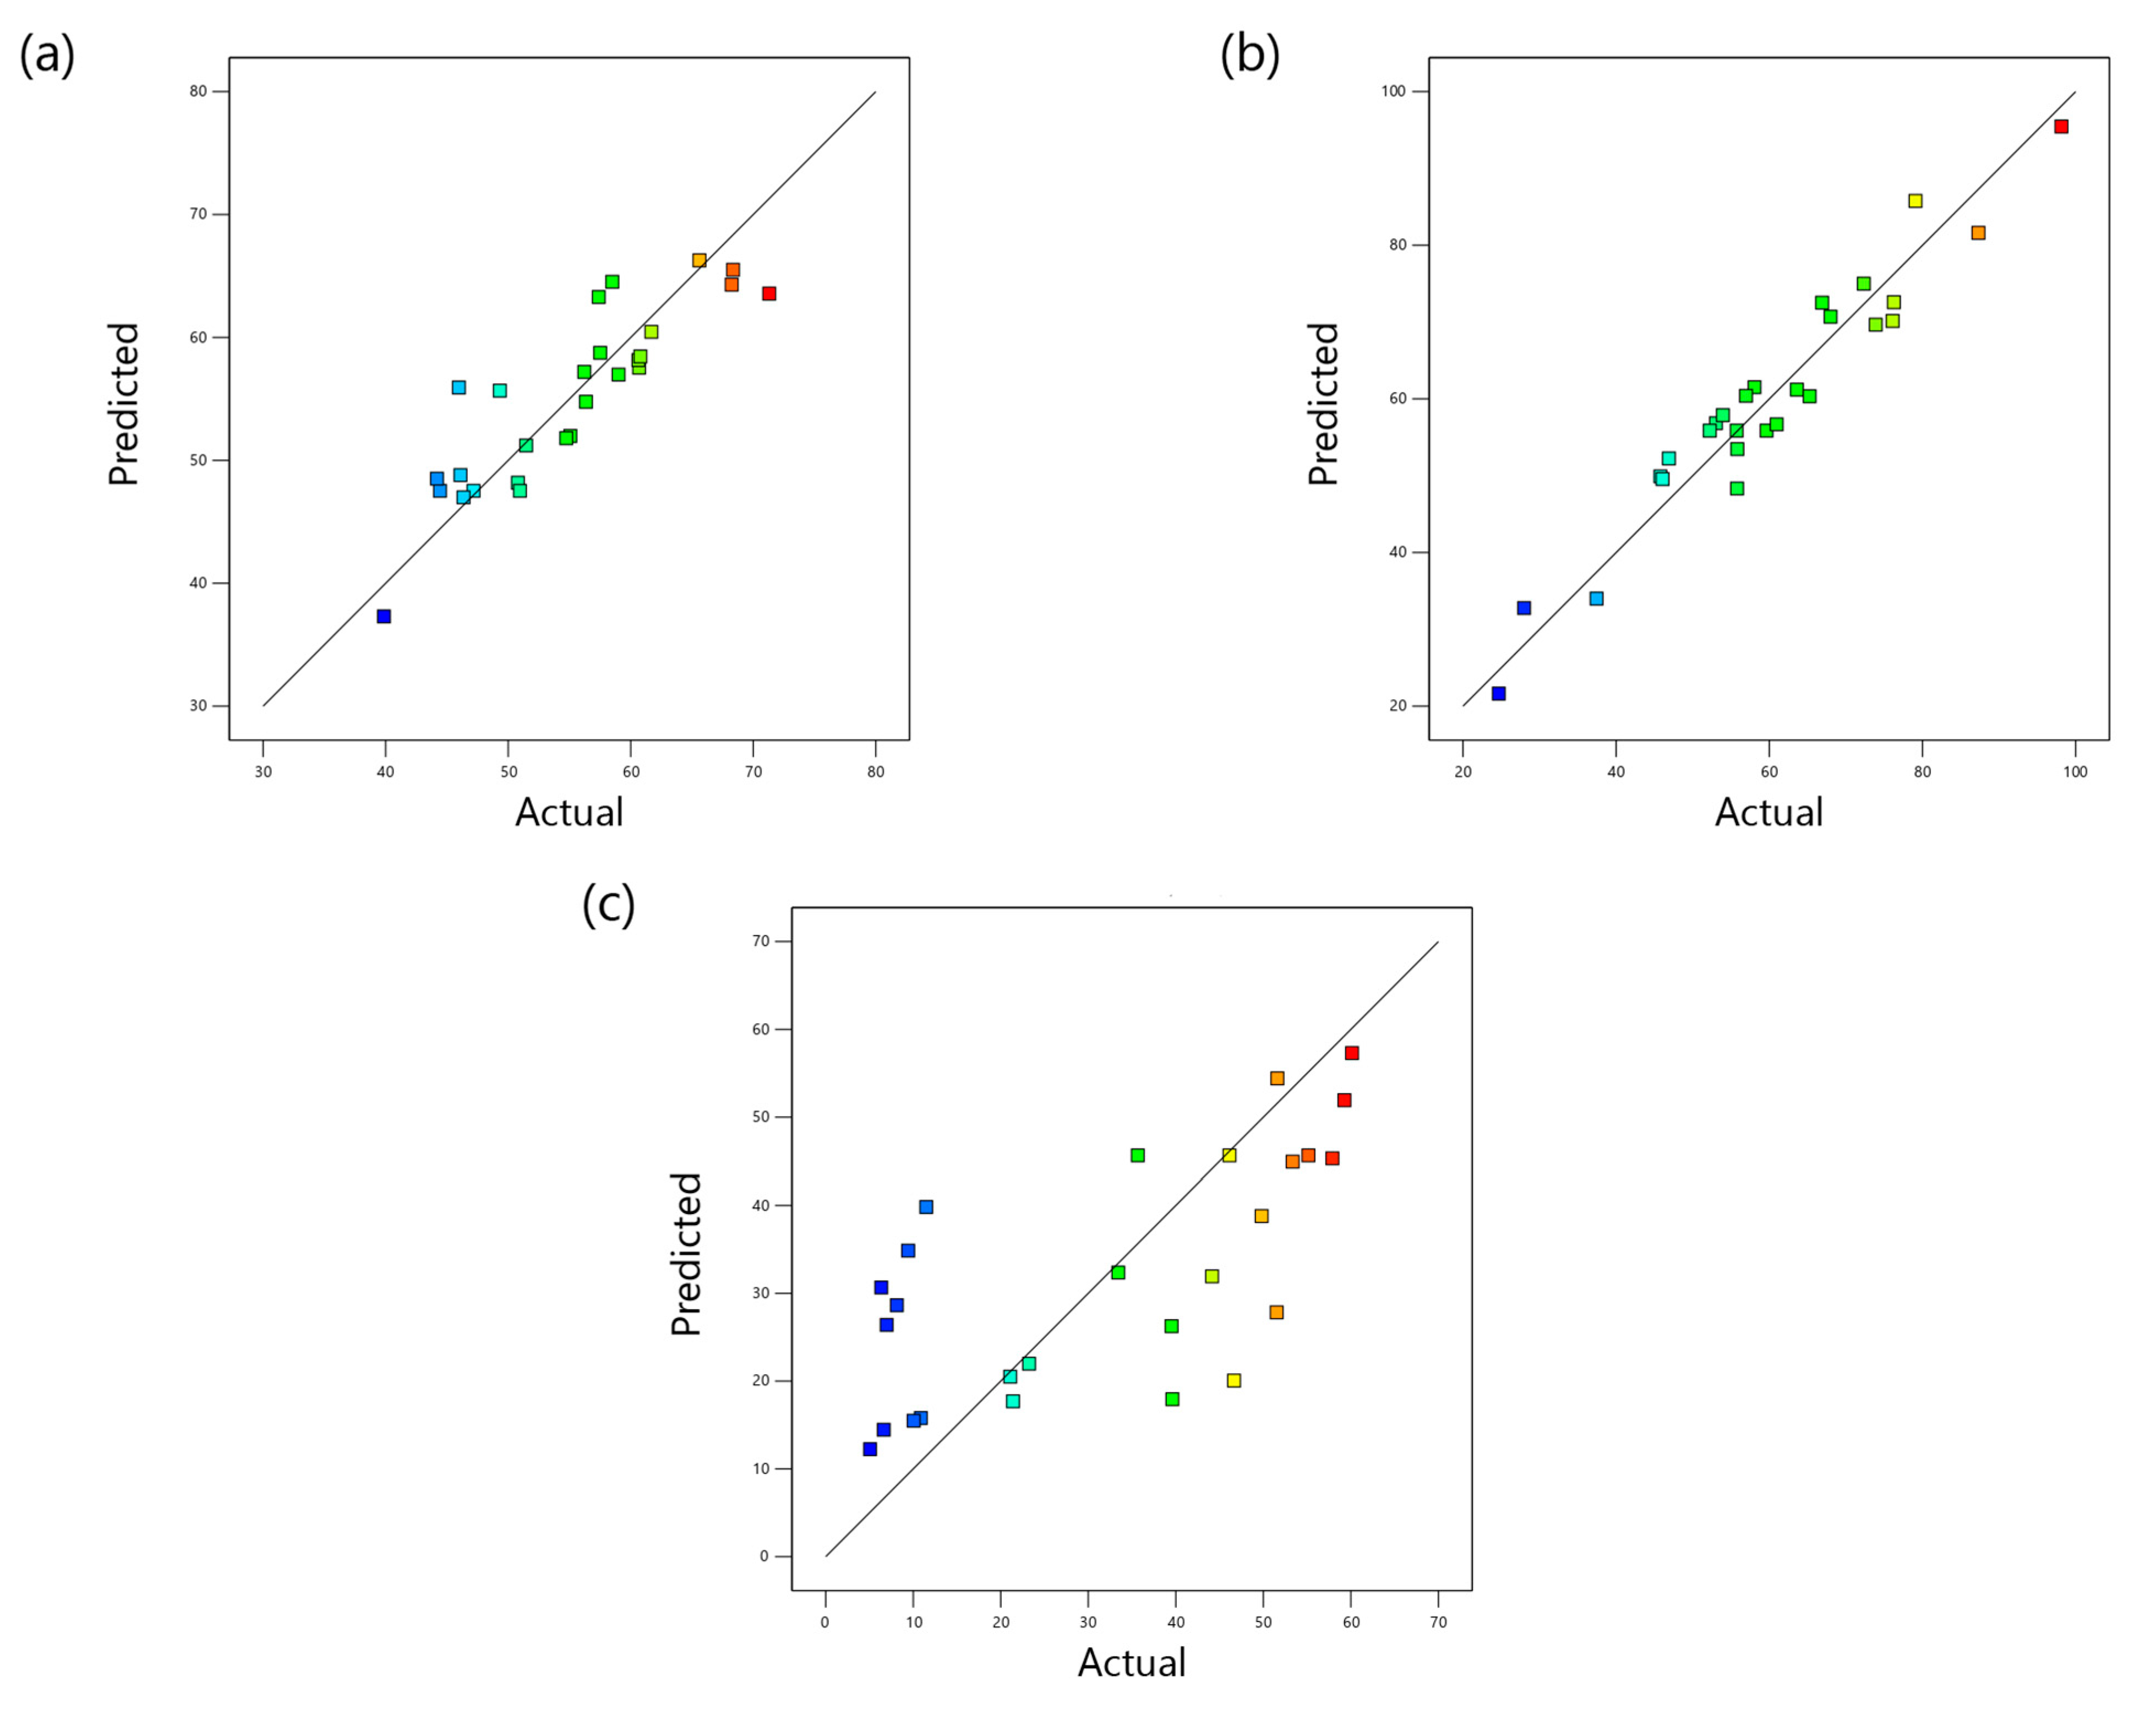
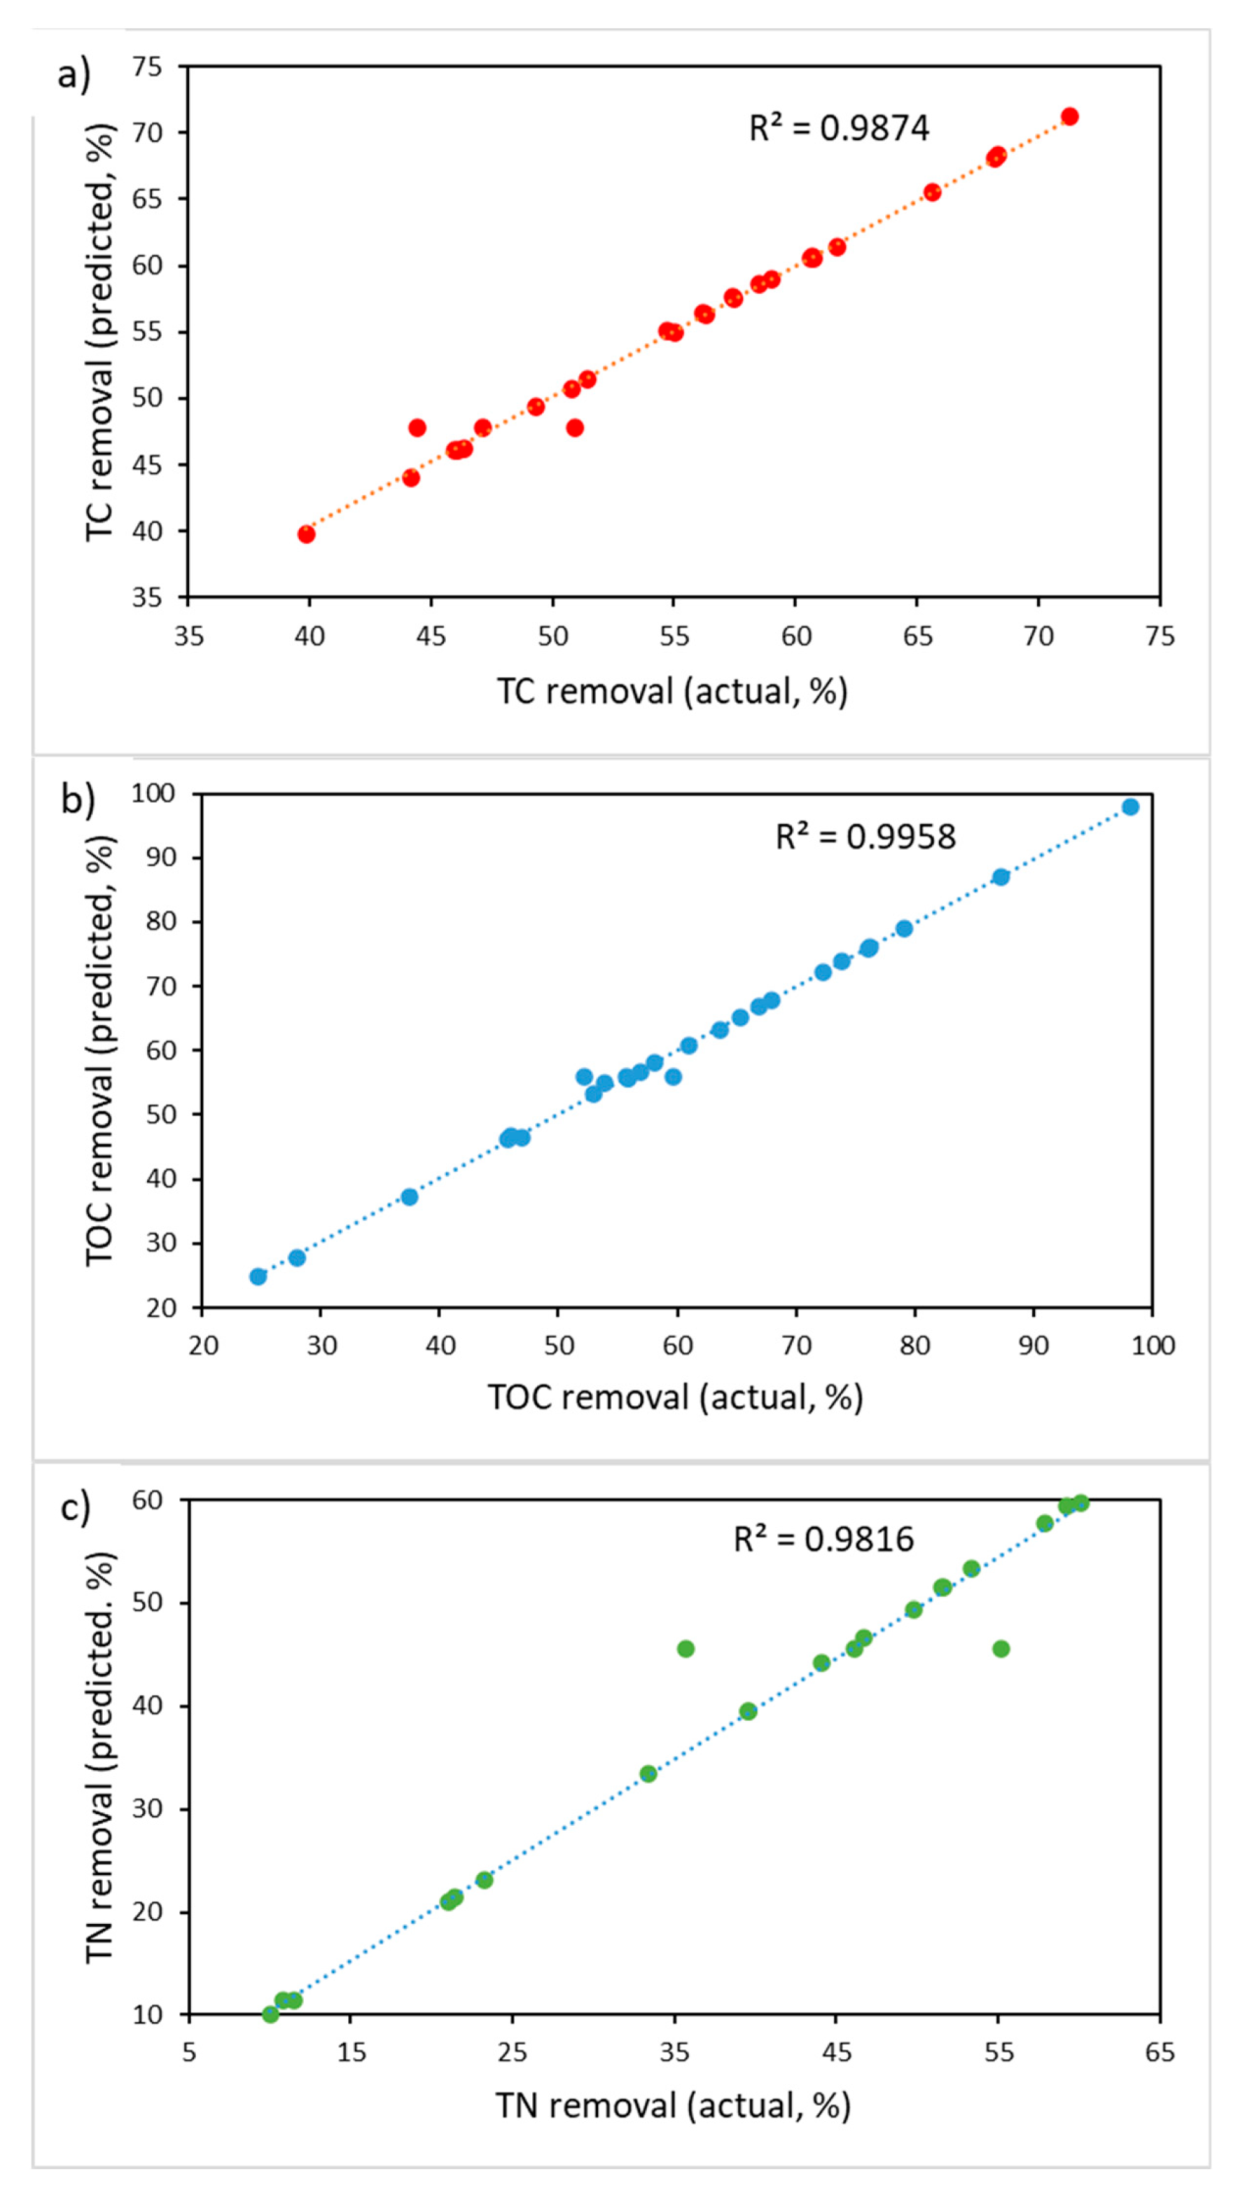
The normal probability versus residuals for TC, TOC, and TN removals are presented in Figure 1a–c, respectively. They show that the data for all three models follow approximately the normal probability distribution. The actual and predicted data (obtained from BBD models) for TC, TOC, and TN removals are shown in Figure 2a–c, respectively. According to these figures, there is a good agreement between actual and predicted data for TC and TOC removal. However, a straight line pattern cannot be observed in Figure 2c, which suggests that the regression quadratic model is not suitable for the TN removal.
2.2. ANOVA Analysis
The adequacy of the model for TC, TOC, and TN removal by the photo-Fenton-like treatment was checked using the Analysis of Variance (ANOVA). The analysis includes the calculation and assessment of regression coefficients (R2), F- and p-values. The results of ANOVA are summarized in Table 2.
Regression coefficients are important parameters in the models. The R2 values for TC, TOC, and TN removal were 0.7681, 0.9314, and 0.4502, respectively. The high values of R2 (close to one) show the adequacy of the model to fit the experimental data. R2 values for TC and TOC were considered satisfactory. However, regarding the TN removal, only 45% of the total variation could be explained by the model.
Generally, the model predictions are considered statistically significant when p-values are less than 0.05, while p-values more than 0.1 demonstrate that the model does not fit well the experimental observations [27]. p-values of TC and TOC removals were 0.039 and <0.0001, respectively, which implies that the models used are significant for both response variables. On the contrary, the F-value of 0.7 and the p-value of 0.739 calculated for the TN removal indicate that the model is not suitable for the TN removal response.
Overall, considering the obtained ANOVA results, the application of the quadratic polynomial model described the process well and can be used to optimize the process in terms of TC and TOC removals.
2.3. Three-Dimensional Plots for the RSM Regression Model
Three-dimensional surface plots demonstrate the interaction between the variables on the response. The graphical representation of the regression models for TC, TOC, and TN removals are shown in Figure 3, Figure 4 and Figure 5, respectively.
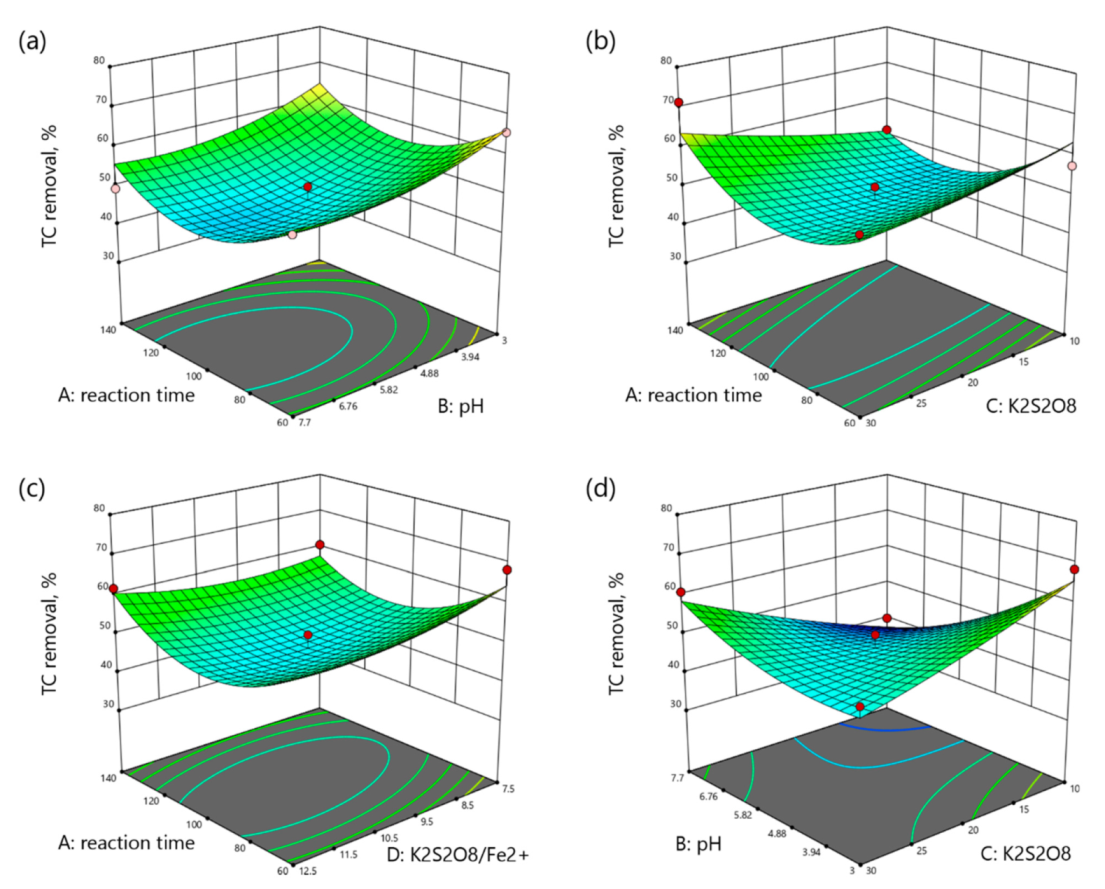
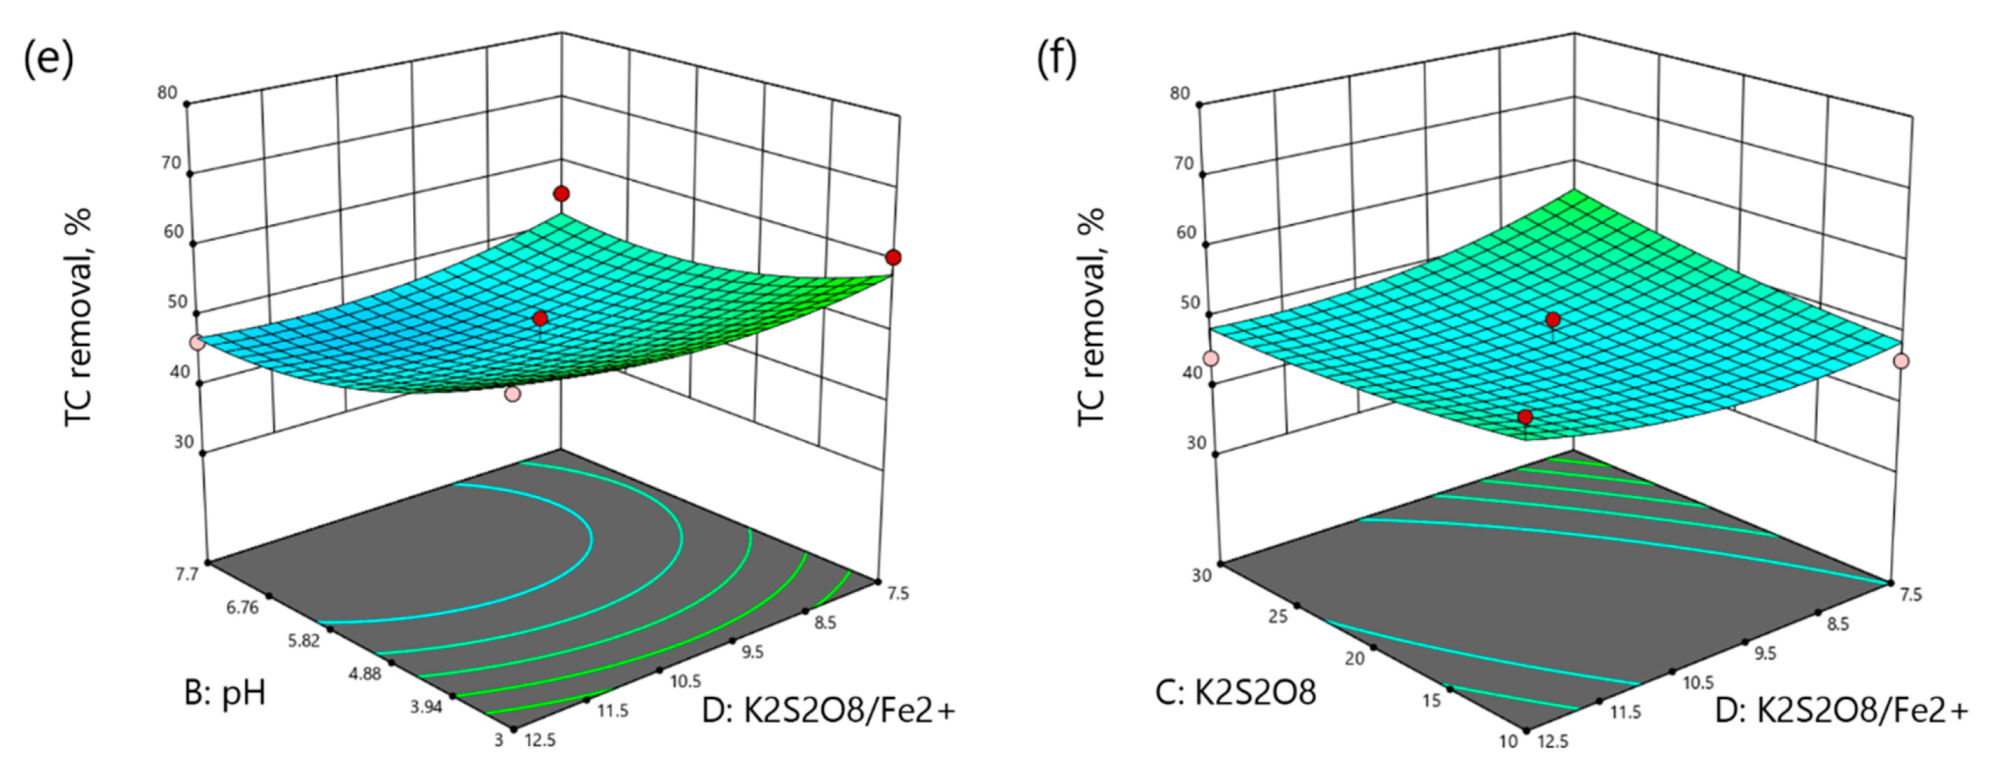
Figure 3a shows the interaction between the reaction time and pH with the TC removal as a response. It is obvious that the increase in both pH and reaction time slightly decreased the TC removal. According to Figure 3b, TC removal decreased from 57.39% to 51.47% with time at 10 mM K2S2O8 and increased from 56.35% to 71.31% at 30 mM K2S2O8. A similar pattern can be observed from Figure 3c where the TC removal decreased over time in the low range and increased at the high range of molar ratio. The interaction between pH and K2S2O8 is shown in Figure 3d. The increment in K2S2O8 concentration at acidic pH led to poorer TC removal from 68.35% to 50.80%, while at neutral pH it showed opposite behavior, increasing the TC removal from 39.86% to 60.79%. Figure 3e indicates the interaction between pH and molar ratio, where TC removal decreased with the pH increment at both low and high molar ratios. Figure 3f illustrates the interaction of oxidant concentration and molar ratio on the TC removal. TC removal increased with the K2S2O8 increment at low molar ratio and decreased at high molar ratio.
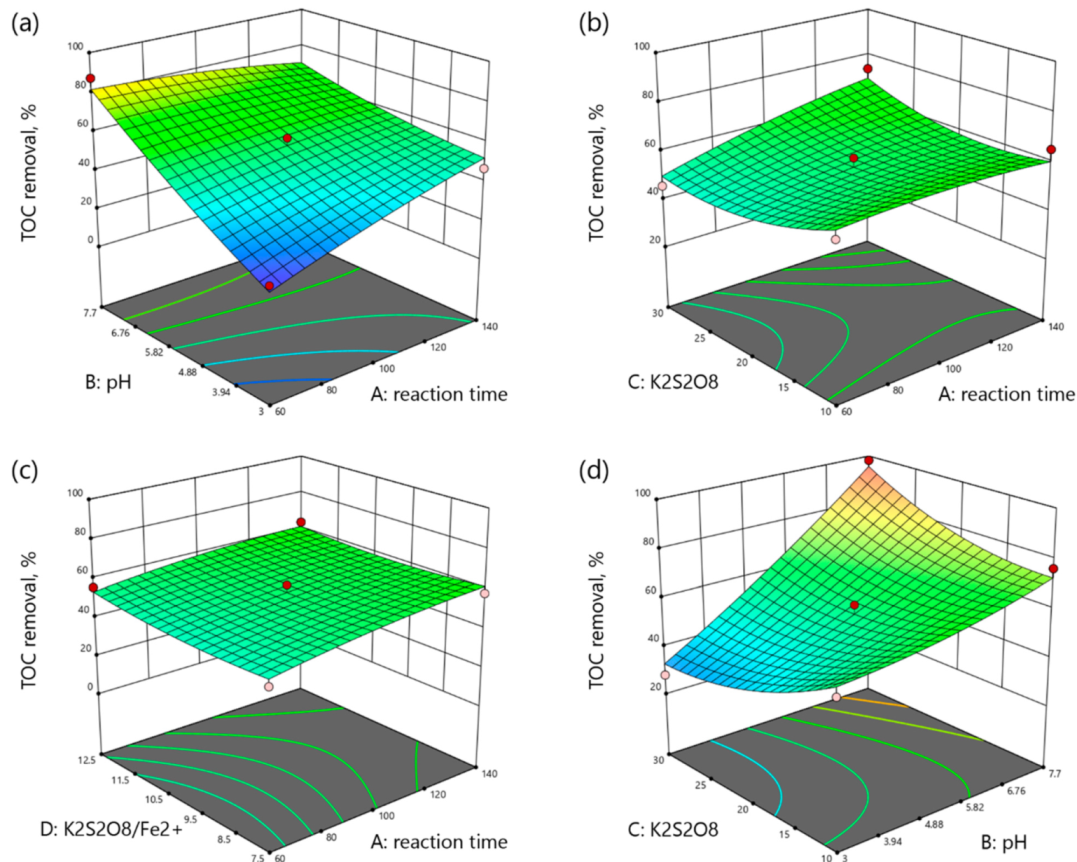
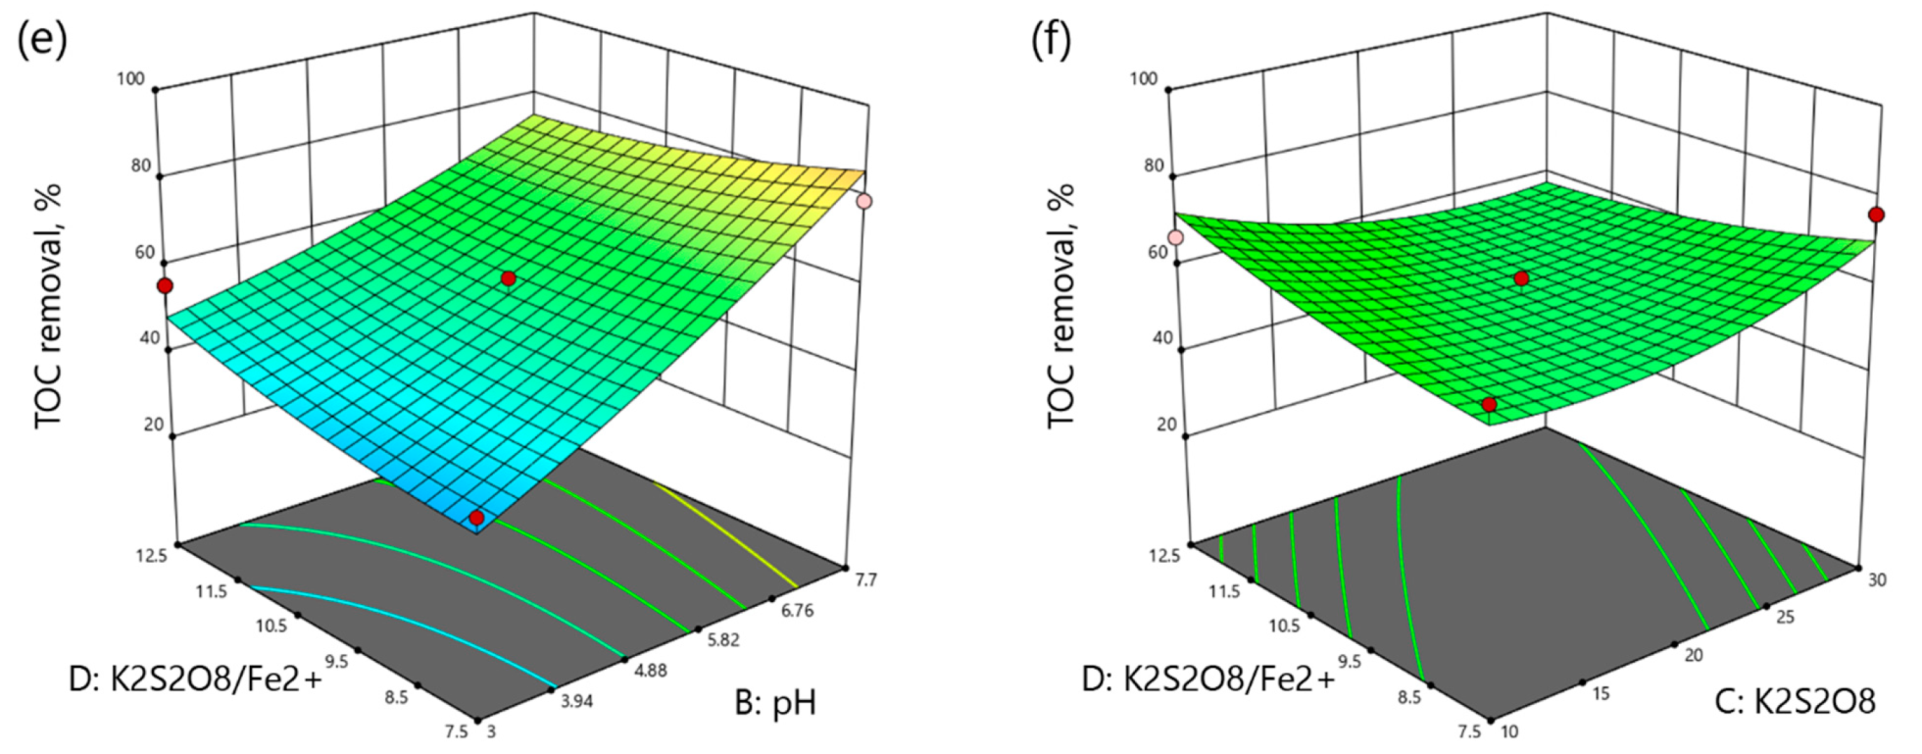
According to Figure 4a, TOC removal increased with reaction time at acidic conditions and decreased at neutral pH. As shown in Figure 4b, TOC removal slightly increased over time in low ranges from 56.96% to 65.26%, and sharply increased with time from 45.79% at 60 min to 73.90% at 140 min and 30 mM K2S2O8. Figure 4c shows the effects of the reaction time and molar ratio of K2S2O8/Fe2+ on TOC removal. The TOC removal increased with time at any range and the molar ratio enhancement slightly increased the TOC removal. Figure 4d shows the interaction between the pH and K2S2O8 concentration. In fact, the increase in pH enhanced the TOC removal at any range. The increase in K2S2O8 concentration decreased the TOC removal from 53.03% to 27.98% at acidic pH and increased the TOC removal from 76.27% to 98.15% at neutral pH. According to Figure 4e, the effect of pH was more important than the effect of K2S2O8/Fe2+ molar ratio on the TOC removal. The TOC removal increased with pH enhancement from 37.45% to 79.09% at the molar ratio of 7.5 and decreased with the molar ratio enhancement from 79.09% to 72.34% at neutral pH. Figure 4f illustrates the interaction of K2S2O8 concentration and K2S2O8/Fe2+ molar ratio on the TOC removal. The increase of molar ratio increased the TOC removal from 60.96% to 66.90% at the K2S2O8 concentration of 10 mM. On the contrary, the molar ratio enhancement at the K2S2O8 concentration of 30 mM decreased the TOC removal from 76.10% to 53.94%.
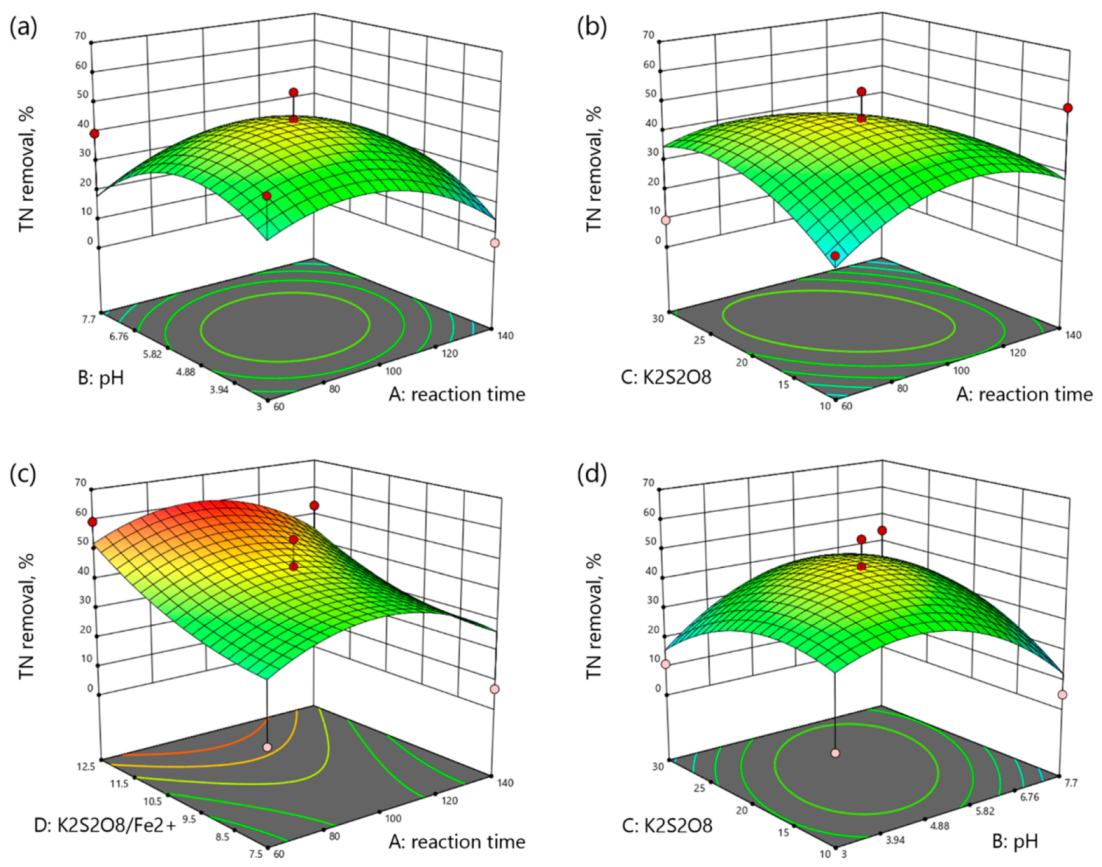
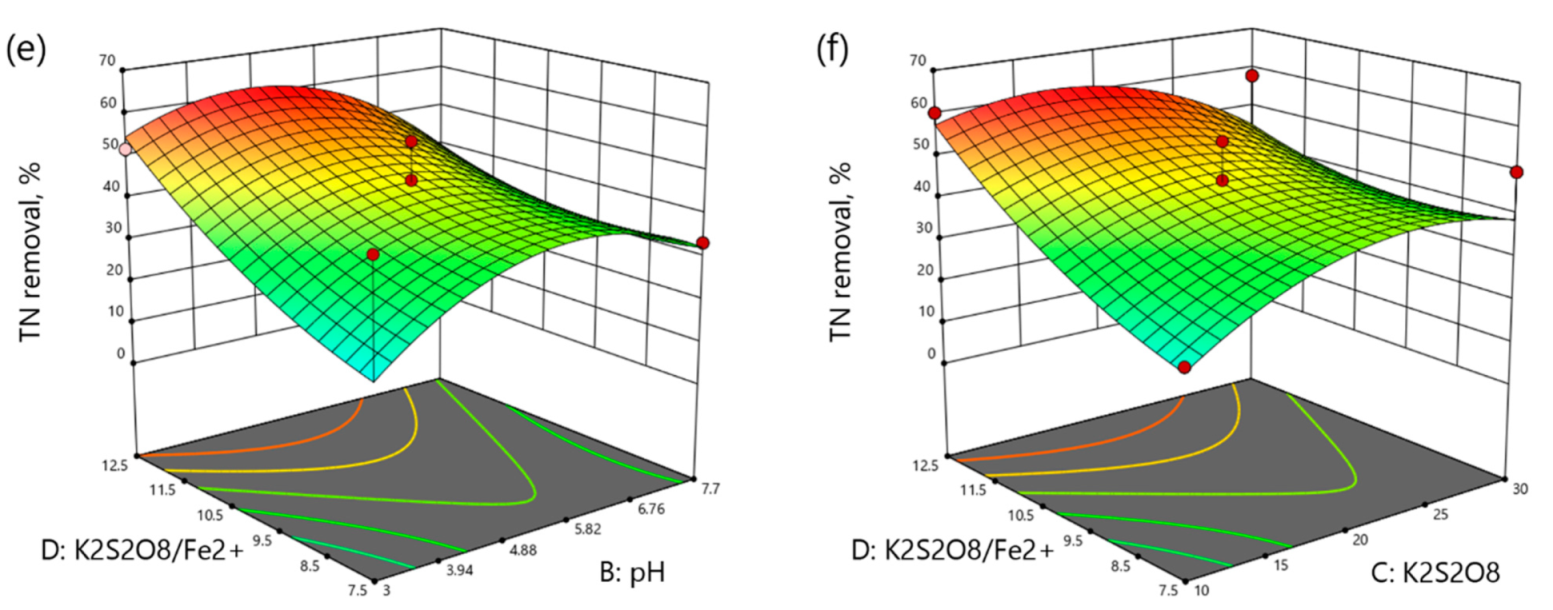
As it can be seen from Figure 5a–f, the increase in the reaction time, pH, and K2S2O8 concentration enhanced the TN removal up to the optimum point. Moreover, the increase in the molar ratio of K2S2O8/Fe2+ increased the TN removal at any range of the reaction time, pH, and K2S2O8 concentration.
2.4. Effective Parameters on the Photo-Fenton Like Process
2.4.1. Effect of Reaction Time
The effect of reaction time was different for TC, TOC, and TN removal. As shown in Figure 4 and Figure 5, the reaction time increment enhanced the TOC and TN removal. This is because the oxidation of organic compounds requires time for completion. Afterward, the removal of TOC and TN decreased after 106 and 98 min, respectively. In contrast, TC removal decreased with increasing reaction time. TC is the sum of total organic carbon (TOC) and total inorganic carbon (TIC). The removal of TIC occurred simultaneously which possibly decreased the optimum time needed for TC removal to 60 min.
2.4.2. Effect of pH
The pH is the one of the crucial factors in the photo-Fenton-like process. The oxidation of organic compounds and production of oxidative radicals are controlled by the pH. In this work, the highest removals were achieved at a pH of 5.35 for 71.31% TC removal and 60.13% TN removal, and a pH of 7.7 for 100% TOC removal.
Unlike the photo-Fenton process where hydrogen peroxide acts as an oxidant, persulfate-driven oxidation is less dependent on pH adjustment as persulfates decrease the pH during the reaction. This creates optimal working conditions for Fe2+ due to the increased solubility [28].
2.4.3. Effect of K2S2O8 Concentration and K2S2O8/Fe2+ Molar Ratio
The reactions that occur during the persulfate-driven photo-Fenton-like process are shown in Equations (1)–(5) [18,19]. Peroxodisulfate ions () can be activated by UV light and Fe2+ to produce sulfate radicals (Equations (1) and (2)). Furthermore, sulfate radicals are well known to generate peroxodisulfate and hydroxyl radicals (Equations (3)–(5)).
According to ANOVA results, K2S2O8 concentration and K2S2O8/Fe2+ molar ratio significantly affected TC and TOC removals. As shown in Figure 3f, K2S2O8 concentration increment decreased the TC removal from 46.11% to 45.98% at a low molar ratio and from 54.74% to 44.19% at a higher ratio. Therefore, the optimal values for TC removal were 10 mM K2S2O8 and 12.5 K2S2O8/Fe2+ molar ratio. In contrast, the interaction of K2S2O8 and molar ratio with TOC removal occurred differently. TOC removal increased with the K2S2O8 concentration increment from 60.96% to 76.10% at a low molar ratio and decreased from 66.90% to 53.94% at a high molar ratio. The optimal TOC removal parameters were 30 mM K2S2O8 and the molar ratio of 7.5. This behavior was due to the consumption of sulfate radicals by excessive iron ions, which resulted in the formation of Fe3+ and (Equation (10)) [29].
2.5. Modeling of TC, TOC, and TN Removal by ANN
The multilayer feed-forward ANN was developed for modeling the photo-Fenton-like process, where the BBD experimental matrix was used to train the ANN. The network had 4 input layers (time, pH, K2S2O8 concentration, and molar ratio) and three output nodes (TC, TOC, and TN removals). The best predictor model was determined by Equation (14), which combined root mean square error (RMSE) and regression coefficients (R2). The optimal number of nodes in the hidden layer was 20 (Tables S1–S3).
The configuration with 20 nodes in the hidden layer had high values of R2 (close to 1) and low values of RMSE. The values predicted using optimal ANN are presented in Table 1. As it can be seen from Figure 6, the variance between actual and ANN predicted values was very low, which means that the ANN model has fitted the experimental data.
2.6. Optimization and Validation
The optimum conditions for TC, TOC, and TN removal were obtained by the RSM and ANN (Table 3).
The optimum conditions for TC, TOC, and TN removal were obtained by the RSM and ANN. The optimum conditions for 100% TOC removal found by RSM were at pH of 7.7, the reaction time of 106.06 min, the concentration of K2S2O8 30 mM and K2S2O8/Fe2+ molar ratio of 7.5, while ANN predicted 98.7% removal of TOC at pH of 7.7, the reaction time of 104.93 min, the concentration of K2S2O8 30 mM and K2S2O8/Fe2+ molar ratio of 9.57. Experiments were conducted at these conditions and as can be seen from Table 3, there is a good agreement between actual and predicted data for TOC removal. On the contrary, both methods were unable to accurately predict the optimal conditions for TC and TN removal. This is due to the lack of fit of the models for TC and TOC, where regression coefficients were smaller than 0.8.
Formic and acetic acids were determined using ion chromatography. The organic carbon of the intermediates (OCintermediates) and the mineralized organic carbon (OCCO2) after the photo-Fenton-like process was calculated using the following Equations (11) and (12):
Table S4 summarizes the results of the calculation of the intermediates. RSM and ANN optimized experiments achieved complete mineralization. Moreover, it can be seen that after run #17 (pH of 7.7, reaction time of 60 min, concentration of K2S2O8 20 mM and K2S2O8/Fe2+ molar ratio of 10), the organic carbon consisted of acetic acid only. Even though complete mineralization of TOC has not been achieved after run 17, these conditions could be favorable for the time and resource economy.
3. Materials and Methods
3.1. Wastewater Source and Characteristics
The real municipal wastewater used in this study was collected from the local wastewater treatment plant “Astana Su Arnasy” (Nur-Sultan city, Kazakhstan). Wastewater samples with a volume of 20 L were collected and stored in a refrigerator at 4 °C before conducting experiments and further analysis. Prior to experiments, MWW was filtered through a glass microfiber filter paper with a porosity grade of 0.7 μm (Whatman, Grade GF/F) under vacuum (Diaphragm vacuum pump KNF Laboport®, N 811). Characteristics of the real municipal wastewater are shown in Table 4. Around 83% of carbon was inorganic.
3.2. Reagents and Supplies
Potassium persulfate K2S2O8 (ACS reagent, ≥99%) purchased from Sigma-Aldrich was utilized as a source of sulfate radicals. Ammonium iron(II) sulfate hexahydrate (ACS reagent, 99% w/w) received from Fisher Chemical was used as a source of ferrous ions. Hydrochloric acid solution (1 M) prepared from hydrochloric acid (ACS reagent, 37% w/w) supplied by Sigma-Aldrich was used for pH adjustment. All chemicals were applied without further purification.
3.3. Experimental Setup and Procedure
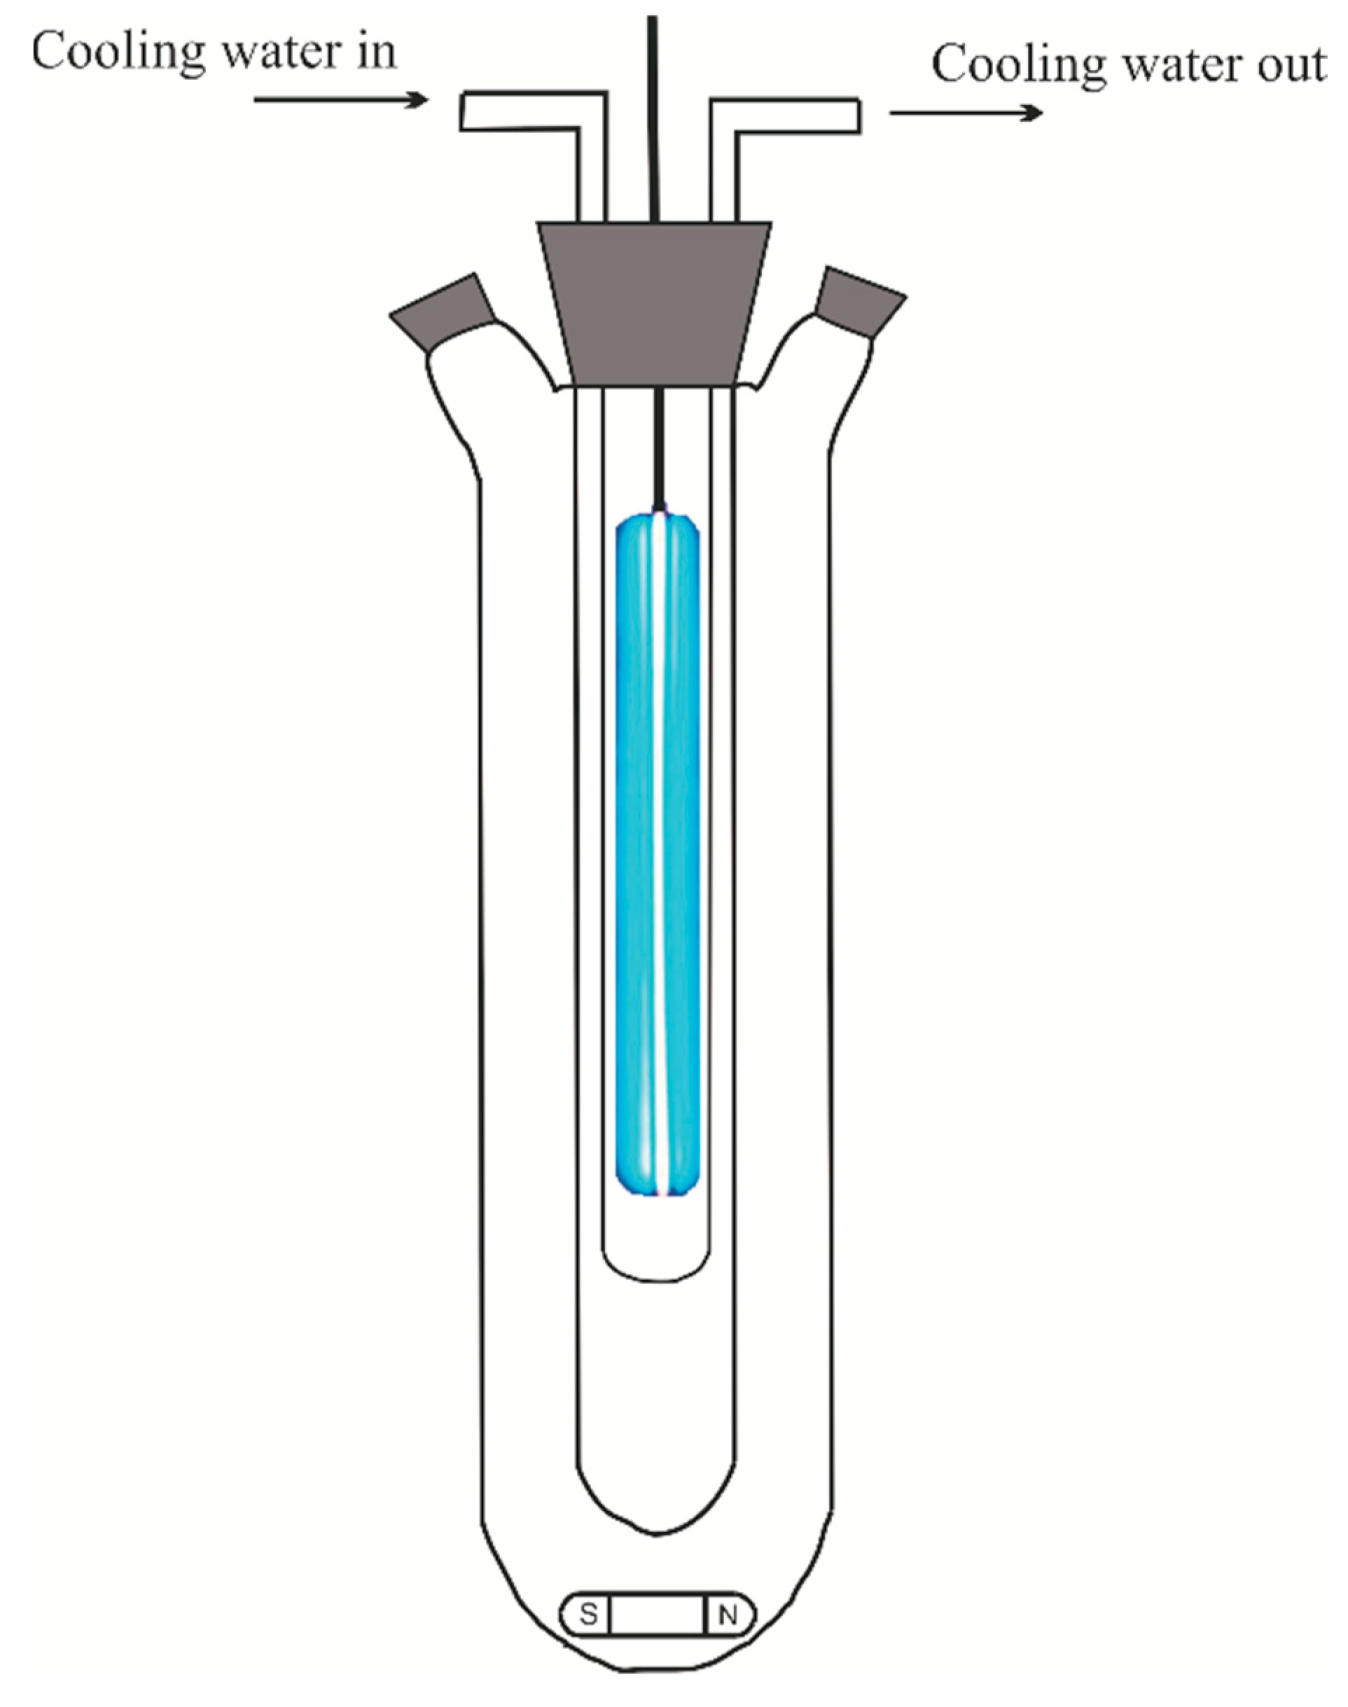
All experiments were conducted in a batch photochemical reactor (Toption Instrument Co., Ltd., Xi’an, China), which is shown in Figure 7. A lamp with 30 W power, located inside the photoreactor, emitted UV irradiation of 254 nm. At each run, 400 mL of the MWW was poured into the reactor, and desired amounts of iron salt and potassium persulfate were added. Depending on the required conditions, the initial pH of the MWW was adjusted by a 1 M hydrochloric acid solution. The treated solution was continuously stirred with a magnetic stirrer. The start of the experiment was considered with the switch-on of the UV lamp. Aliquots from the reaction mixture were taken at the end of the experiments and sent directly to the analysis.
3.4. Analytical Methods
The treatment efficiency was assessed via TC/TIC/TOC/TN analyses, pH, and COD measurements. The TC/TIC/TOC/TN analyses were carried out using the Multi N/C 3100 instrument by Analytik Jena AG (Jena, Germany). The pH of samples was measured using a WTW pH meter inoLab Multi 9310 IDS. The COD concentration was recorded using the Hach DRB 200 dry thermostat reactor and Hach DR 3900 spectrophotometer without RFID technology.
In addition, ion chromatography (IC, the 930 Compact IC Flex supplied by Metrohm, Herisau, Switzerland) was used to determine the concentrations of acetic and formic acids in the initial wastewater and final solutions.
All samples were filtered before analyses by the PVDF membrane filters with a pore size of 0.45 µm (Whatman, Maidstone, UK, diameter 25 mm). Prior to IC analysis, the poultry wastewater was filtered through Agilent Technologies premium syringe filters with a 0.2 µm RC membrane (25 mm diameter).
The removal efficiency was calculated using Equation (13):
where Ct and C0 are final and initial concentrations.
3.5. Modelling Using RSM
The Design-Expert statistical software (version 13) was applied for the statistical analysis and optimization of experiments. A four-factor with three-level Box-Behnken Design (BBD) in conjunction with the response surface methodology (RSM) was employed to maximize total carbon (TC), total organic carbon (TOC), and total nitrogen (TN) removal in municipal wastewater treatment. The affecting parameters on the reaction chosen as independent variables were the reaction time (A), pH (B), K2S2O8/Fe2+ molar ratio (C), and concentration of K2S2O8. The TC, TOC, and TN removals were chosen as responses (dependent variables) (Table 5). Each factor was coded at three levels (from −1 to +1). Minitab software (version 19) was used to construct Pareto chart.
3.6. Modelling Using ANN
The neural network module from the statistical software SAS JMP Pro 15 was used to train and validate the artificial neural network (ANN). The values of the parameters are shown in Table 6.
A fully connected ANN has been built using one hidden layer, which consisted of 5 to 20 nodes with Tan H sigmoid function [30]. The optimum number of hidden nodes was found by calculation of a specific score (E) with an equation that includes both regression coefficients (R2) and root mean square error (RMSE) of training and validation models (Equation (14)) [31].
4. Conclusions
Response surface methodology and artificial neural network have been utilized for the optimization of the photochemical treatment of municipal wastewater using the photo-Fenton-like process. According to the RSM, the optimum conditions for the highest TOC removal (100% both experimentally and statistically) were achieved at the reaction time of 106.06 min, pH of 7.7, persulfate concentration of 30 mM, and K2S2O8/Fe2+ molar ratio of 7.5. According to the ANN results, the optimum conditions for the highest TOC removal (100% experimentally and 98.7 theoretically) were obtained at the reaction time of 104.93 min, pH of 7.7, persulfate concentration of 30 mM, and K2S2O8/Fe2+ molar ratio of 9.57. Both RSM and ANN models inaccurately predicted optimum conditions for TC and TN removal. Thus, the conditions with the highest removal of TC (71.31%) and TN (60.13%) were observed at the reaction time of 140 min (for TC) and 100 min (for TN), pH of 5.35 (for both TC and TN), persulfate concentration of 30 mM (for TC) and 10 mM (for TN), K2S2O8/Fe2+ molar ratio of 10 (for TC) and 12.5 (for TN). ANOVA was able to indicate the significant parameters for the photo-Fenton-like process. Factors such as reaction time, pH, K2S2O8, interactions between reaction time and pH, pH and K2S2O8, and K2S2O8 and K2S2O8/Fe2+ molar ratio had a significant impact on TOC removal.
Supplementary Materials
The following are available online at www.mdpi.com/article/10.3390/catal11101206/s1, Table S1: R2 and RMSE values for actual and predicted TC removal (%), Table S2: R2 and RMSE values for actual and predicted TOC removal (%), Table S3: R2 and RMSE values for actual and predicted TN removal (%), Table S4: The concentrations of formic acid, acetic acid, intermediates, and CO2 expressed in organic carbon (OC) for each run, Figure S1. Pareto chart of the standardized effects (response is TOC removal (%); the reference line is at 2.18, α = 0.05): (A) reaction time, (B) pH, (C) K2S2O8, (D) K2S2O8/Fe2+.
Author Contributions
Conceptualization, Y.N.K. and S.G.P.; Data curation, Y.N.K. and V.Z.; Formal analysis, Y.N.K.; Funding acquisition, E.A. and S.G.P.; Investigation, Y.N.K. and A.M.; Methodology, Y.N.K. and A.M.; Project administration, E.A. and S.G.P.; Resources, E.A. and S.G.P.; Software, Y.N.K.; Supervision, S.G.P.; Validation, Y.N.K. and V.Z.; Visualization, Y.N.K.; Writing—original draft, Y.N.K. and A.M.; Writing—review & editing, Y.N.K., V.Z., E.A. and S.G.P. All authors have read and agreed to the published version of the manuscript.
Funding
This research was funded by the Nazarbayev University project “Cost-Effective Photocatalysts for the Treatment of Wastewaters containing Emerging Pollutants”, Faculty development competitive research grants program for 2020–2022, Grant Number 240919FD3932 awarded to S.G. Poulopoulos.
Acknowledgments
The authors acknowledge funding support from Nazarbayev University. The technical support of Core Facilities of Nazarbayev University is greatly acknowledged.
Conflicts of Interest
The authors declare no conflict of interest.
References
- Fane, A.G.; Tang, C.Y.; Wang, R. Membrane Technology for Water: Microfiltration, Ultrafiltration, Nanofiltration, and Reverse Osmosis. In Treatise on Water Science; Newnes Books-Elsevier: Amsterdam, The Netherlands, 2011; Volume 4, pp. 301–335. ISBN 9780444531933. [Google Scholar]
- Pereira, L.S.; Duarte, E.; Fragoso, R. Water Use: Recycling and Desalination for Agriculture. In Encyclopedia of Agriculture and Food Systems; Elsevier: Amsterdam, The Netherlands, 2014. [Google Scholar]
- Nemerow, N.L. Industrial collaborative solutions. In Environmental Solutions; Academic Press: Cambridge, MA, USA, 2005; pp. 249–295. ISBN 9780120884414. [Google Scholar]
- Stasinakis, A.S. Use of selected advanced oxidation processes (AOPs) for wastewater treatment—A mini review. Glob. NEST J. 2008, 10, 376–385. [Google Scholar] [CrossRef]
- Kanafin, Y.N.; Kakimov, Y.; Adamov, A.; Makhatova, A.; Yeshmuratov, A.; Poulopoulos, S.G.; Inglezakis, V.J.; Arkhangelsky, E. The effect of caffeine, metronidazole and ibuprofen on continuous flow activated sludge process. J. Chem. Technol. Biotechnol. 2021, 96, 1370–1380. [Google Scholar] [CrossRef]
- Pescod, M.B. Wastewater Treatment and Use in Agriculture—FAO Irrigation and Drainage; FAO: Rome, Italy, 1992; Volume 47, ISBN 9253042192. [Google Scholar]
- Ternes, T.; Joss, A. Human Pharmaceuticals, Hormones and Fragrances—The Challenge of Micropollutants in Urban Water Management; IWA Publ: London, UK, 2006; ISBN 9781780402468. [Google Scholar]
- Stathoulopoulos, A.; Mantzavinos, D.; Frontistis, Z. Coupling persulfate-based AOPs: A novel approach for piroxicam degradation in aqueous matrices. Water 2020, 12, 1530. [Google Scholar] [CrossRef]
- Lee, Y.; Zimmermann, S.G.; Kieu, A.T.; Von Gunten, U. Ferrate (Fe(VI)) application for municipal wastewater treatment: A novel process for simultaneous micropollutant oxidation and phosphate removal. Environ. Sci. Technol. 2009, 43, 3831–3838. [Google Scholar] [CrossRef]
- Deng, Y.; Zhao, R. Advanced Oxidation Processes (AOPs) in Wastewater Treatment. Curr. Pollut. Rep. 2015, 1, 167–176. [Google Scholar] [CrossRef] [Green Version]
- Huling, S.G.; Pivetz, B.E. Engineering Issue Paper: In-Situ Chemical Oxidation; United States Environmental Protection Agency: Washington, DC, USA, 2006; pp. 1–60.
- Kolthoff, I.M.; Miller, I.K. The Chemistry of Persulfate. II. The Reaction of Persulfate with Mercaptans Solubilized in Solutions of Saturated Fatty Acid Soaps. J. Am. Chem. Soc. 1951, 73, 5118–5122. [Google Scholar] [CrossRef]
- House, D.A. Kinetics and mechanism of oxidations by peroxydisulfate. Chem. Rev. 1962, 62, 185–203. [Google Scholar] [CrossRef]
- Tsitonaki, A.; Petri, B.; Crimi, M.; Mosbk, H.; Siegrist, R.L.; Bjerg, P.L. In situ chemical oxidation of contaminated soil and groundwater using persulfate: A review. Crit. Rev. Environ. Sci. Technol. 2010, 40, 55–91. [Google Scholar] [CrossRef]
- Anipsitakis, G.P.; Dionysiou, D.D. Radical generation by the interaction of transition metals with common oxidants. Environ. Sci. Technol. 2004, 38, 3705–3712. [Google Scholar] [CrossRef] [PubMed]
- Neta, P.; Madhavan, V.; Zemel, H.; Fessenden, R.W. Rate constants and mechanism of reaction of sulfate radical anion with aromatic compounds. J. Am. Chem. Soc. 1977, 99, 163–164. [Google Scholar] [CrossRef]
- Waldemer, R.H.; Tratnyek, P.G.; Johnson, R.L.; Nurmi, J.T. Oxidation of chlorinated ethenes by heat-activated persulfate: Kinetics and products. Environ. Sci. Technol. 2007, 41, 1010–1015. [Google Scholar] [CrossRef]
- Wang, Z.; Jiang, J.; Pang, S.; Zhou, Y.; Guan, C.; Gao, Y.; Li, J.; Yang, Y.; Qiu, W.; Jiang, C. Is Sulfate Radical Really Generated from Peroxydisulfate Activated by Iron(II) for Environmental Decontamination? Environ. Sci. Technol. 2018, 52, 11276–11284. [Google Scholar] [CrossRef]
- Velo-Gala, I.; López-Peñalver, J.J.; Sánchez-Polo, M.; Rivera-Utrilla, J. Comparative study of oxidative degradation of sodium diatrizoate in aqueous solution by H2O2/Fe2+, H2O2/Fe3+, Fe (VI) and UV, H2O2/UV, K2S2O8/UV. Chem. Eng. J. 2014, 241, 504–512. [Google Scholar] [CrossRef]
- Lee, J.; Von Gunten, U.; Kim, J.H. Persulfate-Based Advanced Oxidation: Critical Assessment of Opportunities and Roadblocks. Environ. Sci. Technol. 2020, 54, 3064–3081. [Google Scholar] [CrossRef] [PubMed]
- PubChem Potassium Persulfate. Available online: https://pubchem.ncbi.nlm.nih.gov/compound/Potassium-persulfate (accessed on 2 October 2021).
- Yang, S.; Cheng, J.; Sun, J.; Hu, Y.; Liang, X. Defluorination of Aqueous Perfluorooctanesulfonate by Activated Persulfate Oxidation. PLoS ONE 2013, 8, e74877. [Google Scholar] [CrossRef]
- Dbira, S.; Bensalah, N.; Zagho, M.M.; Ennahaoui, M.; Bedoui, A. Oxidative degradation of tannic acid in aqueous solution by UV/S2O82- and UV/H2O2/Fe2+ processes: A comparative study. Appl. Sci. 2019, 9, 156. [Google Scholar] [CrossRef] [Green Version]
- Pervez, M.N.; He, W.; Zarra, T.; Naddeo, V.; Zhao, Y. New sustainable approach for the production of Fe3O4/Graphene oxide-activated persulfate system for dye removal in real wastewater. Water 2020, 12, 733. [Google Scholar] [CrossRef] [Green Version]
- Miklos, D.B.; Remy, C.; Jekel, M.; Linden, K.G.; Drewes, J.E.; Hübner, U. Evaluation of advanced oxidation processes for water and wastewater treatment—A critical review. Water Res. 2018, 139, 118–131. [Google Scholar] [CrossRef] [PubMed]
- Ioannidi, A.; Arvaniti, O.S.; Nika, M.-C.; Aalizadeh, R.; Thomaidis, N.S.; Mantzavinos, D.; Frontistis, Z. Removal of drug losartan in environmental aquatic matrices by heat-activated persulfate: Kinetics, transformation products and synergistic effects. Chemosphere 2022, 287, 131952. [Google Scholar] [CrossRef]
- Davarnejad, R.; Nasiri, S. Slaughterhouse wastewater treatment using an advanced oxidation process: Optimization study. Environ. Pollut. 2017, 223, 1–10. [Google Scholar] [CrossRef] [PubMed]
- Bello, M.M.; Abdul Raman, A.A.; Asghar, A. A review on approaches for addressing the limitations of Fenton oxidation for recalcitrant wastewater treatment. Process. Saf. Environ. Prot. 2019, 126, 119–140. [Google Scholar] [CrossRef]
- Li, R.; Kong, J.; Liu, H.; Chen, P.; Liu, G.; Li, F.; Lv, W. A sulfate radical based ferrous-peroxydisulfate oxidative system for indomethacin degradation in aqueous solutions. RSC Adv. 2017, 7, 22802–22809. [Google Scholar] [CrossRef] [Green Version]
- Saber, W.E.I.A.; El-Naggar, N.E.A.; El-Hersh, M.S.; El-khateeb, A.Y.; Elsayed, A.; Eldadamony, N.M.; Ghoniem, A.A. Rotatable central composite design versus artificial neural network for modeling biosorption of Cr6+ by the immobilized Pseudomonas alcaliphila NEWG-2. Sci. Rep. 2021, 11, 1717. [Google Scholar] [CrossRef] [PubMed]
- Alves da Rocha, R.; Paiva, I.M.; Anjos, V.; Furtado, M.A.M.; Bell, M.J.V. Quantification of whey in fluid milk using confocal Raman microscopy and artificial neural network. J. Dairy Sci. 2015, 98, 3559–3567. [Google Scholar] [CrossRef] [PubMed] [Green Version]
Figure 1.
Normal probability vs. internally studentized residuals values for (a) TC removal, (b) TOC removal, and (c) TN removal.
Figure 1.
Normal probability vs. internally studentized residuals values for (a) TC removal, (b) TOC removal, and (c) TN removal.

Figure 2.
RSM predicted vs. actual values for (a) TC removal, (b) TOC removal, and (c) TN removal.

Figure 3.
3D plots of TC removal as a function: (a) reaction time (min) and pH, (b) reaction time (min) and K2S2O8 concentration (mM), (c) reaction time and K2S2O8/Fe2+ molar ratio, (d) pH and K2S2O8 concentration (mM), (e) pH and K2S2O8/Fe2+ molar ratio, (f) K2S2O8 concentration (mM) and K2S2O8/Fe2+ molar ratio.


Figure 4.
3D plots of TOC removal as a function: (a) reaction time (min) and pH, (b) reaction time (min) and K2S2O8 concentration (mM), (c) reaction time and K2S2O8/Fe2+ molar ratio, (d) pH and K2S2O8 concentration (mM), (e) pH and K2S2O8/Fe2+ molar ratio, (f) K2S2O8 concentration (mM) and K2S2O8/Fe2+ molar ratio.


Figure 5.
3D plots of TN removal as a function: (a) reaction time (min) and pH, (b) reaction time (min) and K2S2O8 concentration (mM), (c) reaction time and K2S2O8/Fe2+ molar ratio, (d) pH and K2S2O8 concentration (mM), (e) pH and K2S2O8/Fe2+ molar ratio, (f) K2S2O8 concentration (mM) and K2S2O8/Fe2+ molar ratio.


Figure 6.
ANN predicted vs. actual values for (a) TC removal, (b) TOC removal, and (c) TN removal.

Figure 7.
The experimental setup.


Table 1.
Experimental matrix design.
| Run | Independent Variables | Response (Y, %) | |||||||||||
|---|---|---|---|---|---|---|---|---|---|---|---|---|---|
| X1 | X2 | X3 | X4 | Actual | Predicted by RSM | Predicted by ANN | |||||||
| Time | pH | K2S2O8, mM | Molar Ratio K2S2O8/Fe2+ | TC | TOC | TN | TC | TOC | TN | TC | TOC | TN | |
| 1 | 60 | 5.35 | 30 | 10 | 56.35 | 45.79 | 9.42 | 54.77 | 46.43 | 34.86 | 56.33 | 46.19 | 9.43 |
| 2 | 100 | 3 | 30 | 10 | 50.80 | 27.98 | 10.87 | 48.18 | 34.35 | 15.79 | 50.73 | 27.75 | 11.37 |
| 3 | 140 | 5.35 | 20 | 7.5 | 60.69 | 58.06 | 6.97 | 57.54 | 60.27 | 26.40 | 60.67 | 58.23 | 6.98 |
| 4 | 100 | 3 | 10 | 10 | 68.35 | 53.03 | 6.35 | 65.51 | 58.62 | 30.66 | 68.28 | 53.17 | 6.52 |
| 5 | 140 | 3 | 20 | 10 | 58.50 | 46.89 | 6.63 | 64.53 | 52.78 | 14.46 | 58.65 | 46.58 | 6.28 |
| 6 | 140 | 5.35 | 30 | 10 | 71.31 | 73.9 | 10.05 | 63.57 | 65.80 | 15.49 | 71.29 | 73.83 | 10.03 |
| 7 | 100 | 5.35 | 20 | 10 | 50.96 | 55.74 | 35.66 | 47.52 | 55.87 | 45.65 | 47.77 | 55.96 | 45.62 |
| 8 | 100 | 7.7 | 10 | 10 | 39.86 | 76.27 | 5.07 | 37.30 | 69.55 | 12.25 | 39.82 | 76.12 | 5.07 |
| 9 | 100 | 5.35 | 20 | 10 | 47.17 | 59.64 | 46.13 | 47.52 | 55.87 | 45.65 | 47.77 | 55.96 | 45.62 |
| 10 | 60 | 5.35 | 20 | 7.5 | 68.24 | 46.06 | 8.13 | 64.30 | 49.37 | 28.64 | 68.04 | 46.81 | 8.07 |
| 11 | 60 | 3 | 20 | 10 | 65.61 | 24.68 | 39.52 | 66.28 | 25.72 | 26.26 | 65.55 | 24.81 | 39.47 |
| 12 | 60 | 5.35 | 10 | 10 | 57.39 | 56.96 | 21.4 | 63.29 | 57.82 | 17.70 | 57.59 | 56.56 | 21.51 |
| 13 | 140 | 5.35 | 20 | 12.5 | 61.69 | 63.61 | 53.35 | 60.46 | 59.94 | 44.94 | 61.37 | 63.21 | 53.32 |
| 14 | 100 | 7.7 | 20 | 12.5 | 46.36 | 72.34 | 11.49 | 46.99 | 74.68 | 39.83 | 46.28 | 72.13 | 11.50 |
| 15 | 100 | 3 | 20 | 7.5 | 60.63 | 37.45 | 46.66 | 58.16 | 38.51 | 20.06 | 60.61 | 37.27 | 46.68 |
| 16 | 140 | 7.7 | 20 | 10 | 49.32 | 67.99 | 21.08 | 55.67 | 68.90 | 20.50 | 49.34 | 67.85 | 21.07 |
| 17 | 100 | 3 | 20 | 12.5 | 57.51 | 55.8 | 51.61 | 58.75 | 52.85 | 54.42 | 57.50 | 55.57 | 51.56 |
| 18 | 100 | 5.35 | 20 | 10 | 44.44 | 52.23 | 55.15 | 47.52 | 55.87 | 45.65 | 47.77 | 55.96 | 45.62 |
| 19 | 100 | 7.7 | 20 | 7.5 | 55.07 | 79.09 | 33.43 | 51.99 | 85.45 | 32.36 | 55.01 | 79.05 | 33.47 |
| 20 | 60 | 5.35 | 20 | 12.5 | 59.01 | 55.83 | 59.26 | 56.98 | 53.26 | 51.93 | 58.99 | 55.69 | 59.35 |
| 21 | 100 | 5.35 | 10 | 7.5 | 46.11 | 60.96 | 23.24 | 48.80 | 55.44 | 21.98 | 46.13 | 60.75 | 23.20 |
| 22 | 100 | 5.35 | 30 | 12.5 | 44.19 | 53.94 | 57.89 | 48.52 | 56.41 | 45.31 | 44.03 | 55.03 | 57.73 |
| 23 | 60 | 7.7 | 20 | 10 | 56.21 | 87.31 | 39.61 | 57.20 | 78.37 | 17.94 | 56.39 | 87.09 | 39.50 |
| 24 | 100 | 7.7 | 30 | 10 | 60.79 | 98.15 | 44.14 | 58.46 | 92.20 | 31.93 | 60.61 | 97.96 | 44.21 |
| 25 | 100 | 5.35 | 10 | 12.5 | 54.74 | 66.9 | 60.13 | 51.81 | 71.27 | 57.30 | 55.09 | 66.93 | 59.68 |
| 26 | 100 | 5.35 | 30 | 7.5 | 45.98 | 76.1 | 49.81 | 55.93 | 68.68 | 38.80 | 46.13 | 75.84 | 49.36 |
| 27 | 140 | 5.35 | 10 | 10 | 51.47 | 65.26 | 51.53 | 51.21 | 56.03 | 27.83 | 51.49 | 65.16 | 51.50 |
Table 2.
ANOVA results of the quadratic polynomial model for the photo-Fenton-like process of municipal wastewater.
Table 2.
ANOVA results of the quadratic polynomial model for the photo-Fenton-like process of municipal wastewater.
| Removal | Source | Sum of Squares | Degrees of Freedom | Mean Square | F-Value | p-Value |
|---|---|---|---|---|---|---|
| TC | Model | 1344.37 | 14 | 96.03 | 2.84 | 0.039 |
| Error | 405.90 | 12 | 33.83 | |||
| Lack of fit | 384.45 | 10 | 38.45 | |||
| Pure error | 21.44 | 2 | 10.72 | |||
| R2 = 0.7681 | ||||||
| TOC | Model | 6659.09 | 14 | 475.65 | 11.64 | <0.0001 |
| Error | 490.32 | 12 | 40.86 | |||
| Lack of fit | 462.84 | 10 | 46.28 | |||
| Pure error | 27.48 | 2 | 13.74 | |||
| R2 = 0.9314 | ||||||
| TN | Model | 4664.4 | 14 | 333.17 | 0.70 | 0.739 |
| Error | 5697.3 | 12 | 474.77 | |||
| Lack of fit | 5507.3 | 10 | 550.70 | |||
| Pure error | 190.3 | 2 | 95.14 | |||
| R2 = 0.4502 |
Table 3.
Optimum conditions found by RSM and ANN, and experimental validation for TC, TOC, and TN removals.
Table 3.
Optimum conditions found by RSM and ANN, and experimental validation for TC, TOC, and TN removals.
| Method | Removals, % | Reaction Time (min) | pH | K2S2O8, mM | Molar Ratio K2S2O8/Fe2+ | Actual | Predicted | Error |
|---|---|---|---|---|---|---|---|---|
| RSM | TC | 60 | 3 | 10 | 12.5 | 52.78 | 84.24 | 31.46 |
| TOC | 106.06 | 7.7 | 30 | 7.5 | 100 | 100 | 0 | |
| TN | 97.98 | 4.33 | 15.05 | 12.5 | 56.29 | 63.87 | 7.58 | |
| ANN | TC | 140 | 5.21 | 30 | 10.17 | 49.56 | 71.38 | 21.82 |
| TOC | 104.93 | 7.7 | 30 | 9.57 | 100 | 98.7 | 1.3 | |
| TN | 71.46 | 4.2 | 17.59 | 12.5 | 45.74 | 72.83 | 27.09 |
Table 4.
Characteristics of the used wastewater (No. of samples = 3).
| Parameter | Unit | Value |
|---|---|---|
| Chemical oxygen demand (COD) | mg L−1 | 33.5 ± 1.5 |
| Total carbon (TC) | mg L−1 | 118.5 ± 2.2 |
| Total organic carbon (TOC) | mg L−1 | 20.77 ± 1.7 |
| Total inorganic carbon (TIC) | mg L−1 | 98.03 ± 2.32 |
| Total nitrogen (TN) | mg L−1 | 37.49 ± 2.55 |
| pH | – | 7.75 ± 0.34 |
Table 5.
Independent variables and their levels.
| Symbol | Factor | Levels of Variables | ||
|---|---|---|---|---|
| −1 | 0 | +1 | ||
| A | Reaction time (min) | 60 | 100 | 140 |
| B | pH | 3 | 5.35 | 7.7 |
| C | K2S2O8/Fe2+ molar ratio | 7.5 | 10 | 12.5 |
| D | K2S2O8 concentration (mM) | 10 | 20 | 30 |
Table 6.
Independent variables and their levels.
| Parameter | Value |
|---|---|
| Cross-validation | k-fold methods (5 groups) |
| Hidden nodes | 5 to 20 |
| Number of models | 200 |
| Learning rate | 0.1 |
| Penalty method | squared |
| Number of tours | 4 |
| Transfer function | Tanh () |
Publisher’s Note: MDPI stays neutral with regard to jurisdictional claims in published maps and institutional affiliations. |
© 2021 by the authors. Licensee MDPI, Basel, Switzerland. This article is an open access article distributed under the terms and conditions of the Creative Commons Attribution (CC BY) license (https://creativecommons.org/licenses/by/4.0/).
Share and Cite
MDPI and ACS Style
Kanafin, Y.N.; Makhatova, A.; Zarikas, V.; Arkhangelsky, E.; Poulopoulos, S.G. Photo-Fenton-Like Treatment of Municipal Wastewater. Catalysts 2021, 11, 1206. https://0-doi-org.brum.beds.ac.uk/10.3390/catal11101206
AMA Style
Kanafin YN, Makhatova A, Zarikas V, Arkhangelsky E, Poulopoulos SG. Photo-Fenton-Like Treatment of Municipal Wastewater. Catalysts. 2021; 11(10):1206. https://0-doi-org.brum.beds.ac.uk/10.3390/catal11101206
Chicago/Turabian StyleKanafin, Yerkanat N., Ardak Makhatova, Vasilios Zarikas, Elizabeth Arkhangelsky, and Stavros G. Poulopoulos. 2021. "Photo-Fenton-Like Treatment of Municipal Wastewater" Catalysts 11, no. 10: 1206. https://0-doi-org.brum.beds.ac.uk/10.3390/catal11101206
Note that from the first issue of 2016, this journal uses article numbers instead of page numbers. See further details here.