Article

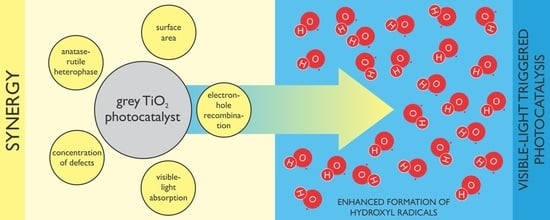
Defective Grey TiO2 with Minuscule Anatase–Rutile Heterophase Junctions for Hydroxyl Radicals Formation in a Visible Light-Triggered Photocatalysis

1
Laboratory for Environmental Sciences and Engineering, Department of Inorganic Chemistry and Technology, National Institute of Chemistry, Hajdrihova 19, SI-1001 Ljubljana, Slovenia
2
Department for Gaseous Electronics, Jožef Stefan Institute, Jamova 39, SI-1000 Ljubljana, Slovenia
3
Faculty of Chemistry and Chemical Engineering, University of Maribor, Smetanova 17, SI-2000 Maribor, Slovenia
4
Graduate School, University of Nova Gorica, Vipavska 13, SI-5000 Nova Gorica, Slovenia
*
Author to whom correspondence should be addressed.
Submission received: 26 October 2021 / Revised: 29 November 2021 / Accepted: 6 December 2021 / Published: 10 December 2021
(This article belongs to the Special Issue Engineering Materials for Catalysis)

Abstract

:
The novelty of this work was to prepare a series of defect-rich colored TiO2 nanostructures, using a peroxo solvothermal-assisted, high-pressure nitrogenation method. Among these solids, certain TiO2 materials possessed a trace quantity of anatase–rutile heterojunctions, which are beneficial in obtaining high reaction rates in photocatalytic reactions. In addition, high surface area (above 100 m2/g), even when utilizing a high calcination temperature (500 °C), and absorption of light at higher wavelengths, due to the grey color of the synthesized titania, were observed as an added advantage for photocatalytic hydroxyl radical formation. In this work, we adopted a photoluminescent probe method to monitor the temporal evolution of hydroxyl radicals. As a result, promising hydroxyl radical formations were observed for all the colored samples synthesized at 400 and 500 °C, irrespective of the duration of calcination.

Graphical Abstract

1. Introduction

The uniqueness of TiO2 in light-induced reactions, especially in photocatalysis, is unequivocally accepted, and this material is considered the most efficient photocatalyst due to its copious availability, low cost, non-toxicity, and photostability [1]. Among the various phases of TiO2, anatase is considered the most efficient and active photocatalytic phase [2]. The wide bandgap of anatase (3.2 eV) can efficiently reduce the electron–hole recombination as compared with rutile with narrower bandgap energy (3.0 eV) [3,4]. Anatase usually displays higher activity than rutile in photodegradation of environmental pollutants [5,6], while rutile is illustrated to be more active for photocatalytic water oxidation and overall water splitting [7,8]. Researchers have adopted various strategies for the synthesis of mixed-phase TiO2 structures. However, considerable photoactivity loss has been observed at higher proportions of rutile [4]. Therefore, it is necessary to manage the existence of the rutile phase in trace amounts. The anatase–rutile phase junction was first proposed by Zhang et al., based on the enhanced photocatalytic activity of anatase–rutile mixed-phase junction [9]. In such an anatase–rutile system, the rutile phase increases the stability, while anatase contributes to the increased photocatalytic activity. In addition, a heterophase junction formation between anatase and rutile can provide the transfer of photoinduced electrons at the anatase–rutile interface and thereby improve charge separation leading to further enhanced photocatalytic activity.
The color of material plays an important role in photocatalysis due to the absorption of visible light, which represents 43% of the overall solar spectrum [10,11]. TiO2 is known for its bright white color, which is the least absorption-effective color. Various techniques were proposed to generate color of TiO2 and thus increase the absorption of light, such as metal co-catalyst decoration and the treatment of TiO2 with gases such as hydrogen [12], nitrogen [13], and argon [14] under high- or low-pressure environments. Among them, inducing defects in TiO2 crystal structure has been found to be an effective method to increase absorption [11]. In this direction, yellow [15], blue [16], red [17], grey [18], brown [19], and black [20] TiO2 nanoarchitectures have been developed, and the mechanism of extended light absorption of colored titania was accounted by the generation of various defect states, such as Ti3+, oxygen vacancies, and other surface disorders [21]. Among the aforementioned methods, nitrogen doping is attractive because of its similar characteristics to oxygen, such as electronegativity, ionic radius, and electronic polarizability [10]. The p states in nitrogen can mix with the O 2p states, or the N 2p atomic orbitals can form a new valence band (VB) instead of the O 2p atomic orbitals and narrow the bandgap [22]. In nitrogen-doped black TiO2, the coexistence of nitrogen impurities and oxygen vacancies are responsible for visible light absorption and photocatalytic activity. In such an instance, oxygen vacancies are responsible for the visible light response, and nitrogen in the photocatalytic material inhibits oxidation of oxygen vacancies or the recombination of incited electrons and holes [23]. Hence, there is a synergistic effect to properly dope nitrogen and produce oxygen vacancies during the synthesis of a photocatalyst containing nitrogen. In addition, a heterophase structure containing anatase and rutile can provide the transfer of photoinduced electrons at the anatase–rutile interface and hence improve charge separation for photocatalysis, as mentioned before.
The peroxide-assisted method is considered the most efficient for the synthesis of the rutile TiO2 phase below the phase transition temperature. The H2O2 treatment on hydrolyzed titanium species followed by calcination at 400 °C leads to anatase–rutile mixed phase with efficient photocatalytic activity [24]. TiO2, obtained through exactly the same procedure except for the calcination temperature (viz. 300 °C), has also paved the way for anatase–rutile mixture, but with reduced rutile concentration [25]. There are reports based on the hybrids of such anatase–rutile structures with graphene oxide support for CO2 reduction [25,26]. Ullattil and Abdel-Wahab have recently developed self-oxygenated anatase–rutile phase junctions using a peroxide-assisted solvothermal strategy; it has been proven that anatase–rutile phase junctions are playing an important role in boosting the efficiency of photocatalysis [15]. Another version of TiO2 has been developed by a hydrothermal method, where a very small amount of hydrogen peroxide, with reactants such as TiCl3 and TiN, has been used to synthesize two sets of TiO2 nanocrystallites with anatase–rutile phase junctions [27]. In both sets of solids, the temperature was set 200 °C. These materials were used in the photocatalytic hydroxylation of terephthalic acid and hydrogen generation [27].
The presence of H2O2 in the liquid phase (formed via the activation of adsorbed oxygen molecules with conduction-band electrons) facilitates the formation of many hydroxyl radicals, which is the most common reactive oxidizing species that enables efficient photocatalytic reactions [28]. It has been proven that the concentration of hydroxyl radicals can be higher when the crystal phase is rutile or a mixture of anatase and rutile [29]. When the material is pure anatase, the scavenging of hydroxyl radicals with H2O2 occurs, leading to reduced hydroxyl radical formation [30]. Therefore, it is necessary to exploit the benefits of a visible light absorption and heterophase junction to obtain an active photocatalyst. It has been reported that the grey titania nanostructures yield stable photocatalytic performance in the absence of noble metals; the photoactivation was ascribed to the formation of surface defect states such as oxygen vacancies and trivalent titanium ions (Ti3+) [31]. These defect states can act as intrinsic co-catalytic centers to promote photocatalysis [32]. Furthermore, the heterophase junction between anatase and rutile improves the transfer of photoinduced electrons at the anatase–rutile interface and boosts the charge separation, leading to higher photocatalytic activity [4].
Based on these premises, the present manuscript explores the synthesis of anatase–rutile heterophase junctions below the anatase–rutile transition temperature (~600 °C) by a peroxo solvothermal-assisted high-pressure nitrogenation method. All TiO2 samples, including the sample treated at 500 °C for 4 h, possessed surface area above 100 m2/g, except for the TiO2 sample synthesized at 500 °C for 20 h (85 m2/g). Furthermore, we report on high defect concentration and reduced electron–hole recombination; all these features pave the way for promising hydroxyl radical concentration, detected using a photoluminescent probe method where coumarin was used as a probe molecule. Besides, coumarin is a water pollutant originating from pharmaceutical and personal care products (PPCPs), causing environmental concerns worldwide.

2. Results and Discussion

To synthesize the defect-rich grey titania nanoparticles, a peroxo solvothermal-assisted high-pressure nitrogenation method was utilized in this study. The incorporation of nitrogen was confirmed using CHN elemental analysis. It was found that, except for the pristine titania (PT), all other synthesized samples comprised of 0.7–3.2 wt.% of nitrogen (Figure S1). All the synthesized samples contained low amounts of carbon (below 0.6 wt.%) as a result of organic precursor used. As described below, the nitrogenation treatment of PT sample at temperature ≥ 400 °C induced the formation of grey titania with the presence of defects such as trivalent titanium ions (Ti3+) and oxygen vacancies, among which the titania samples synthesized at 500 °C possessed trace quantity of anatase–rutile heterophase junctions. The synthesis route adopted here passes through via a stable sol network such as the peroxotitanate complex sol. This stable and uniform gel formation can assist the retention of the anatase phase at higher temperatures. Such a uniform system is considered to have caused the reduction in the anatase-anatase contact points that possibly reduces the growth process of anatase particles and subsequently inhibit the rutile formation [33]. However, nitrogen acted as an anatase-to-rutile phase promoter by inducing defect states within the TiO2 crystal lattice [34].

2.1. Photocatalyst Characterization
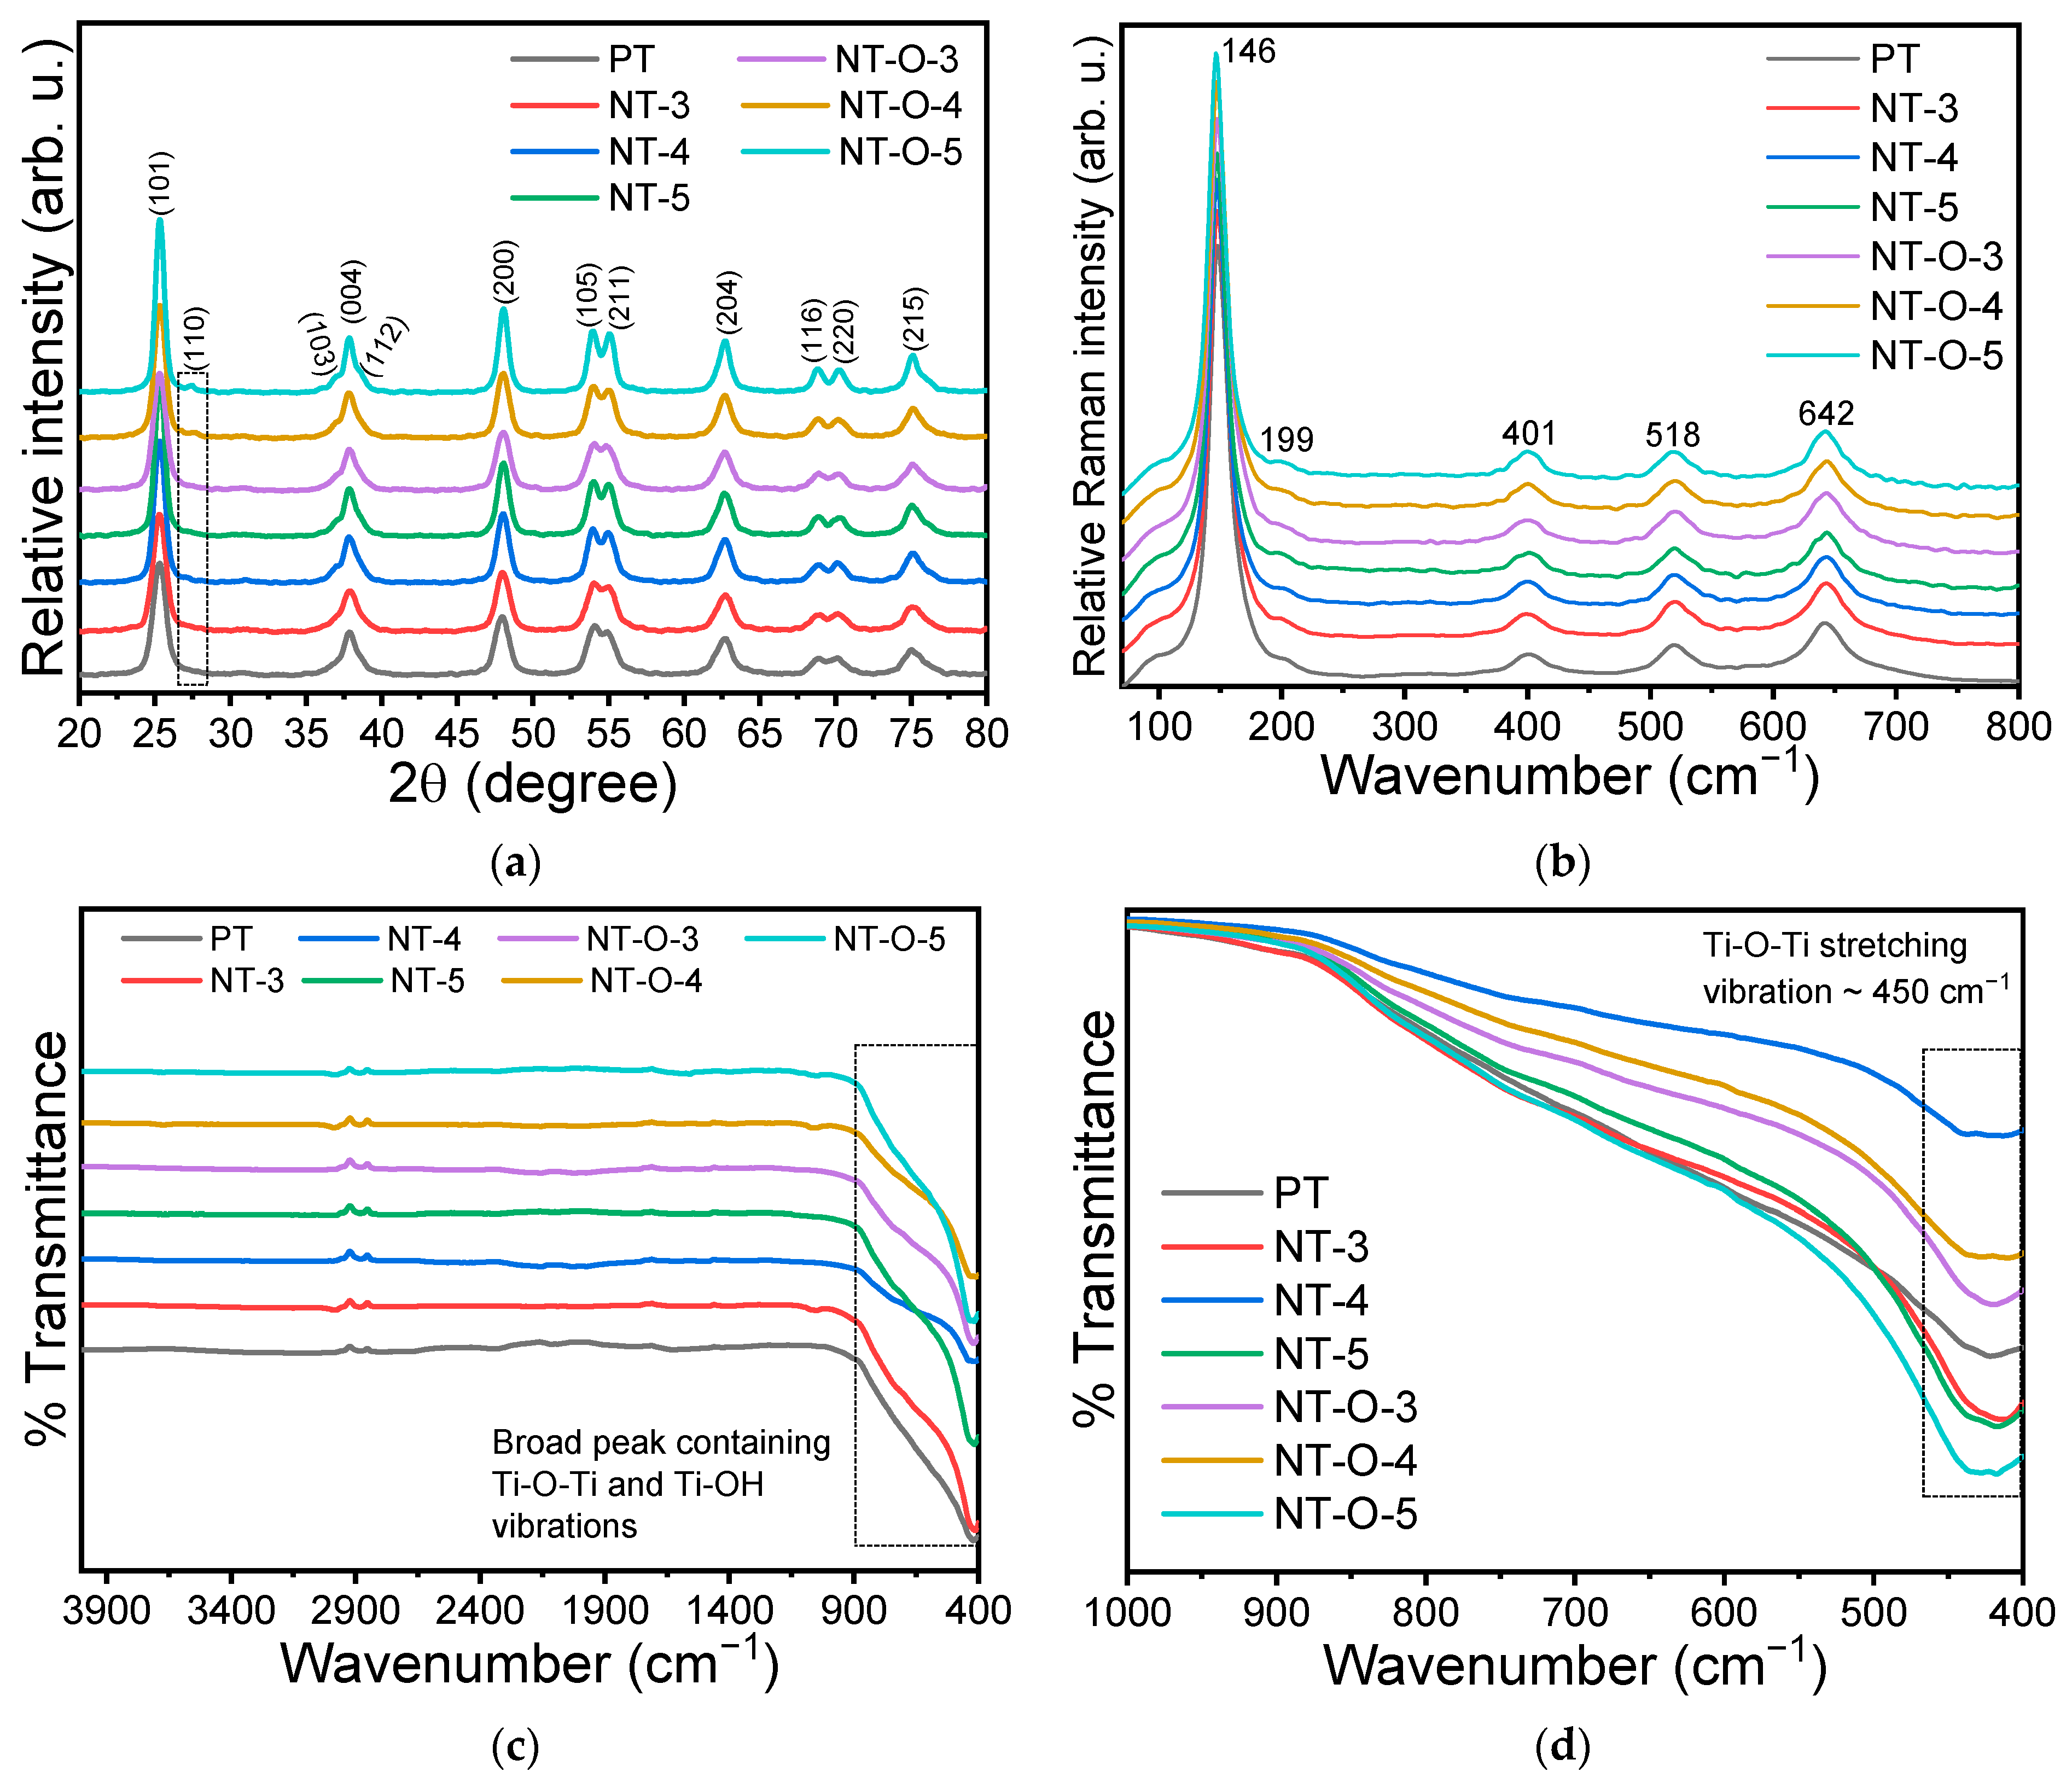
2.1.1. XRD Analysis

The results of XRD analysis of synthesized TiO2 samples are summarized in Figure 1a. All detected diffraction peaks correspond to TiO2-anatase and rutile, and no additional peaks or peak shifts were observed. Combining the results of the presence of nitrogen from CHN analysis with the XRD, it can be corroborated that the nitrogen atoms were incorporated at the interstitial positions of the TiO2 lattice instead of substituting oxygen [35]. It can be seen that TiO2 nanomaterials synthesized at lower temperatures contain only TiO2-anatase phase, whereas at higher treatment temperature, viz. at ≥400 °C, the trace amounts of rutile occurred (dotted box in Figure 1a (zoomed area in Figure S2) and listed in Table 1). TiO2 samples synthesized at 400 and 500 °C contain minor rutile phase, irrespectively of the reaction time, which underpins the ability of peroxide-assisted reactions to induce rutile phase below the anatase–rutile transition temperature (≥600 °C). The rutile concentration was found the highest for NT-O-4 sample and the lowest for NT-5 sample. It has also been reported that the concentration of rutile should be in trace amount as compared with anatase in an anatase–rutile heterophase system for facilitating a high rate of photocatalytic reactions [36]. The average crystallite size of all the samples was determined by Scherrer equation to be <10 nm, except for the NT-O-5 sample (Table 1), which is 11.6 nm, hence still in the range of accuracy of this method. Interestingly, it is evident from the previous report that H2O2 also acts as an effective crystallite-size reducer. The presence of hydrogen peroxide, even at low concentrations, can significantly reduce the crystal size of both anatase and rutile [27].

2.1.2. Raman Spectroscopy

The Raman spectra of all the TiO2 samples (Figure 1b) were recorded to identify the presence of TiO2 phases, but no noticeable peak of rutile was observed, which may be due to its low content. The Raman peaks present are at 146 (Eg), 199 (Eg), 401 (B1g), 518 (A1g + B1g), and 642 cm−1 (Eg) [37]. The characteristic peak of anatase at 146 cm−1 is sharp for all samples, which suggests that the crystallite sizes of the sample are similar [31]. This is in agreement with the values of average crystallite size, listed in Table 1. Except for this peak, all other peaks are broad, indicating the defective nature of TiO2 samples [38]. Furthermore, it can also be assumed that the trace rutile peak may be masked inside the broad anatase peaks.

2.1.3. FTIR Examination
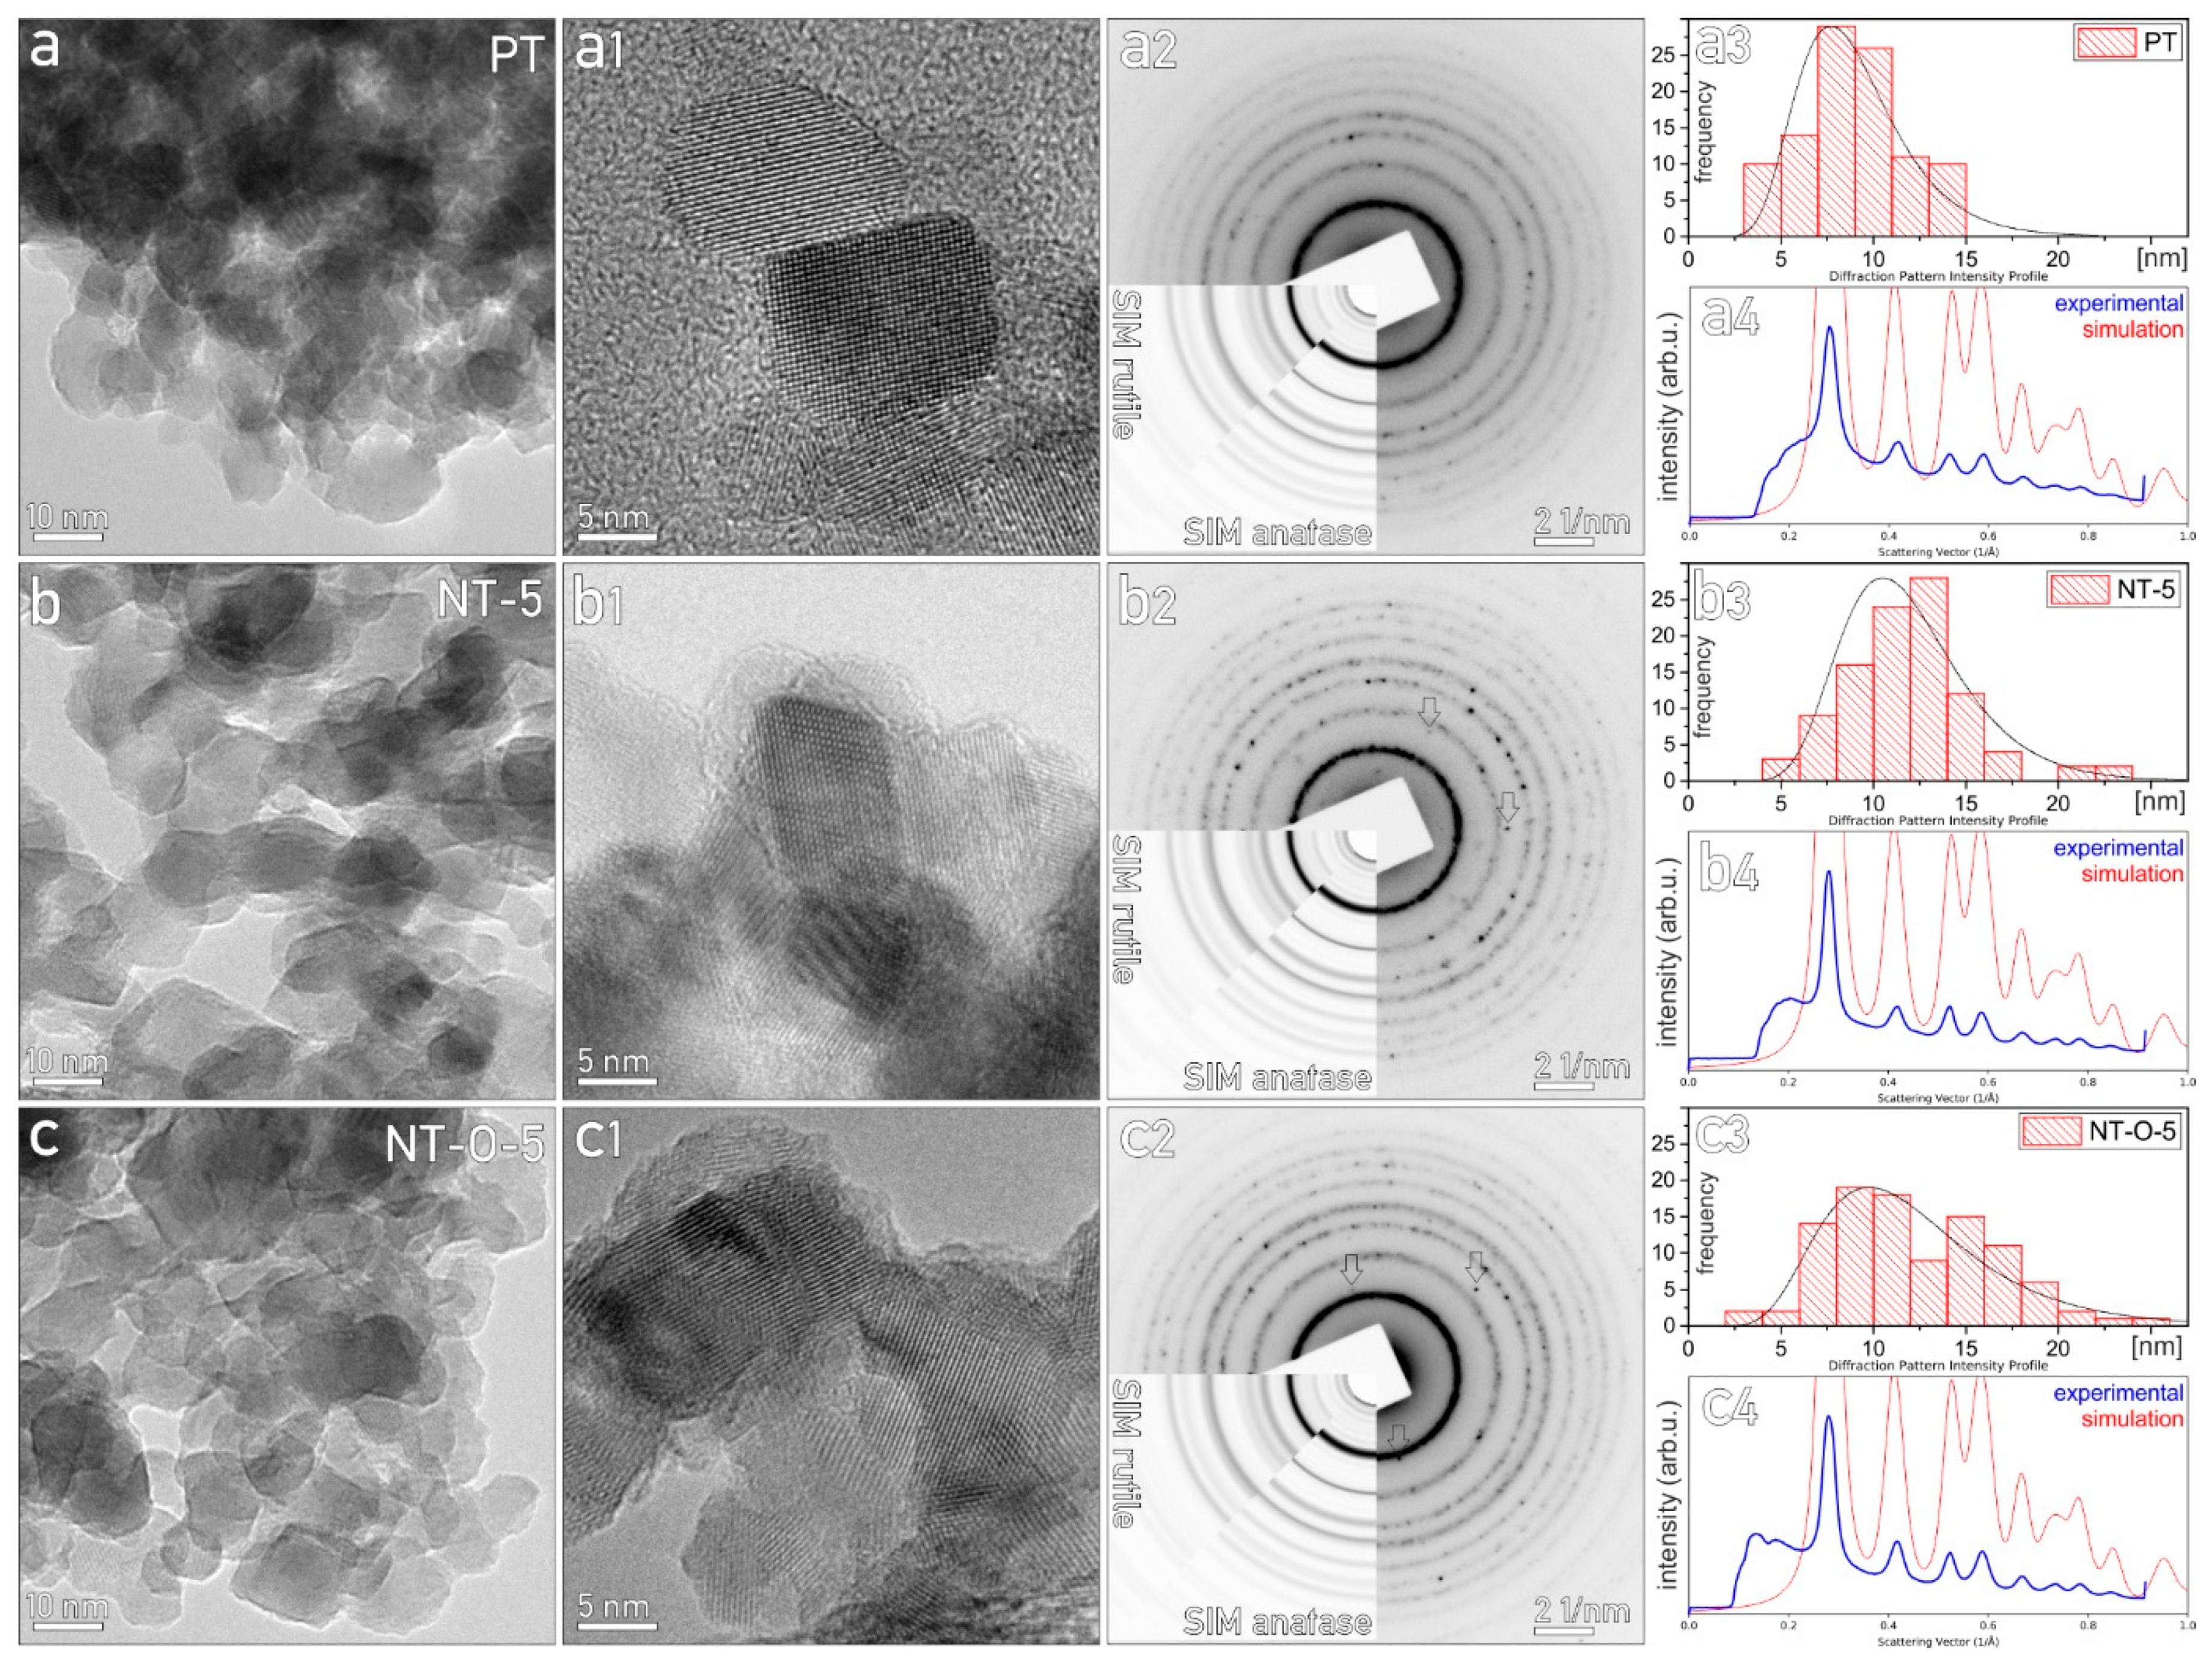
The FTIR spectra (Figure 1c) show a broad band from 900 to 400 cm−1 for all the TiO2 samples. The assigned peaks for the Ti-O-Ti stretching vibration are usually present at 450 cm−1, which is masked within the broad band [39]. The Ti-OH vibrations, generally present at 670 and 740 cm−1, may be present within the same broad band [40,41]. It can be perceived from Figure 1d that the Ti-O-Ti stretching band, indicating the Ti-O character, is most intense for NT-O-5 sample and the least intense for NT-4 solid. The order of Ti-O character is the following: NT-O-5 > NT-5 > NT-3 > PT > NT-O-3 > NT-O-4 > NT-4.

2.1.4. TEM Analysis

TEM analyses of samples PT, NT-5, and NT-O-5 are summarized in composite Figure 2. The overview conventional TEM micrographs (Figure 2a–c) visualize agglomerates of nanosized sphere-like irregularly shaped particles, with average particle size of about 10 nm. The small size of particles, even in samples treated at high temperature, is due to the pressurized condition during the photocatalyst preparation procedure. The particle size distribution histogram is embedded in Figure 2(a3–c3) and was calculated as Feret diameter size [42]. On the PT and NT-5 samples we can observe the formation of the crystal facets, while the crystal structure of the sample NT-O-5 appears to be disrupted, affecting the overall morphology of the crystallites (Figure 2(a1–c1)). The phase-contrast (HR-TEM) micrographs in combination with selected-area electron diffraction patterns (SAED, Figure 2(a2–c2)) were also used for phase identification: in PT sample the particles correspond to pure anatase, while in samples NT-5 and NT-O-5 majority of particles correspond to anatase, with sporadic rutile crystallites. On the SAED patterns, the characteristic rutile reflections are marked with arrows: the scattered electrons from abundant anatase particulates are forming continuous reflection circles, while several rutile crystallites only scatter isolated reflection dots. The intensity profile of SAED pattern, compared to simulated anatase profile, matches perfectly (Figure 2(a4–c4)).

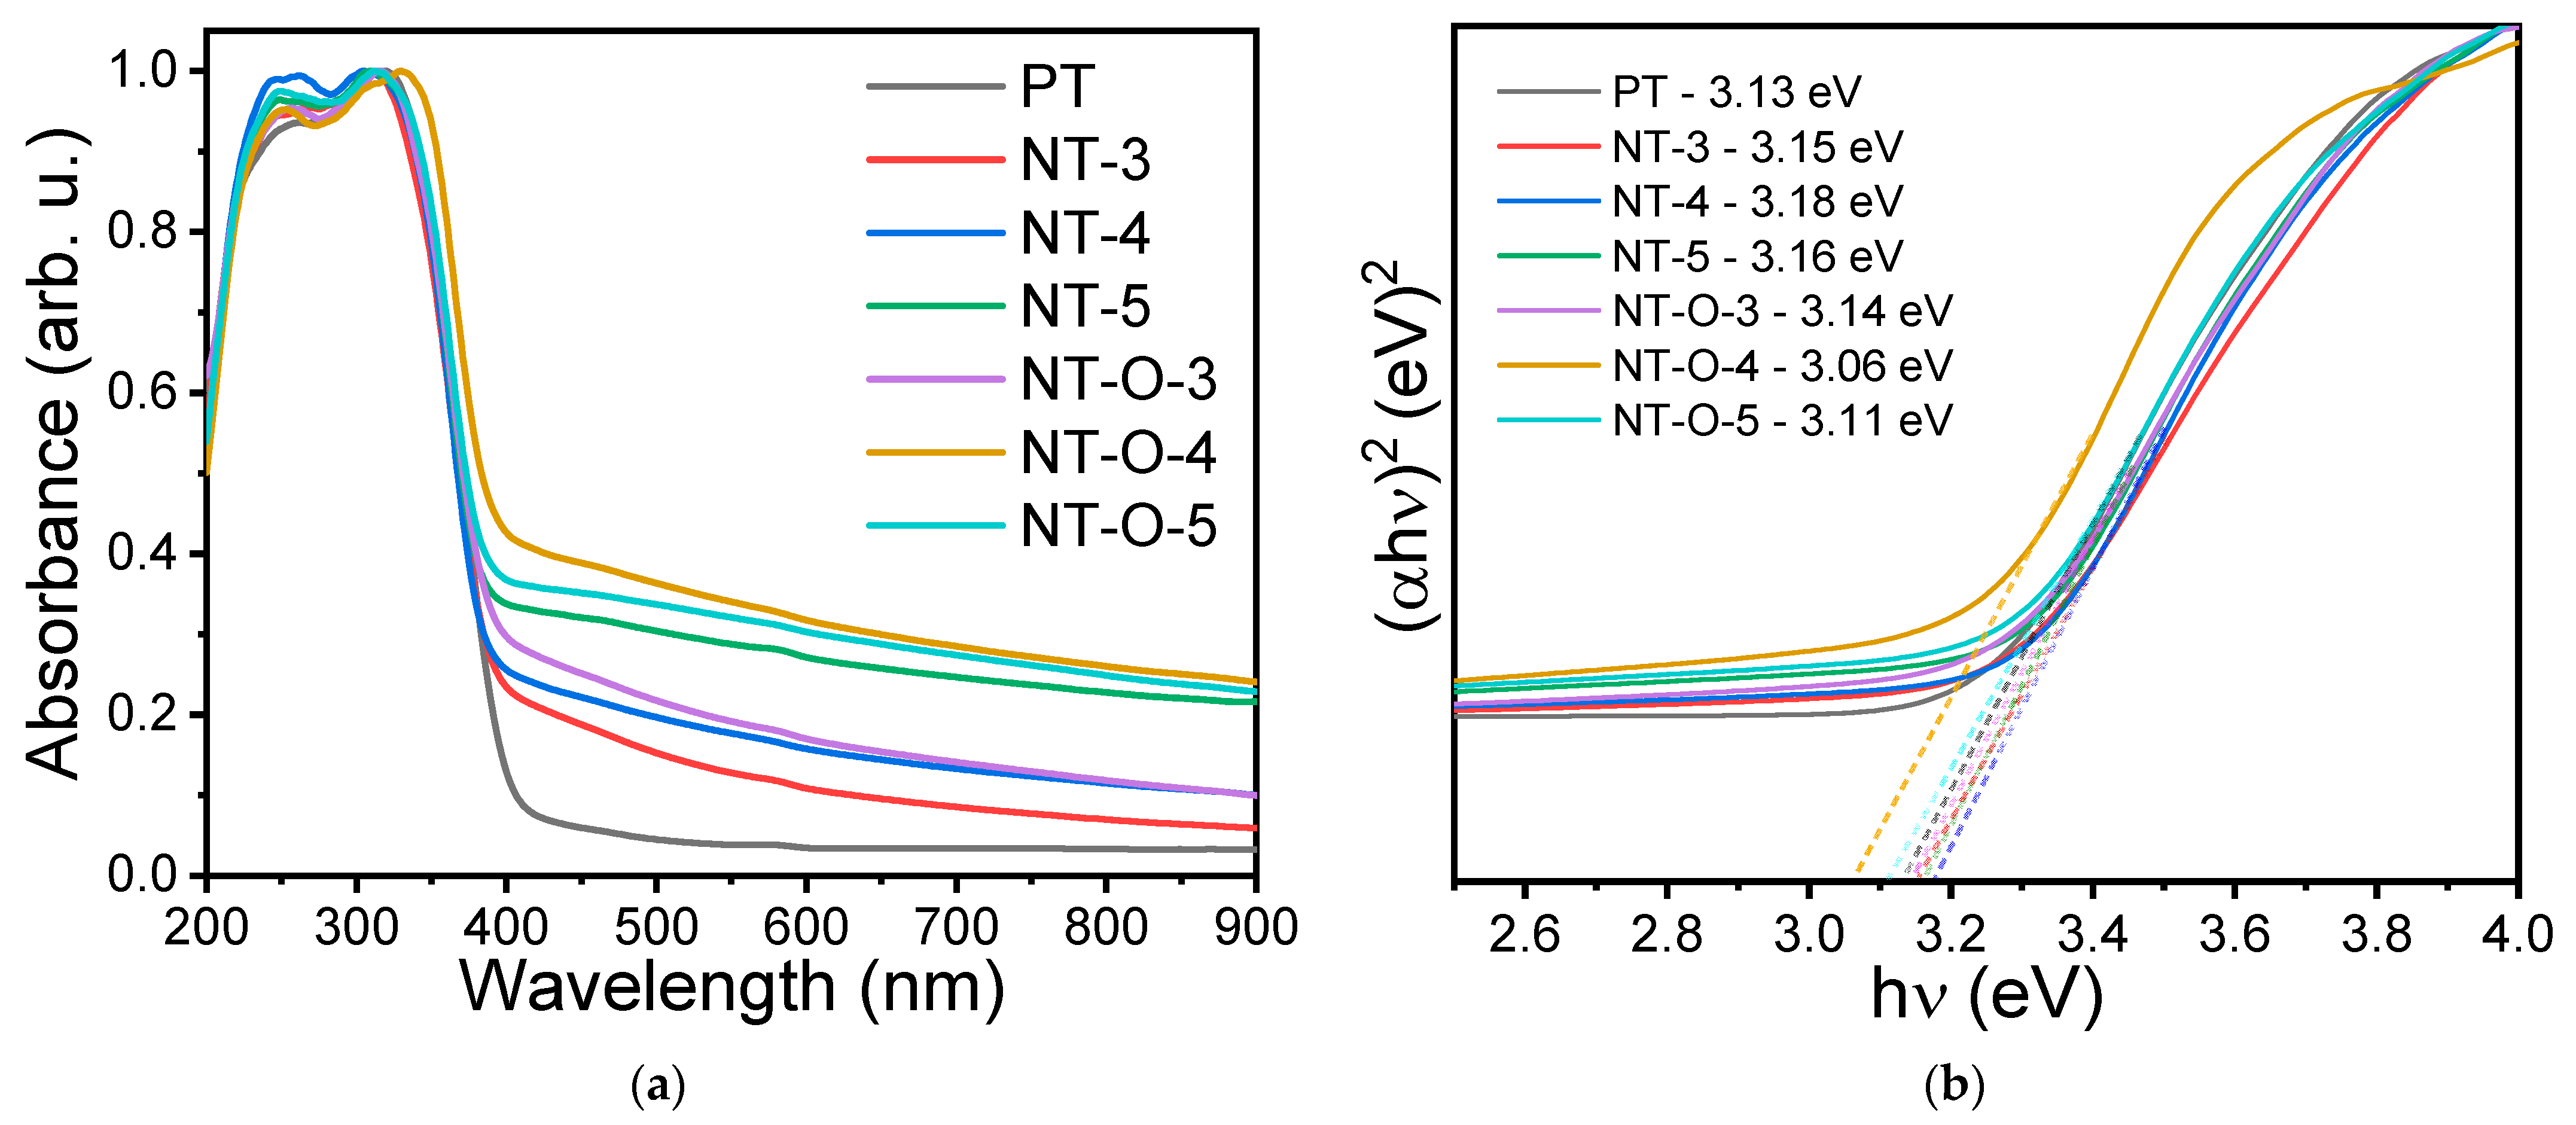
2.1.5. UV-Vis DR Analysis

The UV-Vis DR spectra are shown in Figure 3a. It is clearly visible that the absorption of visible light increased as the temperature during the peroxo solvothermal-assisted high-pressure nitrogenation treatment increases, obviously due to the change of color of PT sample to off white and then to grey. Moreover, the light absorption in the UV region (200–300 nm) is also increased for the nitrogenated samples. The absorption of visible light is the maximum in the case of NT-O-4 sample and slightly less in the case of NT-5 and NT-O-5 solids, although there is not much noticeable change in the wavelength cut-off. The Tauc plots are further shown in Figure 3b. One can see that the band gap energy of all materials falls under the range of 3.06–3.18 eV.

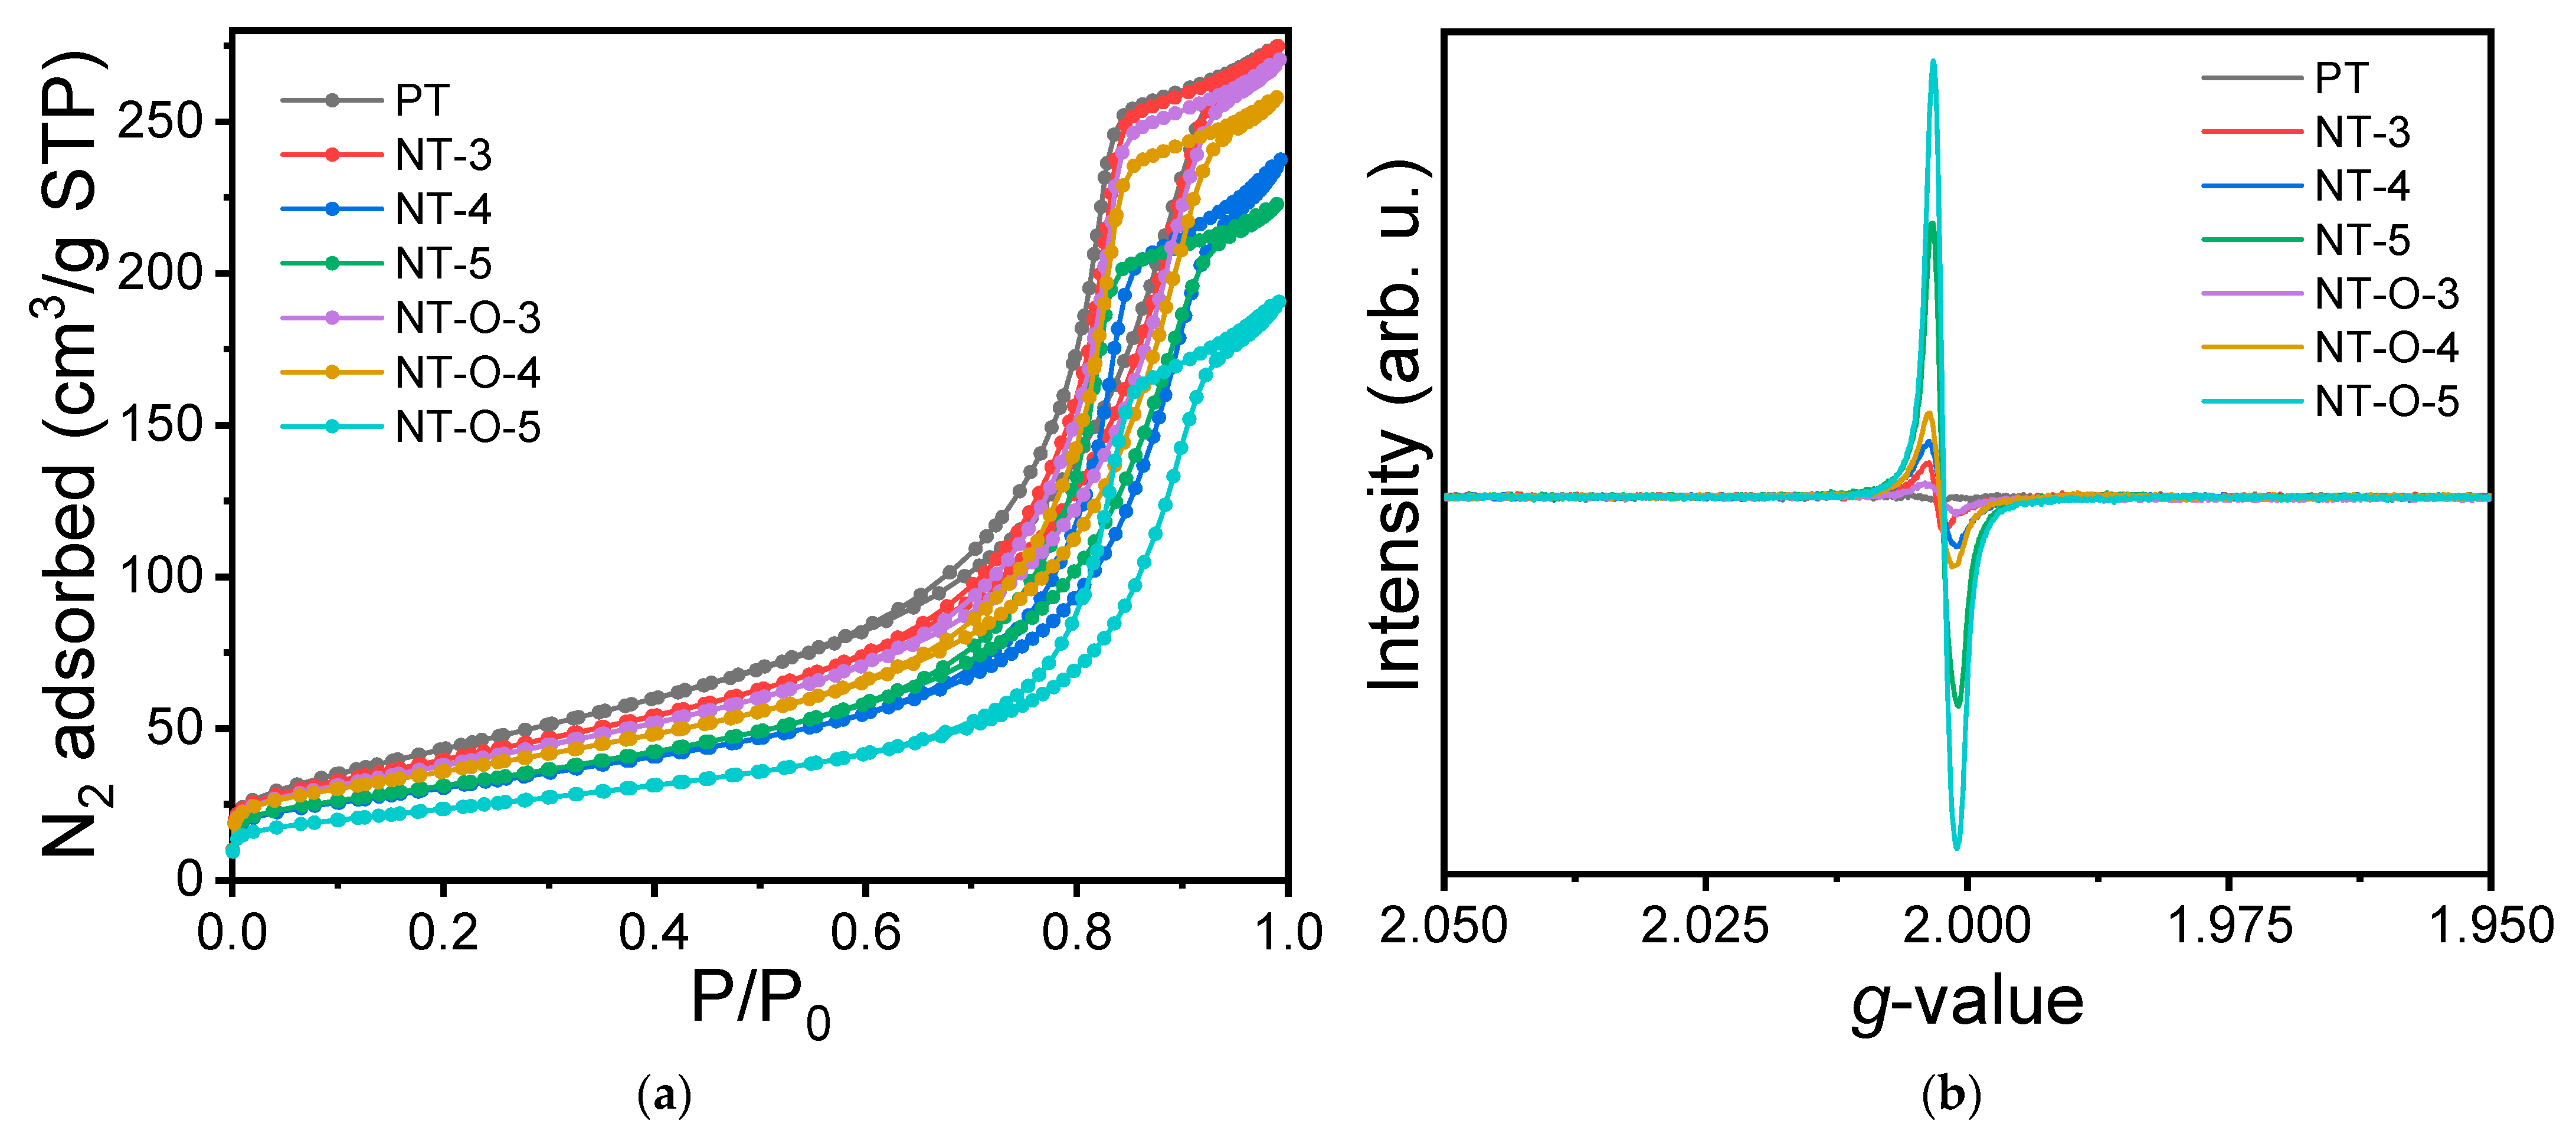
2.1.6. N2 Physisorption Analysis

The obtained nitrogen adsorption/desorption isotherms are illustrated in Figure 4a. The corresponding values of BET specific surface area, total pore volume, and average pore diameter are listed in Table 1. It can be seen in Figure 4a that the adsorption/desorption isotherms are of type 4, typical for mesoporous solids with limited pore size range. BET surface area measurements have shown interesting results that all the TiO2 samples have very high surface area (Table 1). Except the comparatively high crystalline NT-O-5 material, all other samples have surface area above 100 m2/g. The highest surface area is observed for PT sample having the lowest crystallinity. Owing to comparatively high crystallinity, NT-O-5 sample exhibited the lowest BET surface area of 85 m2/g. This is obviously due to the high crystallinity achieved by calcination carried out at 500 °C for 20 h. For illustration, the sample NT-5, synthesized at the same temperature with 4 h of thermal treatment, exhibited higher surface area of 114 m2/g.

2.1.7. EPR Examination

The EPR spectra were recorded to analyze the presence of defect states in the samples. The results are shown in Figure 4b. The analyzed g-values, signal widths, and intensities are listed in Table S1. No EPR signal was measured in the PT sample, but an isotropic signal with a g-value of ≈ 2.003 was measured in all nitrogenated samples. The signal can be attributed to the significant presence of oxygen vacancies. Previously, density functional theory calculations have also shown that nitrogen treatment leads to a decrease in the formation energy of oxygen vacancies, resulting in easier formation of oxygen vacancies [43]. Other paramagnetic centers, e.g., Ti3+, are not detected in the spectra measured at RT [44]. The intensity of the EPR signal is highest for the samples thermally treated at the highest temperature, i.e., 500 °C (NT-O-5 and NT-5), proving a high concentration of defect states in the material among the synthesized samples and consequently a stronger paramagnetic nature. Moreover, no change of signal intensity was observed when the samples were illuminated in an aqueous suspension for 180 min. The signal intensity decreases by 3 and 10 times when the temperature treatment of the samples is reduced to 400 and 300 °C, respectively. These results are consistent with the photocatalytic formation of hydroxyl radicals and the results of photoluminescence spectroscopy (see below).

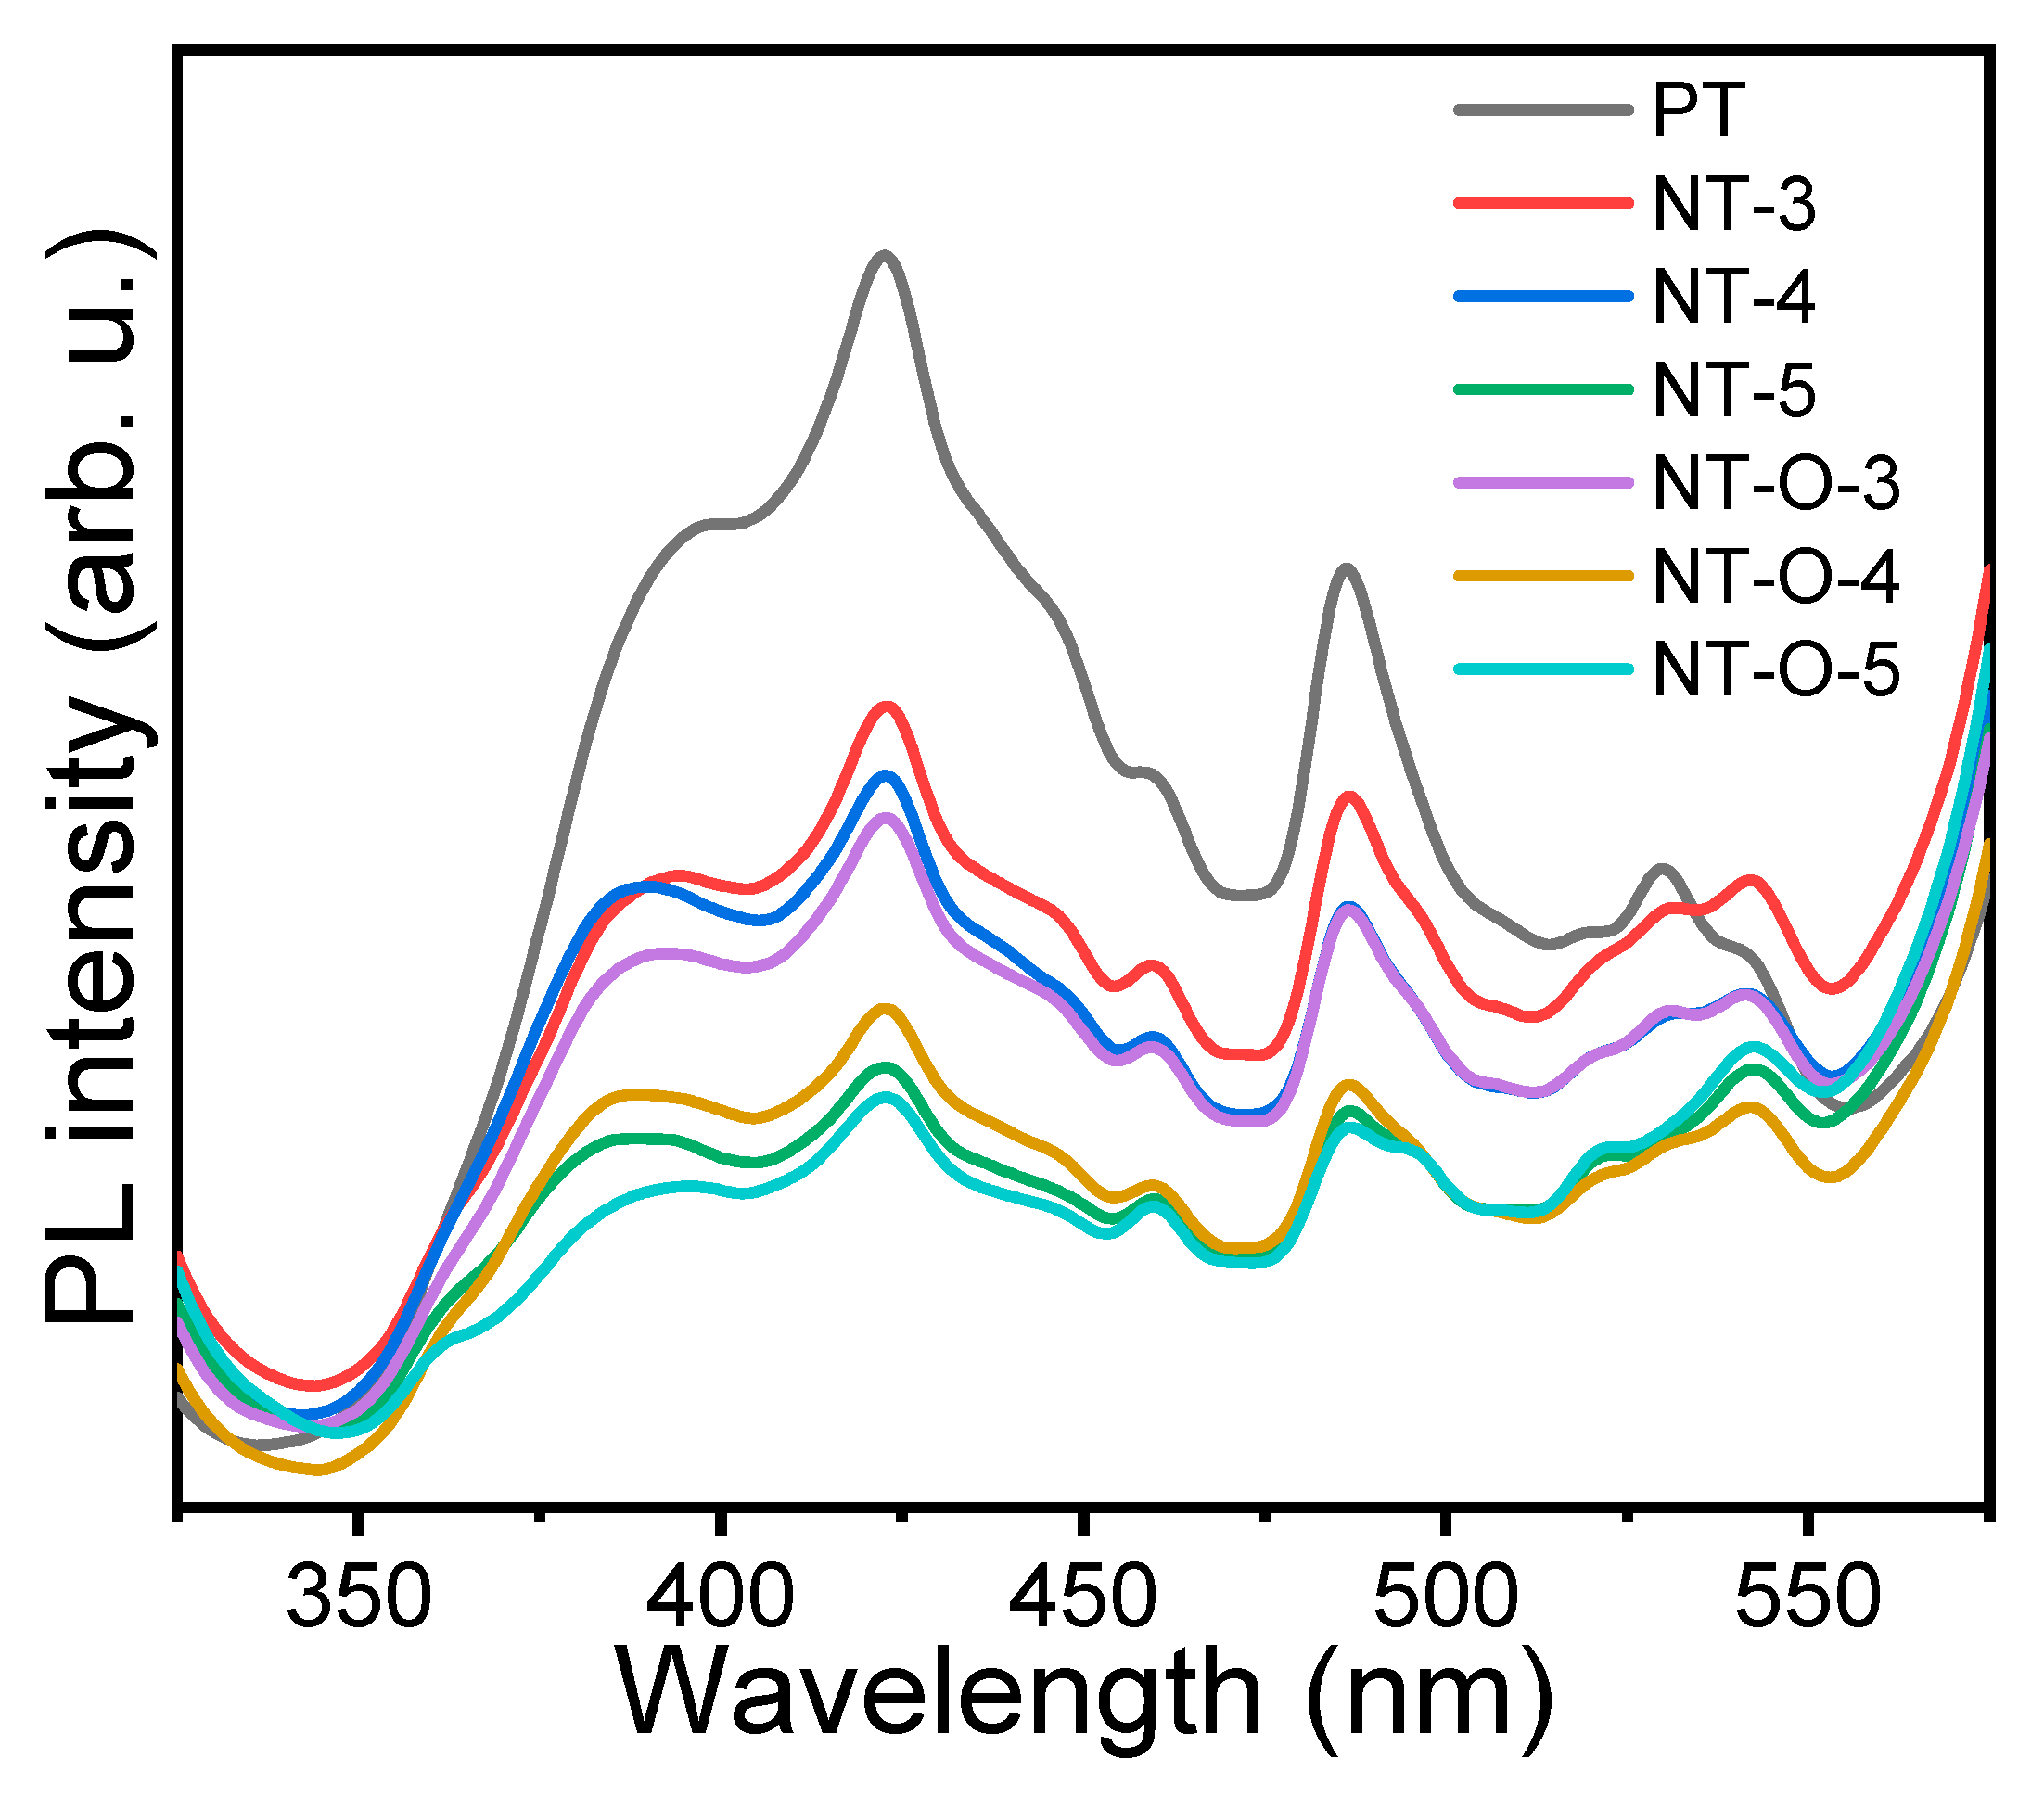
2.1.8. Photoluminescence Spectroscopy
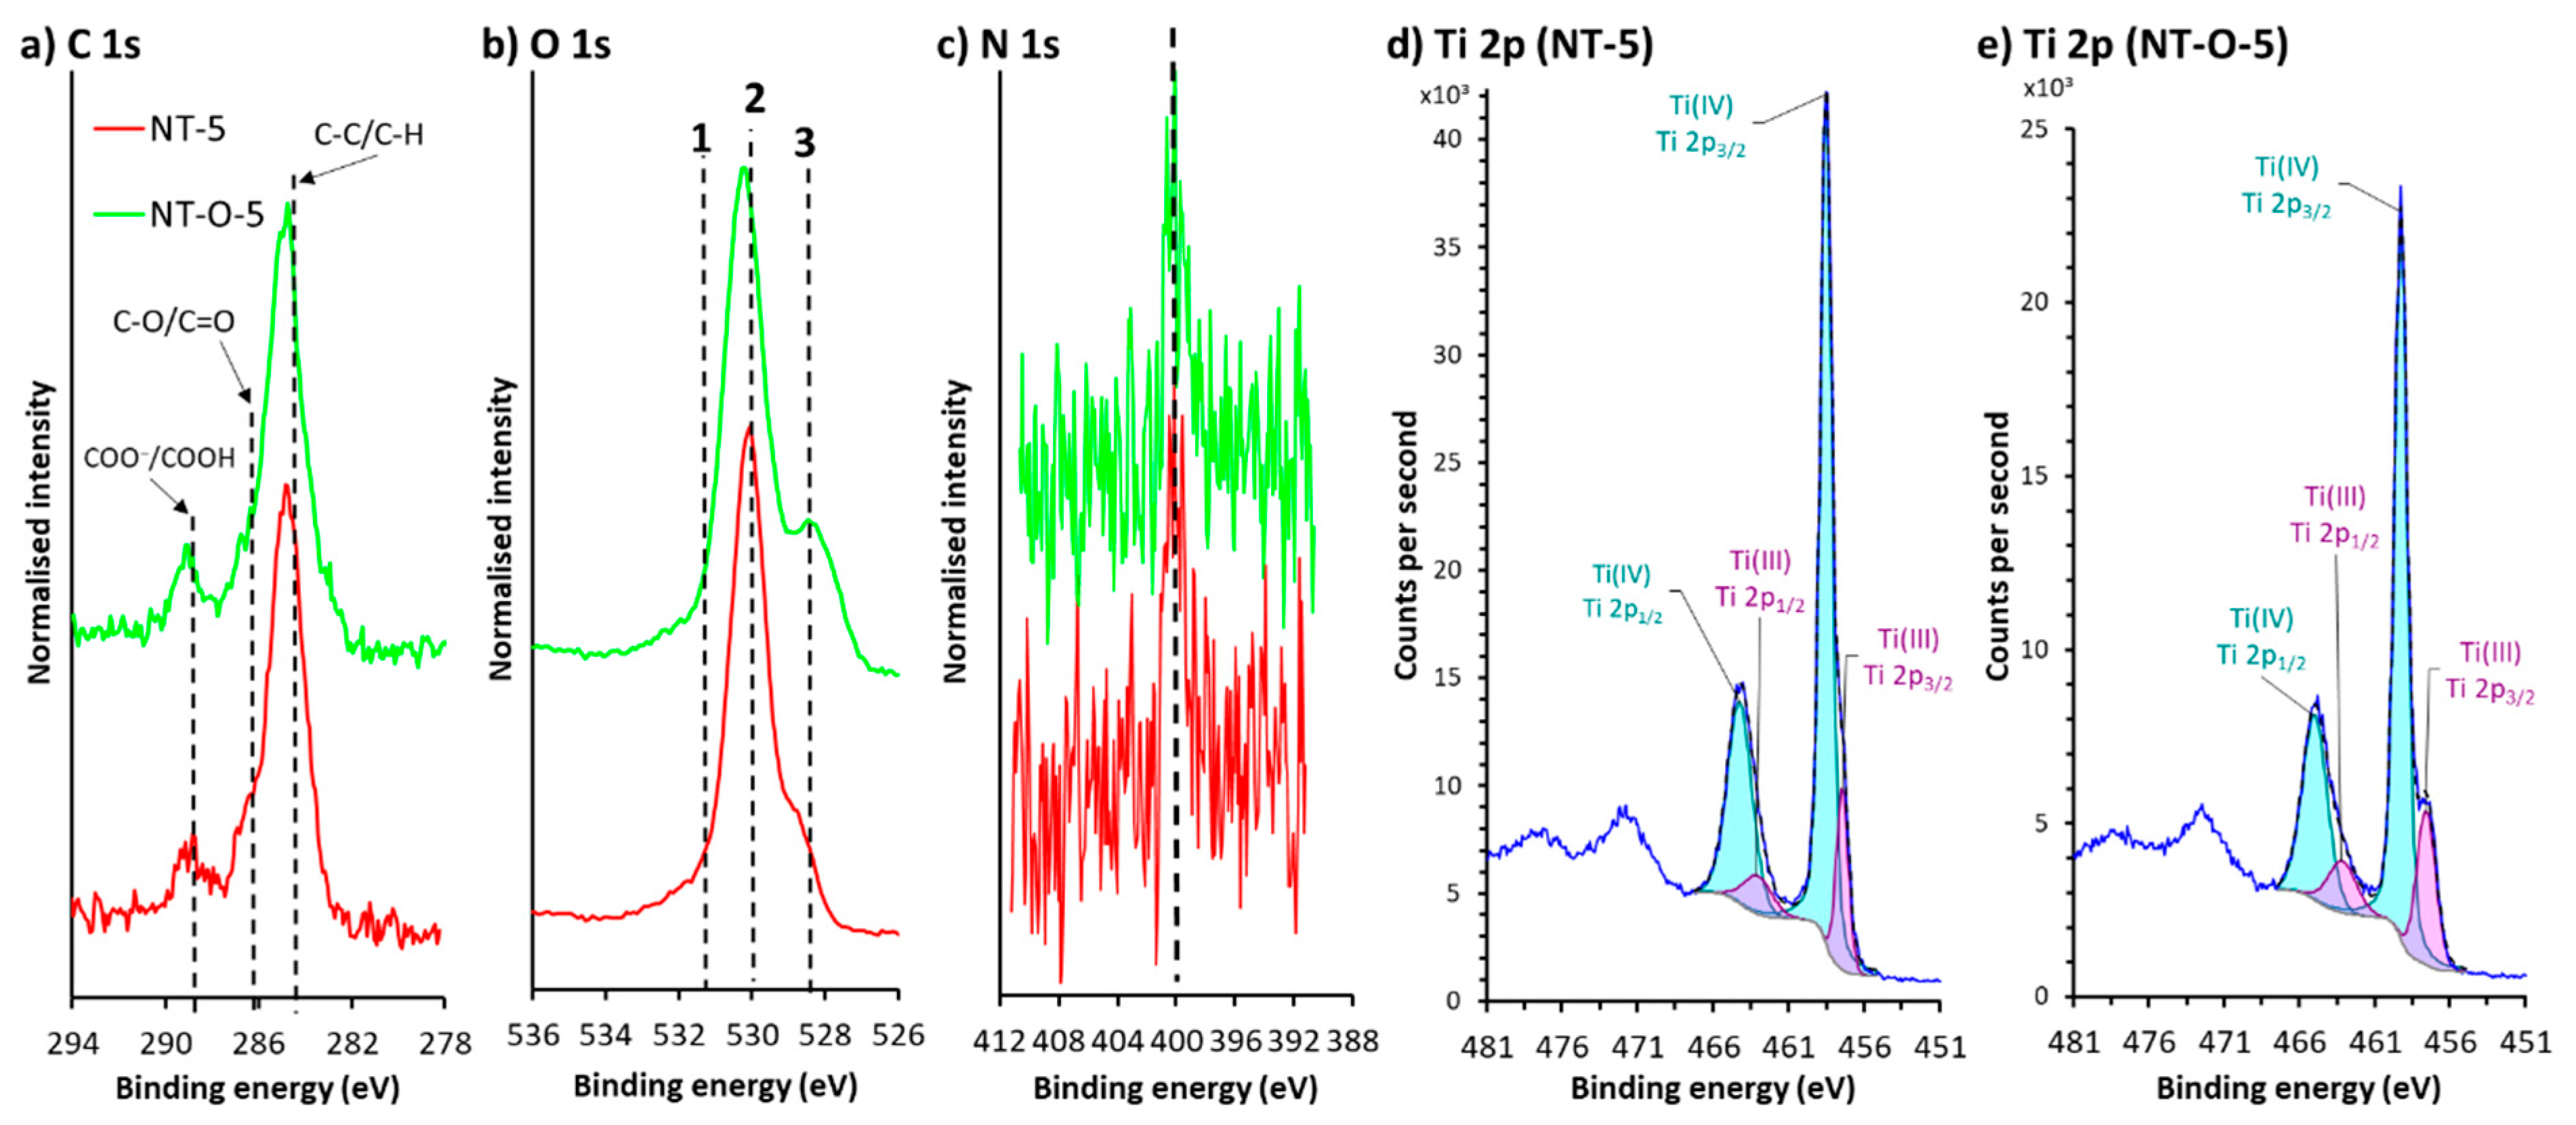
All TiO2 samples were tested for the magnitude of their electron–hole recombination rate. The results are presented in Figure 5. Additional peaks in the PL spectra of the TiO2 samples are due to the scattering of the weak Xe lamp emission passed through the excitation monochromator [45]. Hence, the overall intensity is only used to compare the magnitude of e-h+ recombination but not to give a detailed discussion about an origin of the PL bands. Since the photoluminescence emission results from the recombination of photoexcited electrons and holes, a lower overall intensity of the PL spectra indicates a lower recombination rate of the charge carriers and thus a higher separation rate [46,47]. It was found that the electron–hole recombination rate was significantly lower for all nitrogenated samples compared with the PT sample. A total PL intensity is lowest for the NT-O-5, NT-5, and NT-O-4 samples, followed by NT-O-3, NT-4, and NT-3 samples. The intensity systematically decreases with increasing oxygen defect concentration (EPR results), suggesting that the recombination rate of charge carriers is effectively suppressed upon nitrogenation and temperature treatment of the samples, as both induce the formation of surface defects, leading to improved electron–hole separation efficiency. Additionally, the broad band at about 530 nm rises only in the nitrogenated samples, but not in the pristine (anatase) titania. According to the literature [48], it can be assumed to originate from partially reduced titanium ions, self-trapped excitons, oxygen vacancies, and surface states, that additionally arise during nitrogenation.

2.1.9. XPS Analysis

Figure S4 shows survey spectra for PT, NT-5, and NT-O-5 samples. All survey spectra show signals for O 1s, Ti 2p, C 1s, Ti 3s, and Ti 3p. In the case of NT-5 and NT-O-5 samples, a low-intensity peak for N 1s was also present (seen more clearly in Figure 6). The O 1s signal mainly originates from TiO2 and to a lesser extent from the oxidized adventitious carbonaceous species, while the C 1s peak originates from adventitious carbonaceous species. This signal was also used to correct the binding energy scale of the survey and high-resolution spectra based on the main C-C/C-H peak at 284.8 eV. An intense Ti 2p signal with a distinct doublet is present in all survey spectra in 455–460 eV binding energy range. Additional Ti-related peaks were also present at more negative binding energies than that for Ti 2p, i.e., Ti 3s and Ti 3p peaks labeled in Figure S4. Ti-related signals originate from TiO2 compound.
Figure 6 shows high-resolution spectra for the powder samples NT-5 and NT-O-5 to further determine the oxidation state of the C-, O-, N-, and Ti-containing species. The high-resolution C 1s spectra consist of three spectral features shown with dashed lines in Figure 6a corresponding to COO/COOH, C-O/C=O, and C-C/C-H. These C-containing compounds originate from adventitious carbonaceous species and oxidized carbonaceous species adsorbed from the surrounding atmosphere after sample preparation. It is also possible that adventitious carbonaceous species were oxidized after adsorption. The high-resolution O 1s spectra in Figure 6b also consist of three spectral features, indicated by dashed lines 1–3. The most intense is spectral feature 2, which corresponds to O in TiO2. A low-intensity spectral feature at dashed line 1 corresponds to the oxidized C-containing species also identified in the C 1s spectra. The spectral feature at dashed line 3 is most likely from Ti-O-N [49]. Spectral feature 3 is more pronounced in NT-O-5 than in the sample NT-5. The latter explains the presence of N, since N was incorporated into these samples during the preparation procedure in N2 atmosphere. The N 1s spectra also support the latter, showing a low-intensity signal for N-containing species located at the dashed line in Figure 6c. High-resolution Ti 2p spectra are shown in Figure 6d,e for NT-5 and NT-O-5 samples, respectively. The Ti 2p spectra consist of two peaks, i.e., Ti 2p3/2 and Ti 2p1/2 separated by approximately 5.7 eV in the case of TiO2. An intensive Ti 2p3/2 peak corresponding to Ti(IV) is present for both samples. On the other hand, the spectra for both samples contained a feature on the low binding energy side of the main peak corresponding to Ti(III). The latter is more expressed for the NT-O-5 sample (Figure 6e). Fitting of the Ti 2p spectra was performed using the doublets for Ti(IV) and Ti(III) in Figure 6d,e [50]. Quantification of the oxidation states of Ti(IV) and Ti(III) revealed 17.8% Ti(III) and 82.2% Ti(IV) for the NT-5 sample, while 23.9% Ti(III) and 76.1% Ti (VI) were present for the NT-O-5 sample, indicating that more Ti(III)-containing species were formed in the case of the NT-O-5 sample.

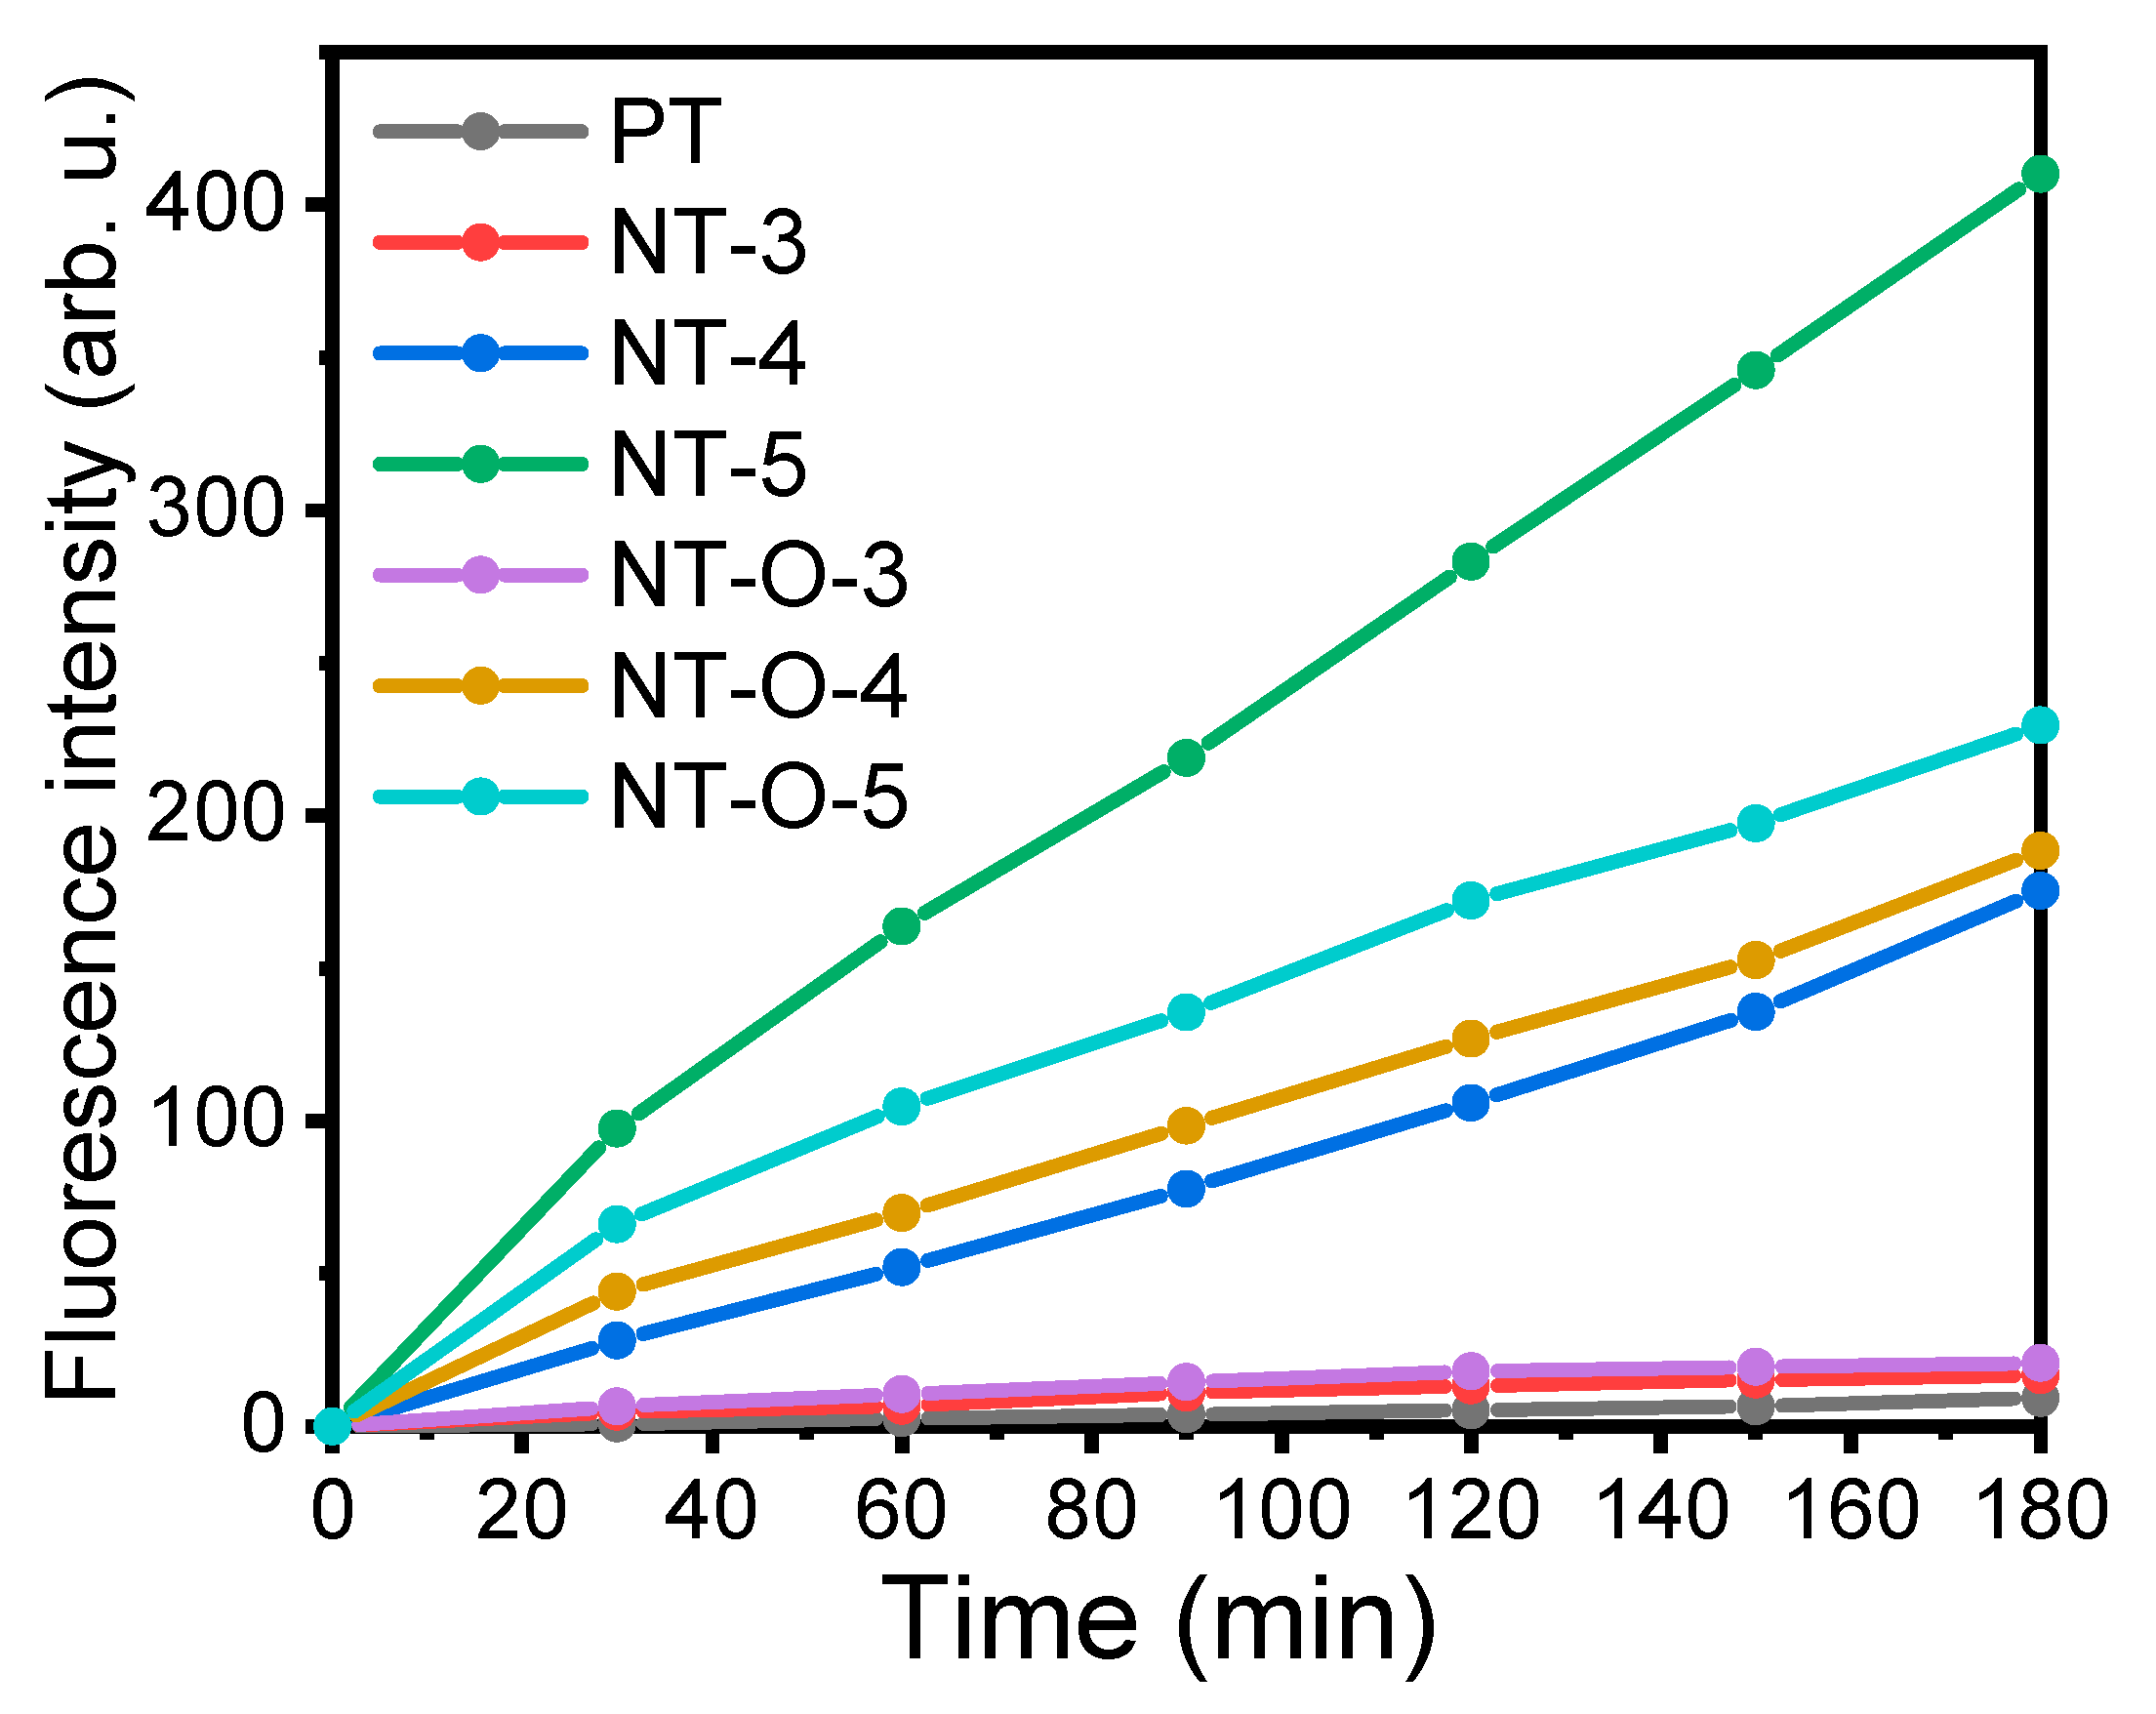
2.2. Photocatalytic Hydroxyl Radical Formation

The rate of formation of hydroxyl radicals was evaluated in this work as a function of the conversion of coumarin to 7-OHC [51]. It has been widely established that hydroxyl radicals, formed in the presence of an illuminated photocatalyst, can react with coumarin, which leads to the formation of 7-OHC. The obtained results are illustrated in Figure 7, and the initial rates of 7-OHC formation are listed in Table S2. The associated fluorescence intensity vs. wavelength spectra, used to calculate concentration–time profiles, depicted in Figure 7, are shown for all samples in Figure S3. Figure 7 is plotted as the fluorescence intensity vs. time, where the initial value of fluorescence intensity at 450 nm was subtracted from the fluorescence intensity measured for each withdrawn sample. It was found out by preliminary measurements (not shown) that the concerned experiments were carried out in the kinetic regime, which implies that the obtained dependencies are not influenced by mass-transfer resistances. Furthermore, the results of CHN elemental analysis of fresh and spent photocatalyst samples revealed that negligibly small amounts of coumarin and oxidation products were adsorbed on the photocatalyst surface, which could result in eventual photocatalyst deactivation. This is in agreement with low conversion of coumarin being in the range of a few percent [51].
The formation of hydroxyl radicals is in the given range of operating and reaction conditions and under visible light illumination the highest for NT-5 sample and the lowest for the parent solid PT (Figure 7). NT-O-5 sample also showed considerable efficiency, and samples such as NT-4 and NT-O-4 managed as well to harvest visible light for generation of hydroxyl radicals, but to a lower extent compared with NT-5 and NT-O-5 solids. All the materials were able to harvest visible light mainly due to their color change from white to off white and grey, thereby enabling visible light absorption. The highest wavelength absorption is observed for NT-O-4 sample, which is slightly higher than the most efficient photocatalyst NT-5. Although the latter exhibits slightly lower visible light absorption as compared with the NT-O-4 sample, its high surface area (111 m2/g), the second highest Ti-O character observed from the FTIR spectra, relatively high defect concentration obtained from EPR analysis, and the low electron–hole recombination, collectively played a vital role for the high rate of photocatalytic hydroxyl radical generation as compared with all other TiO2 samples. NT-O-5 sample also showed promising hydroxyl radical formation, but behind the NT-5 solid; its lower activity may be mainly due to the lowest surface area among the samples (Table 1) that could reduce the number of active sites. In addition to that, the redundant nitrogen content as evident from CHN elemental analysis (Figure S1), could subdue the separation and migration of e-h+ pairs and reduce the photocatalytic hydroxyl radical formation. It is also striking that the defect concentration of NT-5 sample is behind the NT-3 material. However, in the case of the NT-3 sample, relatively high defect concentration was not enough to cover its inability in harvesting visible light functionally due to its lowest visible light absorption and the high rate of electron–hole recombination.
Assimilating the above data, it has been proved that the extended visible light absorption due to grey color, rich defect concentration, high surface area, and low electron–hole recombination are responsible for the enhanced hydroxyl radical formation beneficial for photocatalysis (Figure 7). The interparticle electron transfer, enabled by the anatase–rutile heterojunction, resulted in more efficient electron–hole separation, which is confirmed with the results of PL measurements. It has also been reported that the trace amount of rutile can pave the way for high rate of photocatalytic reactions [4]. In anatase–rutile heterophase structures, the flow of electrons from rutile to anatase and simultaneously the transfer of holes is in the opposite direction, which promotes the separation of photoexcited electron–hole. To conclude, the high photoactivity of NT-5 sample is due to the synergistic effect of the anatase–rutile heterophase, relatively high defect concentration, reduced electron–hole recombination, high surface area, and the extended visible light absorption [15,29].

3. Materials and Methods

3.1. Synthesis of Photocatalysts

3.1.1. Materials

Titanium tetra isopropoxide (98%, p.a., Sigma-Aldrich, Saint Louis, MO, USA), isopropanol (p.a., Sigma-Aldrich, Saint Louis, MO, USA), and hydrogen peroxide (30%, Merck KGaA, Darmstadt, Germany) were purchased and used as received. Deionized water was used in all the experiments.

3.1.2. Synthesis of Pristine and Grey TiO2

50 mmol (14.2 g) of titanium tetra isopropoxide was mixed with 100 mL of isopropanol and stirred for 10 min. Then, 15 mL of 30% H2O2 was added to generate peroxotitanate complex in the form of a yellowish-orange sol. Stirring was continued, and another 15 mL of H2O2 was added after 5 min for the complete complex formation of titania. Stirring was carried out for a further 20 min, and the derived product was solvothermally treated at 150 °C for 22 h in a Teflon-lined autoclave. The samples were filtered and washed 4 times each with water and ethanol and dried at 90 °C for 2 h to obtain the pristine titania (PT). For modification, PT was inserted into a metallic tubular reactor (Microactivity Reference, PID Eng&Tech, Madrid, Spain) and nitrogen was purged at a rate of 100 mL/min under 15 bar at different temperature regimes, such as 300–500 °C for 4 and 20 h. The synthesized TiO2 samples are named as NT-3, NT-4, and NT-5 (i.e., TiO2 synthesized at 300, 400, and 500 °C for 4 h), and NT-O-3, NT-O-4, and NT-O-5 (i.e., TiO2 synthesized at 300, 400, and 500 °C for 20 h). After the reaction was completed, the reactor was allowed to cool down to ambient temperature (~ 50 °C), and the over-pressure was released to zero. The samples synthesized at 300 °C were off white but the samples synthesized at 400 and 500 °C were grey, irrespective of the reaction time.

3.2. Photocatalyst Characterization

The crystallinity and phase composition of TiO2 samples was characterized by powder X-ray diffraction (XRD; X‘pert PRO MPD, PANanalytical, Almero, The Netherlands) utilizing Cu Kα radiation (1.54056 Å) in reflection geometry (range between 20 and 80° in steps of 0.0341°). The amount of anatase in the samples was estimated by using the Spurr equation [52]:
F A = 100 ( 1 1 + 0.8 [ I A ( 101 ) / I R 110 ] ) 100
where FA is the mass fraction of anatase in the sample, and IA(101) and IR(110) are the integrated main peak intensities of anatase and rutile, respectively.
The CHN elemental analysis of samples was performed using an analyzer from Perkin–Elmer (Waltham (MA), USA, model 2400 Series II CHN). Cystine (99.9%, p.a., Perkin–Elmer, Shelton (CO), USA) was used as a calibration standard.
The BET (Brunauer, Emmett, and Teller) surface area, total pore volume and average pore size measurements were performed by nitrogen physisorption at -196 °C (TriStar II 3020, Micromeritics, Norcross, GA, USA).
The crystallinity, phase composition, and morphology of the nanoparticles were analyzed by transmission electron microscope (TEM; JEM-2100, Jeol Ltd., Tokyo, Japan), operating at 200 kV. The micrographs were recorded by a slow-scan CCD camera (Orius SC1000, Gatan Inc., Pleasanton, CA, USA). The powdered samples were first diluted in EtOH(abs), sonicated in an ultrasonic bath, and transferred onto Cu-supported amorphous carbon grids.
The formation of TiO2 was additionally confirmed by measuring the FTIR spectra using a Perkin–Elmer spectrometer (Waltham, MA, USA, model Frontier) in the range of 4000–400 cm−1. Raman spectra were recorded with a Raman/AFM instrument (Alpha 300RAS, WITec, Ulm, Germany) with a green laser emitting light at 532 nm and 5 mW with an integration time of 10 s.
The UV-Vis diffuse reflectance (DR) measurements of synthesized samples were recorded with a Perkin–Elmer UV-Vis spectrophotometer (Waltham, MA, USA, model Lambda 35) equipped with the accessory for powdered samples (Labsphere, North Sutton, NH, USA, model RSA-PE-19M Praying Mantis). The measured wavelength range was 200–900 nm, and Spectralon® was used for the background correction. The bandgap calculation was done using the Tauc equation [53].
Continuous wave EPR measurements were performed in X-band mode (microwave frequency of 9.5 GHz) using an EPR spectrometer from Adani Systems (Minsk, Belarus, model CMS 8400). The samples were measured in powder form at room temperature. The masses of the selected samples in the 3.8 mm thin-walled precision quartz EPR sample tubes (Fluorochem Ltd., Derbyshire, United Kingdom) were equal (38 mg). All EPR experiments were repeated 10 times. The experimental EPR spectra were analyzed in Matlab using EasySpin 5.2.33 toolbox [54] (g-value, linewidth Γ-peak-to-peak width of the measured first derivative of the EPR spectrum and intensity I-area under the absorption line).
The photoluminescence (PL) measurements of solid samples were recorded at ambient conditions using a UV-Vis photoluminescence spectrophotometer (LS 55, Perkin–Elmer, Waltham, MA, USA).
XPS analyses were performed using a Supra+ XPS instrument (Kratos, Manchester, UK) equipped with an Al Kα excitation source and a monochromator. Measurements of the powder samples were performed on a 300 by 700 micrometer spot at a 90° take-off angle. Pass energy of 160 eV and 20 eV was used to measure survey spectra and high-resolution spectra, respectively. Data acquisition and processing was performed using ESCApe (Kratos, Manchester, UK).

3.3. Photoluminescence Probe Method

The hydroxyl radical formation was indirectly measured at T = 25 °C by using a photoluminescence probe method with coumarin (COUM, 98%, p.a., Alfa Aesar, Kandel, Germany) as a probe compound. A measure of 40 mg of the photocatalyst was dispersed in 50 mL of an aqueous solution containing 1.4 mM coumarin. The suspension was vigorously stirred in the dark for 30 min before being exposed to visible light illumination (irradiance of 0.2 W/m2). The visible light source was a lamp from Schott (KL 1600 LED (T = 5600 K), Mainz, Germany) with light emission in the wavelength (λ) range of 400–650 nm; the spectrum of the light source is provided in Figure S5. The aliquots of liquid-phase samples were collected in each 30 min time interval immediately after filtering the aqueous suspension through a regenerated cellulose membrane filter of pore size of 0.2 μm. The samples were then analyzed by recording the photoluminescence signal of 7-hydroxy coumarin (7-OHC) using the photoluminescence spectrophotometer. Analysis was carried out using an excitation wavelength of 315 nm. Other parameters such as the scanning speed and slit width were set as 200 nm/min and 5 nm, respectively. The generation of hydroxyl radicals was confirmed by the formation of 7-OHC, which was perceived from the variation of peak intensity at ~450 nm.

4. Conclusions

A peroxo solvothermal-assisted, high-pressure nitrogenation method was developed for the synthesis of promising TiO2 photocatalysts. The presented method has been found advantageous for the manipulation of grey TiO2 with enhanced light absorption in the visible region below the anatase-to-rutile transition temperature. The TiO2 sample treated at 500 °C for 4 h possessed high surface area of 111 m2/g and reliable defect concentration, which resulted in the highest activity for the formation of hydroxyl radicals among solids investigated. This synthesis approach puts a new strategy on the table for inducing pronounced defective sites in TiO2 and achieve high BET surface area (above 100 m2/g) along with the presence of trace amount of anatase–rutile heterophase junctions. These features in turn enable the generation of enhanced amount of hydroxyl radicals and will definitely pave the way for enhancing the rate of visible light-assisted photocatalytic reactions.

Supplementary Materials

The following are available online at https://0-www-mdpi-com.brum.beds.ac.uk/article/10.3390/catal11121500/s1, Table S1: Calculated g-values, line width Γ (peak-to-peak width of measured EPR spectra) for isotropic broadening, and intensities evaluated from the double-integrated EPR spectra. The uncertainties of the last digit are given in parenthesis, Table S2: Initial rates of 7-OHC formation obtained during the photocatalytic oxidation of aqueous solution of coumarin in the presence of investigated TiO2 photocatalysts under visible light illumination, Figure S1: Results of CHN elemental analysis of fresh TiO2 samples, Figure S2: Zoomed XRD diffractograms of solids examined in the present study in the range of 22–30°, Figure S3: Photoluminescence spectra obtained during the photocatalytic oxidation of aqueous solution of coumarin conducted in the presence of investigated TiO2 samples, Figure S4: Survey XPS spectra measured for PT, NT-5, and NT-O-5 samples, Figure S5: Energy spectrum of LED lamp (KL 1600 LED, Schott, Mainz, Germany) used in the present study.

Author Contributions

Conceptualization, S.G.U.; methodology, A.P.; investigation, S.G.U., J.Z., K.M. and M.F.; resources, J.Z., M.F. and A.P.; data curation, S.G.U.; writing—original draft preparation, S.G.U.; writing—review and editing, J.Z., S.G.U., K.M., M.F., N.N.T. and A.P.; supervision, N.N.T. and A.P.; project administration, A.P.; funding acquisition, A.P. All authors have read and agreed to the published version of the manuscript.

Funding

The authors acknowledge the financial support from the Slovenian Research Agency (research core funding no. P2-0150 and P2-0032). The project is co-financed by the Republic of Slovenia, the Ministry of Education, Science and Sport, and the European Union under the European Regional Development Fund.

Data Availability Statement

Data is contained within the article and the Supplementary Materials.

Conflicts of Interest

The authors declare that they have no known competing financial interests or personal relationships that could have appeared to influence the work reported in this paper.

References

  1. Schneider, J.; Matsuoka, M.; Takeuchi, M.; Zhang, J.; Horiuchi, Y.; Anpo, M.; Bahnemann, D.W. Understanding TiO2 Photocatalysis: Mechanisms and Materials. Chem. Rev. 2014, 114, 9919–9986. [Google Scholar] [CrossRef] [PubMed]
  2. Katal, R.; Masudy-Panah, S.; Tanhaei, M.; Farahani, M.H.D.A.; Jiangyong, H. A review on the synthesis of the various types of anatase TiO2 facets and their applications for photocatalysis. Chem. Eng. J. 2020, 384, 123384. [Google Scholar] [CrossRef]
  3. Hanaor, D.A.H.; Sorrell, C.C. Review of the anatase to rutile phase transformation. J. Mater. Sci. 2011, 46, 855–874. [Google Scholar] [CrossRef] [Green Version]
  4. Wang, Q.; Fang, X.; Hao, P.; Ren, H.; Zhao, Y.; Huang, F.; Xie, J.; Cui, G.; Tang, B. Controllable fabrication of TiO2 anatase/rutile phase junctions by a designer solvent for promoted photocatalytic performance. Chem. Commun. 2020, 56, 11827–11830. [Google Scholar] [CrossRef]
  5. Bilecka, I.; Barczuk, P.J.; Augustynski, J. Photoanodic oxidation of small organic molecules at nanostructured TiO2 anatase and rutile film electrodes. Electrochim. Acta 2010, 55, 979–984. [Google Scholar] [CrossRef]
  6. Xu, M.; Gao, Y.; Moreno, E.M.; Kunst, M.; Muhler, M.; Wang, Y.; Idriss, H.; Wöll, C. Photocatalytic Activity of Bulk TiO2 Anatase and Rutile Single Crystals Using Infrared Absorption Spectroscopy. Phys. Rev. Lett. 2011, 106, 138302. [Google Scholar] [CrossRef] [PubMed] [Green Version]
  7. Li, R.; Weng, Y.; Zhou, X.; Wang, X.; Mi, Y.; Chong, R.; Han, H.; Li, C. Achieving overall water splitting using titanium dioxide-based photocatalysts of different phases. Energy Environ. Sci. 2015, 8, 2377–2382. [Google Scholar] [CrossRef]
  8. Maeda, K. Direct splitting of pure water into hydrogen and oxygen using rutile titania powder as a photocatalyst. Chem. Commun. 2013, 49, 8404–8406. [Google Scholar] [CrossRef] [PubMed]
  9. Zhang, J.; Xu, Q.; Feng, Z.; Li, M.; Li, C. Importance of the Relationship between Surface Phases and Photocatalytic Activity of TiO2. Angew. Chem. 2008, 120, 1790–1793. [Google Scholar] [CrossRef]
  10. Chen, X.; Burda, C. The Electronic Origin of the Visible light Absorption Properties of C-, N- and S-Doped TiO2 Nanomaterials. J. Am. Chem. Soc. 2008, 130, 5018–5019. [Google Scholar] [CrossRef] [PubMed]
  11. Li, Z.; Xin, Y.; Zhang, Z. Colorful titanium oxides: A new class of photonic materials. Nanoscale 2015, 7, 19894–19898. [Google Scholar] [CrossRef] [PubMed]
  12. Wu, S.; Li, X.; Tian, Y.; Lin, Y.; Hu, Y.H. Excellent photocatalytic degradation of tetracycline over black anatase-TiO2 under visible light. Chem. Eng. J. 2021, 406, 126747. [Google Scholar] [CrossRef]
  13. Wei, S.; Wu, R.; Xu, X.; Jian, J.; Wang, H.; Sun, Y. One-step synthetic approach for core-shelled black anatase titania with high visible light photocatalytic performance. Chem. Eng. J. 2016, 299, 120–125. [Google Scholar] [CrossRef]
  14. Zhang, H.; Xing, Z.; Zhang, Y.; Li, Z.; Wu, X.; Liu, C.; Zhu, Q.; Zhou, W. Ni2+ and Ti3+ co-doped porous black anatase TiO2 with unprecedented-high visible light-driven photocatalytic degradation performance. RSC Adv. 2015, 5, 107150–107157. [Google Scholar] [CrossRef]
  15. Ullattil, S.G.; Abdel-Wahab, A. Self-oxygenated anatase–rutile phase junction: Ensuring the availability of sufficient surface charges for photocatalysis. New J. Chem. 2020, 44, 5513–5518. [Google Scholar] [CrossRef]
  16. Hao, Z.; Chen, Q.; Dai, W.; Ren, Y.; Zhou, Y.; Yang, J.; Xie, S.; Shen, Y.; Wu, J.; Chen, W.; et al. Oxygen-Deficient Blue TiO2 for Ultrastable and Fast Lithium Storage. Adv. Energy Mater. 2020, 10, 1903107. [Google Scholar] [CrossRef]
  17. Yang, Y.; Yin, L.-C.; Gong, Y.; Niu, P.; Wang, J.-Q.; Gu, L.; Chen, X.-Q.; Liu, G.; Wang, L.; Cheng, H.-M. An Unusual Strong Visible light Absorption Band in Red Anatase TiO2 Photocatalyst Induced by Atomic Hydrogen-Occupied Oxygen Vacancies. Adv. Mater. 2018, 30, 1704479. [Google Scholar] [CrossRef]
  18. Xu, S.; Han, Y.; Xu, Y.; Meng, H.; Xu, J.; Wu, J.; Xu, Y.; Zhang, X. Fabrication of polyaniline sensitized grey-TiO2 nanocomposites and enhanced photocatalytic activity. Sep. Purif. Technol. 2017, 184, 248–256. [Google Scholar] [CrossRef]
  19. Babu, B.; Ullattil, S.G.; Prasannachandran, R.; Kavil, J.; Periyat, P.; Shaijumon, M.M. Ti3+ Induced Brown TiO2 Nanotubes for High Performance Sodium-Ion Hybrid Capacitors. ACS Sustain. Chem. Eng. 2018, 6, 5401–5412. [Google Scholar] [CrossRef]
  20. Zhou, L.; Cai, M.; Zhang, X.; Cui, N.; Chen, G.; Zou, G.-Y. In-situ nitrogen-doped black TiO2 with enhanced visible light-driven photocatalytic inactivation of Microcystis aeruginosa cells: Synthesization, performance and mechanism. Appl. Catal. B Environ. 2020, 272, 119019. [Google Scholar] [CrossRef]
  21. Liu, X.; Zhu, G.; Wang, X.; Yuan, X.; Lin, T.; Huang, F. Progress in Black Titania: A New Material for Advanced Photocatalysis. Adv. Energy Mater. 2016, 6, 1600452. [Google Scholar] [CrossRef]
  22. Asahi, R.; Morikawa, T.; Ohwaki, T.; Aoki, K.; Taga, Y. Visible light Photocatalysis in Nitrogen-Doped Titanium Oxides. Science 2001, 293, 269–271. [Google Scholar] [CrossRef] [PubMed]
  23. Ihara, T. Visible light-active titanium oxide photocatalyst realized by an oxygen-deficient structure and by nitrogen doping. Appl. Catal. B Environ. 2003, 42, 403–409. [Google Scholar] [CrossRef]
  24. Tan, L.-L.; Ong, W.-J.; Chai, S.-P.; Mohamed, A.R. Band gap engineered, oxygen-rich TiO2 for visible light induced photocatalytic reduction of CO2. Chem. Commun. 2014, 50, 6923–6926. [Google Scholar] [CrossRef] [Green Version]
  25. Tan, L.-L.; Ong, W.-J.; Chai, S.-P.; Goh, B.T.; Mohamed, A.R. Visible light-active oxygen-rich TiO2 decorated 2D graphene oxide with enhanced photocatalytic activity toward carbon dioxide reduction. Appl. Catal. B Environ. 2015, 179, 160–170. [Google Scholar] [CrossRef]
  26. Tan, L.-L.; Ong, W.-J.; Chai, S.-P.; Mohamed, A.R. Photocatalytic reduction of CO2 with H2O over graphene oxide-supported oxygen-rich TiO2 hybrid photocatalyst under visible light irradiation: Process and kinetic studies. Chem. Eng. J. 2017, 308, 248–255. [Google Scholar] [CrossRef]
  27. Yaemsunthorn, K.; Kobielusz, M.; Macyk, W. TiO2 with Tunable Anatase-to-Rutile Nanoparticles Ratios: How Does the Photoactivity Depend on the Phase Composition and the Nature of Photocatalytic Reaction? ACS Appl. Nano Mater. 2021, 4, 633–643. [Google Scholar] [CrossRef]
  28. Jagadale, T.C.; Takale, S.P.; Sonawane, R.S.; Joshi, H.M.; Patil, S.I.; Kale, B.; Ogale, S.B. N-Doped TiO2 Nanoparticle Based Visible Light Photocatalyst by Modified Peroxide Sol−Gel Method. J. Phys. Chem. C 2008, 112, 14595–14602. [Google Scholar] [CrossRef]
  29. Nosaka, Y.; Nosaka, A. Understanding Hydroxyl Radical (•OH) Generation Processes in Photocatalysis. ACS Energy Lett. 2016, 1, 356–359. [Google Scholar] [CrossRef] [Green Version]
  30. Tryba, B.; Toyoda, M.; Morawski, A.W.; Nonaka, R.; Inagaki, M. Photocatalytic activity and OH radical formation on TiO2 in the relation to crystallinity. Appl. Catal. B Environ. 2007, 71, 163–168. [Google Scholar] [CrossRef]
  31. Liu, N.; Mohajernia, S.; Nguyen, N.T.; Hejazi, S.; Plass, F.; Kahnt, A.; Yokosawa, T.; Osvet, A.; Spiecker, E.; Guldi, D.M.; et al. Long-Living Holes in Grey Anatase TiO2 Enable Noble-Metal-Free and Sacrificial-Agent-Free Water Splitting. ChemSusChem 2020, 13, 4937. [Google Scholar] [CrossRef]
  32. Fu, F.; Cha, G.; Wu, Z.; Qin, S.; Zhang, Y.; Chen, Y.; Schmuki, P. Photocatalytic Hydrogen Generation from Water-Annealed TiO2 Nanotubes with White and Grey Modification. ChemElectroChem 2021, 8, 240–245. [Google Scholar] [CrossRef]
  33. Pillai, S.C.; Periyat, P.; George, R.; McCormack, D.E.; Seery, M.K.; Hayden, H.; Colreavy, J.; Corr, D.; Hinder, S.J. Synthesis of High-Temperature Stable Anatase TiO2 Photocatalyst. J. Phys. Chem. C 2007, 111, 1605–1611. [Google Scholar] [CrossRef] [Green Version]
  34. Nolan, N.T.; Synnott, D.W.; Seery, M.; Hinder, S.J.; Van Wassenhoven, A.; Pillai, S.C. Effect of N-doping on the photocatalytic activity of sol–gel TiO2. J. Hazard. Mater. 2012, 211–212, 88–94. [Google Scholar] [CrossRef] [PubMed] [Green Version]
  35. Sun, S.; Gao, P.; Yang, Y.; Yang, P.; Chen, Y.; Wang, Y. N-Doped TiO2 Nanobelts with Coexposed (001) and (101) Facets and Their Highly Efficient Visible light-Driven Photocatalytic Hydrogen Production. ACS Appl. Mater. Interfaces 2016, 8, 18126–18131. [Google Scholar] [CrossRef] [PubMed]
  36. Wang, W.-K.; Chen, J.-J.; Zhang, X.; Huang, Y.-X.; Li, W.-W.; Yu, H.-Q. Self-induced synthesis of phase-junction TiO2 with a tailored rutile to anatase ratio below phase transition temperature. Sci. Rep. 2016, 6, 20491. [Google Scholar] [CrossRef] [PubMed] [Green Version]
  37. Zheng, Z.; Huang, B.; Lu, J.; Wang, Z.; Qin, X.; Zhang, X.; Dai, Y.; Whangbo, M.-H. Hydrogenated titania: Synergy of surface modification and morphology improvement for enhanced photocatalytic activity. Chem. Commun. 2012, 48, 5733–5735. [Google Scholar] [CrossRef] [PubMed]
  38. Sinhamahapatra, A.; Jeon, J.-P.; Yu, J.-S. A new approach to prepare highly active and stable black titania for visible light-assisted hydrogen production. Energy Environ. Sci. 2015, 8, 3539–3544. [Google Scholar] [CrossRef] [Green Version]
  39. Ali, T.; Tripathi, P.; Azam, A.; Raza, W.; Ahmed, A.S.; Ahmed, A.; Muneer, M. Photocatalytic performance of Fe-doped TiO2 nanoparticles under visible light irradiation. Mater. Res. Express 2017, 4, 015022. [Google Scholar] [CrossRef]
  40. Shao, L.; Zhang, L.; Chen, M.; Lu, H.; Zhou, M. Reactions of titanium oxides with water molecules. A matrix isolation FTIR and density functional study. Chem. Phys. Lett. 2001, 343, 178–184. [Google Scholar] [CrossRef]
  41. Ullattil, S.G.; Periyat, P. Green microwave switching from oxygen rich yellow anatase to oxygen vacancy rich black anatase TiO2 solar photocatalyst using Mn(II) as ‘anatase phase purifier’. Nanoscale 2015, 7, 19184–19192. [Google Scholar] [CrossRef] [PubMed]
  42. Zavašnik, J.; Šestan, A.; Shvalya, V. Chapter Seven—Microscopic techniques for the characterisation of metal-based nanoparticles. Compr. Anal. Chem. 2021, 93, 241–284. [Google Scholar]
  43. Di Valentin, C.; Pacchioni, G.; Selloni, A.; Livraghi, S.; Giamello, E. Characterization of Paramagnetic Species in N-Doped TiO2 Powders by EPR Spectroscopy and DFT Calculations. J. Phys. Chem. B 2005, 109, 11414–11419. [Google Scholar] [CrossRef]
  44. Li, Y.; Peng, Y.-K.; Hu, L.; Zheng, J.; Prabhakaran, D.; Wu, S.; Puchtler, T.J.; Li, M.; Wong, K.-Y.; Taylor, R.A.; et al. Photocatalytic water splitting by N-TiO2 on MgO (111) with exceptional quantum efficiencies at elevated temperatures. Nat. Commun. 2019, 10, 4421. [Google Scholar] [CrossRef] [PubMed] [Green Version]
  45. Rex, R.E.; Knorr, F.J.; McHale, J.L. Comment on “Characterization of Oxygen Vacancy Associates within Hydrogenated TiO2: A Positron Annihilation Study”. J. Phys. Chem. C 2013, 117, 7949–7951. [Google Scholar] [CrossRef]
  46. Žerjav, G.; Zavašnik, J.; Kovač, J.; Pintar, A. The influence of Schottky barrier height onto visible light triggered photocatalytic activity of TiO2 + Au composites. Appl. Surf. Sci. 2021, 543, 148799. [Google Scholar] [CrossRef]
  47. Žerjav, G.; Scandura, G.; Garlisi, C.; Palmisano, G.; Pintar, A. Sputtered vs. sol-gel TiO2-doped films: Characterization and assessment of aqueous bisphenol A oxidation under UV and visible light radiation. Catal. Today 2020, 357, 380–391. [Google Scholar] [CrossRef]
  48. Kawai, T.; Kishimoto, Y.; Kifune, K. Photoluminescence studies of nitrogen-doped TiO2 powders prepared by annealing with urea. Philos. Mag. 2012, 92, 4088–4097. [Google Scholar] [CrossRef]
  49. Su, T.-Y.; Huang, C.-H.; Shih, Y.-C.; Wang, T.-H.; Medina, H.; Huang, J.-S.; Tsai, H.-S.; Chueh, Y.-L. Tunable defect engineering in TiON thin films by multi-step sputtering processes: From a Schottky diode to resistive switching memory. J. Mater. Chem. C 2017, 5, 6319–6327. [Google Scholar] [CrossRef]
  50. Biesinger, M.C.; Lau, L.W.; Gerson, A.R.; Smart, R.S. Resolving surface chemical states in XPS analysis of first row transition metals, oxides and hydroxides: Sc, Ti, V, Cu and Zn. Appl. Surf. Sci. 2010, 257, 887–898. [Google Scholar] [CrossRef]
  51. Žerjav, G.; Albreht, A.; Vovk, I.; Pintar, A. Revisiting terephthalic acid and coumarin as probes for photoluminescent determination of hydroxyl radical formation rate in heterogeneous photocatalysis. Appl. Catal. A Gen. 2020, 598, 117566. [Google Scholar] [CrossRef]
  52. Spurr, R.A.; Myers, H. Quantitative Analysis of Anatase–rutile Mixtures with an X-ray Diffractometer. Anal. Chem. 1957, 29, 760–762. [Google Scholar] [CrossRef]
  53. López, R.; Gómez, R. Band-gap energy estimation from diffuse reflectance measurements on sol–gel and commercial TiO2: A comparative study. J. Sol-Gel Sci. Technol. 2012, 61, 1–7. [Google Scholar] [CrossRef]
  54. Stoll, S.; Schweiger, A. EasySpin, a comprehensive software package for spectral simulation and analysis in EPR. J. Magn. Reson. 2006, 178, 42–55. [Google Scholar] [CrossRef] [PubMed]
Figure 1. Results of (a) XRD, (b) Raman, and (c) FTIR analyses of investigated solids. Graph (d) shows zoomed FTIR spectra in the range of 1000–400 cm−1.
Catalysts 11 01500 g001
Figure 2. TEM analysis of samples: (a) PT, (b) NT-5, and (c) NT-O-5. (ac) overview TEM micrograph, (a1c1) HR-TEM micrographs, (a2c2) SAEDP with simulation insets for anatase and rutile, arrows mark the characteristic rutile reflections; (a3c3) particle size distribution graph with lognormal distribution curve (normalized to max.), and (a4c4) experimental SAEDP intensity profile (blue) with simulation for anatase (red).
Catalysts 11 01500 g002
Figure 3. (a) UV-Vis DR spectra and (b) Tauc plots for investigated samples.
Catalysts 11 01500 g003
Figure 4. (a) N2 adsorption/desorption isotherms and (b) EPR spectra of TiO2 samples collected at room temperature.
Catalysts 11 01500 g004
Figure 5. PL spectra of solid TiO2 samples.
Catalysts 11 01500 g005
Figure 6. High-resolution XPS spectra (a) C 1s, (b) O 1s, (c) N 1s, and (d) Ti 2p for NT-5 sample, and (e) Ti 2p for NT-O-5 sample.
Catalysts 11 01500 g006
Figure 7. Temporal hydroxyl radical formation using coumarin probe method. To set the initial value of fluorescence intensity to zero, values at each time interval are subtracted with the corresponding initial intensity, i.e., at t = 0 min.
Catalysts 11 01500 g007
Table 1. Calculated mass fraction of anatase and rutile (using Spurr equation), the average crystallite size as calculated by Scherrer equation, BET surface area, total pore volume, and average pore diameter of TiO2 samples.
SampleMass Fraction of Anatase
(%)
Mass Fraction of Rutile
(%)
Average
Crystallite Size (nm)
BET Surface Area
(m2/g)
Total Pore Volume
(cm3/g)
Average Pore Diameter
(nm)
PT10008.01640.45010.3
NT-310008.11480.42311.4
NT-496.63.49.41310.39812.2
NT-597.22.810.31140.37612.0
NT-O-310008.21410.41711.8
NT-O-495.84.29.31110.36313.0
NT-O-596.13.911.6850.29413.7
Publisher’s Note: MDPI stays neutral with regard to jurisdictional claims in published maps and institutional affiliations.

