Article

Enhanced Photocatalytic Activity of ZnO–CdS Composite Nanostructures towards the Degradation of Rhodamine B under Solar Light

by
Thirumala Rao Gurugubelli
1,*,
R. V. S. S. N. Ravikumar
2,* and
Ravindranadh Koutavarapu
3,*
1
Physics Division, Department of Basic Sciences and Humanities, GMR Institute of Technology, GMR Nagar, Rajam 532127, Andhra Pradesh, India
2
Department of Physics, Acharya Nagarjuna University, Nagarjuna Nagar, Guntur 522510, Andhra Pradesh, India
3
Department of Robotics and Intelligent Machine Engineering, College of Mechanical and IT Engineering, Yeungnam University, Gyeongsan 712-749, Korea
*
Authors to whom correspondence should be addressed.
Submission received: 26 October 2021 / Revised: 17 December 2021 / Accepted: 10 January 2022 / Published: 12 January 2022

Abstract

:
A simple chemical precipitation route was utilized for the synthesis of ZnO nanoparticles (NPs), CdS NPs and ZnO–CdS nanocomposites (NCs). The synthesized nanostructures were examined for the crystal structure, morphology, optical properties and photodegradation activity of rhodamine B (RhB) dye. The ZnO–CdS NCs showed a mixed phase of hexagonal wurtzite structure for both ZnO NPs and CdS NPs. Pure ZnO NPs and CdS NPs possessed bandgaps of 3.2617 and 2.5261 eV, respectively. On the other hand, the composite nanostructures displayed a more narrow bandgap of 2.9796 eV than pure ZnO NPs. When compared to bare ZnO NPs, the PL intensity of near-band-edge emission at 381 nm was practically suppressed, suggesting a lower rate of photogenerated electron–hole (e/h+) pairs recombination, resulting in enhanced photocatalytic activity. Under solar light, the composite nanostructures displayed a photodegradation efficiency of 98.16% towards of RhB dye. After four trials, the structural stability of ZnO–CdS NCs was verified.

1. Introduction

Photocatalysis has been extensively studied in order to assure the ongoing expansion of civilization in the face of severe environmental pollution. Due to its unique characteristics such as low cost, great availability, high stability, and outstanding electrical and optical properties, semiconducting metal oxides (SMO’s) have emerged as attractive materials in numerous potential applications such as optoelectronics, optics, and photocatalysis [1]. Zinc oxide (ZnO)-based semiconductor nanostructures in particular have been utilized as effective photocatalytic materials for the degradation of organic pollutants and chemical processes such as hydrogen or oxygen production because of their unique electronic band structure, tunable bandgap, and high charge transfer efficiency [2,3]. ZnO nanoparticles (NPs) have large application potential in photocatalysis, solar cell, optoelectronics, sensors, and light emitting devices, which have a wide direct bandgap of ≈3.37 eV and a large exciton binding energy of 60 meV at room temperature. Due to their large bandgap and rapid recombination of photoinduced electron–hole (e/h+) pairs, it is challenging to attain the required photocatalytic performance from pure ZnO NPs [4]. By connecting ZnO NPs with narrow bandgap semiconductors, the construction of binary or ternary composite nanostructures is an efficient method to address the limitations of ZnO NPs [5,6,7,8,9].
The practical implementation of photocatalysis has been hampered by a number of significant challenges such as restricted visible light absorption, low quantum yield and poor stability [10]. Metal-oxide-based composite nanostructures are one of the most promising techniques for improving photocatalytic effectiveness when compared to their bulk counterparts [11]. Furthermore, charge separation and transmission can be made easier by composite nanostructures [6]. Among all chalcogenide semiconductors, cadmium sulfide (CdS) is a well-characterized II-VI group inorganic semiconductor with a narrow direct bandgap of ≈2.42 eV and it has wide application potential in optoelectronics, such as nonlinear optics, visible-light emitting diodes, and lasers. Further, CdS NPs is identified as one of the effective materials for extending the light absorption capacity of ZnO NPs into the visible light range.
According to recent studies, coupled ZnO–CdS nanocomposites (NCs) outperform individual ZnO NPs or CdS NPs in terms of photocatalytic activity. According to Zhang et al. [12], the photocatalytic activity of CdS/ZnO heterojunctions is 11 times larger than bare CdS NPs. The photocatalytic hydrogen evolution efficiency of CdS-ZnO core–shell nanorods is around 12 times higher than bare CdS and 895 times higher than pure ZnO [13]. Senasu et al. [14] found that a ZnO/CdS NCs outperformed individual ZnO or CdS catalysts in terms of photocatalytic activity. In addition, ZnO–CdS NCs have attracted a great deal of attention in recent years because of their electronic and optical properties that makes them suitable for use as light-emitting devices, optoelectronics, photoconductive devices, photocatalysts, photovoltaic solar cells, and fluorescence probes for biomedical applications. This motivated us to construct novel ZnO–CdS composite nanostructures.
The current paper proposes low-cost, eco-friendly, and single-step synthesis of ZnO NPs, CdS NPs, and ZnO–CdS NCs that minimizes the e/h+ recombination rate and hence improves photocatalytic activity towards rhodamine B (RhB) dye degradation. The synthesized samples were characterized by various spectroscopic techniques and photocatalytic activity.

2. Materials and Methods

2.1. Materials

Precursors included Zn(CH3COO)2·2H2O, NaOH, Cd(CH3COO)2·2H2O and Na2S. All of the chemical reagents utilized were AR grade (Merck chemicals). All dilution and sample preparation was performed with deionized water and ethanol. A single-step chemical precipitation route was employed to synthesize the ZnO NPs, CdS NPs, and ZnO–CdS NCs.

2.2. Synthesis of ZnO Nanoparticles

In a typical process, 2.2 g of Zn(CH3COO)2·2H2O was dissolved in 50 mL deionized water–ethanol matrix (solution A) while an equivalent molar amount of NaOH was dissolved in another deionized water–ethanol matrix (solution B). Solution A was magnetically stirred for 10 min to obtain a homogenous solution. After that, a constant stream of solution B was introduced to the aforementioned solution A. The resulting dispersions were rinsed many times with deionized water and ethanol to remove impurities. After washing, the solution was centrifuged at 10,000 rpm for 30 min. In a hot-air oven, the settled sample was collected and dried for 2 h at 120 °C.

2.3. Synthesis of CdS Nanoparticles

A previously reported approach was utilized for the CdS NPs synthesis [15].

2.4. Synthesis of ZnO–CdS Composite Nanostructures

A previously documented approach was utilized for the synthesis of ZnO–CdS NCs [16]. The following is the reaction mechanism for the formation of ZnO–CdS NCs.
Zn(CH3COO)2·2H2O + NaOH → ZnO + (CH3COOH)2 + H2O2
Cd(CH3COO)2·4H2O + Na2S + ZnO + H2O2 → ZnO–CdS + (CH3COOH)2 + 2H2O + NaHO4

2.5. Characterization Techniques

For the powder X-ray diffraction (XRD) analysis, a PANalytical XPert Pro diffractometer was utilized with a scan rate of 4 degrees per min. ZEISS EVO 18 was utilized to obtain morphology of the samples by scanning electron microscope (SEM) analysis. HITACHI-H-7600 instrument was utilized to obtain the transmission electron microscope (TEM) micrographs. JASCO V-670 spectrophotometer was utilized for obtaining UV-Vis absorption spectrum. Photoluminescence (PL) study was performed by Jobin Yvon Fluorimeter.

2.6. Photocatalytic Activity

The photocatalytic process was estimated using a 100 W solar simulator, and a model organic pollutant RhB aqueous solution underwent photodegradation. The ZnO–CdS NCs was chosen as an effective photocatalyst in this procedure. Next, 100 mL of 10 ppm RhB dye solution was combined with 10 mg of synthesized photocatalyst. Prior to light exposure, the solution was magnetically agitated in darkness for 30 min to initiate the adsorption–desorption equilibrium between dye solution and photocatalyst material. Then, 5 mL aliquots were collected for analysis after every 10 min of time interval. During the photoreaction, a UV-Vis-NIR spectrophotometer was utilized to monitor the dye degradation concentration. To ensure that the photodegradation was triggered only by the photocatalyst, the experiment was conducted in two ways: without a catalyst (just RhB) and with a photocatalyst (pure ZnO NPs, CdS NPs, and ZnO–CdS NCs). To quantify the initial concentration of dye, the aqueous solution of RhB dye was collected for study shortly before to light illumination (C0). The first-order kinetics of the reaction were calculated using the curve C/C0 versus illumination time (t). The photodegradation efficiency of the RhB model dye may be estimated using the following expression:
Degradation efficiency (%) = (1 − C/C0) × 100%
where C0 is the factual RhB dye absorbance and C represents the RhB concentration over time intervals. Cycling tests have been chosen for ZnO–CdS NCs photocatalyst over degradation efficiency because of the photocatalyst reusability for various practical applications.

3. Results and Discussion

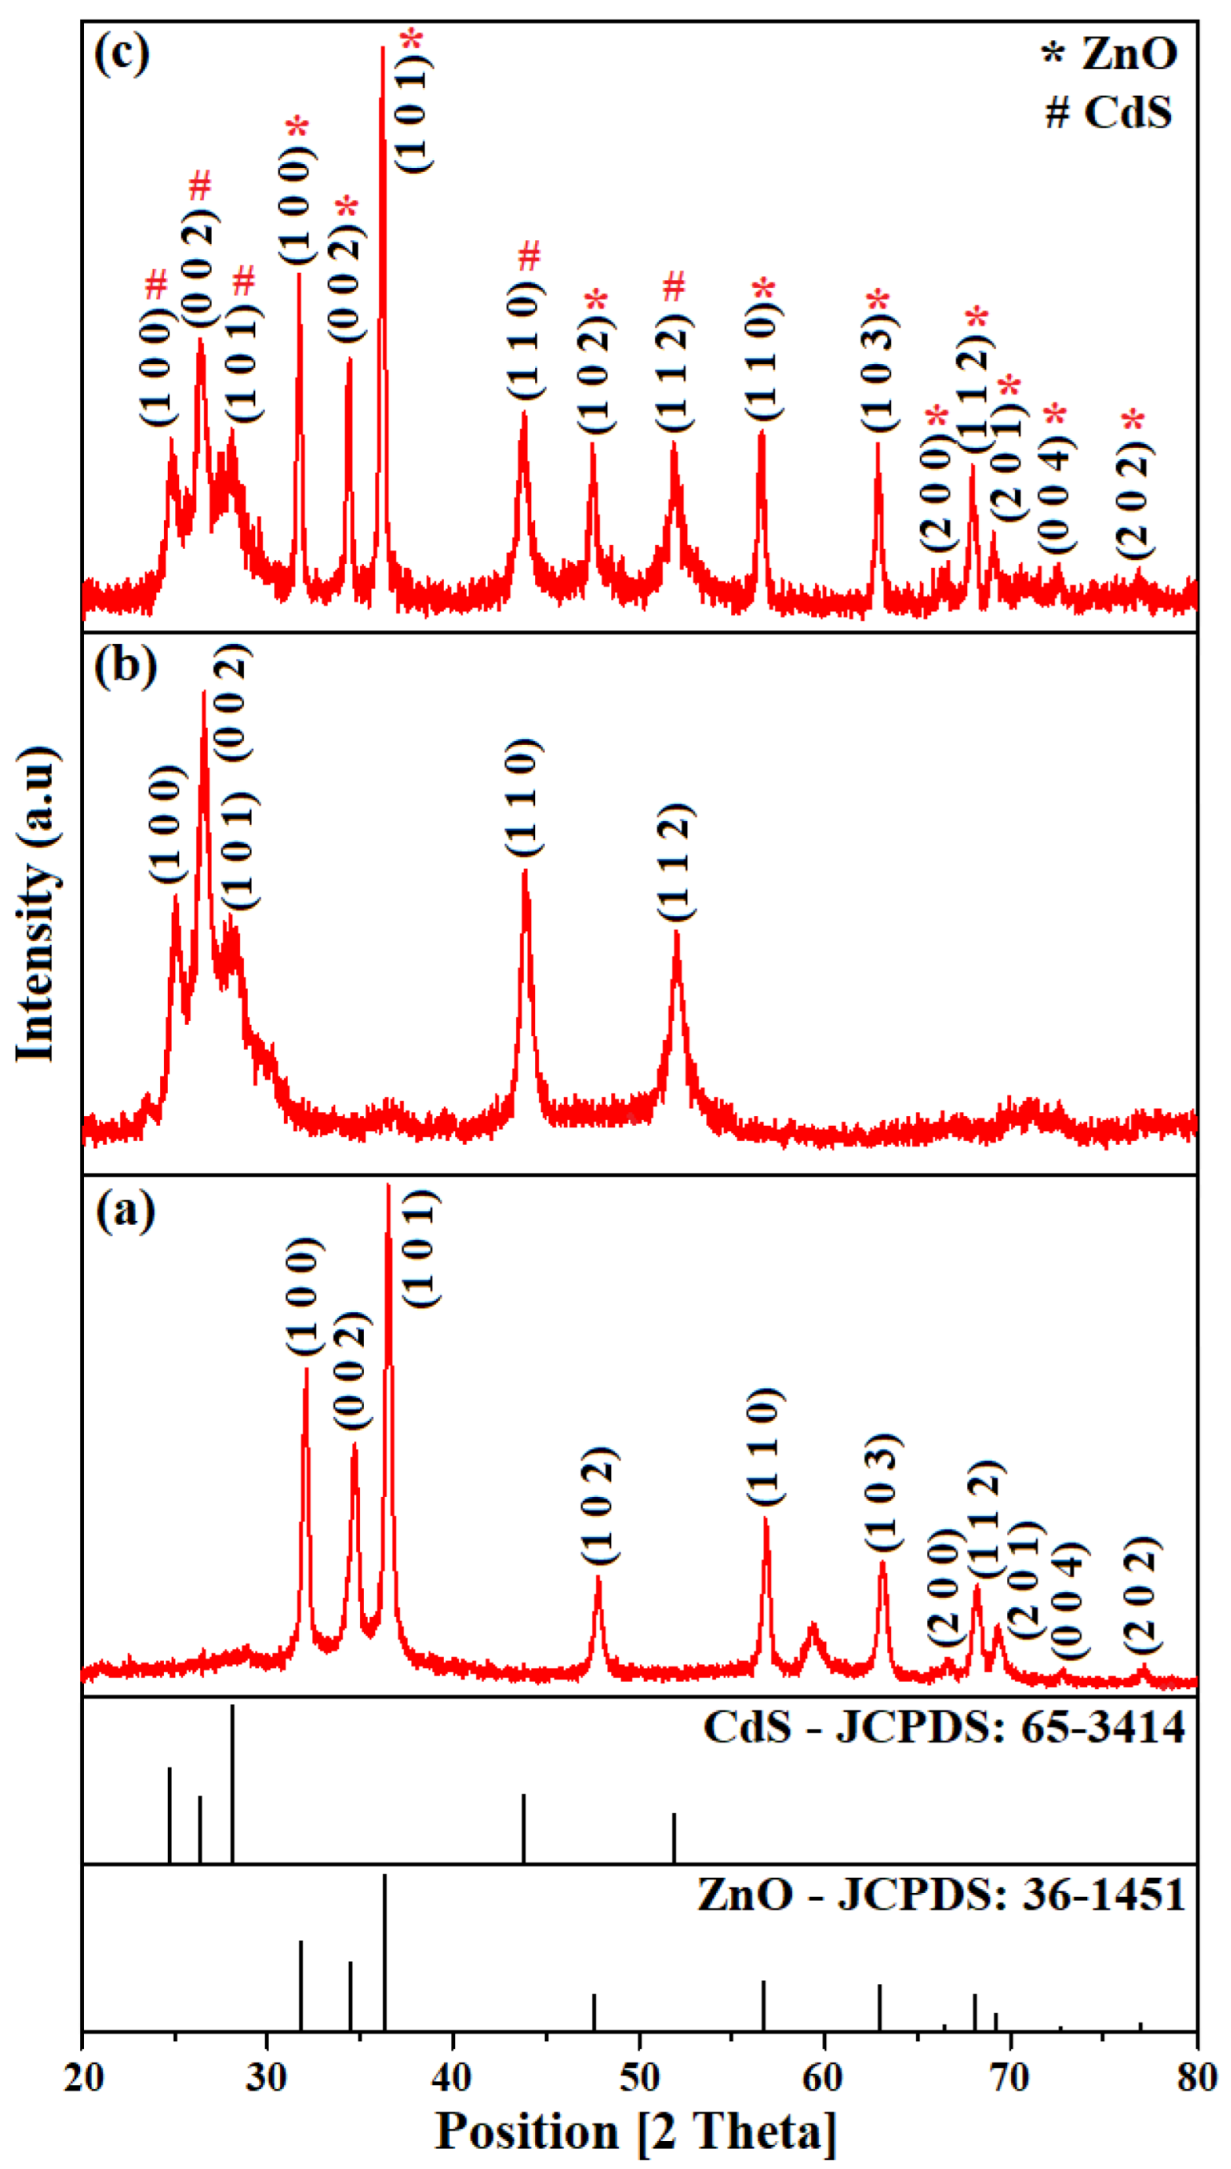
3.1. X-ray Diffraction Study

Typical XRD patterns of bare ZnO NPs, CdS NPs, and ZnO–CdS NCs are depicted in Figure 1. The strong diffraction peaks corresponding to the crystal planes of ( 1   0   0 ) ,   ( 0   0   2 ) ,   ( 1   0   1 ) ,   ( 1   0   2 ) ,   ( 1   1   0 ) ,   ( 1   0   3 ) ,   ( 2   0   0 ) ,   ( 1   1   2 ) ,   ( 2   0   1 ) ,   ( 0   0   4 ) , and ( 2   0   2 ) indicate the formation of hexagonal structure of ZnO NPs, which is well consistent with the JCPDS data 36-1451. Meanwhile, the dominant peaks are ascribed to ( 1   0   0 ) ,   ( 0   0   2 ) ,   ( 1   0   1 ) ,   ( 1   1   0 ) , and ( 1   1   2 ) planes of hexagonal CdS NPs with JCPDS data 65-3414. In case of ZnO–CdS NCs, the mixed phase of both hexagonal ZnO NPs and CdS NPS are observed. The peaks marked with * specify the ZnO NPs and the other peaks marked with # specify the CdS NPs, suggesting the formation of ZnO–CdS NCs. No impurity or other secondary phase was identified, which reveals the purity of the sample. Scherrer’s formula [17] was utilized to compute the average crystallite size.
D = 0.9 λ β cos θ
The microstrain induced in the synthesized nanostructures was calculated using the Stokes–Wilson equation [18].
ε = β cos θ 4
Table 1 shows the average grain size, microstrain, and lattice parameters of ZnO NPs, CdS NPs, and ZnO–CdS NCs. Both ZnO NPs and CdS NPs have smaller lattice cell parameters than ZnO–CdS NCs.

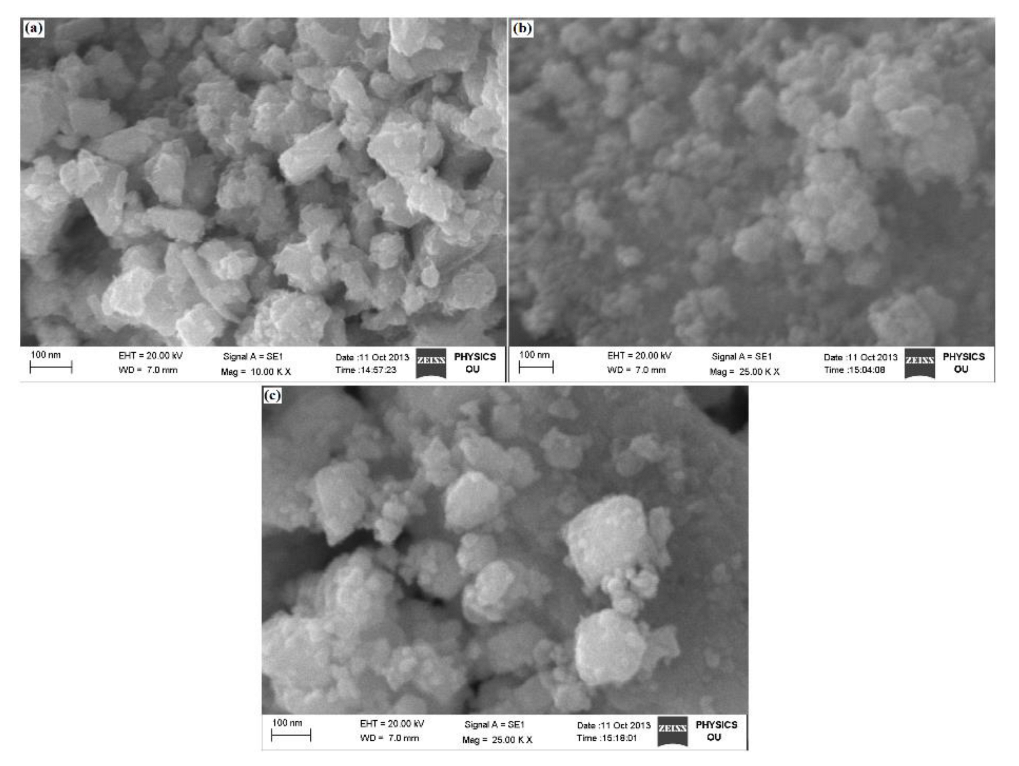
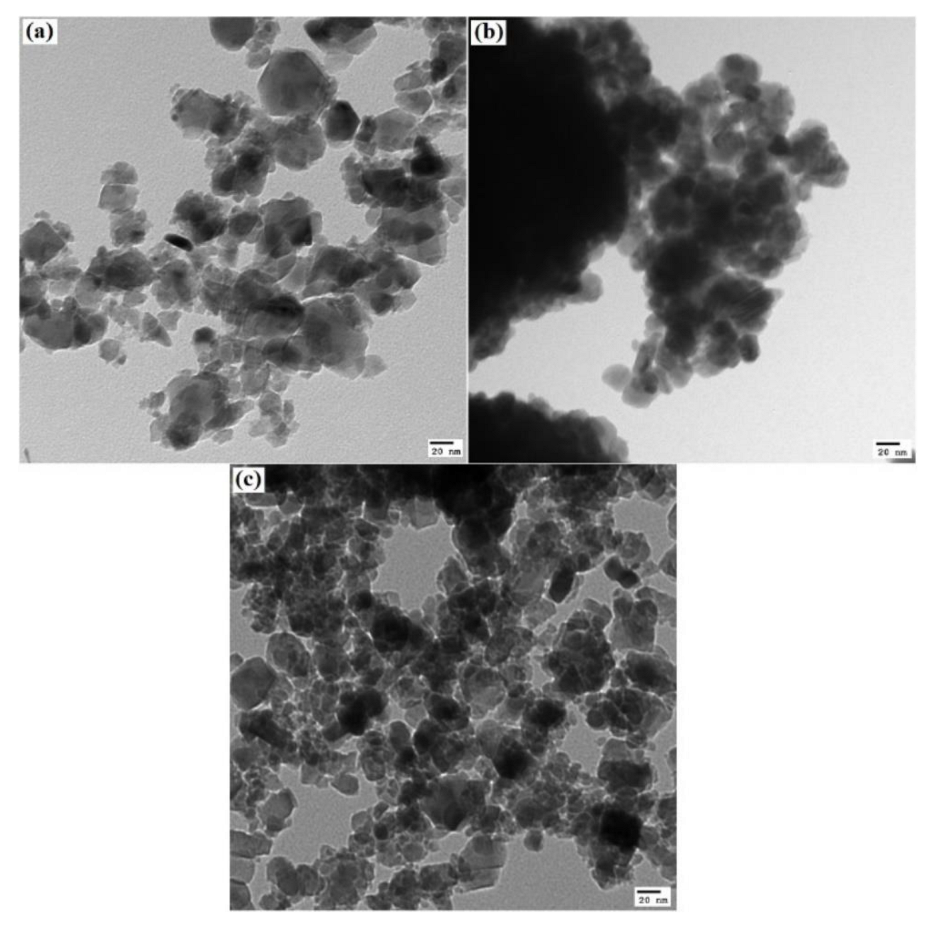
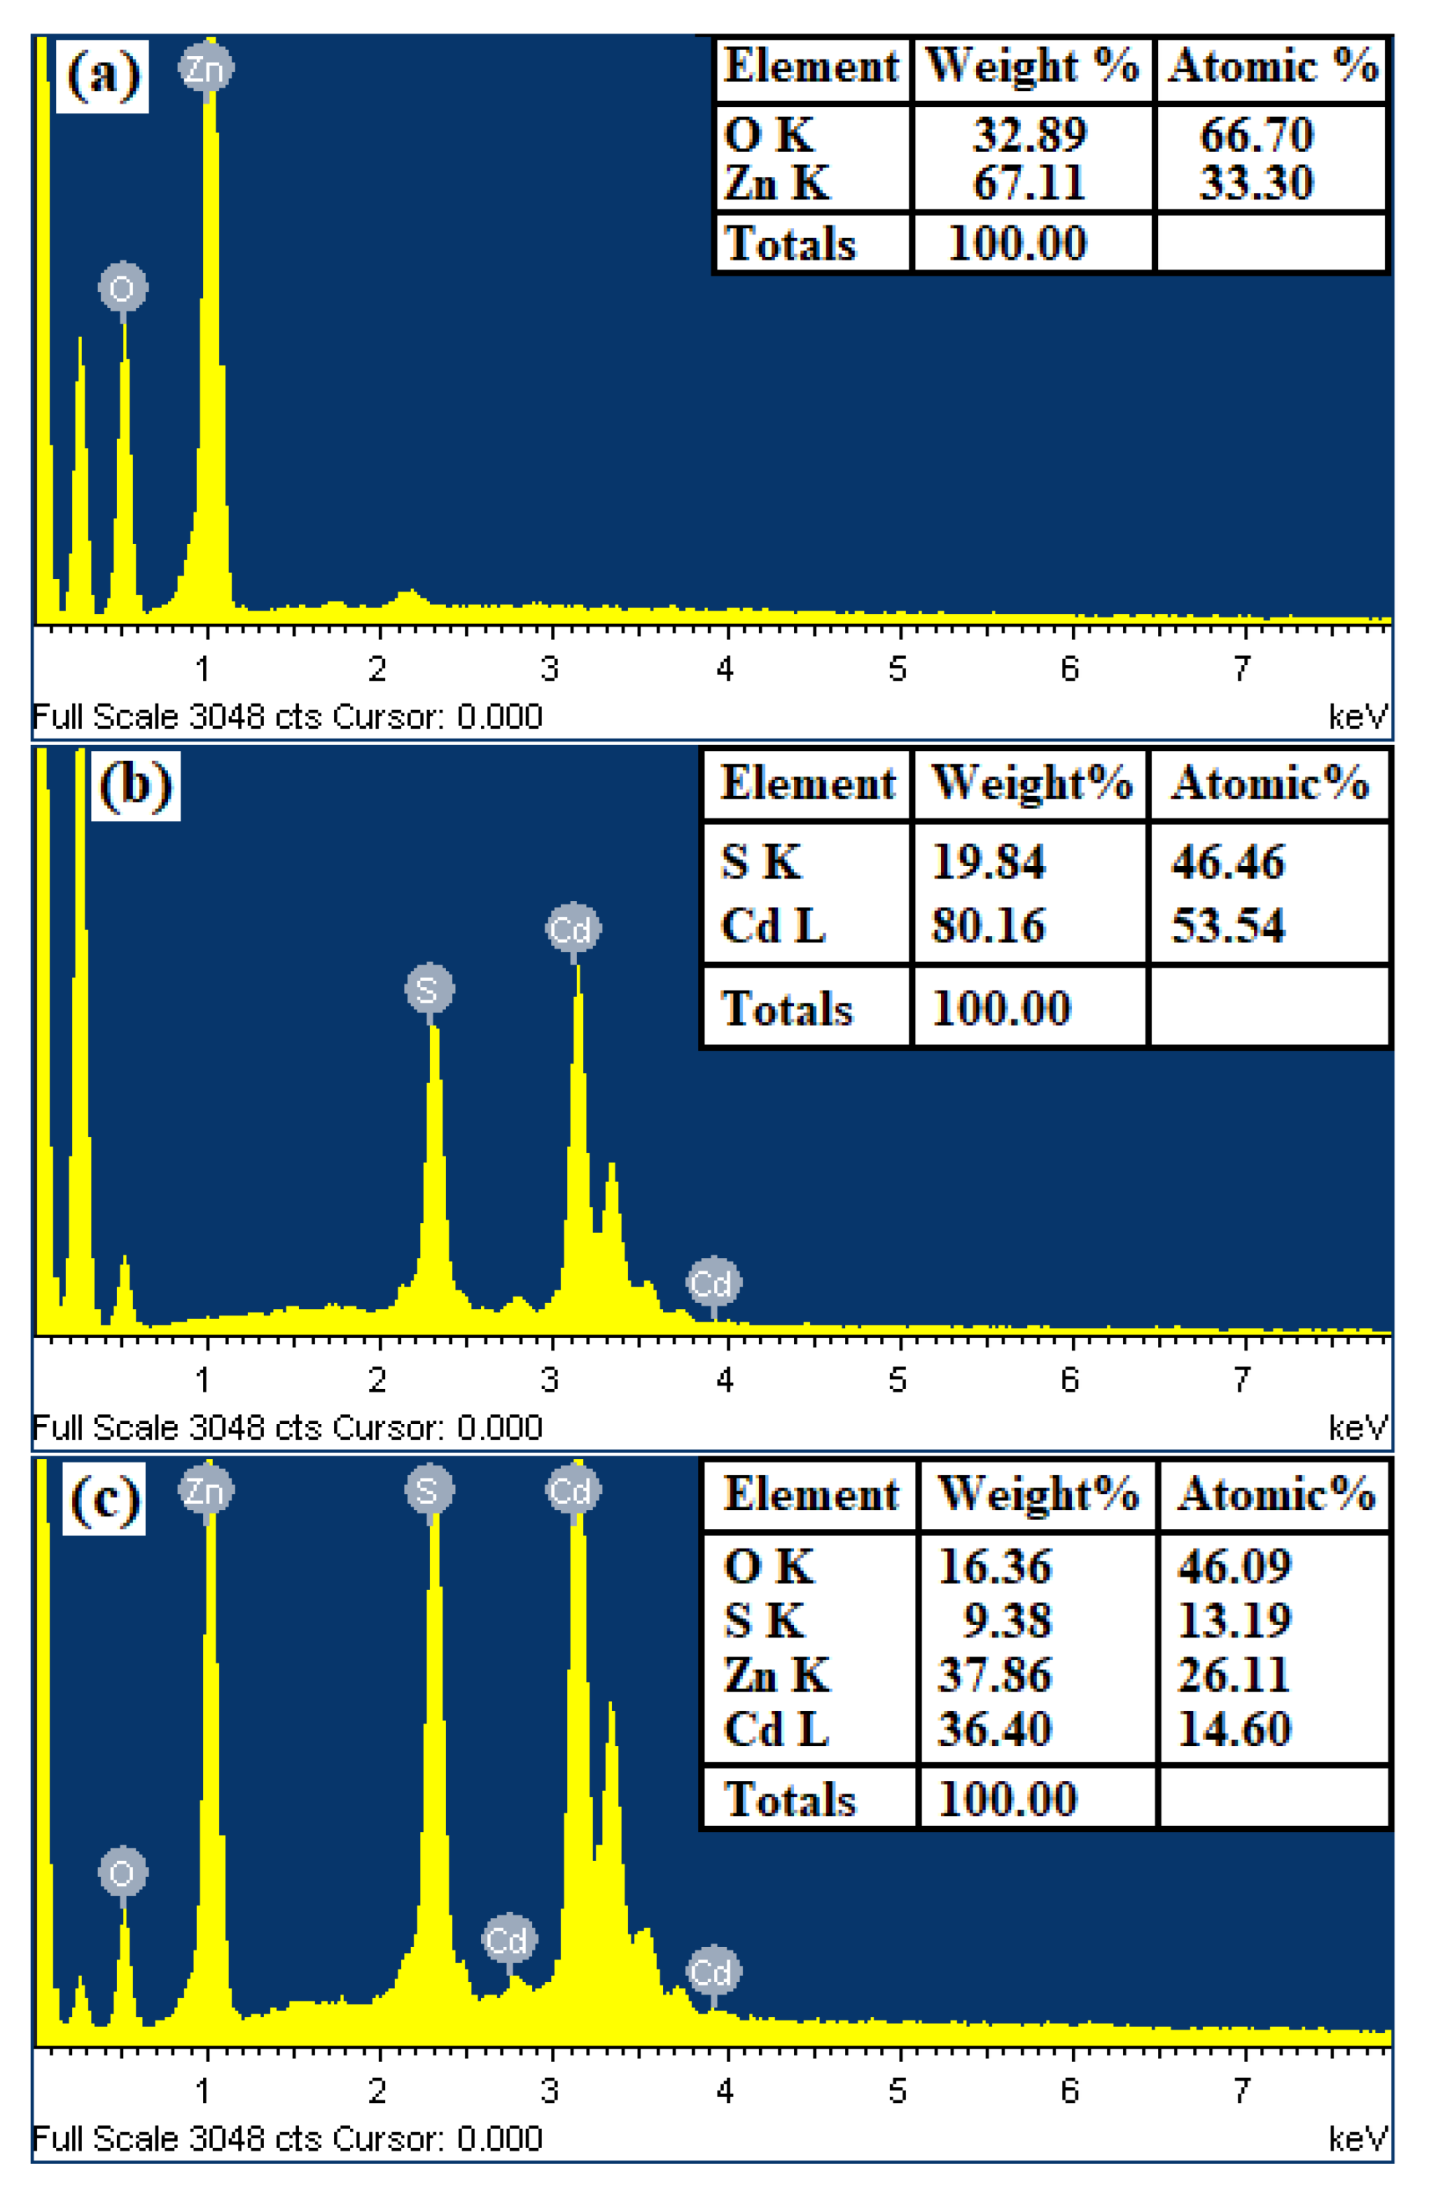
3.2. Morphological Study

SEM and TEM were utilized to examine the morphology of the synthesized samples. SEM micrographs of pure ZnO NPs, CdS NPs, and ZnO–CdS NCs are shown in Figure 2. The ZnO NPs with low agglomerates are formed, as illustrated in Figure 2a. The evenly dispersed spherical shaped CdS NPs are seen in Figure 2b. CdS NPs are detected on the surface of ZnO NPs in ZnO–CdS NCs, implying the development of CdS-NPs-adorned ZnO NPs heterostructures as seen in Figure 2c.
TEM micrographs of ZnO NPs, CdS NPs, and ZnO–CdS NCs are displayed in Figure 3. The formation of irregular and spherical-shaped ZnO NPs is presented in Figure 3a. The spherical-shaped CdS NPs are illustrated in Figure 3b. It can be seen that the CdS NPs are decorated on ZnO NPs in ZnO–CdS NCs as shown in Figure 3c.
Furthermore, the synthesized samples are examined by EDS analysis. As presented in Figure 4, the constituent elements such as Zn, O, Cd, S were only present in the ZnO–CdS NCs, confirming the purity of the samples.

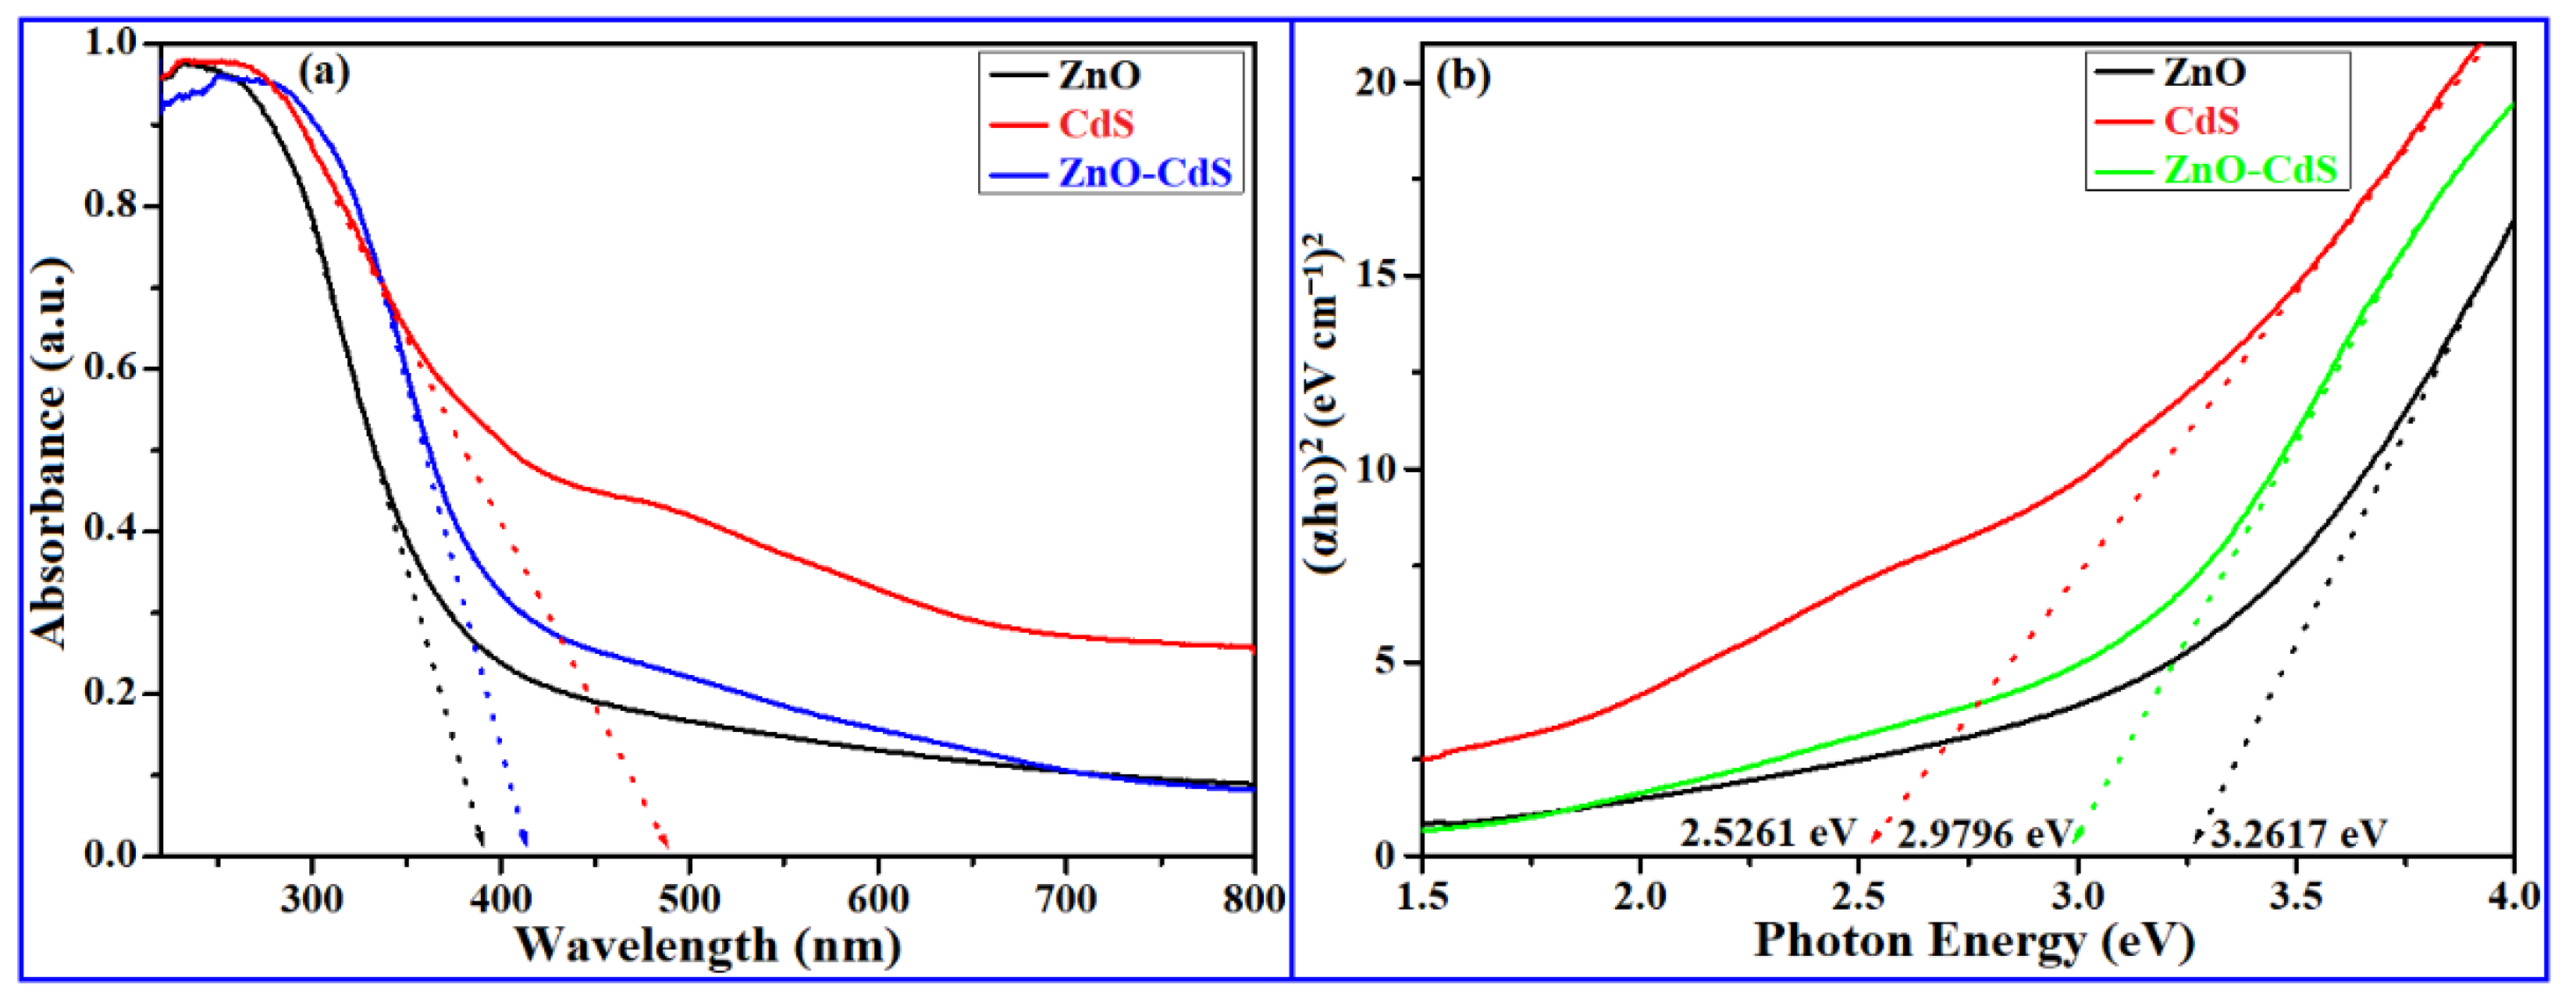
3.3. Absorption Study

Optical absorption and photoluminescence are the most abundant tools to develop the electronic structures and understand the optical characteristics of semiconductor nanostructures. The absorption spectra of pure ZnO NPs, CdS NPs, and ZnO–CdS NCs are displayed in Figure 5a. The absorption edge of pure ZnO NPs was seen at 379 nm, indicating that the absorption capability of ZnO is restricted to the UV area exclusively. At 483 nm, a wide absorption band is visible, which is typical of CdS NPs. ZnO–CdS NCs can be used to spread the absorption region of ZnO to visible range [19]. Whereas in ZnO–CdS NCs, the absorption edge has been changed to a longer wavelength side, suggesting that the absorption capacity is expanded into the visible region. These results demonstrated that the ZnO–CdS NCs have the merit of excellent utilization of the solar spectrum, leading to enhanced photocatalytic efficiency. Tauc plots obtained from absorption spectra are depicted in Figure 5b. Pure ZnO NPs and CdS NPs have bandgaps of 3.2617 and 2.5261 eV, respectively. The bandgap of ZnO–CdS NCs is effectively tuned to 2.9796 eV.

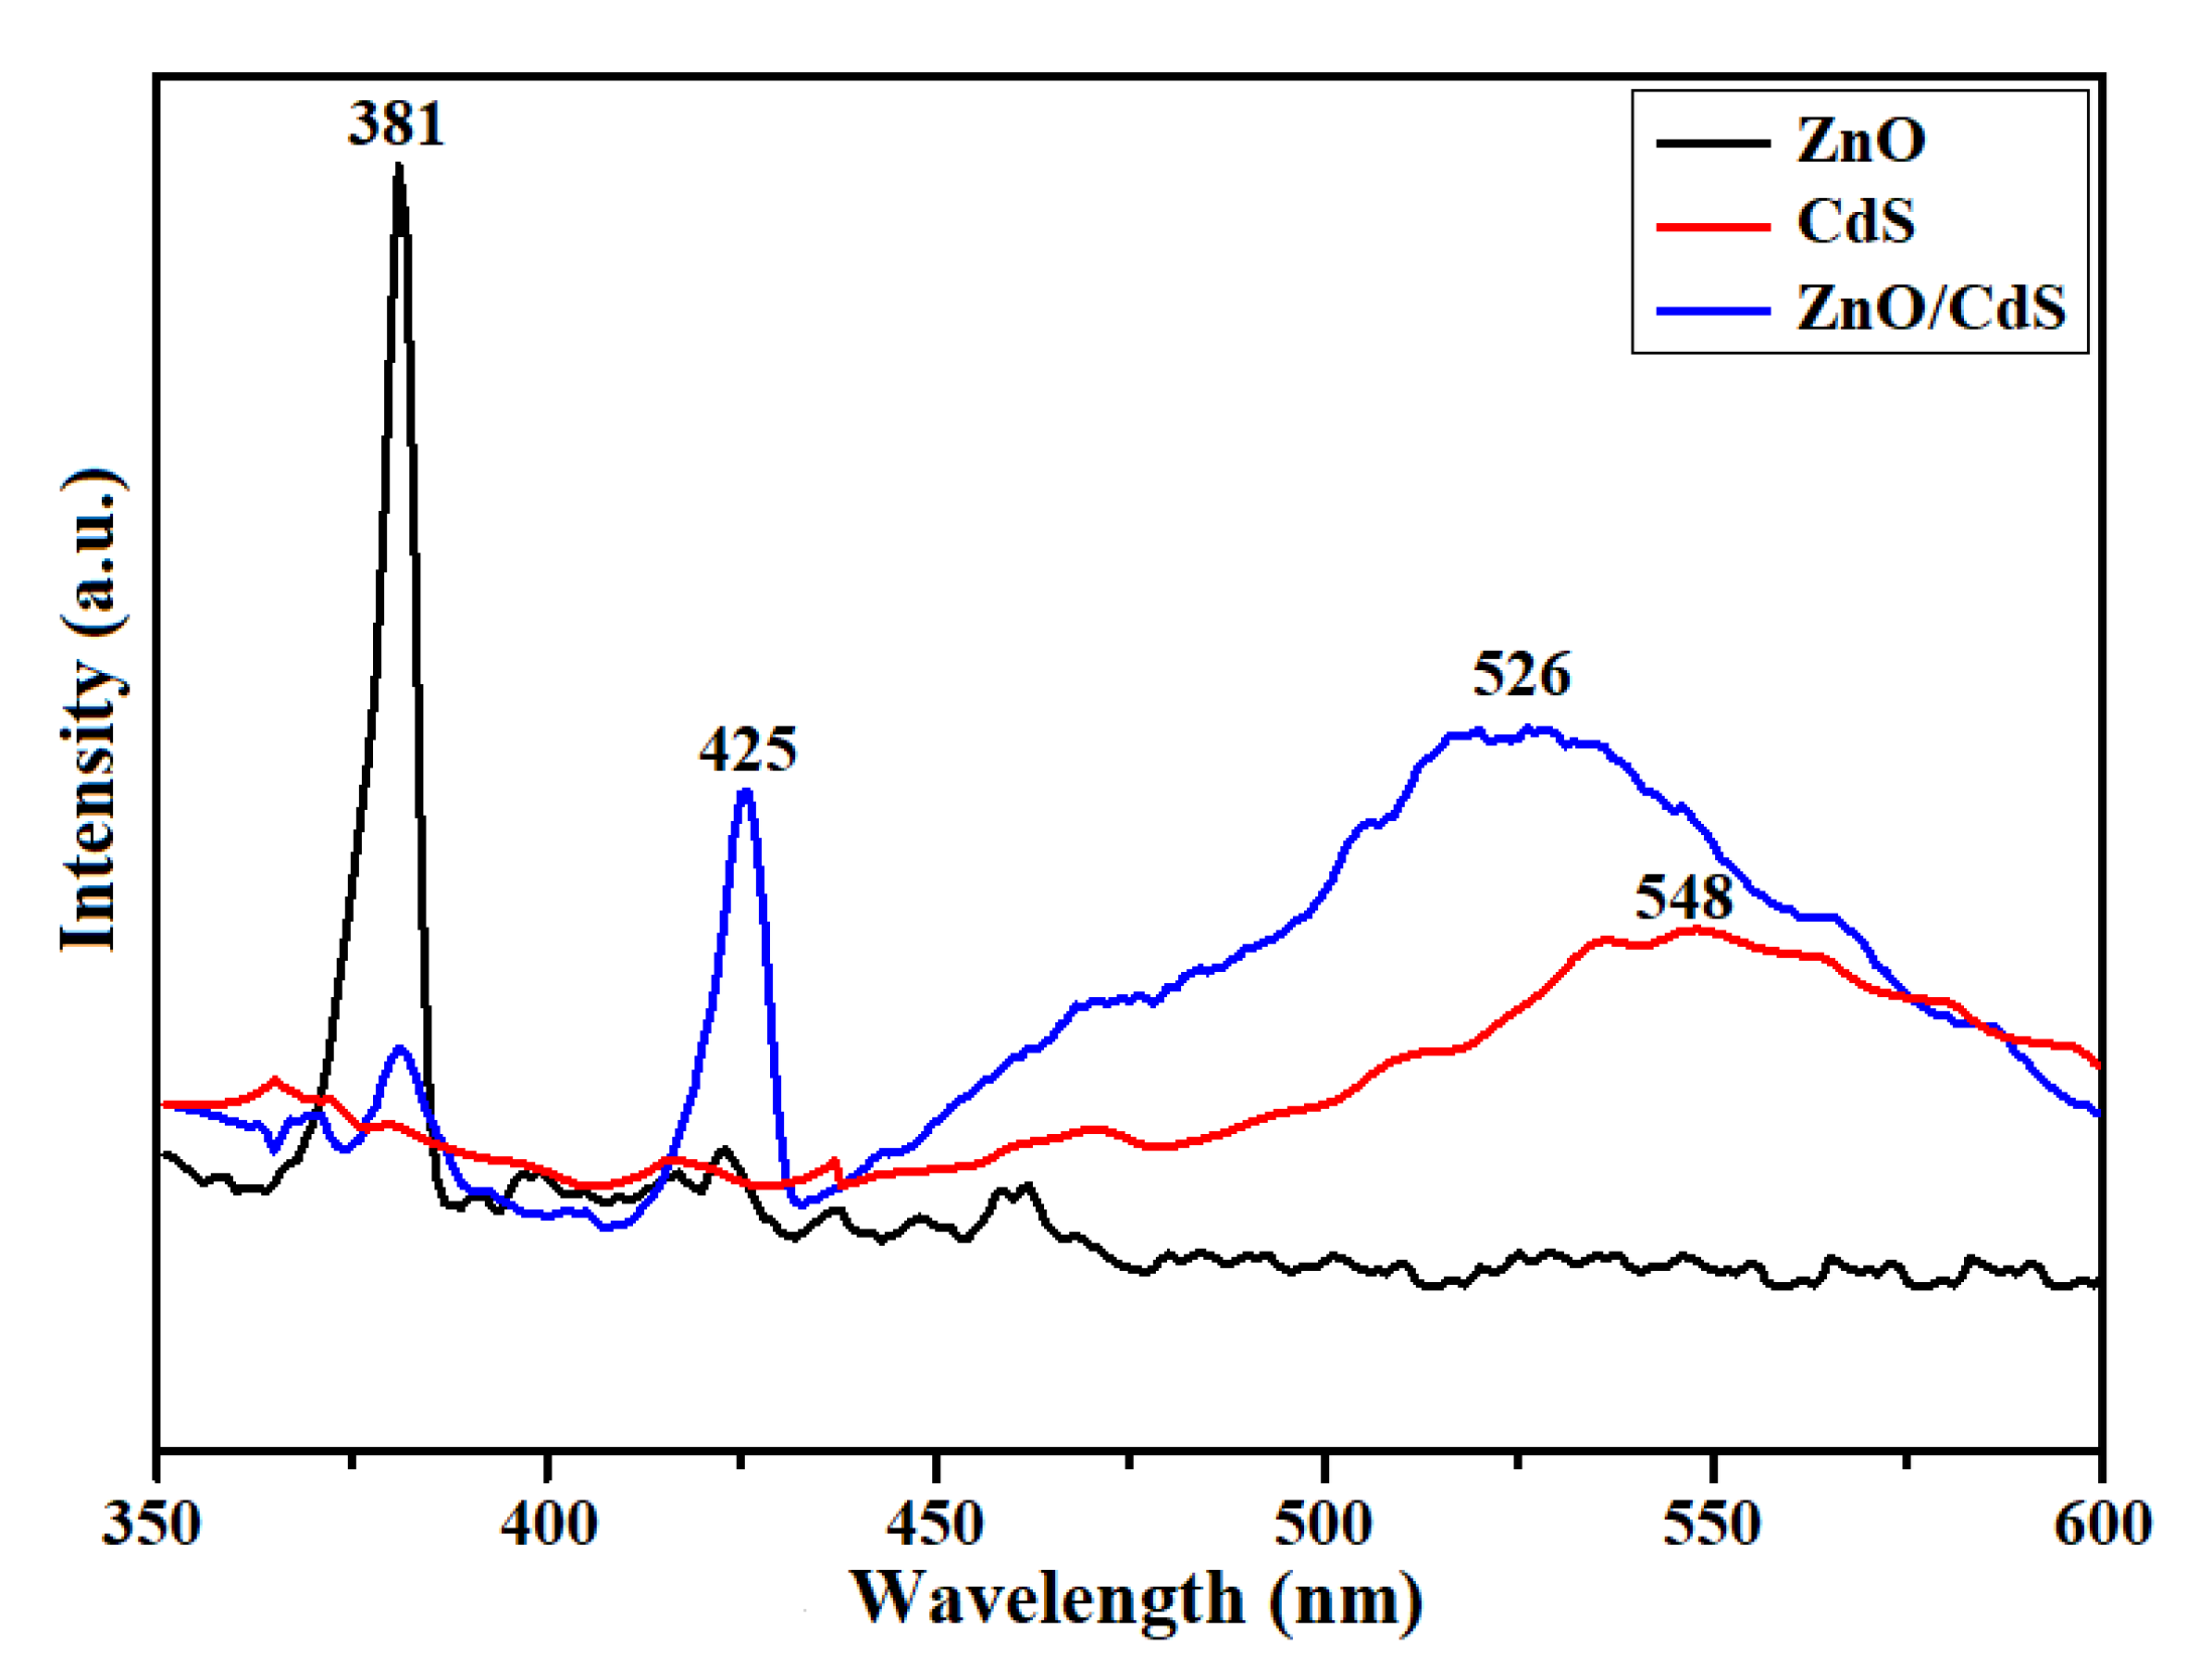
3.4. Photoluminescence Study

Figure 6 shows the PL spectra of pristine ZnO NPs, CdS NPs, and ZnO–CdS NCs. The pure ZnO NPs exhibited a strong emission band at 381 nm, which is ascribed to the rapid recombination of e/h+ pairs [18]. The CdS NPs exhibited a broad emission band in 500–600 nm range (centered at 548 nm) and a shoulder peak at 471 nm. However, the ZnO–CdS NCs displayed three emission bands at 381, 425, and 468 nm and a broad emission centered at 526 nm. The weaker intensity of ZnO–CdS NCs at 381 nm indicated that the deposited CdS NPs reduces the recombination of photoinduced e/h+ pairs and promoted the interface charge transfer [20]. The peak at 425 is ascribed to the Zn vacancies (VZn) [21]. The shoulder peak at 468 nm is corresponding to the radiative recombination of charge carriers [22]. Surface vacancies or defects are responsible for the wide emission peak at 526 nm [23].

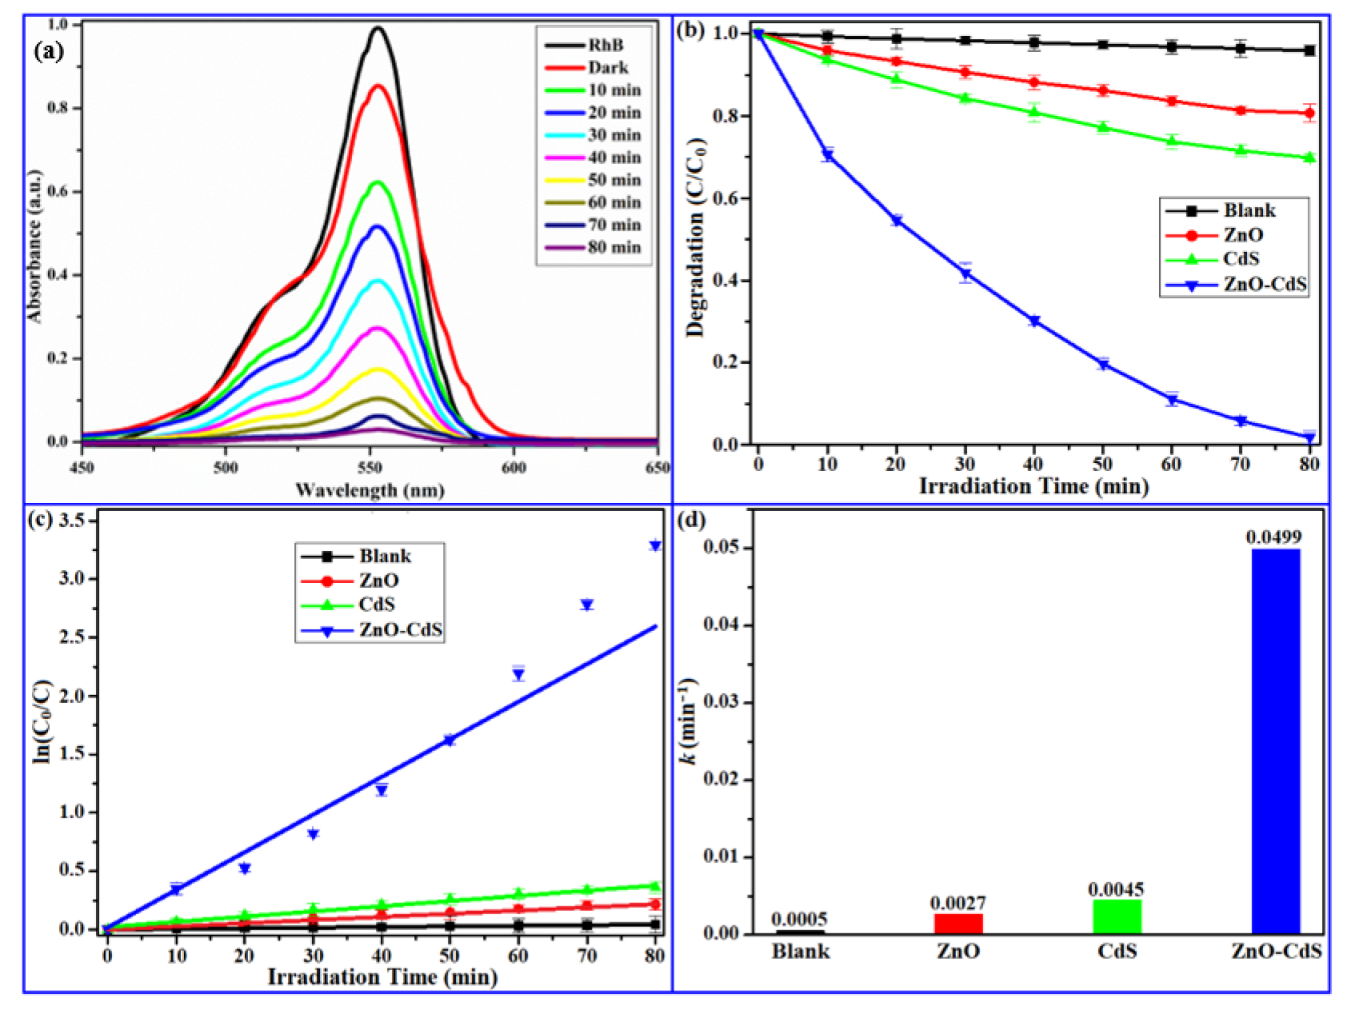
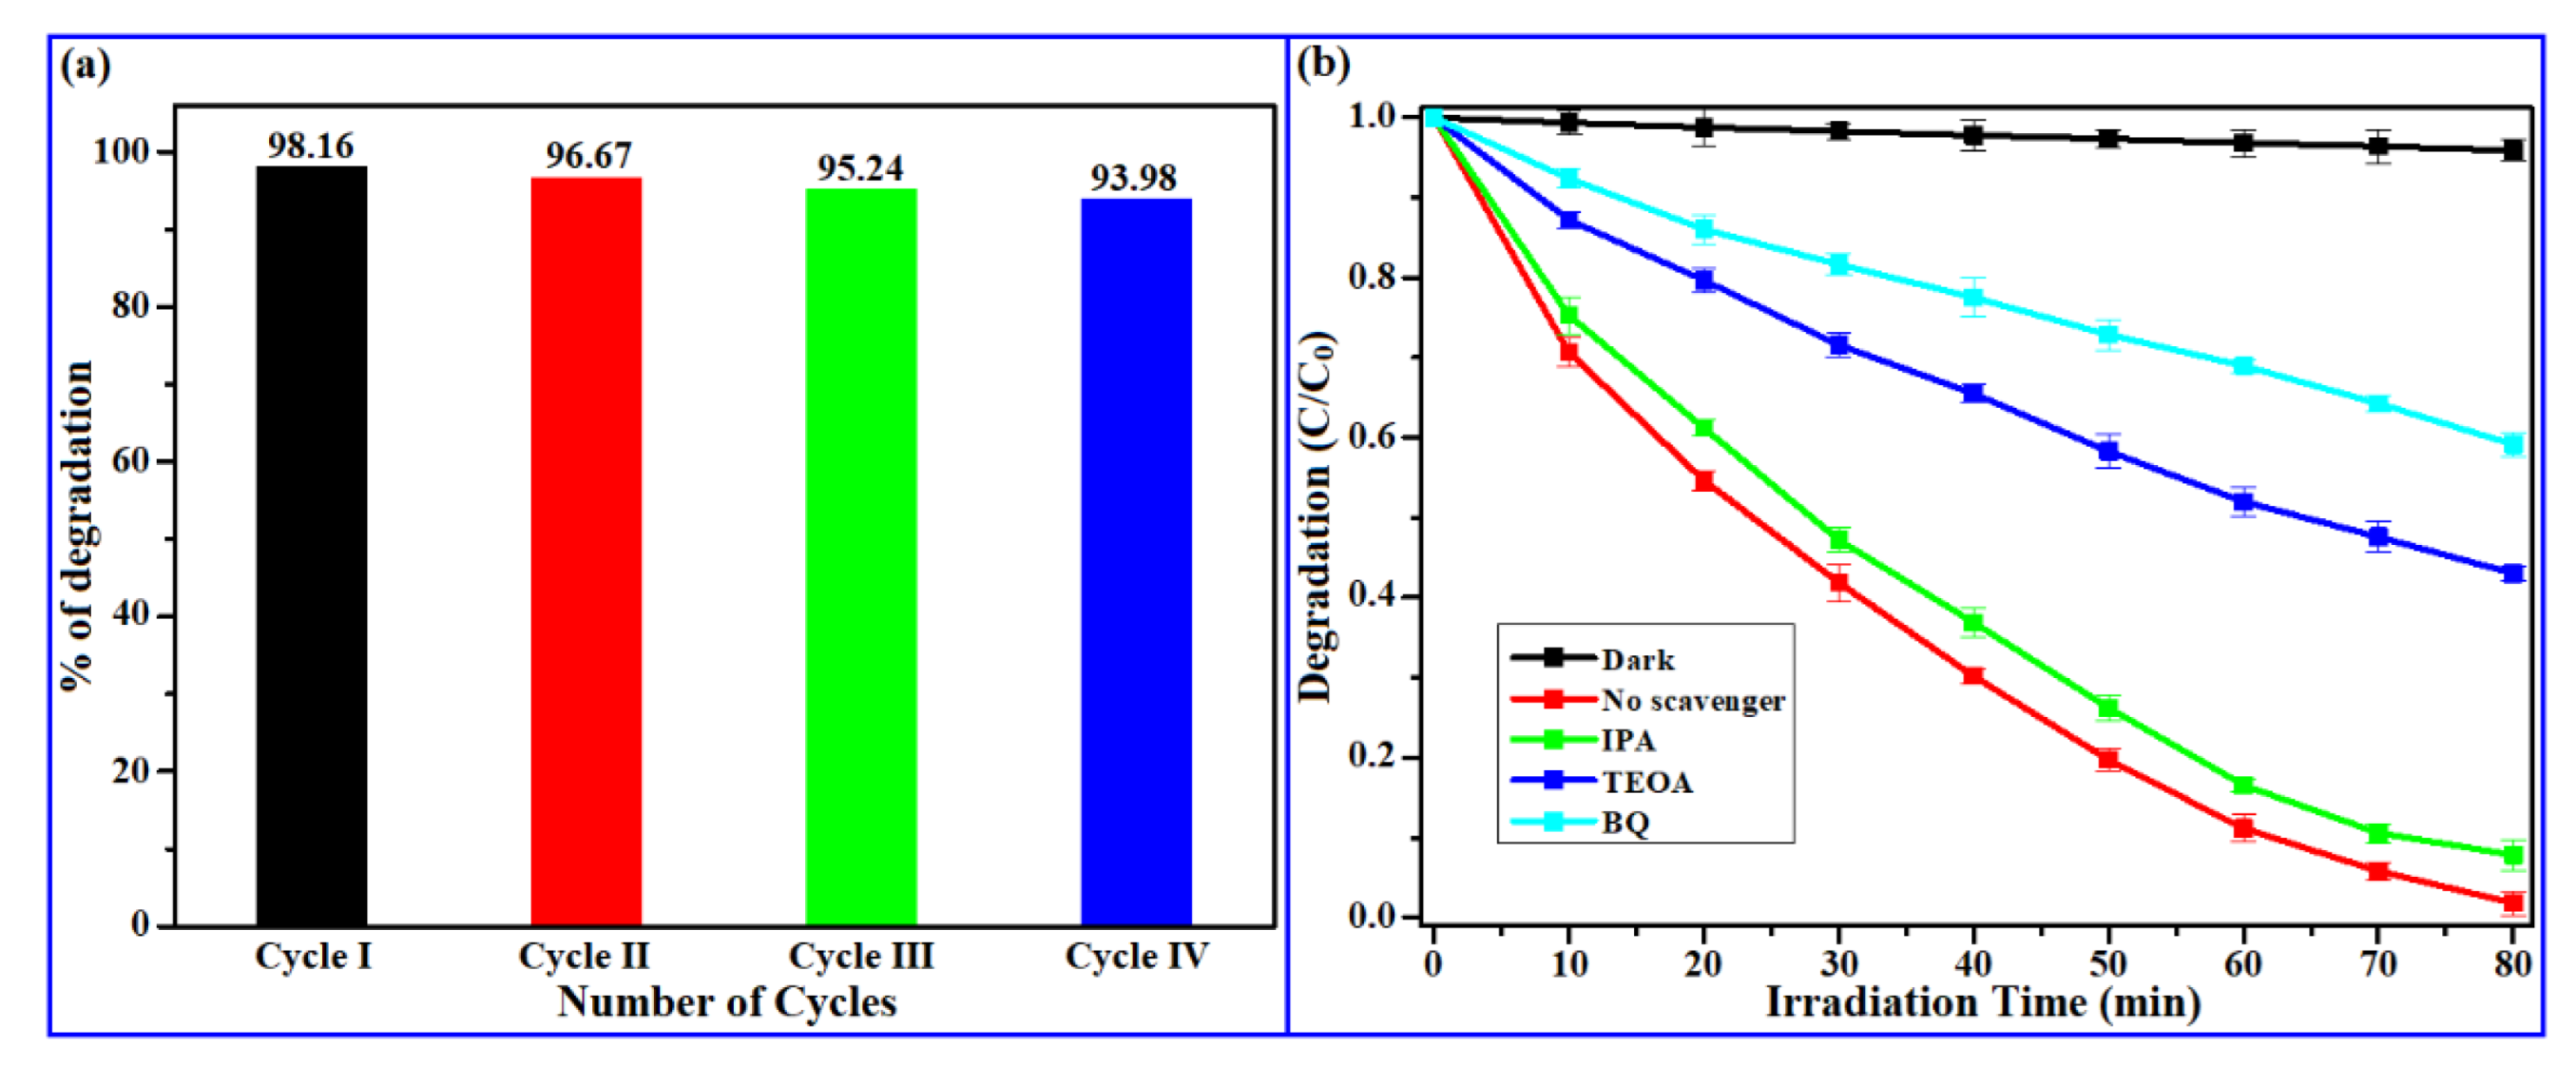
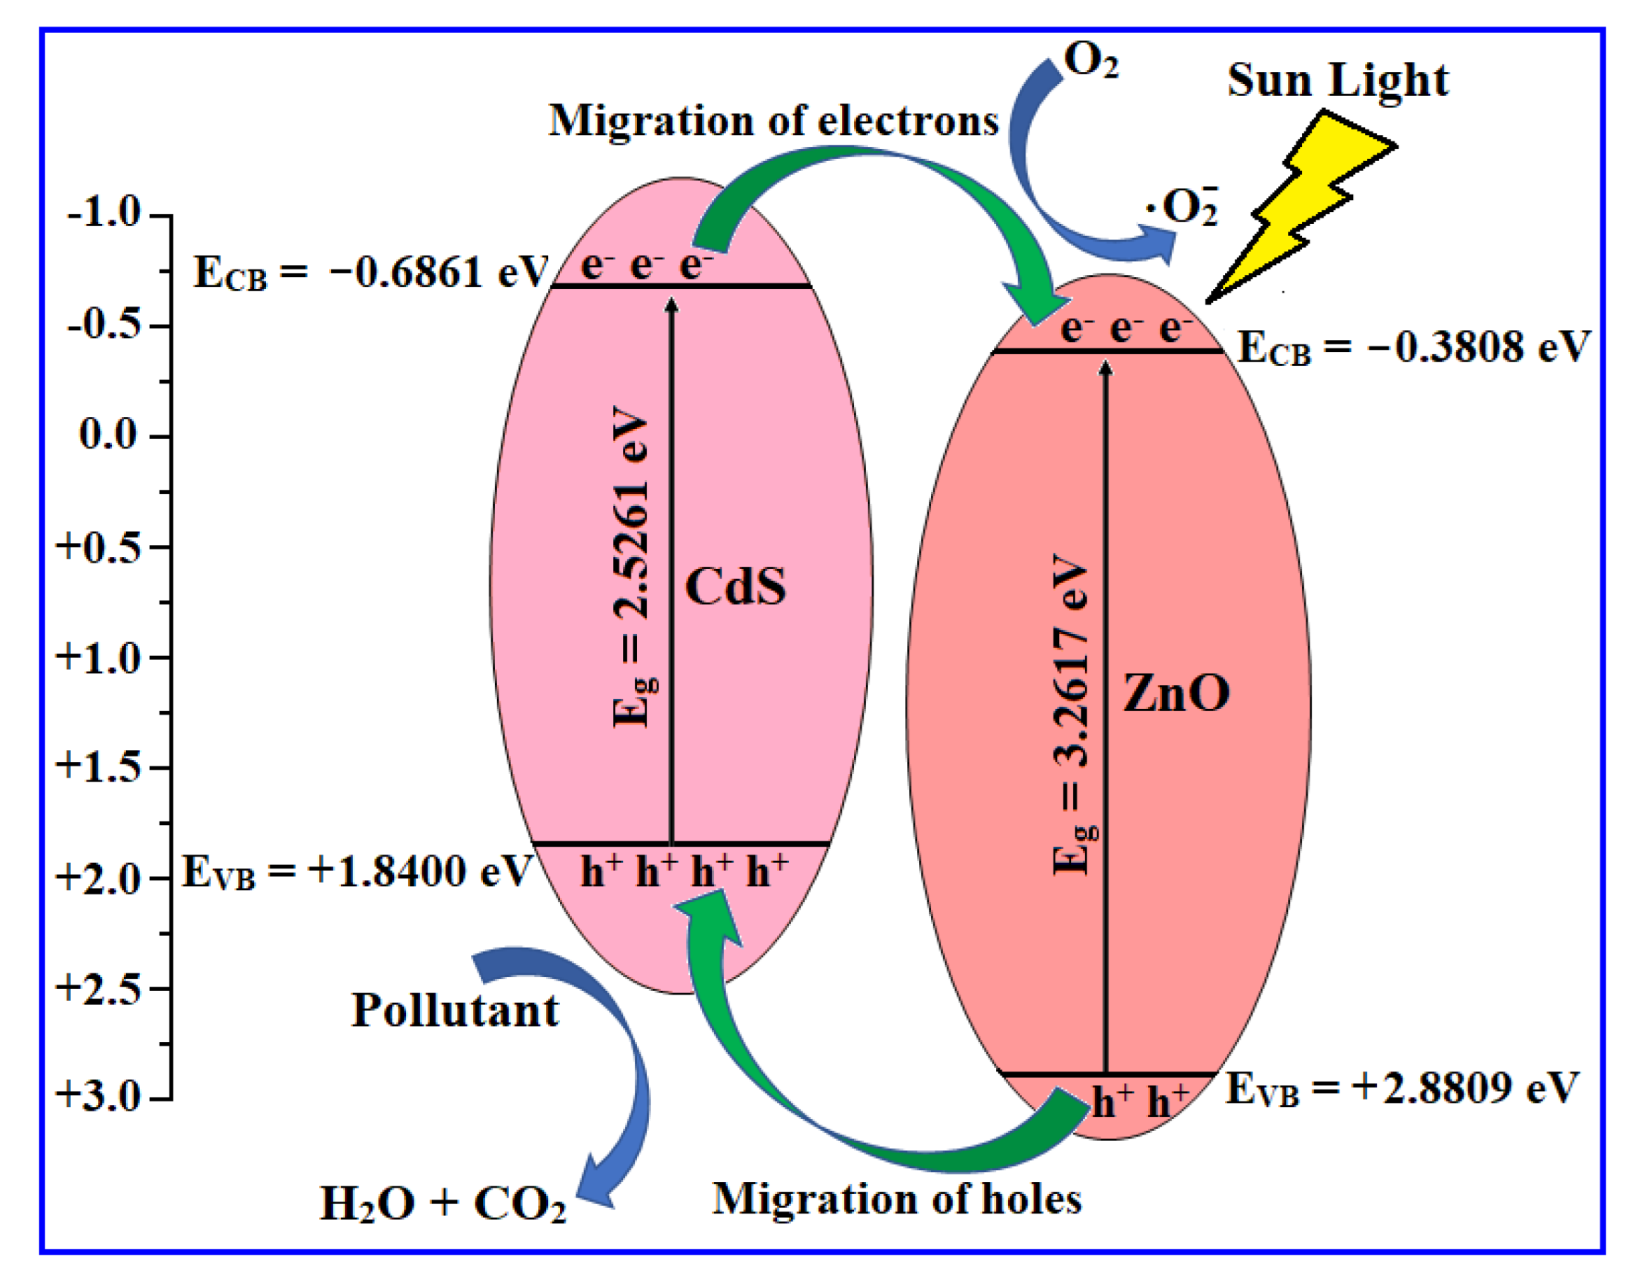
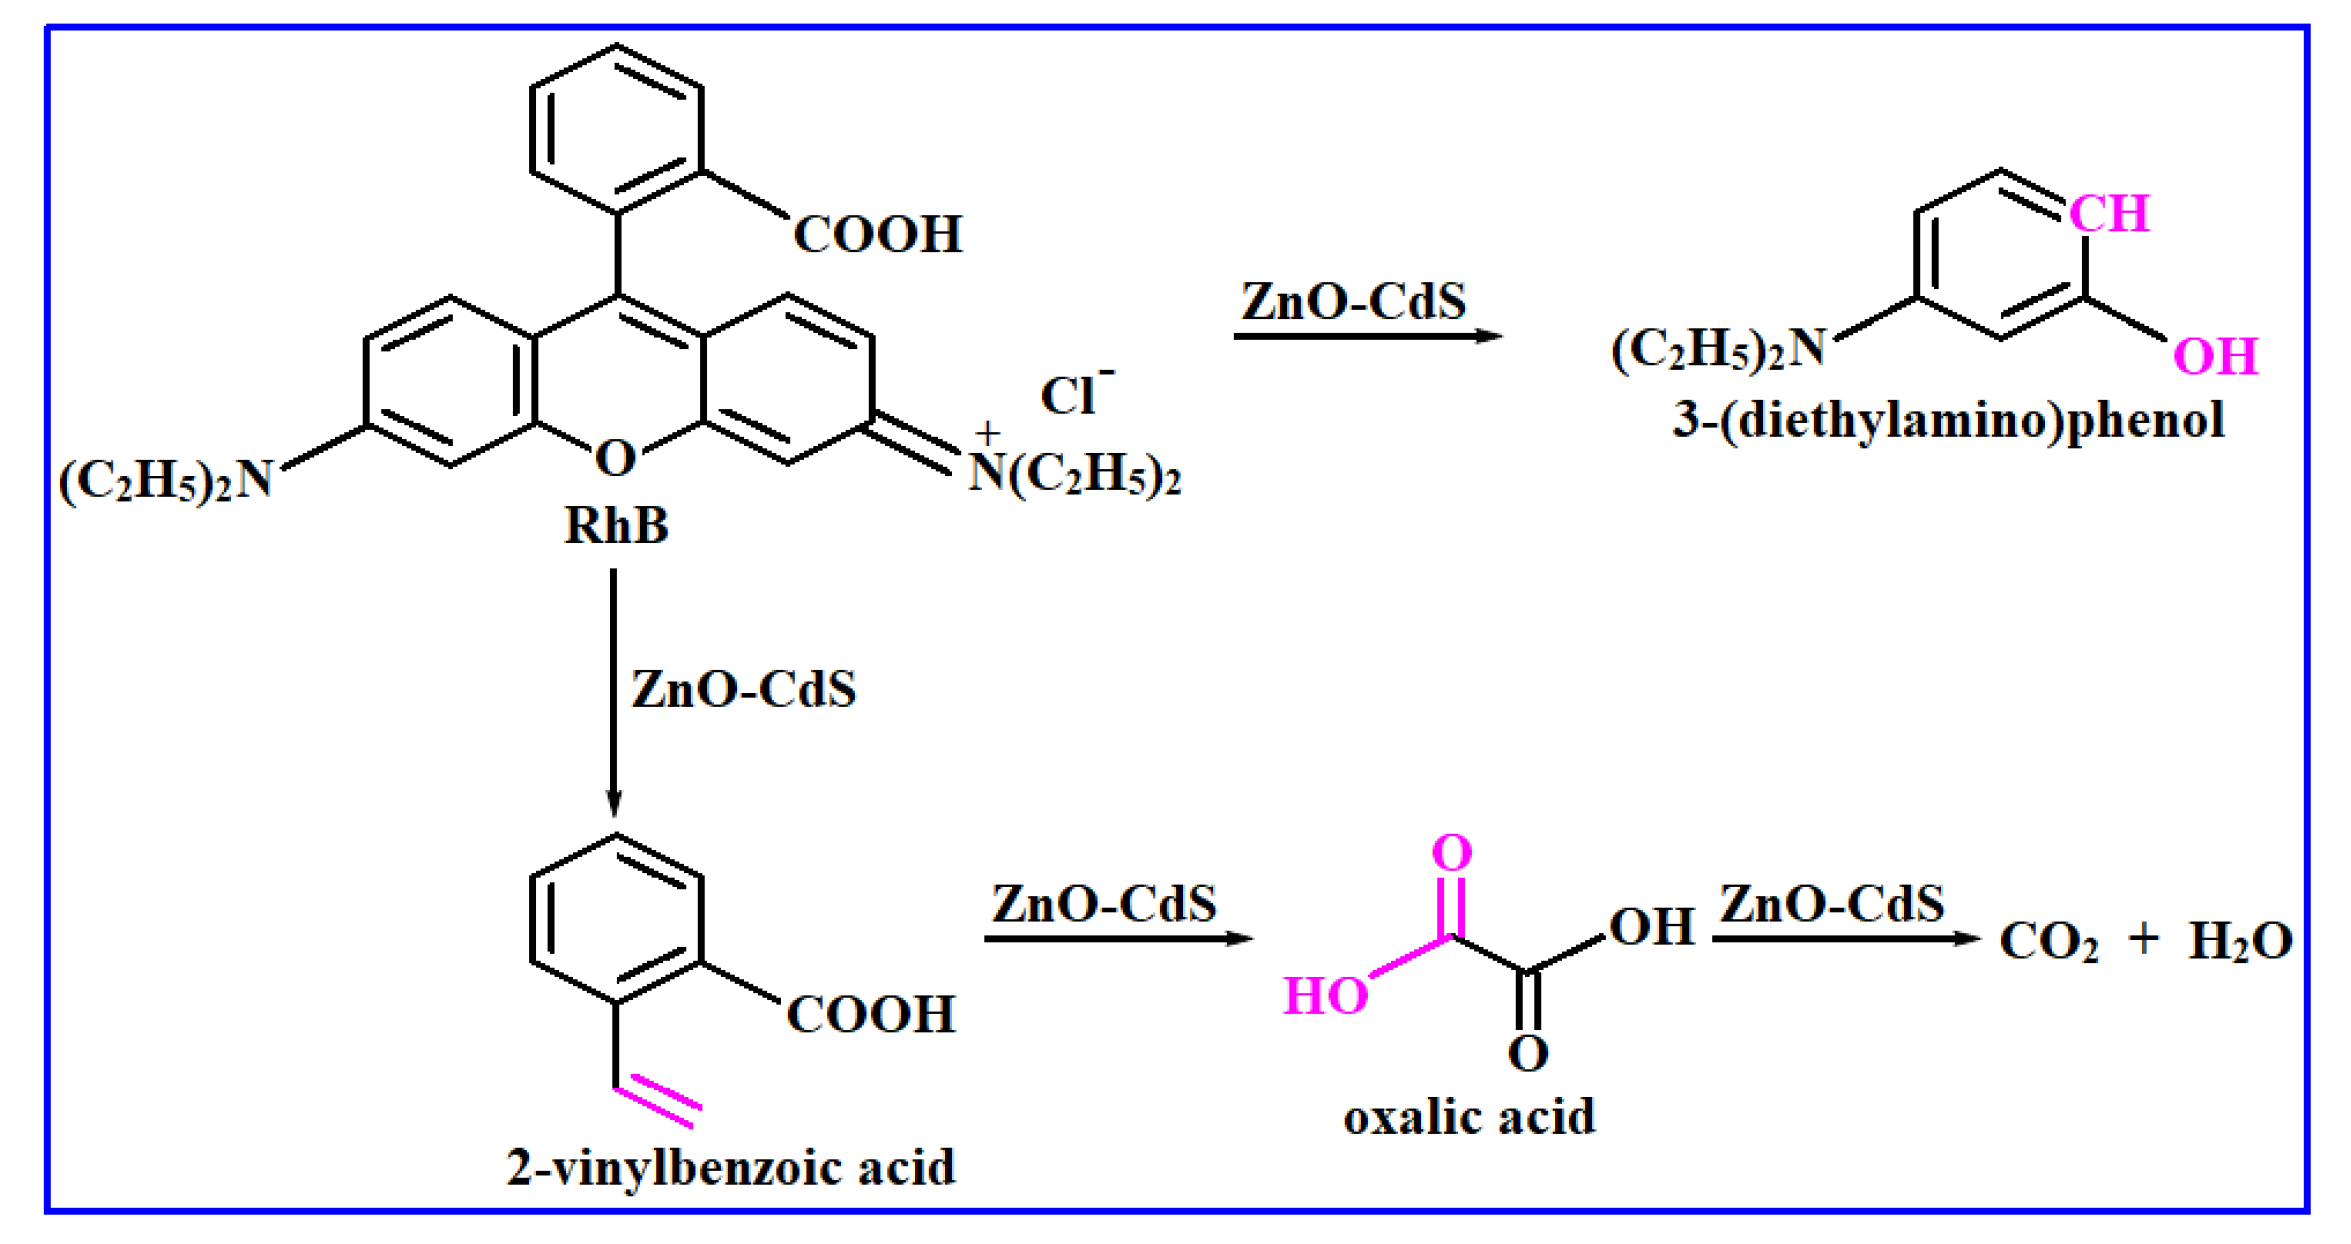
3.5. Photocatalytic Activity

The photocatalytic activity of RhB dye is employed to study the synergic effect of synthesized ZnO NPs, CdS NPs, and ZnO–CdS NCs. Figure 7a shows the variation in concentration of RhB dye. As shown in Figure 7b, the photodegradation efficiency of blank, ZnO NPs, CdS NPs, and ZnO–CdS NCs is 4.09, 19.29, 30.18, and 98.16%, respectively. Among all the photocatalysts, ZnO–CdS NCs achieved superior photocatalytic degradation efficiency. For thorough evaluation of photocatalytic activity, a pseudo-first-order kinetic model was utilized to apt the photodegradation data using the equation ln (C0/C) = kt [24]. Figure 7c illustrates the linear fitting curve of ln(C0/C) vs. t for RhB dye degradation using ZnO NPs, CdS NPs, and ZnO–CdS NCs. The linear fitting correlation of pristine ZnO NPs, and CdS NPs photodegradation is too small, which might be attributable to its poorer catalytic ability, as seen by the lowest rate constant k values. Figure 7d depicts the kinetics rate constant of the synthesized samples. Noticeably, among the all-synthesized materials, the ZnO–CdS NCs had the greatest photocatalytic activity, which is 5.09 and 3.25 times of pure ZnO NPs, and CdS NPs, respectively.
The outstanding photocatalytic activity of ZnO–CdS NCs could be ascribed to (i) the separation and transformation of the photoinduced e/h+ couples, (ii) unique heterostructure of CdS-NPs-decorated ZnO NPs, and formation of strong interfaces at contact region. The recent reports reveal that the photocatalytic dye degradation efficiency of ZnO–CdS NCs was improved when compared to the bare ZnO NPs and CdS NPs. The comparative analyses of photocatalytic efficiency of ZnO–CdS NCs with contemporary results are presented in Table 2.
Reusability of photocatalytic material is a critical criterion for assessing catalytic efficiency. The ZnO–CdS NCs photocatalyst was washed and reused for four cycles in a row, with the photocatalytic activity of RhB dye for every cycle shown in Figure 8a. The ZnO–CdS NCs catalyst showed a minor decrease in RhB dye activity rather than having a considerable negative impact on catalytic activity. After the fourth cycle, the degradation efficiency of RhB dye fell by 4.18%, indicating that the ZnO–CdS NCs are stable and reusable for photodegradation of RhB dye.
Scavenger experiments were conducted to identify the main reactive species formed during the photocatalytic degradation of RhB over the ZnO–CdS NCs, and the results are presented in Figure 8b. Triethanolamine (TEOA), isopropyl alcohol (IPA), and benzoquinone (BQ) were selected as scavengers used to trap holes (h+), hydroxyl (•OH), and superoxide (•O2) radicals, respectively. Figure 8b show that when IPA was added to the solution, a slight decrease was observed in the photodegradation efficiency of RhB, indicating that •OH species did not play a major role in the photocatalytic process. Furthermore, when BQ and TEOA were introduced into the solution, a remarkable decrease in the photocatalytic efficiency toward RhB was observed. The experimental results show that •O2 radicals and photogenerated holes play leading roles during the degradation of RhB dye.
The photocatalytic reaction mechanism explains the role of free radicals during the dye degradation process under solar light. Figure 9 displays the proposed photodegradation mechanism of RhB dye using ZnO–CdS NCs. In current study, the energy bandgap of ZnO NPs, CdS NPs, and ZnO–CdS NCs are evaluated as 3.26, 2.52, and 2.98 eV, respectively. When ZnO–CdS NCs were exposed to solar light during the photodegradation, the photoinduced electrons (e) and holes (h+) would be diffused from the conduction band (CB) of CdS NPs to CB of ZnO NPs, and from the valance band (VB) of ZnO NPs to the VB of CdS NPs, due to the difference in the fermi energy-level position, respectively.
Meanwhile, the values of ECB and EVB of CdS NPs were found to be −0.6861 and +1.84 eV, respectively. For ZnO NPs, the ECB and EVB values were found to be −0.3808 and +2.8809 eV, respectively. The proposed mechanism for photodegradation of RhB dye under solar light using ZnO–CdS NCs is presented below:
ZnO–CdS (catalyst) + hυ (solar light) → ZnO(e) + CdS(h+)
ZnO(e) + O2 → •O2
•O2 + RhB dye → Degradation products
CdS(h+) + RhB dye → Degradation products
In the photodegradation process, the entrenched e on ZnO NPs surface might combine with the oxygen (O2) molecule to generate • O 2 . Subsequently, direct oxidation may exist because of the high oxidative potential of the holes present in the proposed photocatalyst. The produced • O 2 species and holes may oxidize the RhB molecules, resulting in improved photocatalytic activity. The proposed RhB degradation pathway in the presence of ZnO–CdS NCs is depicted in Figure 10. RhB’s initial cleavage of the C–C and C–O bond gives the 3-(diethylamino)phenol in one of the pathways. In another pathway, it cleaves the C–C bond to produce 2-vinylbenzoic acid, which further produces oxalic acid, CO2, and H2O in the presence of ZnO–CdS NCs photocatalyst.

4. Conclusions

In summary, ZnO NPs, CdS NPs, and ZnO–CdS NCs are prepared by a simple chemical precipitation route and examined by a series of characterization techniques. The structural analysis demonstrated that the ZnO–CdS NCs exhibited a mixed phase for both hexagonal ZnO NPs, and CdS NPs with average crystallite size of 27 nm. Furthermore, the morphological studies reveal that ZnO NPs exhibited irregular and spherical-like structures, whereas CdS NPs only exhibit spherical-like structures. Optical absorption spectra confirm that the bandgap energy of ZnO–CdS NCs is well tuned by the decoration of CdS NPs on ZnO NPs surface. The suppressed PL intensity of ZnO–CdS NCs indicating that the reduction in recombination rate of photoinduced e/h+ pairs resulted in enhanced photocatalytic activity. Under solar light, the ZnO–CdS NCs displayed a photodegradation efficiency of 98.16% towards RhB dye, which is 5.09 and 3.25 times that of pure ZnO NPs and CdS NPs, respectively. After four trials, the structural stability of ZnO–CdS NCs was verified.

Author Contributions

Conceptualization, methodology and writing—original draft preparation: T.R.G.; supervision and review: R.V.S.S.N.R.; formal analysis and review: R.K. All authors have read and agreed to the published version of the manuscript.

Funding

This research received no external funding.

Data Availability Statement

Not applicable.

Acknowledgments

One of the authors, Thirumala Rao Gurugubelli, wishes to express his gratitude to the GMRIT management for providing financial assistance through the SEED grant for the research.

Conflicts of Interest

The authors have no conflict of interest to declare that are relevant to the content of this article.

References

  1. Bai, L.; Li, S.; Ding, Z.; Wang, X. Wet chemical synthesis of CdS/ZnO nanoparticle/nanorod hetero-structure for enhanced visible light disposal of Cr(VI) and methylene blue. Colloids Surf. A 2020, 607, 125489. [Google Scholar] [CrossRef]
  2. Lee, K.M.; Lai, C.W.; Ngai, K.S.; Juan, J.C. Recent developments of zinc oxide based photocatalyst in water treatment technology: A review. Water Res. 2016, 48, 428. [Google Scholar] [CrossRef] [PubMed]
  3. Ong, C.B.; Ng, L.Y.; Mohammad, A.W. A review of ZnO nanoparticles as solar photocatalysts: Synthesis, mechanisms and applications. Renew. Sustain. Energy Rev. 2018, 81, 536. [Google Scholar] [CrossRef]
  4. Li, C.; Chen, S.; Gao, X.; Zhang, W.; Wang, Y. Fabrication, characterization and photoelectrochemical properties of CdS/CdSe nanofilm co-sensitized ZnO nanorod arrays on Zn foil substrate. J. Colloid Interface Sci. 2021, 588, 269. [Google Scholar] [CrossRef]
  5. Wang, M.; Jiang, J.; Liu, G.; Shi, J.; Guo, L. Controllable synthesis of double layered tubular CdSe/ZnO arrays and their photoelectrochemical performance for hydrogen production. Appl. Catal. B Environ. 2013, 304, 138–139. [Google Scholar] [CrossRef]
  6. Nie, Q.; Yang, L.; Cao, C.; Zeng, Y.; Wang, G.; Wang, C.; Lin, S. Interface optimization of ZnO nanorod/CdS quantum dots heterostructure by a facile two-step low temperature thermal treatment for improved photoelectrochemical water splitting. Chem. Eng. J. 2017, 325, 151. [Google Scholar] [CrossRef]
  7. Wang, R.; Chen, S.; Ng, Y.H.; Gao, Q.; Yang, S.; Zhang, S.; Peng, F.; Fang, Y.; Zhang, S. ZnO/CdS/PbS nanotube arrays with multi-heterojunctions for efficient visible-light-driven photoelectrochemical hydrogen evolution. Chem. Eng. J. 2019, 362, 658. [Google Scholar] [CrossRef]
  8. Seol, M.; Jang, J.; Cho, S.; Lee, J.S.; Yong, K. Highly efficient and stable cadmium chalcogenide quantum dot/ZnO nanowires for photoelectrochemical hydrogen generation. Chem. Mater. 2013, 25, 184. [Google Scholar] [CrossRef]
  9. Altaf, C.T.; Faraji, M.; Kumtepe, A.; Abdullayeva, N.; Yilmaz, N.; Karagoz, E.; Bozbey, A.; Kurt, H.; Sankir, M.; Sankir, N.D. Highly efficient 3D-ZnO nanosheet photoelectrodes for solar-driven water splitting: Chalcogenide nanoparticle sensitization and mathematical modeling. J. Alloys Compd. 2020, 828, 154472. [Google Scholar] [CrossRef]
  10. Dai, B.; Fang, J.; Yu, Y.; Sun, M.; Huang, H.; Lu, C.; Kou, J.; Zhao, Y.; Xu, Z. Construction of Infrared-Light-Responsive Photoinduced Carriers Driver for Enhanced Photocatalytic Hydrogen Evolution. Adv. Mater. 2020, 32, 1906361. [Google Scholar] [CrossRef]
  11. Qiu, Y.; Pan, Z.; Chen, H.; Ye, D.; Guo, L.; Fan, Z.; Yang, S. Current progress in developing metal oxide nanoarrays-based photoanodes for photoelectrochemical water splitting. Sci. Bull. 2019, 64, 1348. [Google Scholar] [CrossRef] [Green Version]
  12. Zhang, L.; Zhang, L.; Chen, Y.; Zheng, Y.; Wang, Y. CdS/ZnO: A multi-pronged approach for efficient reduction of carbon dioxide under visible light irradiation. ACS Sustain. Chem. Eng. 2020, 8, 5270. [Google Scholar] [CrossRef]
  13. Sun, G.; Xiao, B.; Zheng, H.; Shi, J.; Mao, S.; He, C.; Li, Z.; Cheng, Y. Ascorbic acid functionalized CdS–ZnO core–shell nanorods with hydrogen spillover for greatly enhanced photocatalytic H2 evolution and outstanding photostability. J. Mater. Chem. A 2021, 9, 9735. [Google Scholar] [CrossRef]
  14. Senasu, T.; Chankhanittha, T.; Hemavibool, K.; Nanan, S. Visible-light-responsive photocatalyst based on ZnO/CdS nanocomposite for photodegradation of reactive red azo dye and ofloxacin antibiotic. Mater. Sci. Semicond. Process. 2021, 123, 105558. [Google Scholar] [CrossRef]
  15. Rao, G.T.; Ravikumar, R.V.S.S.N.; Reddy, N.B.; Zyryanov, G.V. Investigation on synthesis, structural and optical properties of CdS nanoparticles. AIP Conf. Proc. 2020, 2280, 040038. [Google Scholar]
  16. Rao, G.T.; Babu, B.; Stella, R.J.; Manjari, V.P.; Ravikumar, R.V.S.S.N. Spectral investigations on undoped and Cu2+ doped ZnO–CdS composite nanopowders. Spectrochim. Acta A 2015, 139, 86. [Google Scholar]
  17. Aswani, T.; Babu, B.; Manjari, V.P.; Stella, R.J.; Rao, G.T.; Krishna, C.R.; Ravikumar, R.V.S.S.N. Synthesis and spectral characterizations of trivalent ions (Cr3+, Fe3+) doped CdO nanopowders. Spectrochim. Acta A 2014, 121, 544. [Google Scholar] [CrossRef]
  18. Rao, G.T.; Stella, R.J.; Babu, B.; Ravindranadh, K.; Reddy, C.V.; Shim, J.; Ravikumar, R.V.S.S.N. Structural, optical and magnetic properties of Mn2+ doped ZnO-CdS composite nanopowder. Mater. Sci. Eng. B 2015, 201, 72. [Google Scholar] [CrossRef]
  19. Mo, Z.; Huang, Y.; Lu, S.; Fu, Y.; Shen, X.; He, H. Growth of ZnO nanowires and their applications for CdS quantum dots sensitized solar cells. Optik 2017, 149, 63. [Google Scholar] [CrossRef]
  20. Gurugubelli, T.R.; Ravikumar, R.V.S.S.N.; Koutavarapu, R. Structural, optical, and luminescence properties of Ni2+-doped ZnO–CdS nanocomposite: Synthesis and investigations for green light emission. Chem. Pap. 2022, 76, 557. [Google Scholar] [CrossRef]
  21. Zeng, H.; Cai, W.; Hu, J.; Duan, G.; Liu, P.; Li, Y. Violet photoluminescence from shell layer of Zn/ZnO core-shell nanoparticles induced by laser ablation. Appl. Phys. Lett. 2006, 88, 17191025. [Google Scholar] [CrossRef]
  22. Rao, G.T.; Babu, B.; Stella, R.J.; Manjari, V.P.; Reddy, C.V.; Shim, J.; Ravikumar, R.V.S.S.N. Synthesis and characterization of VO2+ doped ZnO–CdS composite nanopowder. J. Mol. Struc. 2015, 1081, 254. [Google Scholar]
  23. Rao, G.T.; Ravikumar, R.V.S.S.N. Novel Fe-doped ZnO-CdS nanocomposite with enhanced visible light-driven photocatalytic performance. Mater. Res. Innov. 2021, 25, 215. [Google Scholar] [CrossRef]
  24. Ravindranadh, K.; Tamtam, M.R.; Lee, S.G.; Rao, M.C.; Lee, D.Y.; Shim, J. Synthesis of 2D NiFe2O4 nanoplates/2D Bi2WO6 nanoflakes heterostructure: An enhanced Z-scheme charge transfer and separation for visible-light-driven photocatalytic degradation of toxic pollutants. J. Environ. Chem. Eng. 2021, 9, 105893. [Google Scholar]
  25. Zguraa, I.; Preda, N.; Socol, G.; Ghica, C.; Ghica, D.; Enculescu, M.; Negut, I.; Nedelcu, L.; Frunza, L.; Ganea, C.P.; et al. Wet chemical synthesis of ZnO-CdS composites and their photocatalytic Activity. Mater. Res. Bull. 2018, 99, 174. [Google Scholar] [CrossRef]
  26. Velanganni, S.; Pravinraj, S.; Immanuel, P.; Thiruneelakandan, R. Nanostructure CdS/ZnO heterojunction configuration for photocatalytic degradation of Methylene blue. Phys. B Condens. Matter 2018, 534, 56. [Google Scholar] [CrossRef]
  27. Nandi, P.; Das, D. ZnO/CdS/CuS heterostructure: A suitable candidate for applications in visible-light photocatalysis. J. Phy. Chem. Solid 2022, 160, 110344. [Google Scholar] [CrossRef]
  28. Adegoke, K.A.; Iqbal, M.; Louis, H.; Bello, O.S. Synthesis, characterization and application of CdS/ZnO nanorod heterostructure for the photodegradation of Rhodamine B dye. Mater. Sci. Energy Technol. 2019, 2, 329. [Google Scholar] [CrossRef]
Figure 1. X-ray diffraction patterns of (a) ZnO NPs; (b) CdS NPs, and (c) ZnO–CdS NCs.
Catalysts 12 00084 g001
Figure 2. SEM images of (a) ZnO NPs, (b) CdS NPs, and (c) ZnO–CdS NCs.
Catalysts 12 00084 g002
Figure 3. TEM images of (a) ZnO NPs; (b) CdS NPs and (c) ZnO–CdS NCs.
Catalysts 12 00084 g003
Figure 4. EDS patterns of (a) ZnO NPs, (b) CdS NPs, and (c) ZnO–CdS NCs.
Catalysts 12 00084 g004
Figure 5. (a) Optical absorption and (b) Tauc plots of synthesized nanostructures.
Catalysts 12 00084 g005
Figure 6. PL spectra of ZnO NPs, CdS NPs, and ZnO–CdS NCs.
Catalysts 12 00084 g006
Figure 7. (a) Variation in the concentration of RhB over ZnO–CdS NCs, (b) degradation efficiency, (c) kinetics of RhB dye, and (d) rate constant of ZnO NPs, CdS NPs, and ZnO–CdS NCs.
Catalysts 12 00084 g007
Figure 8. (a) Stability and (b) scavenger test of RhB dye using ZnO–CdS NCs under solar light.
Catalysts 12 00084 g008
Figure 9. Photodegradation mechanism of RhB dye using ZnO–CdS NCs under solar light.
Catalysts 12 00084 g009
Figure 10. Degradation pathway of RhB dye using ZnO–CdS NCs under solar light.
Catalysts 12 00084 g010
Table 1. The average crystallite size, microstrain, and lattice parameters of ZnO NPs, CdS NPs, and ZnO–CdS NCs.
SampleCrystallite Size(d) nmMicrostrain (ε) × 10−3Lattice Parameters (a, c) nm
ZnO NPs34.21 1.0103 (0.3250, 0.5211)
CdS NPs18.76 1.8477 (0.4132, 0.6753)
ZnO–CdS NCs26.75 1.2955 (0.3254, 0.5214), (0.4136, 0.6756)
Table 2. Comparative analysis on photocatalytic dye degradation efficiency of ZnO–CdS NCs.
SampleDyeSynthesis
Method
Light SourceIrradiation
Time (min)
Efficiency
(%)
Ref.
ZnO–CdSRhBWet ChemicalUV8090[25]
CdS/ZnOMBSILAR and CBDSolar Light24091[26]
ZnO/CdSRhB, MBLow temp. Aqueous solutionVisible12072.4, 88.5[27]
ZnO/CdS/CuSRhB, MBLow temp. Aqueous solutionVisible12082, 97[27]
ZnO/CdSRR141HydrothermalVisible24080[14]
CdS/ZnOMBWet ChemicalVisible6085[1]
CdS/ZnORhBHydrothermal and PhotochemicalVisible3085[28]
ZnO–CdSRhBChemical PrecipitationSolar Light8098.16[* PW]
* PW—Present work.
Publisher’s Note: MDPI stays neutral with regard to jurisdictional claims in published maps and institutional affiliations.

